
At the Edges of Photosynthetic Metabolic Plasticity—On the Rapidity and Extent of Changes Accompanying Salinity Stress-Induced CAM Photosynthesis Withdrawal

 ,
,  , and
, and 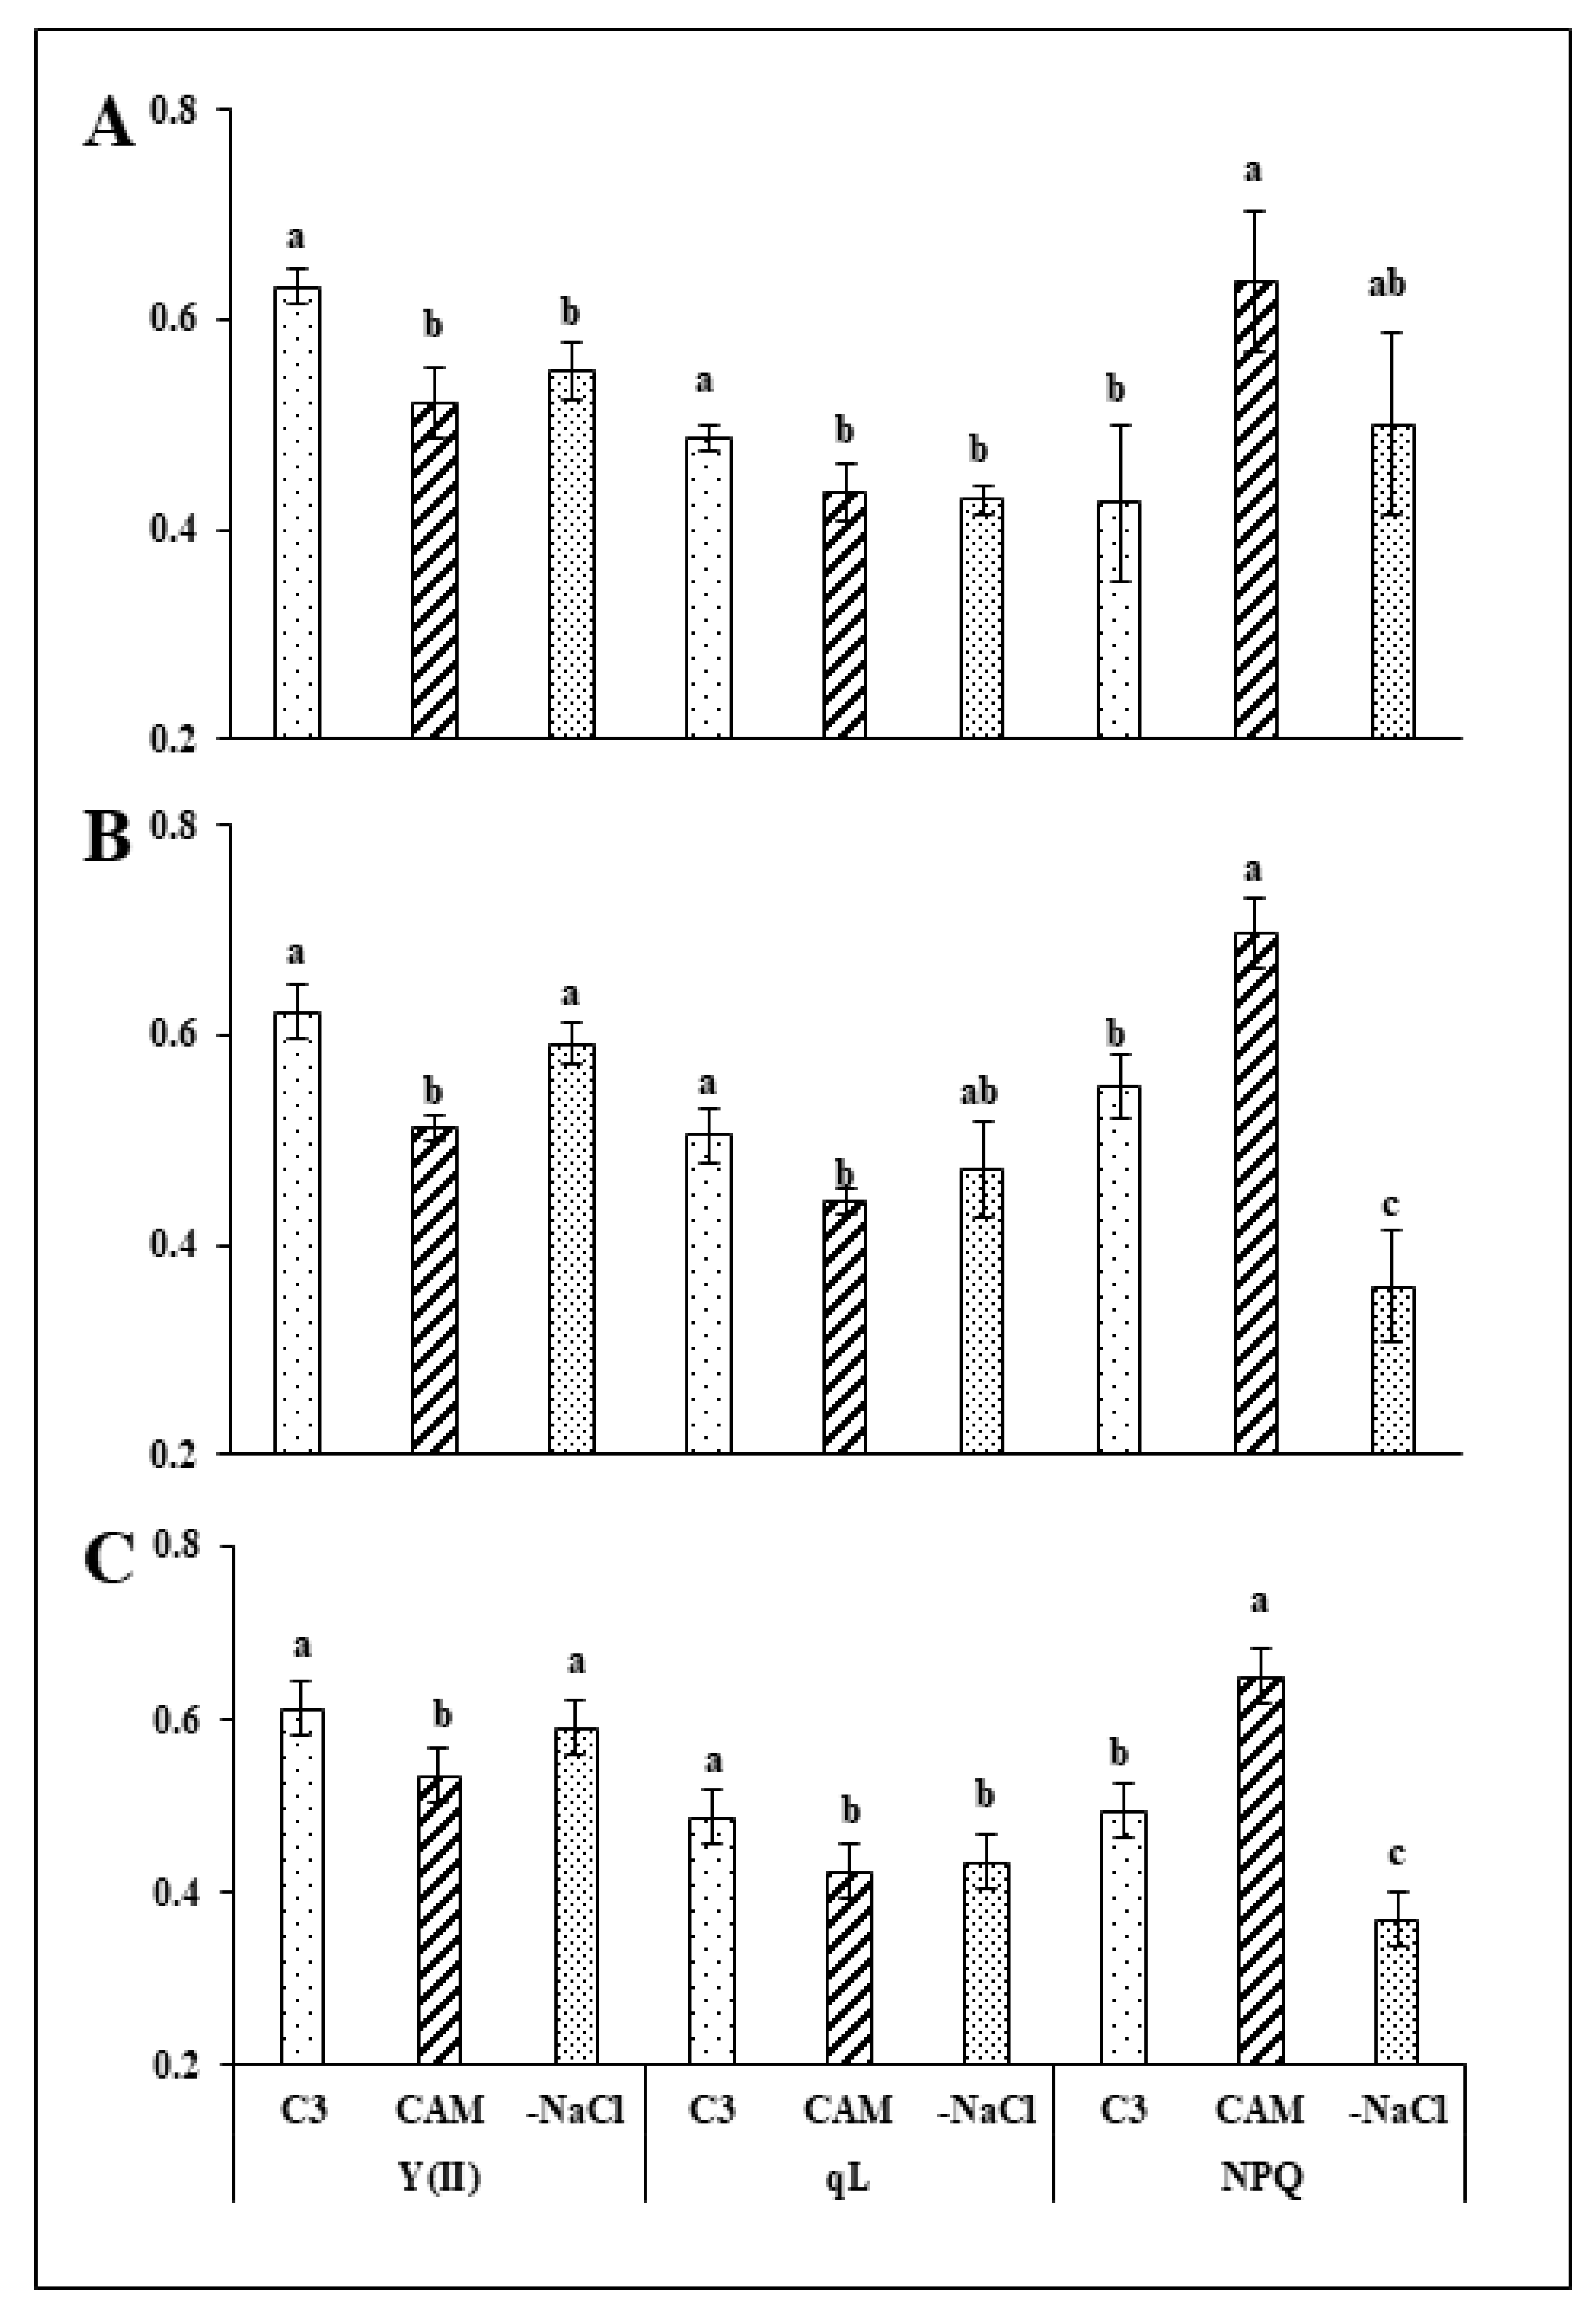
Abstract
:1. Introduction
2. Results
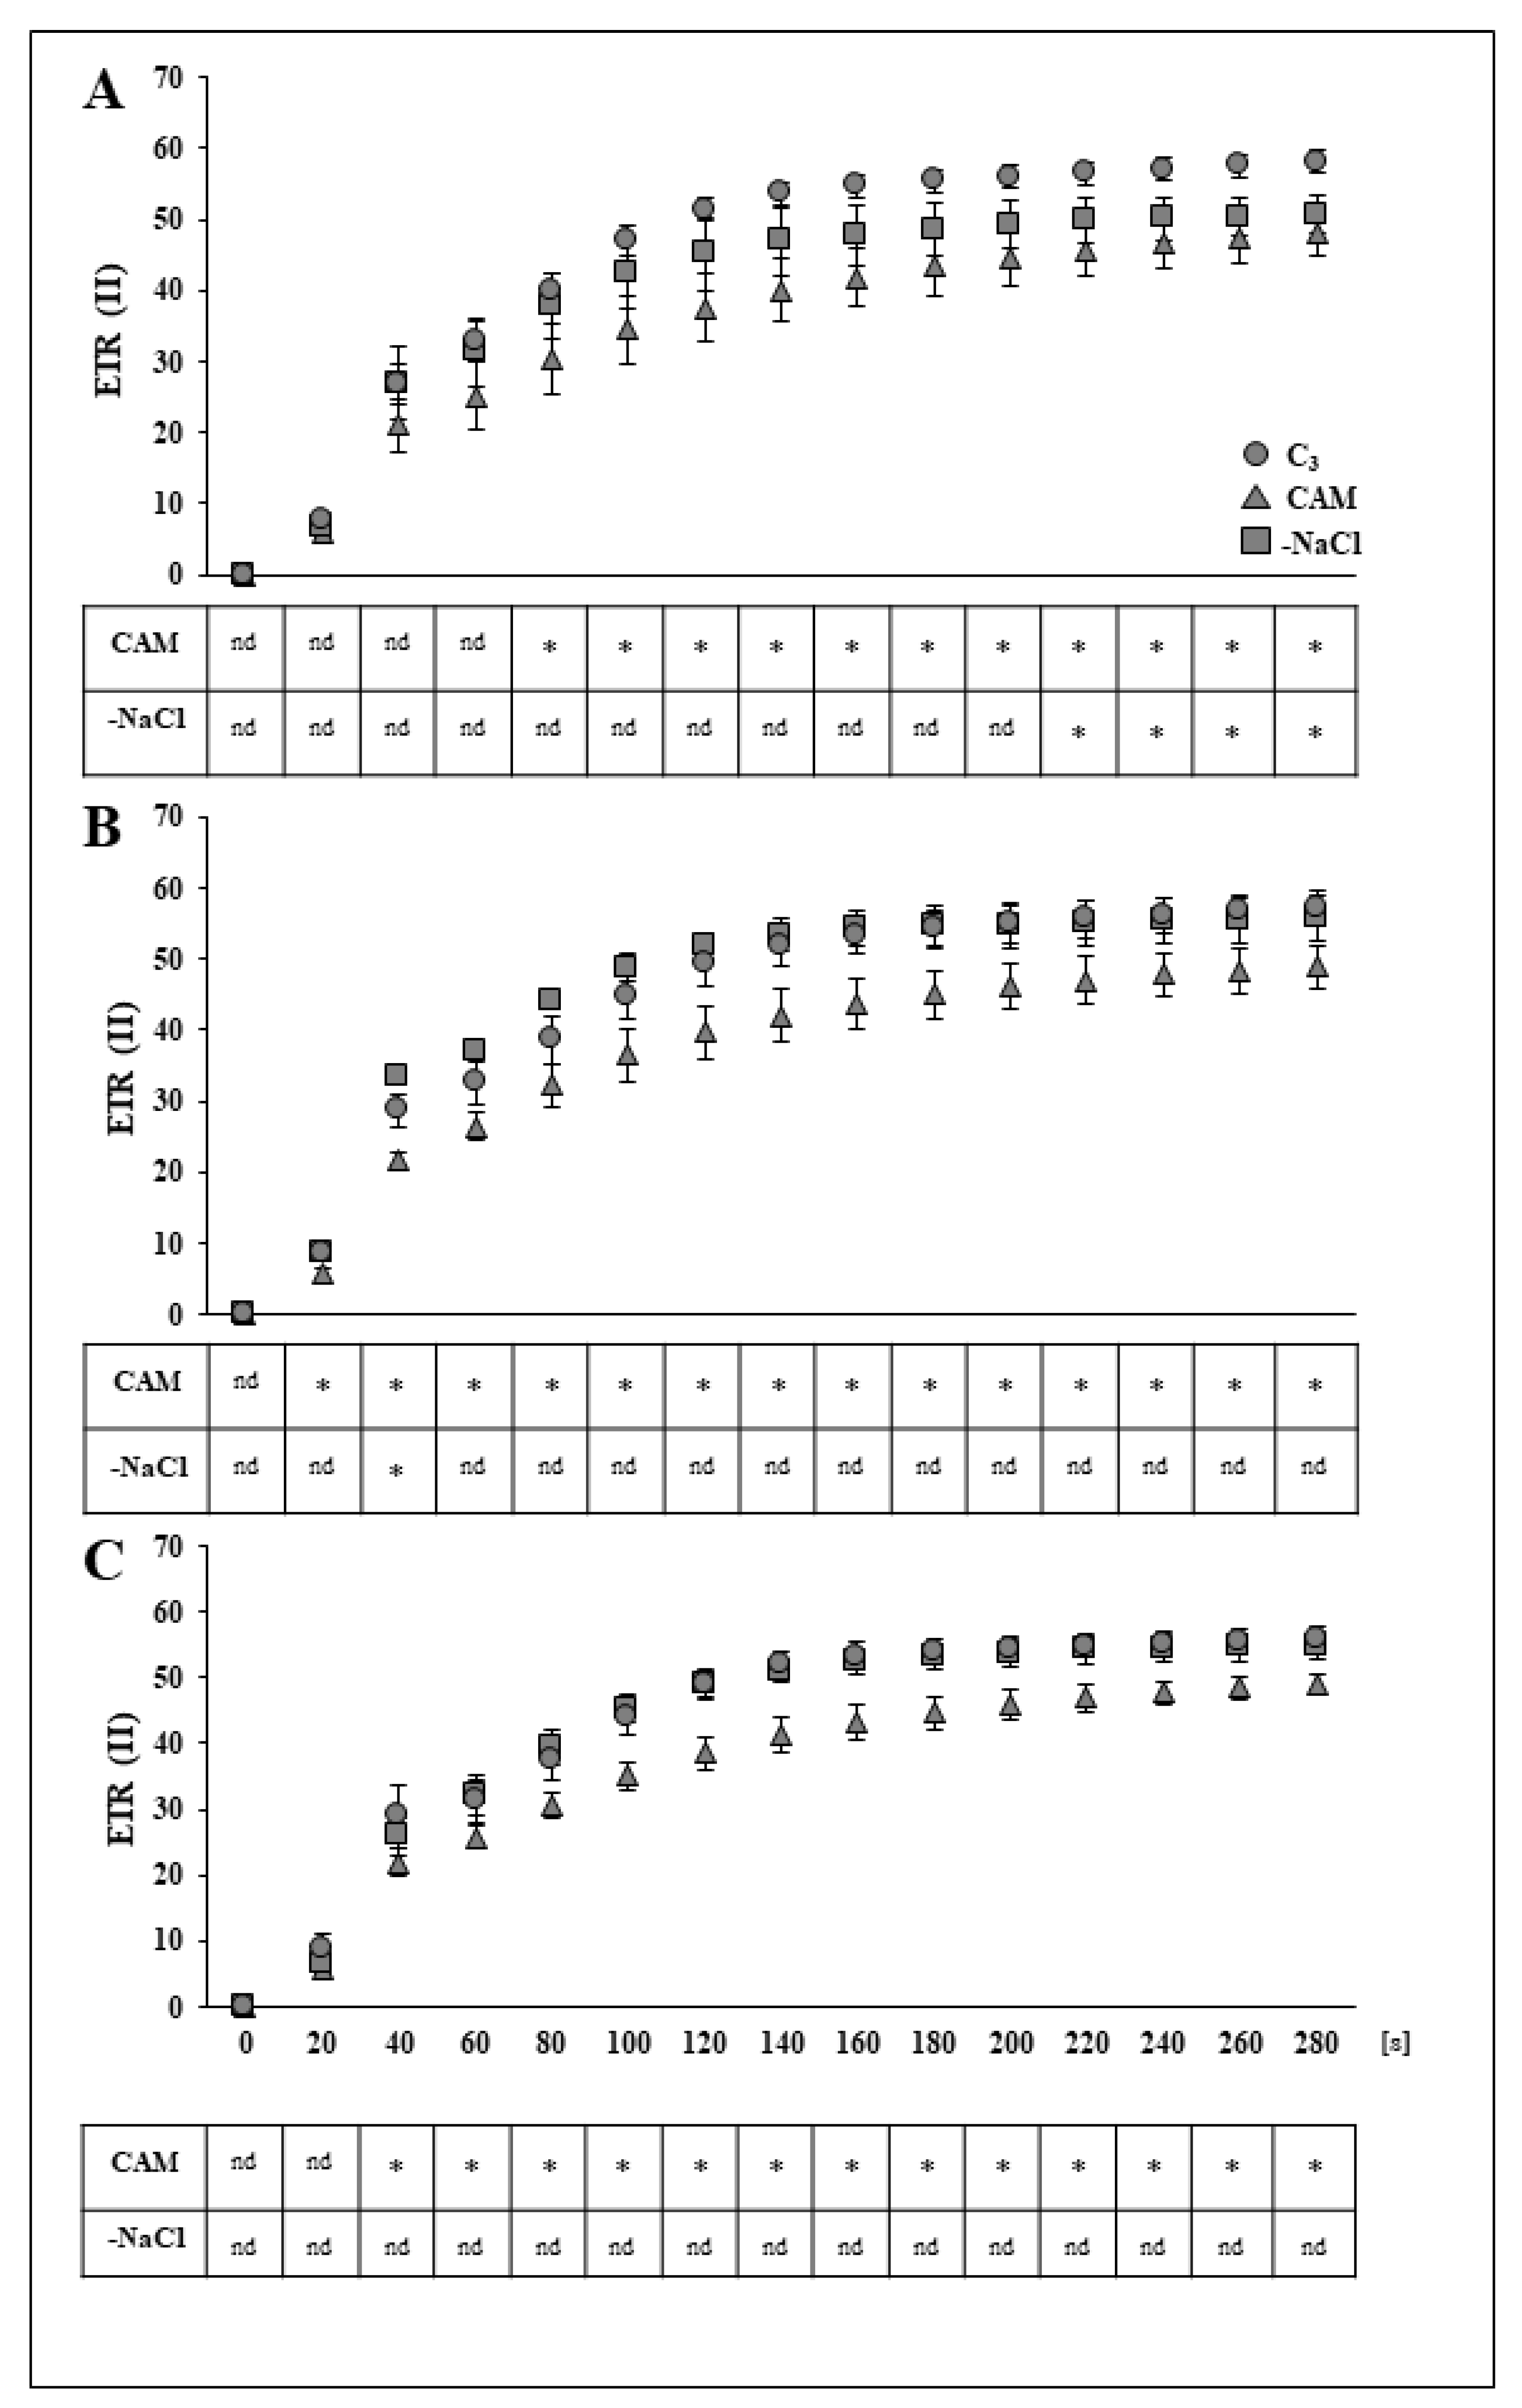
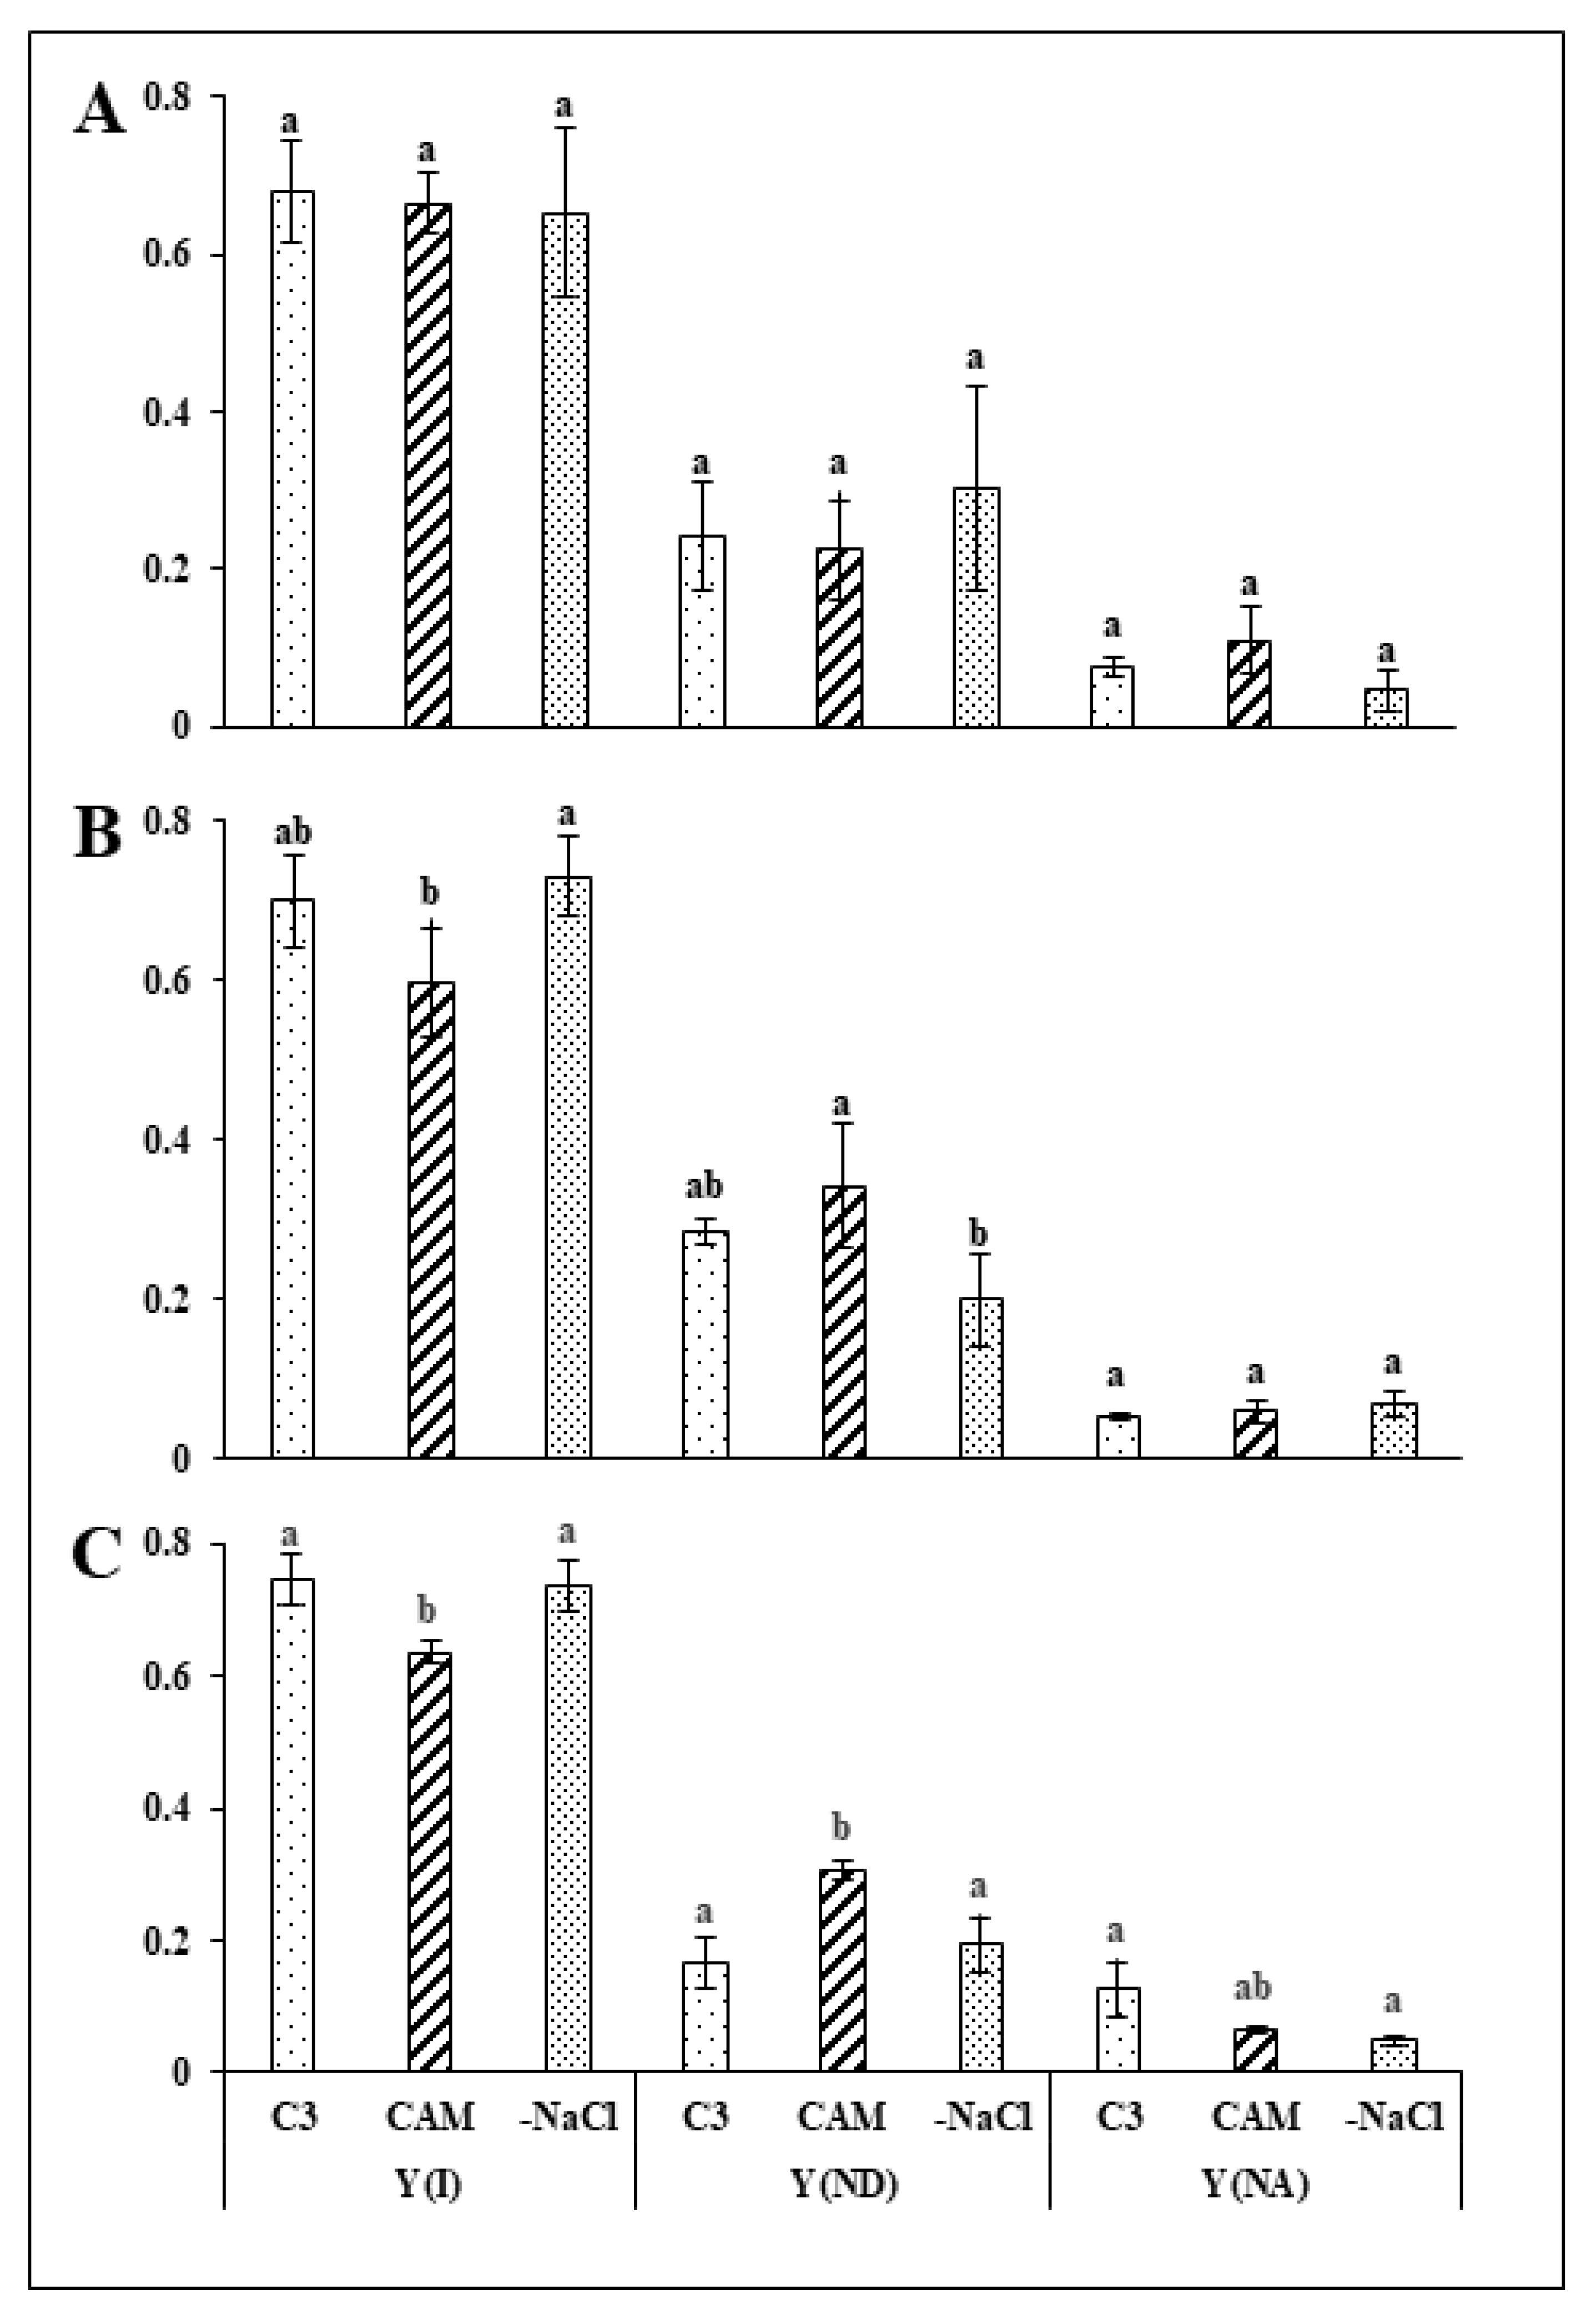
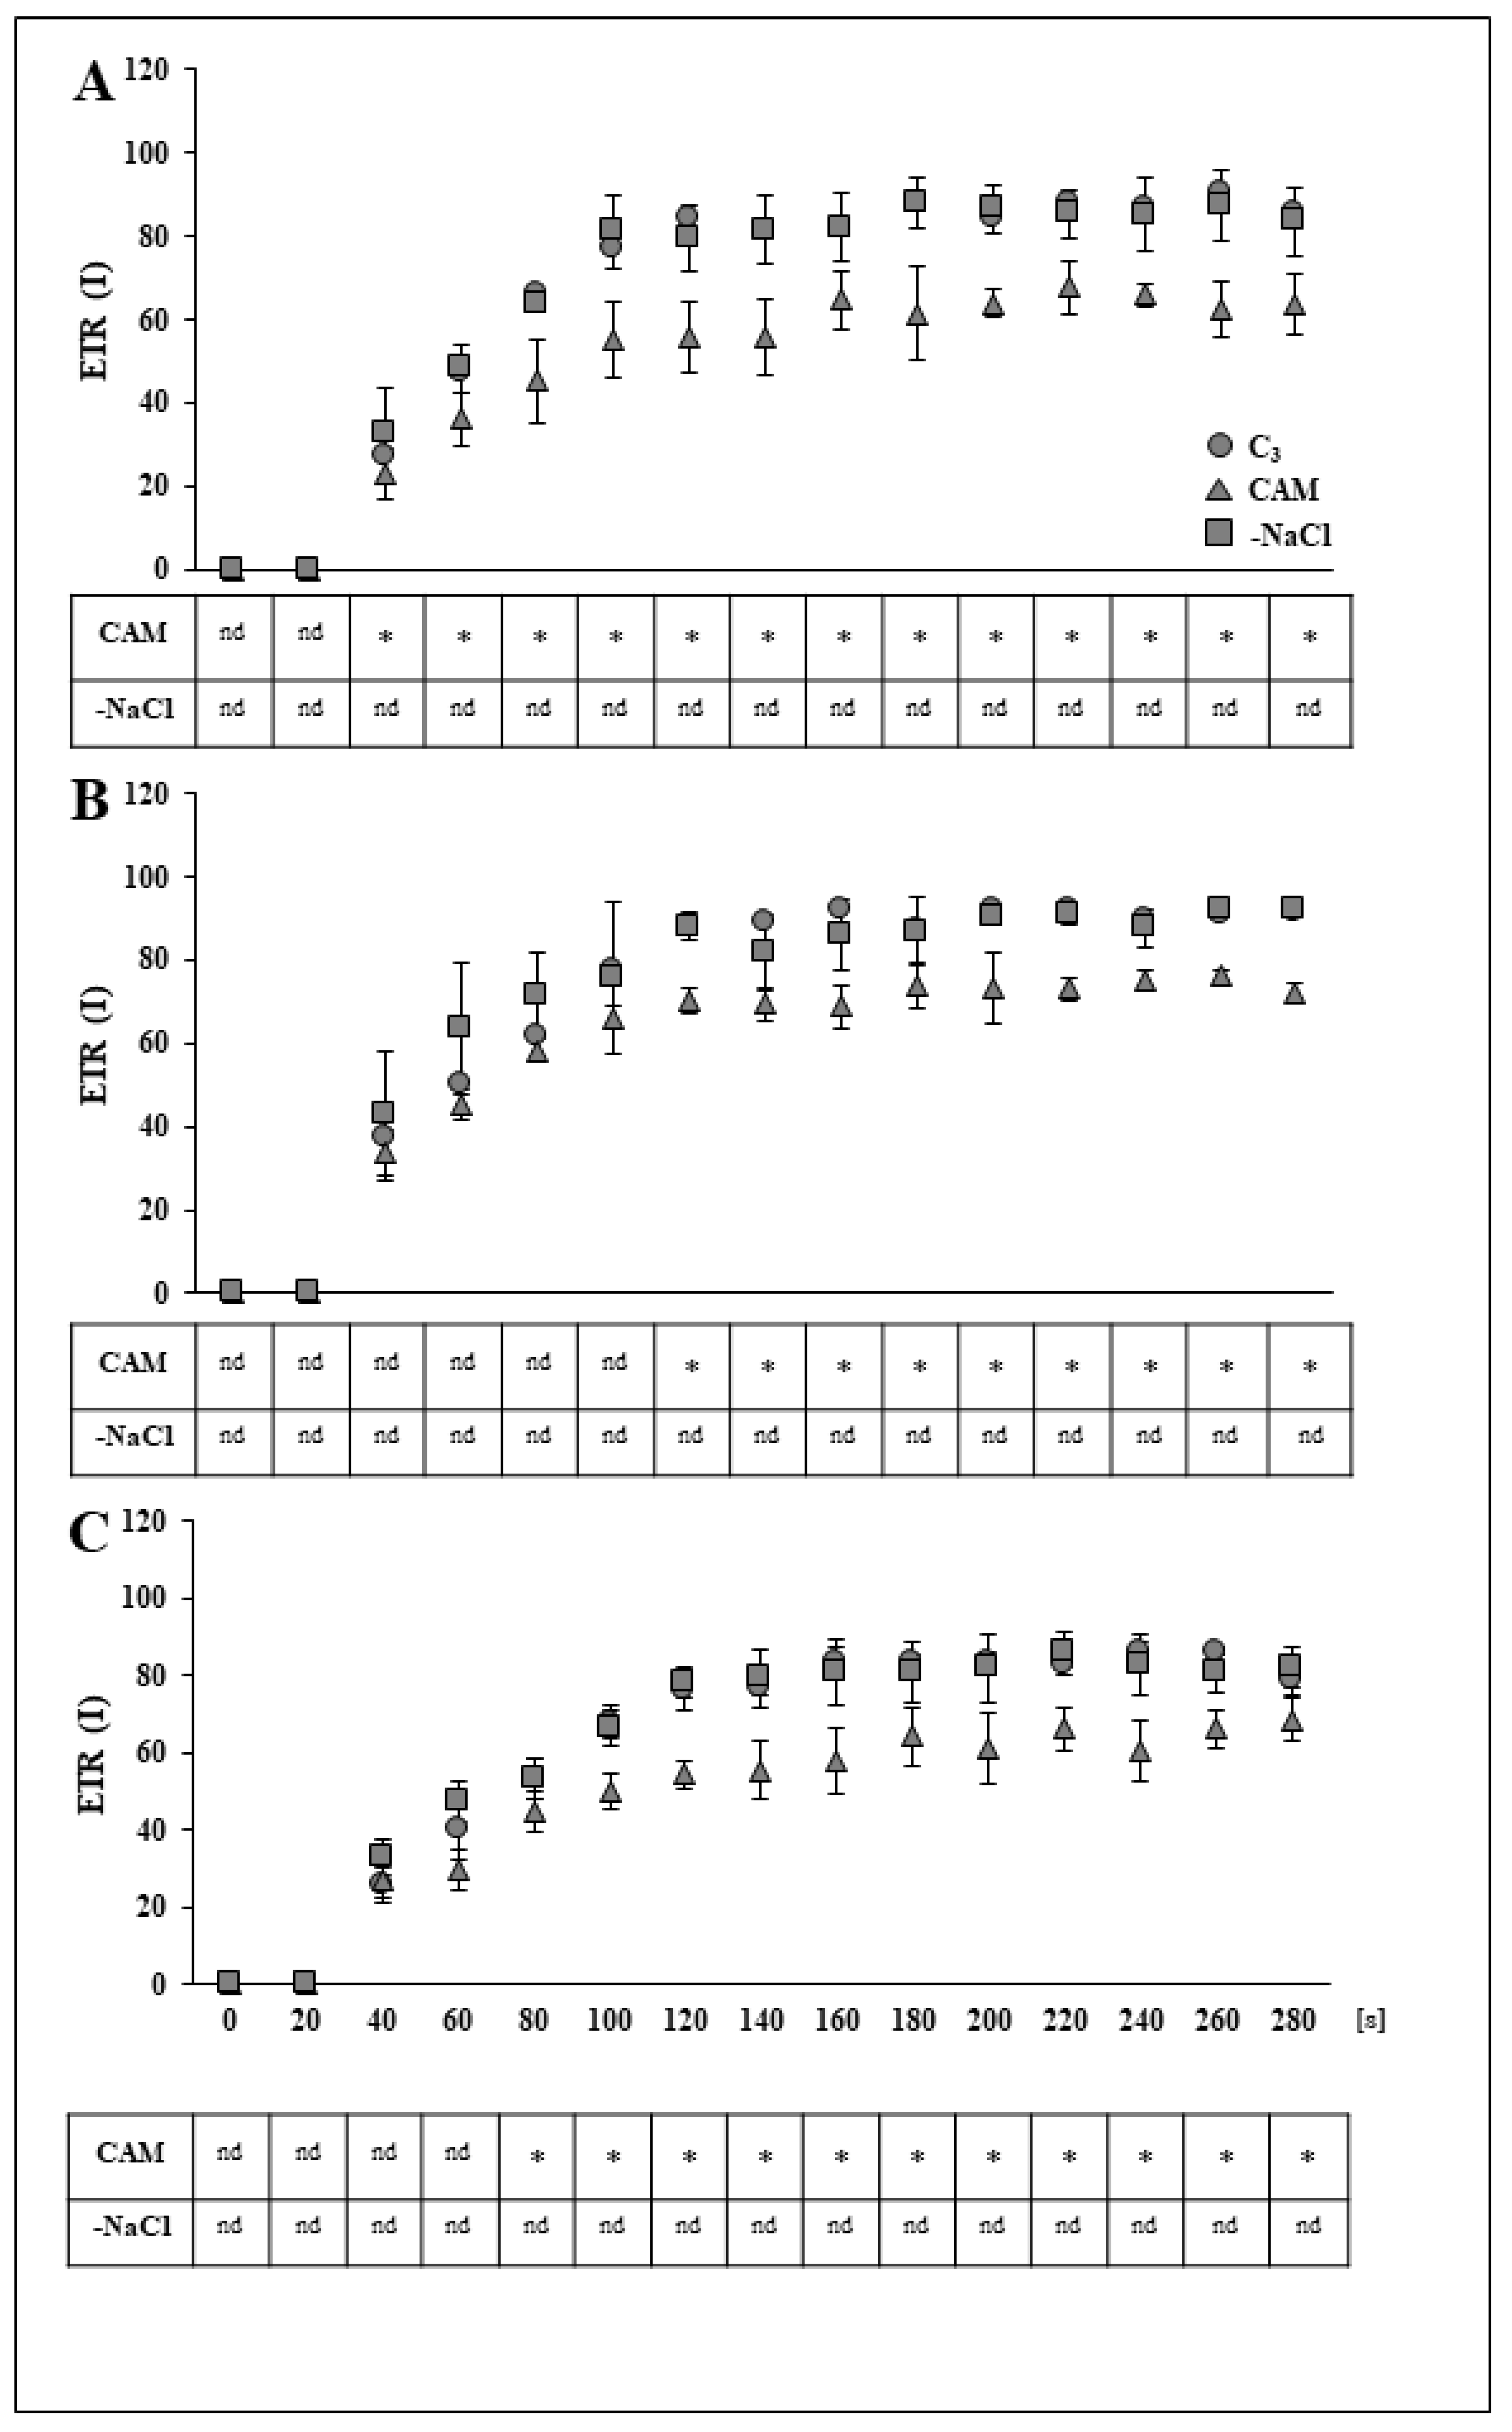
2.1. Removal of Osmotic Stress Results in Fast Recovery of PSI and PSII Efficiency
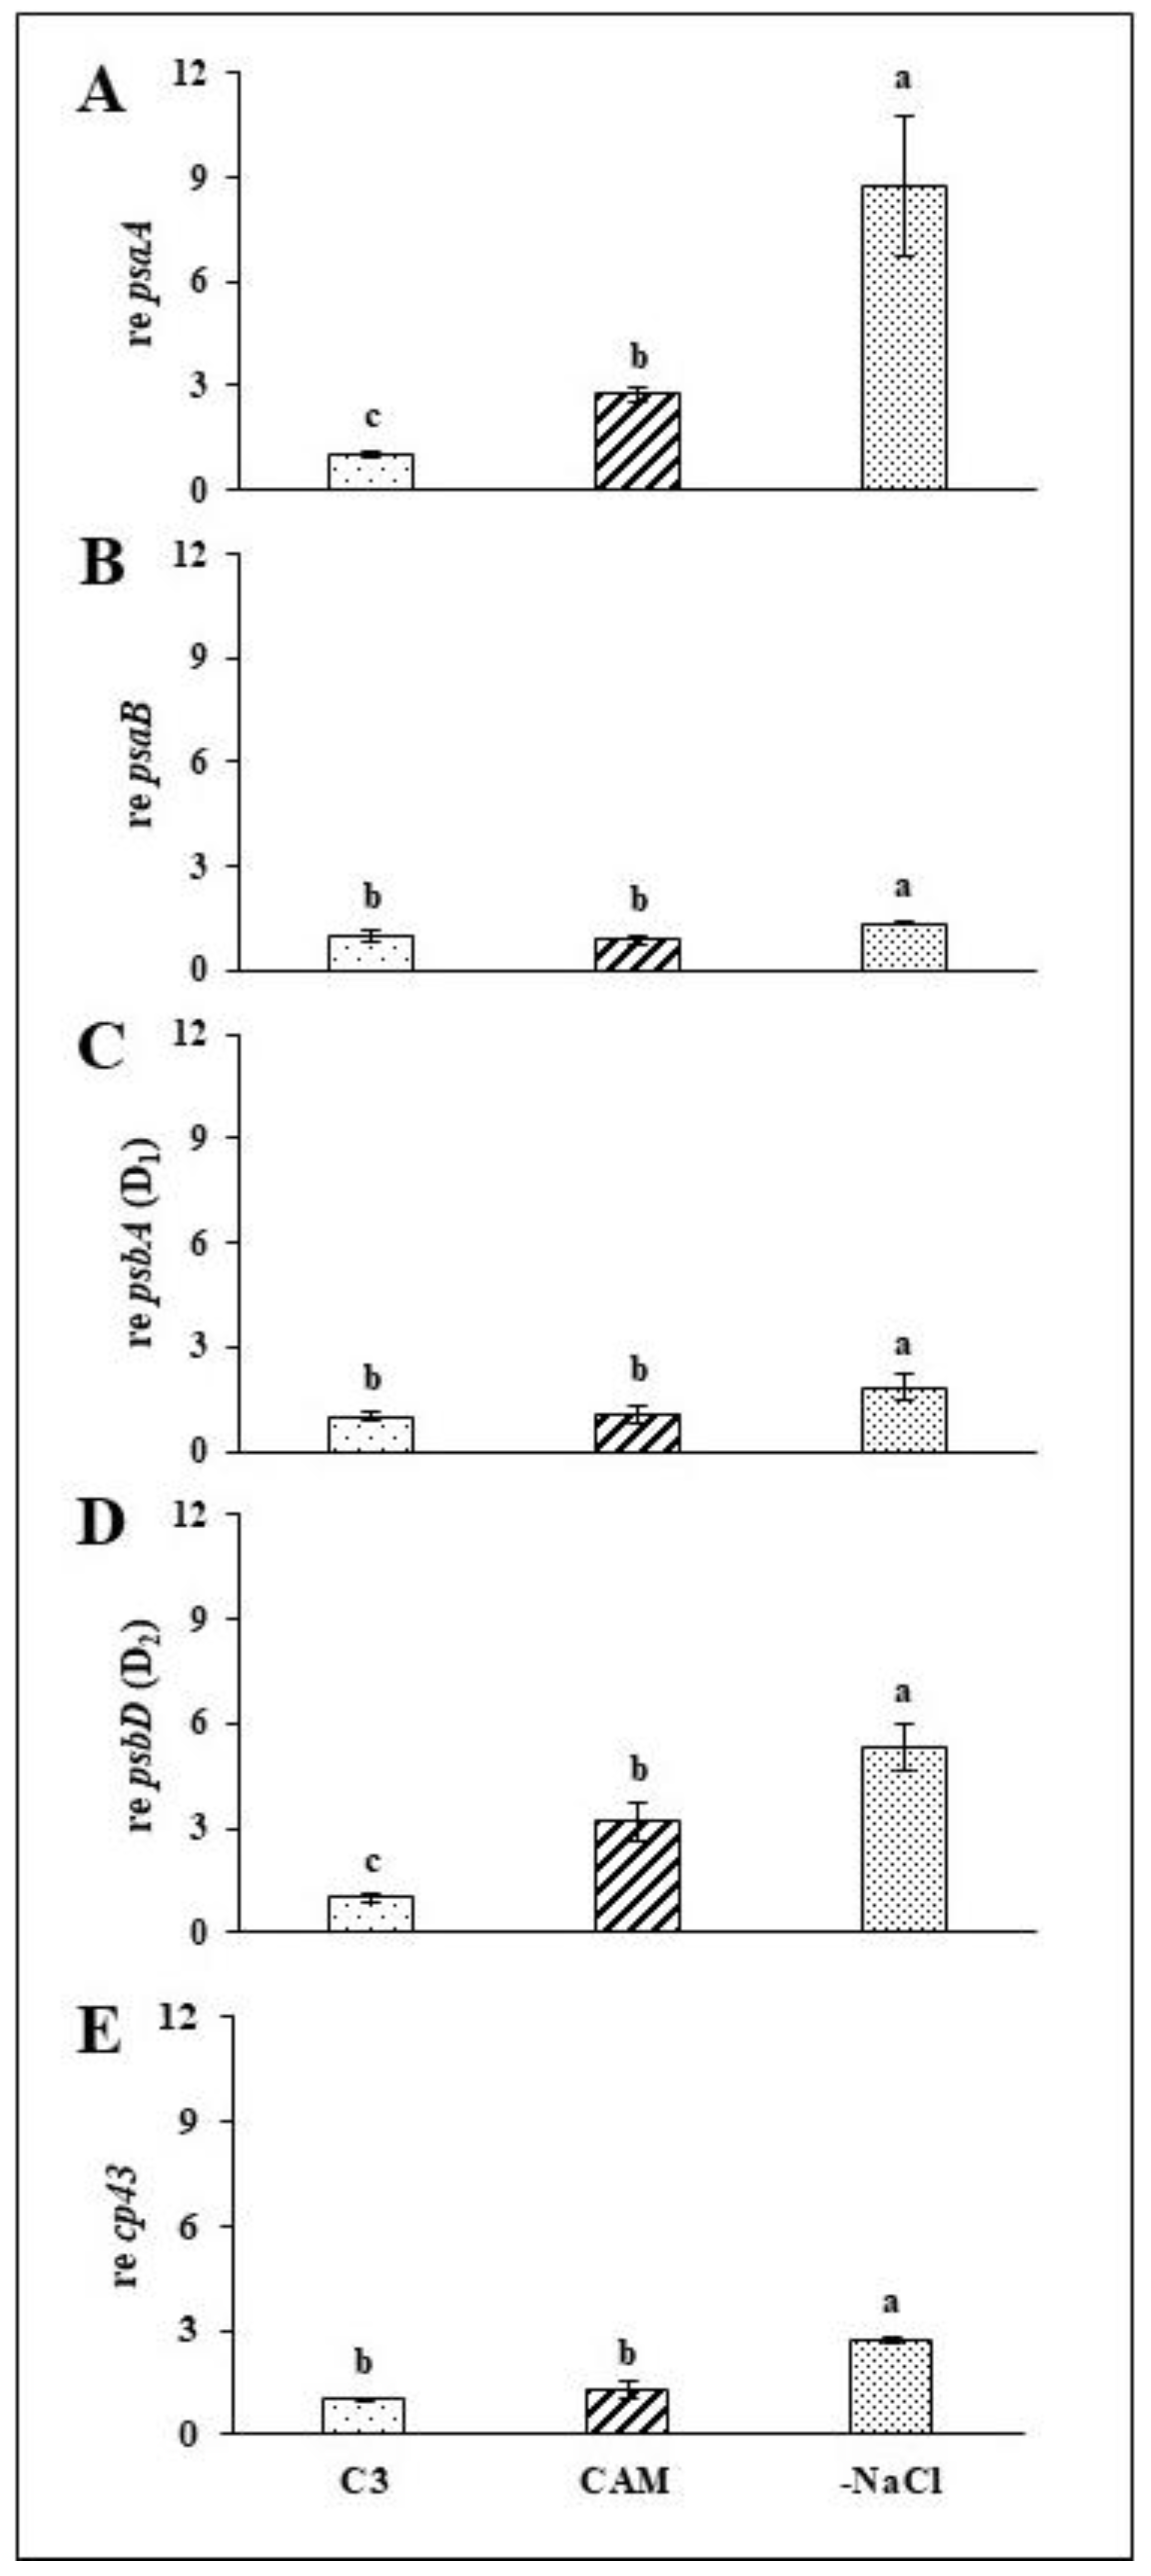
2.2. Rapid Recovery of PSII and PSI Efficiency Is Combined with Induced Expression of Structural Genes for the Reaction Centres of Both Photosystems
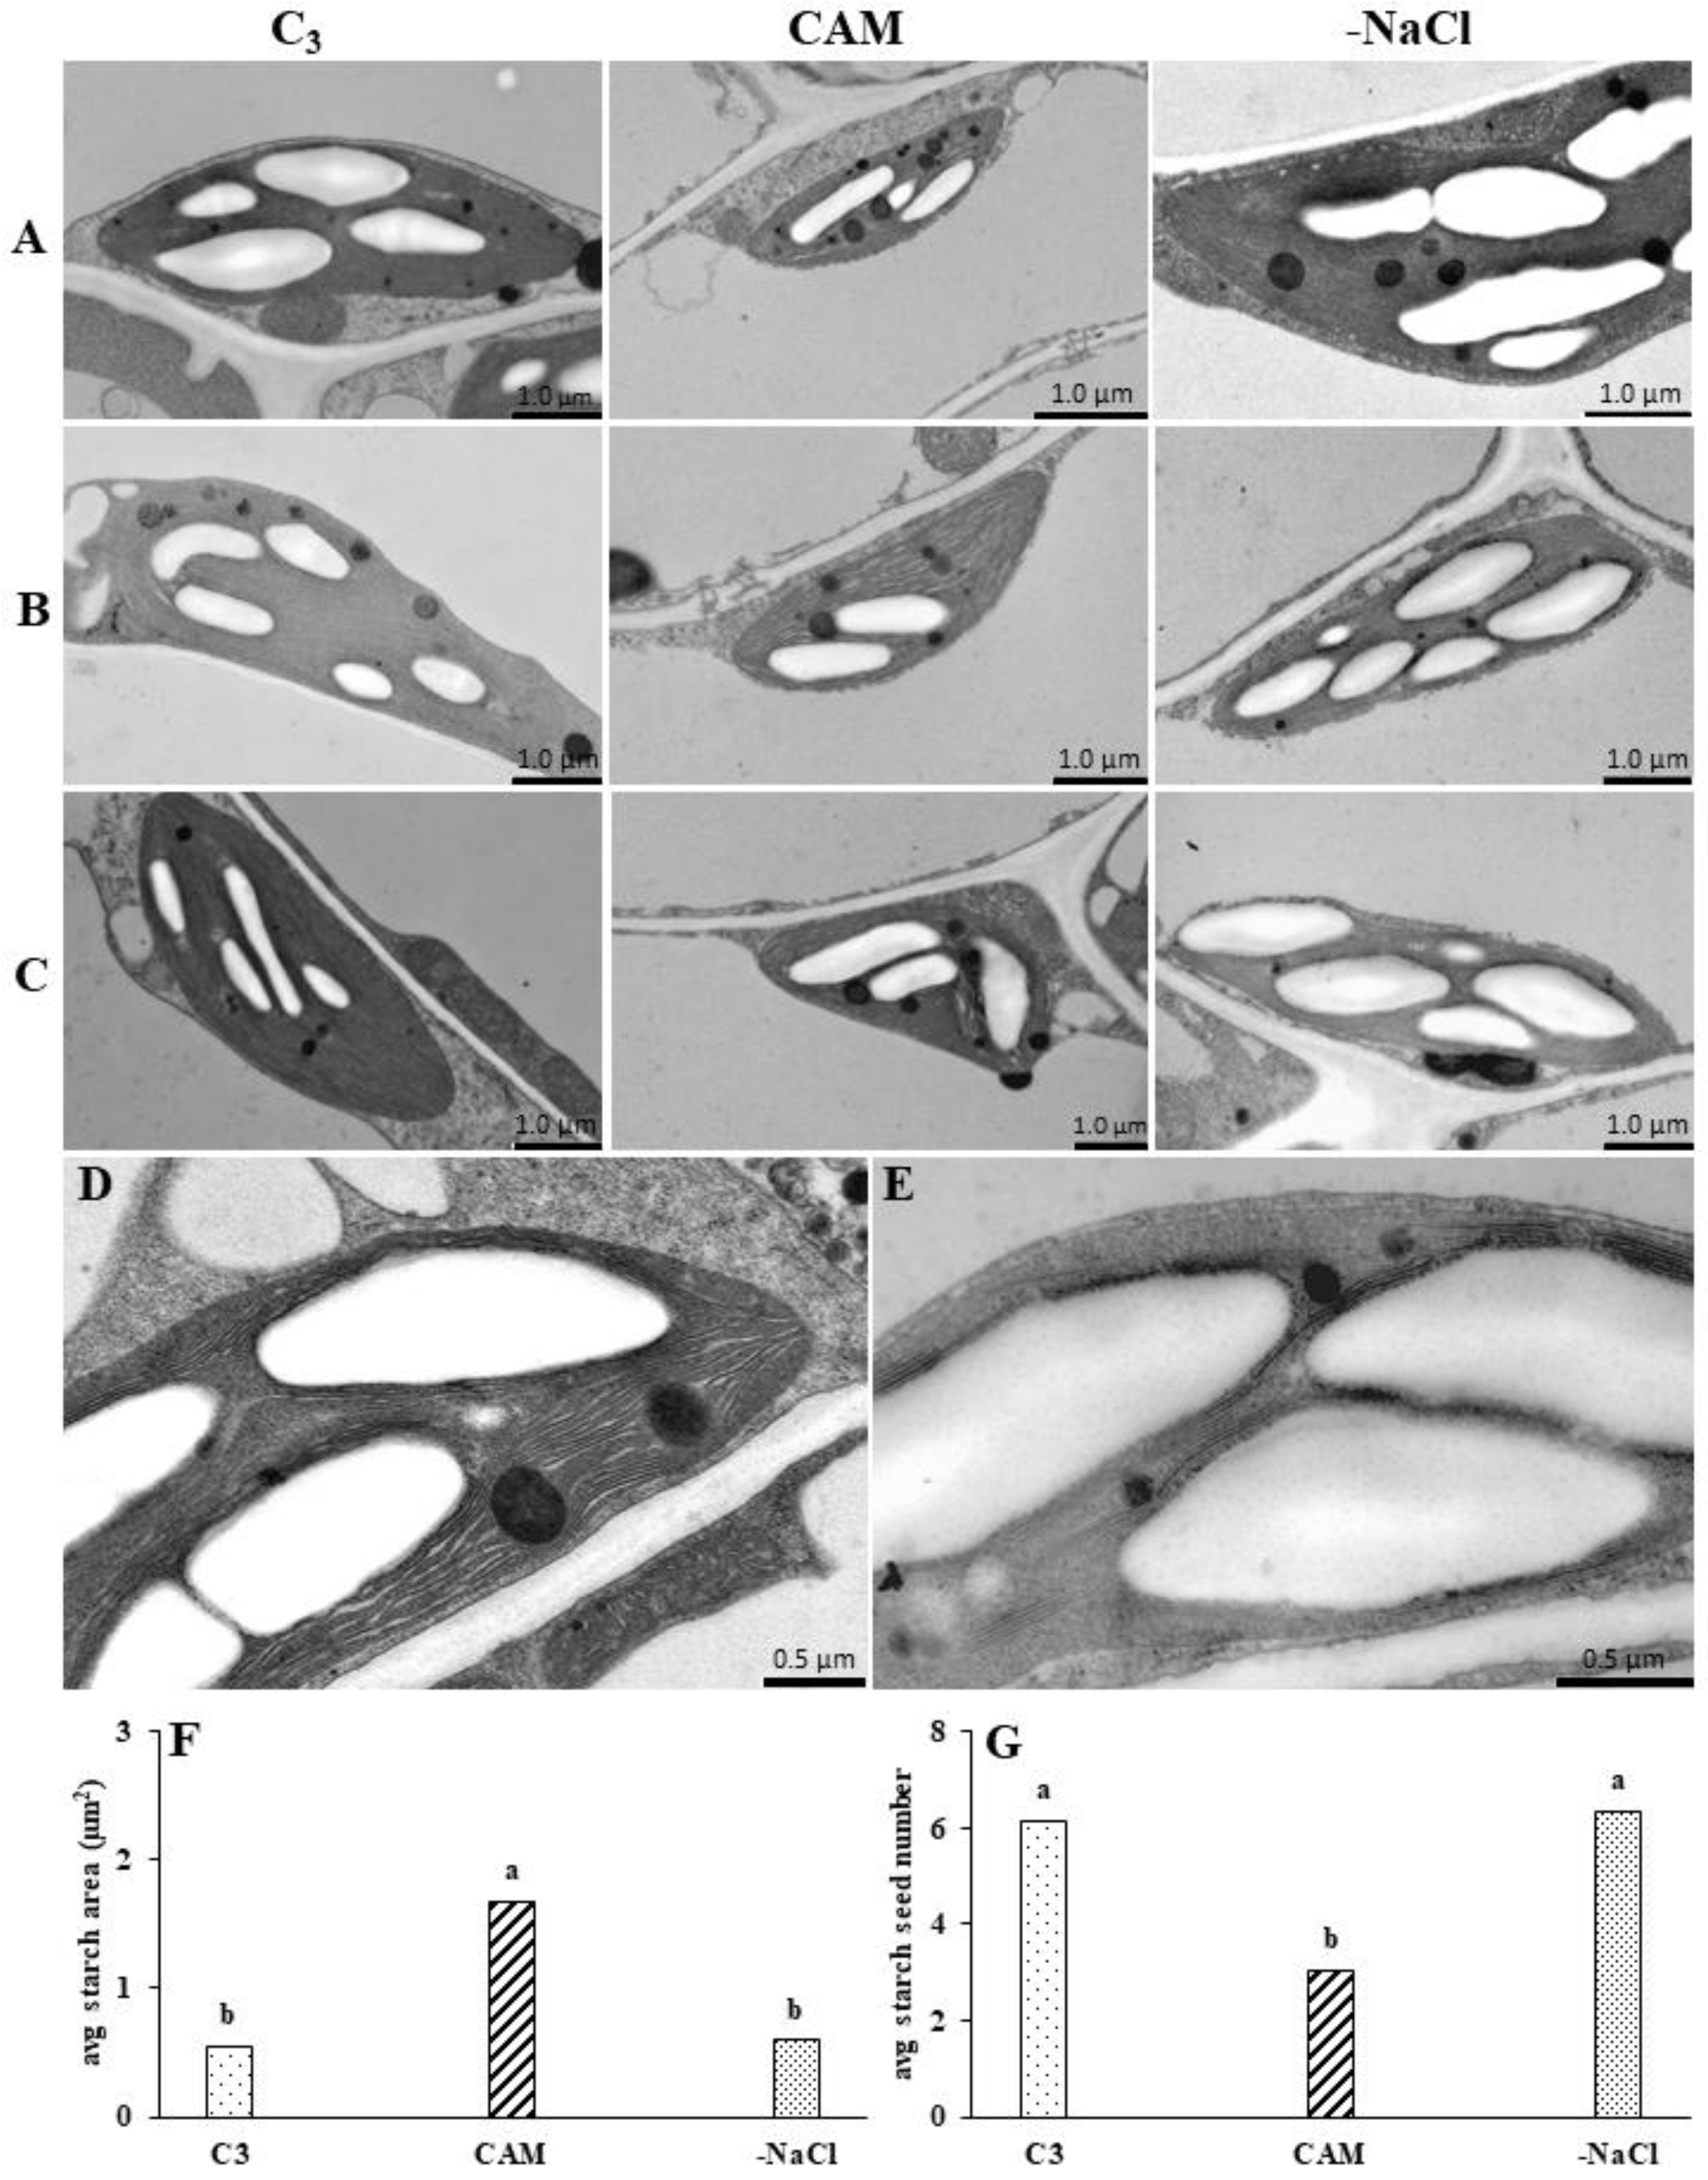
2.3. Withdrawal from Osmotic Stress Is Accompanied by the Rapid Reorganisation of Chloroplast Ultrastructure
3. Discussion
3.1. Rapid Modifications in PSII and PSI Functionality during Recovery from Osmotic Stress Confirm the Great Flexibility of the Common Ice Plant Photosynthetic Apparatus
3.2. Expression of PSII and PSI Structural Genes Is Rapidly Modified in Response to Osmotic Stress Absence
3.3. Rapid Changes in PSII and PSI Functionality Are Accompanied by Chloroplast Ultrastructure Modification during Osmotic Stress Recovery
4. Materials and Methods
4.1. Plant Material
4.2. Quantum Efficiencies of PSII and PSI
4.3. RNA Preparation
4.4. qPCR
4.5. Chloroplast Ultrastructure—TEM Analysis
4.6. Image Analysis of Electron Micrographs
4.7. Statistical Analysis
5. Conclusions
Supplementary Materials
Author Contributions
Funding
Institutional Review Board Statement
Informed Consent Statement
Data Availability Statement
Conflicts of Interest
Abbreviations
| CAM | Crassulacean acid metabolism; |
| ETRI | Electron transport chain of PSI; |
| ETRII | Electron transport chain of PSII; |
| F0 | Minimal fluorescence yield; |
| Fm | Maximum fluorescence yield; |
| Fm′ | Maximum light-adapted fluorescence; |
| Fv/Fm | Maximum quantum yield of PSII; |
| MDH | Malate dehydrogenase; |
| NPQ | Non-photochemical quenching; |
| OAA | Oxaloacetic acid; |
| PAR | Photosynthetically active radiation; |
| PEP | Phosphoenolpyruvate; |
| PEPC | Phosphoenolpyruvate carboxylase; |
| PET | Photosynthetic electron transport; |
| PSAA | PSI-A core protein of PS I; |
| PSBD | D2 protein of PS II; |
| PSI | Photosystem I; |
| PSII | Photosystem II; |
| qP, qL | Photochemical quenching calculated based on the puddle and lake model, respectively; |
| RuBisCO | Ribulose-1,5-bisphosphate carboxylase-oxygenase; |
| Y(I) | Quantum yield of (PSI); |
| Y(II) | Quantum yield of (PSII); |
| YNA | Quantum yield of energy dissipation due to acceptor side limitation in PSI; |
| YND | Quantum yield of energy dissipation due to donor side limitation in PSI. |
References
- Winter, K. Ecophysiology of constitutive and facultative CAM photosynthesis. J. Exp. Bot. 2019, 70, 6495–6508. [Google Scholar] [CrossRef] [PubMed]
- Munns, R.; Tester, M. Mechanisms of salinity tolerance. Ann. Rev. Plant. Biol. 2008, 59, 651–681. [Google Scholar] [CrossRef] [PubMed] [Green Version]
- Gilroy, S.; Suzuki, N.; Miller, G.; Choi, W.-G.; Toyota, M.; Devireddy, A.R.; Mittler, R. A tidal wave of signals: Calcium and ROS at the forefront of rapid systemic signalling. Trend Plant. Sci. 2014, 19, 623–630. [Google Scholar] [CrossRef]
- Acosta-Motos, J.R.; Ortuno, M.F.; Bernal-Vicente, A.; Diaz-Vivancos, P.; Sanchez-Blanco, M.J.; Hernandez, J.A. Plant response to salt stress: Adaptive mechanisms. Agronomy 2017, 7, 18. [Google Scholar] [CrossRef] [Green Version]
- Guan, Q.; Bowen, T.; Kelley, T.M.; Jingkui, T.; Chen, S. Physiological changes in Mesembryanthemum crystallinum during C3 to CAM transition induced by salt stress. Front. Plant Sci. 2020, 11, 283. [Google Scholar] [CrossRef] [Green Version]
- Niewiadomska, E.; Bilger, W.; Gruca, M.; Mulisch, M.; Miszalski, Z.; Krupinska, K. CAM-related changes in chloroplastic metabolism of Mesembryanthemum crystallinum L. Planta 2011, 233, 275–285. [Google Scholar] [CrossRef] [Green Version]
- Niewiadomska, E.; Pilarska, M. Acclimation to salinity in halophytic ice plant prevents a decline of linear electron transport. Environ. Exp. Bot. 2021, 184, 104401. [Google Scholar] [CrossRef]
- Adams, P.; Nelson, D.; Yamada, S.; Chmara, W.; Jensen, R.; Bohnert, H.; Griffiths, H. Growth and development of Mesembryanthemum crystallinum (Aizoaceae). New Phytol. 1998, 138, 171–190. [Google Scholar] [CrossRef]
- Kuźniak, E.; Kornas, A.; Kaźmierczak, A.; Rozpądek, P.; Nosek, M.; Kocurek, M.; Zellnig, G.; Müller, M.; Miszalski, Z. Photosynthesis-related characteristics of the midrib and the interveinal lamina in leaves of the C3–CAM intermediate plant Mesembryanthemum crystallinum. Ann. Bot. 2016, 117, 1141–1151. [Google Scholar] [CrossRef] [Green Version]
- Winter, K.; Holtum, J.A.M. Facultative crassulacean acid metabolism (CAM) plants: Powerful tools for unravelling the functional elements of CAM photosynthesis. J. Exp. Bot. 2014, 65, 3425–3441. [Google Scholar] [CrossRef] [PubMed] [Green Version]
- Nosek, M.; Gawrońska, K.; Rozpądek, P.; Szechyńska-Hebda, M.; Kornaś, A.; Miszalski, Z. Withdrawal from functional Crassulacean acid metabolism (CAM) is accompanied by changes in both gene expression and activity of antioxidative enzymes. J. Plant Physiol. 2018, 229, 151–157. [Google Scholar] [CrossRef]
- Keiller, D.R.; Slocombe, S.P.; Cockburn, W. Analysis of chlorophyll a fluorescence in C3 and CAM forms of Mesembryanthemum crystallinum. J. Exp. Bot. 1994, 45, 325–334. [Google Scholar] [CrossRef]
- Matsuoka, T.; Onozawa, A.; Sonoike, K.; Kore-eda, S. Crassulacean acid metabolism induction in Mesembryanthemum crystallinum can be estimated by non-photochemical quenching upon actinic illumination during the dark period. Plant Cell Physiol. 2018, 59, 1966–1975. [Google Scholar] [CrossRef]
- Schöttler, M.A.; Kirchhoff, H.; Siebke, K.; Weis, E. Metabolic control of photosynthetic electron transport in Crassulacean acid metabolism-induced Mesembryanthemum crystallinum. Funct. Plant Biol. 2002, 29, 697–705. [Google Scholar] [CrossRef]
- Broetto, F.; Duarte, H.M.; Lüttge, U. Responses of chlorophyll fluorescence parameters of the facultative halophyte and C3–CAM intermediate species Mesembryanthemum crystallinum to salinity and high irradiance stress. J. Plant Physiol. 2007, 164, 904–912. [Google Scholar] [CrossRef] [PubMed]
- Chaves, M.M.; Flexas, J.; Pinheiro, C. Photosynthesis under drought and salt stress: Regulation mechanisms from whole plant to cell. Ann. Bot. 2009, 103, 551–560. [Google Scholar] [CrossRef] [Green Version]
- Cushman, J.C.; Tillett, R.L.; Wood, J.A.; Branco, J.M.; Schlauch, K.A. Large-scale mRNA expression profiling in the common iceplant, Mesembryanthemum crystallinum, performing C3 photosynthesis and Crassulacean acid metabolism (CAM). J. Exp. Bot. 2008, 59, 1875–1894. [Google Scholar] [CrossRef] [PubMed] [Green Version]
- Pfannschmidt, T. Chloroplast redox signals: How photosynthesis controls its own genes. Trends Plant Sci. 2003, 8, 33–41. [Google Scholar] [CrossRef] [Green Version]
- Mitsuya, S.; Takeoka, Y.; Miyake, H. Effects of sodium chloride on foliar ultrastructure of sweet potato (Ipomoea batatas Lam.) plantlets grown under light and dark conditions in vitro. J. Plant Physiol. 2000, 157, 661–667. [Google Scholar] [CrossRef]
- Yamane, K.; Hayakawa, K.; Kawasaki, M.; Taniguchi, M.; Miyake, H. Bundle sheath chloroplasts of rice are more sensitive to drought stress than mesophyll chloroplasts. J. Plant Physiol. 2003, 160, 1319–1327. [Google Scholar] [CrossRef]
- Shu, S.; Yuan, Y.; Chen, J.; Sun, J.; Zhang, W.; Tang, Y.; Zhong, M.; Guo, S. The role of putrescine in the regulation of proteins and fatty acids of thylakoid membranes under salt stress. Sci. Rep. 2015, 5, 14390. [Google Scholar] [CrossRef] [PubMed] [Green Version]
- Paramanova, N.V.; Shevyakova, N.I.; Kuznetsov, V. Ultrastructure of chloroplasts and their storage inclusions in the primary leaves of Mesembryanthemum crystallinum affected by putrescine and NaCl. Russ. J. Plant Physiol. 2004, 51, 86–96. [Google Scholar] [CrossRef]
- Paul, M.J.; Loos, K.; Stitt, M.; Ziegler, P. Starch-degrading enzymes during the induction of CAM in Mesembryanthemum crystallinum. Plant Cell Environ. 1993, 16, 531–538. [Google Scholar] [CrossRef]
- Neushaus, E.H.; Schulte, N. Starch degradation in chloroplasts isolated from C3 or CAM (Crassulacean acid metabolism)-induced Mesembryanthemum crystallinum L. Biochem. J. 1996, 318, 945–953. [Google Scholar] [CrossRef] [Green Version]
- Nosek, M.; Kaczmarczyk, A.; Jędrzejczyk, R.J.J.; Supel, P.; Kaszycki, P.; Miszalski, Z. Expression of genes involved in heavy metal trafficking in plants exposed to salinity stress and elevated cd concentrations. Plants 2020, 9, 475. [Google Scholar] [CrossRef] [Green Version]
- Miszalski, Z.; Kornas, A.; Rozpadek, P.; Fischer-Schliebs, E.; Lüttge, U. Independent fluctuations of malate and citrate in the CAM species Clusia hilariana Schltdl. under low light and high light in relation to photoprotection. J. Plant Physiol. 2013, 170, 453–458. [Google Scholar] [CrossRef] [PubMed]
- Genty, B.; Briantais, J.-M.; Baker, N.R. The relationship between the quantum yield of photosynthetic electron transport and quenching of chlorophyll fluorescence. Biochim. Biophys. Acta 1989, 990, 87–92. [Google Scholar] [CrossRef]
- Kramer, D.M.; Johnson, G.; Kiirats, O.; Edwards, G.E. New flux parameters for the determination of QA redox state and excitation fluxes. Photosynth. Res. 2004, 79, 209–218. [Google Scholar] [CrossRef]
- Oxborough, K. Imaging of chlorophyll a fluorescence: Theoretical and practical aspects of an emerging technique for the monitoring of photosynthetic performance. J. Exp. Bot. 2004, 55, 1195–1205. [Google Scholar] [CrossRef]
- Nosek, M.; Rozpadek, R.; Kornas, A.; Kuzniak, E.; Schmitt, A.; Miszalski, Z. Veinal-mesophyll interaction under biotic stress. J. Plant Physiol. 2015, 185, 52–56. [Google Scholar] [CrossRef]
- Pfaffl, M.W. A new mathematical model for relative quantification in real-time RT-PCR. Nucleic Acid Res. 2001, 29, 16–21. [Google Scholar] [CrossRef] [PubMed]


Publisher’s Note: MDPI stays neutral with regard to jurisdictional claims in published maps and institutional affiliations. |
© 2021 by the authors. Licensee MDPI, Basel, Switzerland. This article is an open access article distributed under the terms and conditions of the Creative Commons Attribution (CC BY) license (https://creativecommons.org/licenses/by/4.0/).
Share and Cite
Nosek, M.; Gawrońska, K.; Rozpądek, P.; Sujkowska-Rybkowska, M.; Miszalski, Z.; Kornaś, A. At the Edges of Photosynthetic Metabolic Plasticity—On the Rapidity and Extent of Changes Accompanying Salinity Stress-Induced CAM Photosynthesis Withdrawal. Int. J. Mol. Sci. 2021, 22, 8426. https://doi.org/10.3390/ijms22168426
Nosek M, Gawrońska K, Rozpądek P, Sujkowska-Rybkowska M, Miszalski Z, Kornaś A. At the Edges of Photosynthetic Metabolic Plasticity—On the Rapidity and Extent of Changes Accompanying Salinity Stress-Induced CAM Photosynthesis Withdrawal. International Journal of Molecular Sciences. 2021; 22(16):8426. https://doi.org/10.3390/ijms22168426
Chicago/Turabian StyleNosek, Michał, Katarzyna Gawrońska, Piotr Rozpądek, Marzena Sujkowska-Rybkowska, Zbigniew Miszalski, and Andrzej Kornaś. 2021. "At the Edges of Photosynthetic Metabolic Plasticity—On the Rapidity and Extent of Changes Accompanying Salinity Stress-Induced CAM Photosynthesis Withdrawal" International Journal of Molecular Sciences 22, no. 16: 8426. https://doi.org/10.3390/ijms22168426