Article

Comprehensive Transcriptomic Analysis of Auxin Responses in Submerged Rice Coleoptile Growth

1
Department of Agronomy, National Chung Hsing University, Taichung 40227, Taiwan
2
Pervasive AI Research (PAIR) Labs, Hsinchu 30010, Taiwan
*
Author to whom correspondence should be addressed.
Int. J. Mol. Sci. 2020, 21(4), 1292; https://doi.org/10.3390/ijms21041292
Submission received: 8 January 2020 / Revised: 12 February 2020 / Accepted: 12 February 2020 / Published: 14 February 2020

Abstract

:
Cultivating rice in wet or water direct seeding systems is simple and time and labor efficient. Rice (Oryza sativa) seeds are a unique cereal that can germinate not only when submerged, but also in anoxic conditions. Many complicated hormone signals interact in submerged seed germination. Ethylene is involved in rice coleoptile elongation, but little is known regarding the role of auxin signaling under submergence. This study demonstrated that the coleoptile is shorter and curlier when submerged with 2,3,5-triiodobenzoic acid (TIBA). In transcriptomic analysis, 3448 of the 31,860 genes were upregulated, and 4360 genes were downregulated with submergence and TIBA treatment. The Gene Ontology function classification results demonstrated that upregulated differentially expressed genes (DEGs) were mainly involved in redox, stress, and signal transduction, whereas the down-regulated DEGs were mainly involved in RNA transcription, stress, and development. Furthermore, auxin signaling involved in the carbohydrate metabolism pathway was demonstrated while using transcriptomic analysis and confirmed in a quantitative real-time polymerase chain reaction. In addition, the transcript levels of development-related genes and mitochondria-electron- transport-related genes were regulated by auxin signaling under submergence. Auxin signaling was not only involved in regulating rice coleoptile elongation and development, but also regulated secondary metabolism, carbohydrate metabolism, and mitochondria electron transport under submergence. Our results presented that auxin signaling plays an important role during rice coleoptile elongation upon the submergence condition and improving the advance of research of direct rice seeding system.

1. Introduction

Rice is among the most valuable cereal crops in the world. The rice coleoptile’s ability to grow in underwater environments has practical value for rice cultivation. Direct seeding of rice is performed by airplane over a field with a water depth of 35 cm. The seeds germinate under water, and the coleoptiles grow up to the water surface within a few days [1]. The direct seeding of rice is becoming popular and more crucial for rapid and uniform germination. Seed germination is a complex physiological process that must be tightly regulated to maximize plant survival by using various environmental cues [2,3]. Global climate change causing severe rain can negatively affect the seed germination, seedling growth, and production yields of rice [4]. Clarifying and establishing the regulation mechanism of submerged rice coleoptile growth is crucial for improving seed germination in paddy fields.
The involvement of phytohormones in regulating rice coleoptile elongation under different environmental conditions is complicated, and hormones may contribute to forming an effector system for environmental factors for the control of coleoptile elongation in rice [5,6,7]. Ethylene promotes rice coleoptile elongation under submerged conditions. In addition, auxin is involved in coleoptile elongation [8] and it promotes cell division and meristem maintenance. Auxin treatment induced rapid cell elongation in coleoptile and hypocotyl segments within minutes [9]. Auxin affects growth and development in plants by altering gene expression. Many auxin-responsive genes have been characterized in plants. Studies have indicated that coleoptile phototropism1 (CP1) involvement in the phototropism of coleoptiles is achieved by lateral auxin translocation and subsequent growth redistribution [10]. Auxin response factor1 (OsARF1) was positively correlated with auxin-dependent differential growth in rice coleoptiles [11]. Ion transport activity was also involved in promoting the auxin-induced growth of maize coleoptile segments [12].
Although the phytohormone auxin is involved in regulating rice coleoptile elongation, little is known regarding the roles of auxin in coleoptile growth responses in submerged conditions. This study compared the transcriptomic profiles of submerged rice coleoptiles and those that were treated with 2,3,5-triiodobenzoic acid (TIBA), which acts as an auxin polar transport inhibitor. According to our data, auxin signaling was involved in the cell division and tropism of submerged rice coleoptiles. In addition, auxin signaling played a central role in carbohydrate consumption during rice coleoptile elongation in the submerged condition. Therefore, our data provide important insight into the development of coleoptiles at the post-germination stages in the wet direct-seed system under submerged conditions.

2. Results

2.1. Submerged Rice Coleoptile Elongation Affected by Impeded Auxin Signaling

The polar auxin transport inhibitor TIBA was added to the combined submergence treatment to investigate the effect of auxin on rice coleoptile elongation under submerged conditions. The elongated rice coleoptile is appearing after submergence for five days, and the coleoptiles display significantly shorter and curlier after SUB + TIBA for five days (Figure 1A). The length of coleoptiles from seeds germinated and grown under the submergence only condition for two, three, four, five, and six days were 0.11, 0.66, 2.45, 3.92, and 5.16 cm, respectively, whereas the average lengths of rice coleoptiles under SUB + TIBA were 0.08, 0.36, 0.82, 1.26, and 1.82 cm, respectively (Figure 1B). The results indicated that auxin signaling is involved in rice coleoptile elongation and tropism under submerged conditions.

2.2. RNA Sequencing and Functional Annotation of DEGs in Rice Coleoptiles

We performed RNA sequencing (RNA-seq) analysis to clarify the roles of auxin in elongating submerged coleoptiles to investigate auxin signaling regulation in rice coleoptile growth under submergence. Rice coleoptile growth under the SUB and SUB + TIBA conditions after five days was collected for RNA-seq. In total, 11,338,976 and 11,213,701 clean reads were generated for SUB and SUB + TIBA and mapped to 80.92% and 79.7% unique genes in the rice genome, respectively (Table S1). The volcano plot in Figure 2 presents the comparison results of the UniGene expression levels in individual mRNA samples that were relatively enriched or depleted according to the region per million mappable reads (RPKM) value. In the SUB + TIBA condition, the expression levels of 3448 of the 31,860 genes were upregulated, whereas the remaining 4360 genes exhibited lower expression (Figure 2A). The GO classifications of DEGs in up- and down-regulation in the SUB + TIBA treatment were mapped against the KEGG database and then classified into 22 subcategories of biological processes. The upregulated DEGs were mainly involved in RNA transcription (8.3%; GO:0006351), protein degradation (6.2%; GO: 0019538), and biotic or abiotic stress (5.2%; GO: 0006950; Figure 2B), whereas the downregulated DEGs were mainly involved in protein synthesis and modification (9.5%; GO: 0044267), RNA transcription (8.8%; GO:0006351), and transport (4.1%; GO: 0006810; Figure 2C).
We identified 23 upregulated genes and 39 downregulated genes, which were filtered by a fold change (FC) of ≥ 200 or ≤ 0.005, in coleoptiles that were submerged with TIBA when compared with those submerged without TIBA. In the upregulated genes, we identified a heat shock protein (Os06g0195800) that was involved in protein refolding, redox-related genes, including 1-cysperoxiredoxin (Os07g0638300), cytochrome P450 (Os01g0628000), and clutathione S-transferase (Os03g0785900, Os09g0367700, Os10g0527400), and responsive to abscisic acid (ABA) 16D protein (Os11g0453900), which is involved in ABA response. We also identified E3 ubiquitin-protein ligase (Os09g0243200, Os08g0126000) that was involved in the protein ubiquitination pathway and a small GTPase (Os06g0225000) involved in G-protein signaling (Table 1). Among the downregulated genes, we identified transcription factors in the AP2 domain containing ethylene response transcription factors (Os01g0968800, Os02g0781300, and Os09g0522200), myb-like DNA-binding domain containing protein (Os05g0442400), WRKY transcription factor (Os01g0821300), and the lateral organ boundaries domain (LBD) family transcription factor (Os12g0106200). Calmodulin (Os11g0105000, Os12g0104900) is a crucial Ca2+ sensor in signal transduction in plants. In addition, we identified a highly sensitive auxin-responsive protein (Os09g0437100) and a bidirectional sugar transporter (Os01g0606000) that were associated with development response. The plant transporter included a proton-dependent oligopeptide transporter (Os05g0338933) and aquaporin (Os02g0658100), which were significantly downregulated in our analysis (Table 2).

2.3. The DEGs in Metabolism Process Regulated by Auxin Signaling in Submerged Rice Coleoptiles

We used MapMan to visualize the metabolic pathways to assess the effect of auxin signaling in submerged rice coleoptiles. We identified 504 DEGs involved in metabolic pathways, of which 159 were upregulated and 345 were downregulated. Both comparison treatments revealed that 63, 69, 87, 53, 53, 6, 6, 5, 8, and 10 genes were involved cell-wall metabolism, lipid metabolism, secondary metabolism, amino acid metabolism, carbohydrate metabolism, glycolysis, fermentation, oxidative phosphorylation, tricarboxylic acid (TCA) cycle, and mitochondrial electron transport, respectively. We identified strong regulation in several cell-wall-modification–related genes, including genes encoding an expansin (Os07g0496250) and xyloglucan endotransglycosylase (Os03g0108300 and OsXTH19; Os10g0545500; and, OsXTH20). Cell-wall-degradation–related genes, including those encoding beta-d-xylosidase (Os11g0291000 and Os11g0297300), which is the enzyme that is responsible for the cleavage of the xylem backbone, were downregulated in SUB + TIBA treatment. For lipid degradation, lipase (Os11g0299300 and Os05g0153300) was downregulated. Among the phospholipase D family proteins, which have roles in hormone signaling and environmental stress responses, Os02g0120200 was upregulated, but Os06g0604300 was downregulated in SUB + TIBA treatment. In the secondary metabolism pathway, most of the genes encoding laccase (Os03g0273200, Os05g0458600, Os05g0458300, Os01g0374600, Os03g0297900, Os01g0850800, and Os11g0108700), which play key roles in plant growth and defense responses, were downregulated in SUB + TIBA treatment (Figure 3 and Table S4). These observations demonstrated that auxin signaling is involved in the metabolic processes of submerged rice coleoptiles.

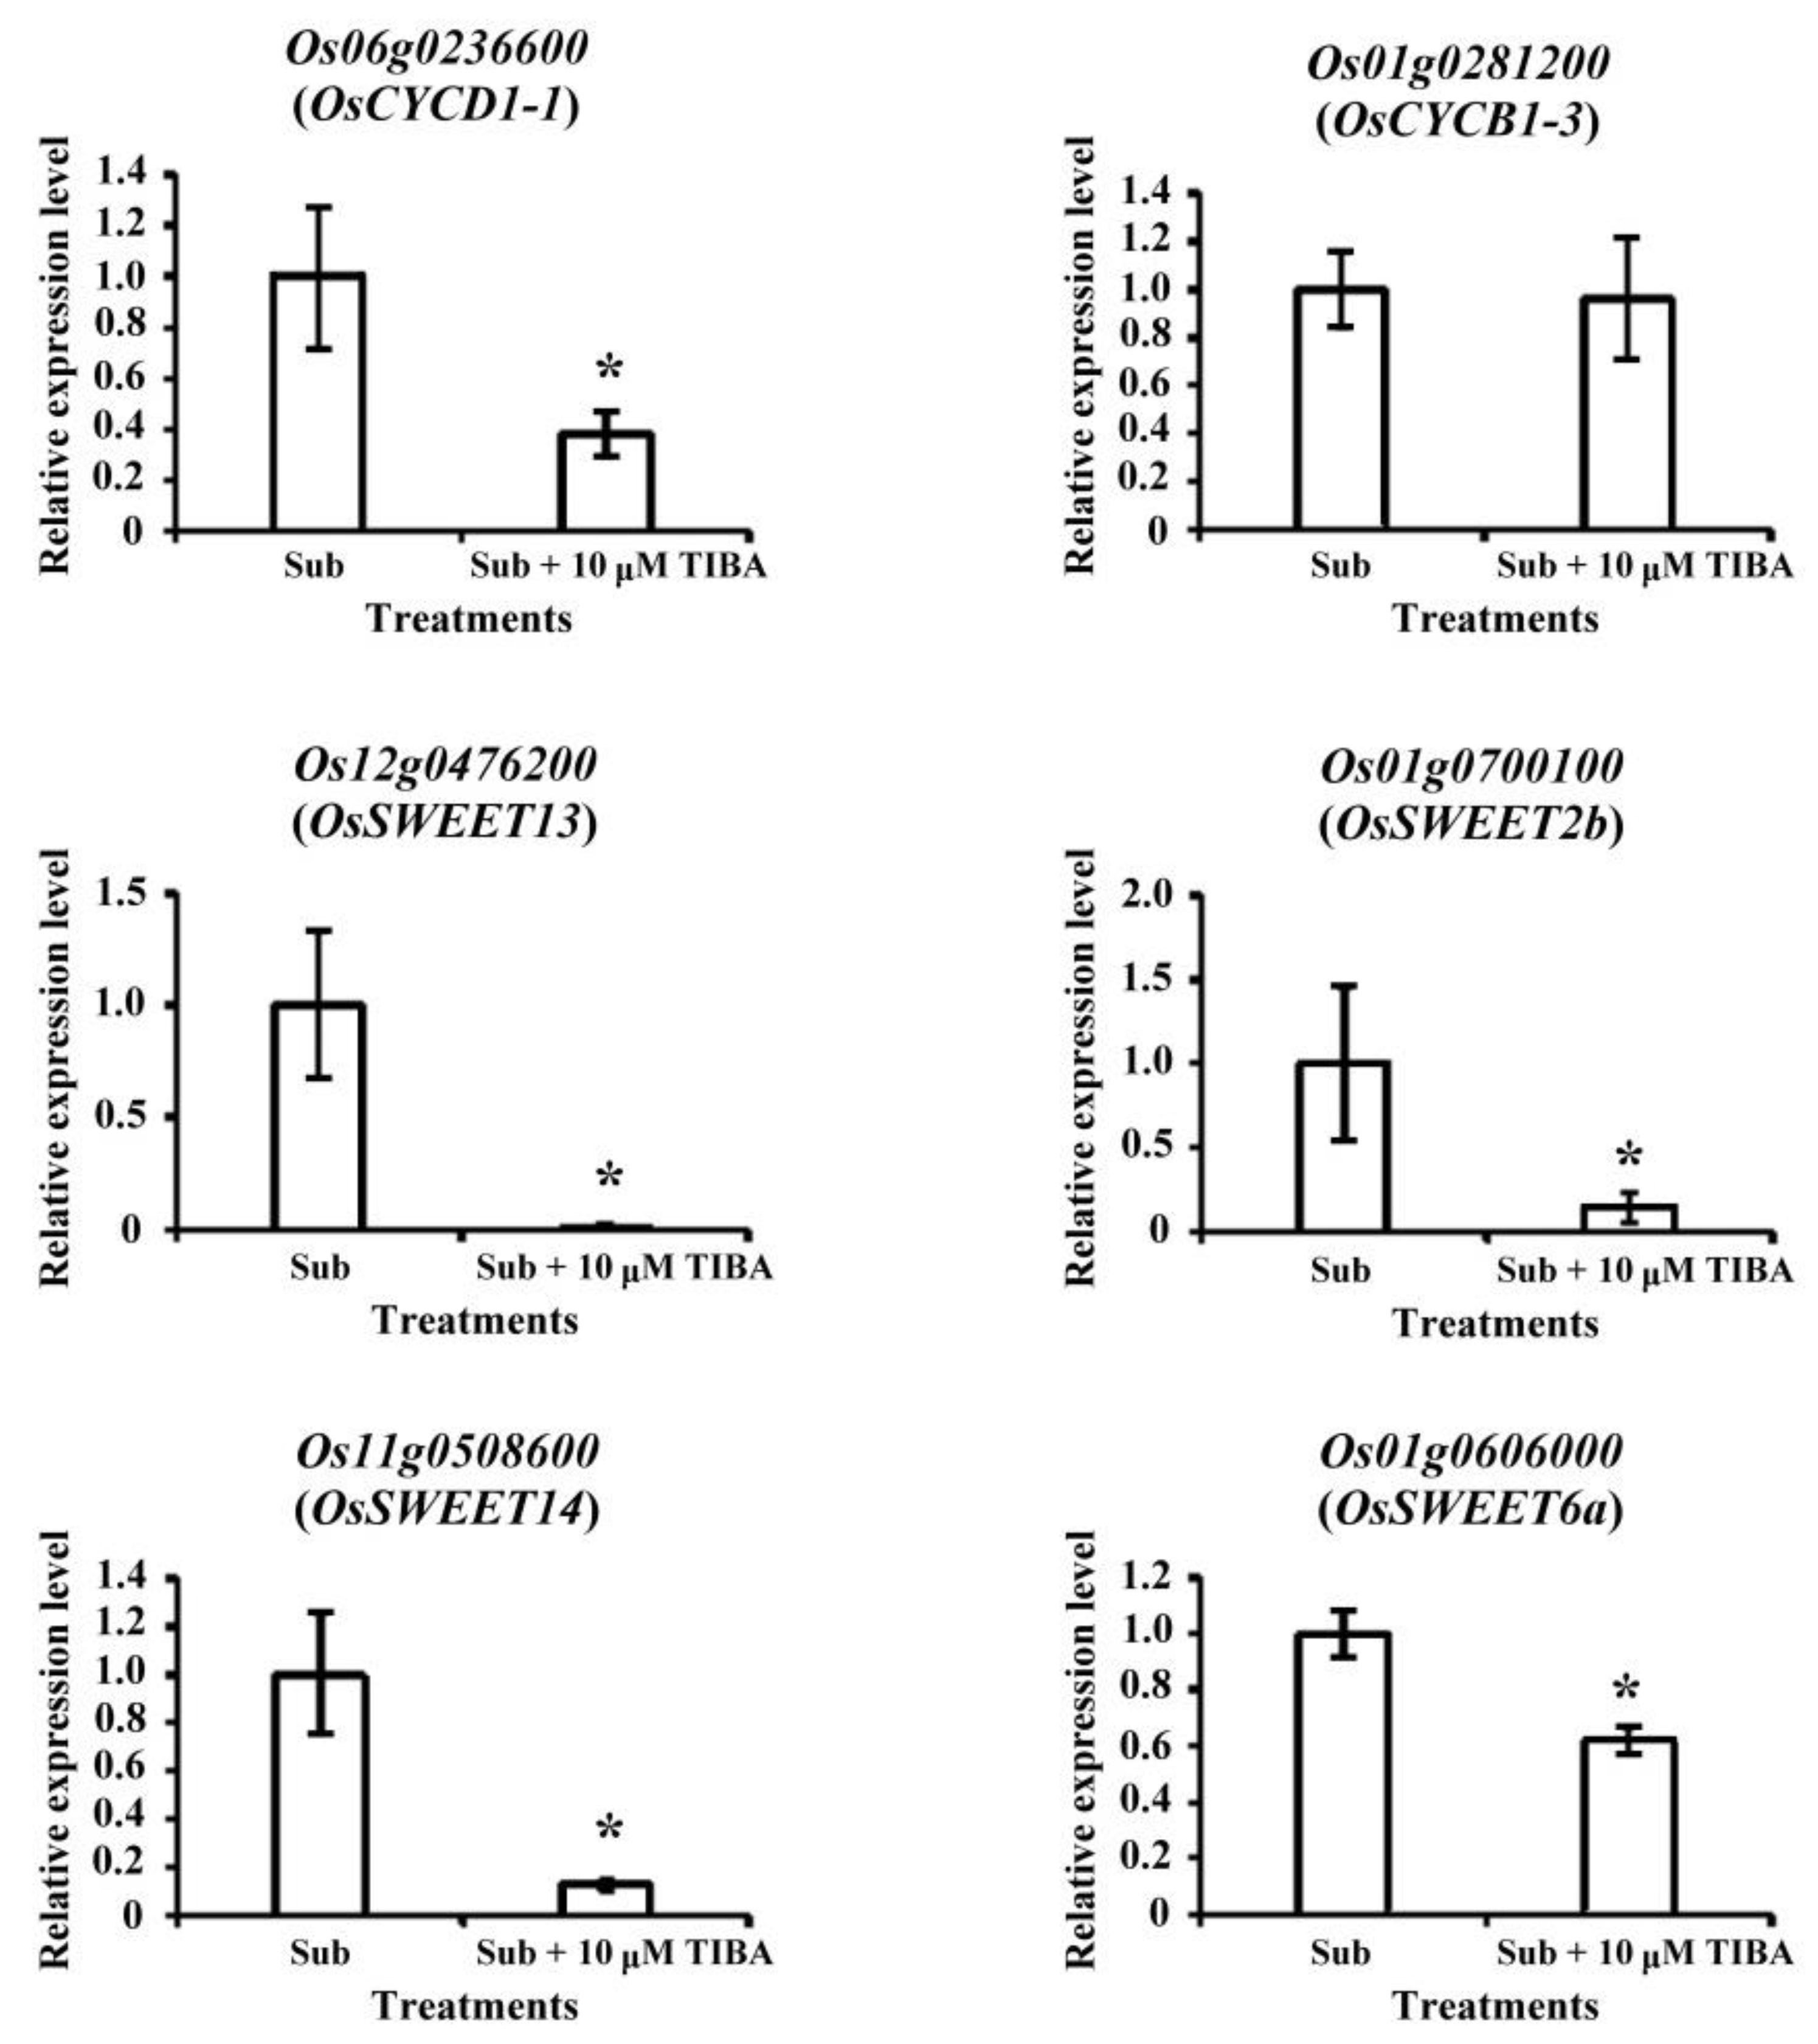
2.4. Transcript Levels of Development-Responsive Genes Regulated by Auxin Signaling in Submerged Rice Coleoptiles

The coleoptiles submerged with TIBA were shorter and curlier than those that were submerged without TIBA (Figure 1). Therefore, we analyzed the transcript levels of development-responsive genes in submerged coleoptiles. Two genes were associated with cell division: Os01g0281200 encoding G2/mitotic-specific cyclin-B1-3 (OsCYCB1-3) and Os06g0236600 encoding G1/S-specific cyclin-D1-1 (OsCYCD1-1). Both of the cell-division-related genes were downregulated when submerged with TIBA. In addition, three genes were associated with vascular auxin transport (walls are thin 1, WAT1), which is involved in regulating intracellular auxin homeostasis in plants. The transcript levels of Os01g0803300, Os04g0422300, and Os06g021000 were significantly downregulated in SUB + TIBA treatment. Furthermore, most sugar transport genes, such as Os01g0606000 (OsSWEET6a), Os12g0476200 (OsSWEET13), Os11g0508600 (OsSWEET14), and Os01g0700100 (OsSWEET2b), were downregulated in SUB + TIBA treatment (Table 3).
We confirmed the transcript levels of the development-responsive genes by using qRT-PCR. The transcript levels of OsCYCD1-1, OsSWEET13, OsSWEET2b, OsSWEET14, and OsSWEET6a were reduced. Only OsCYCD1-3 had no significant difference in SUB + TIBA treatment (Figure 4).

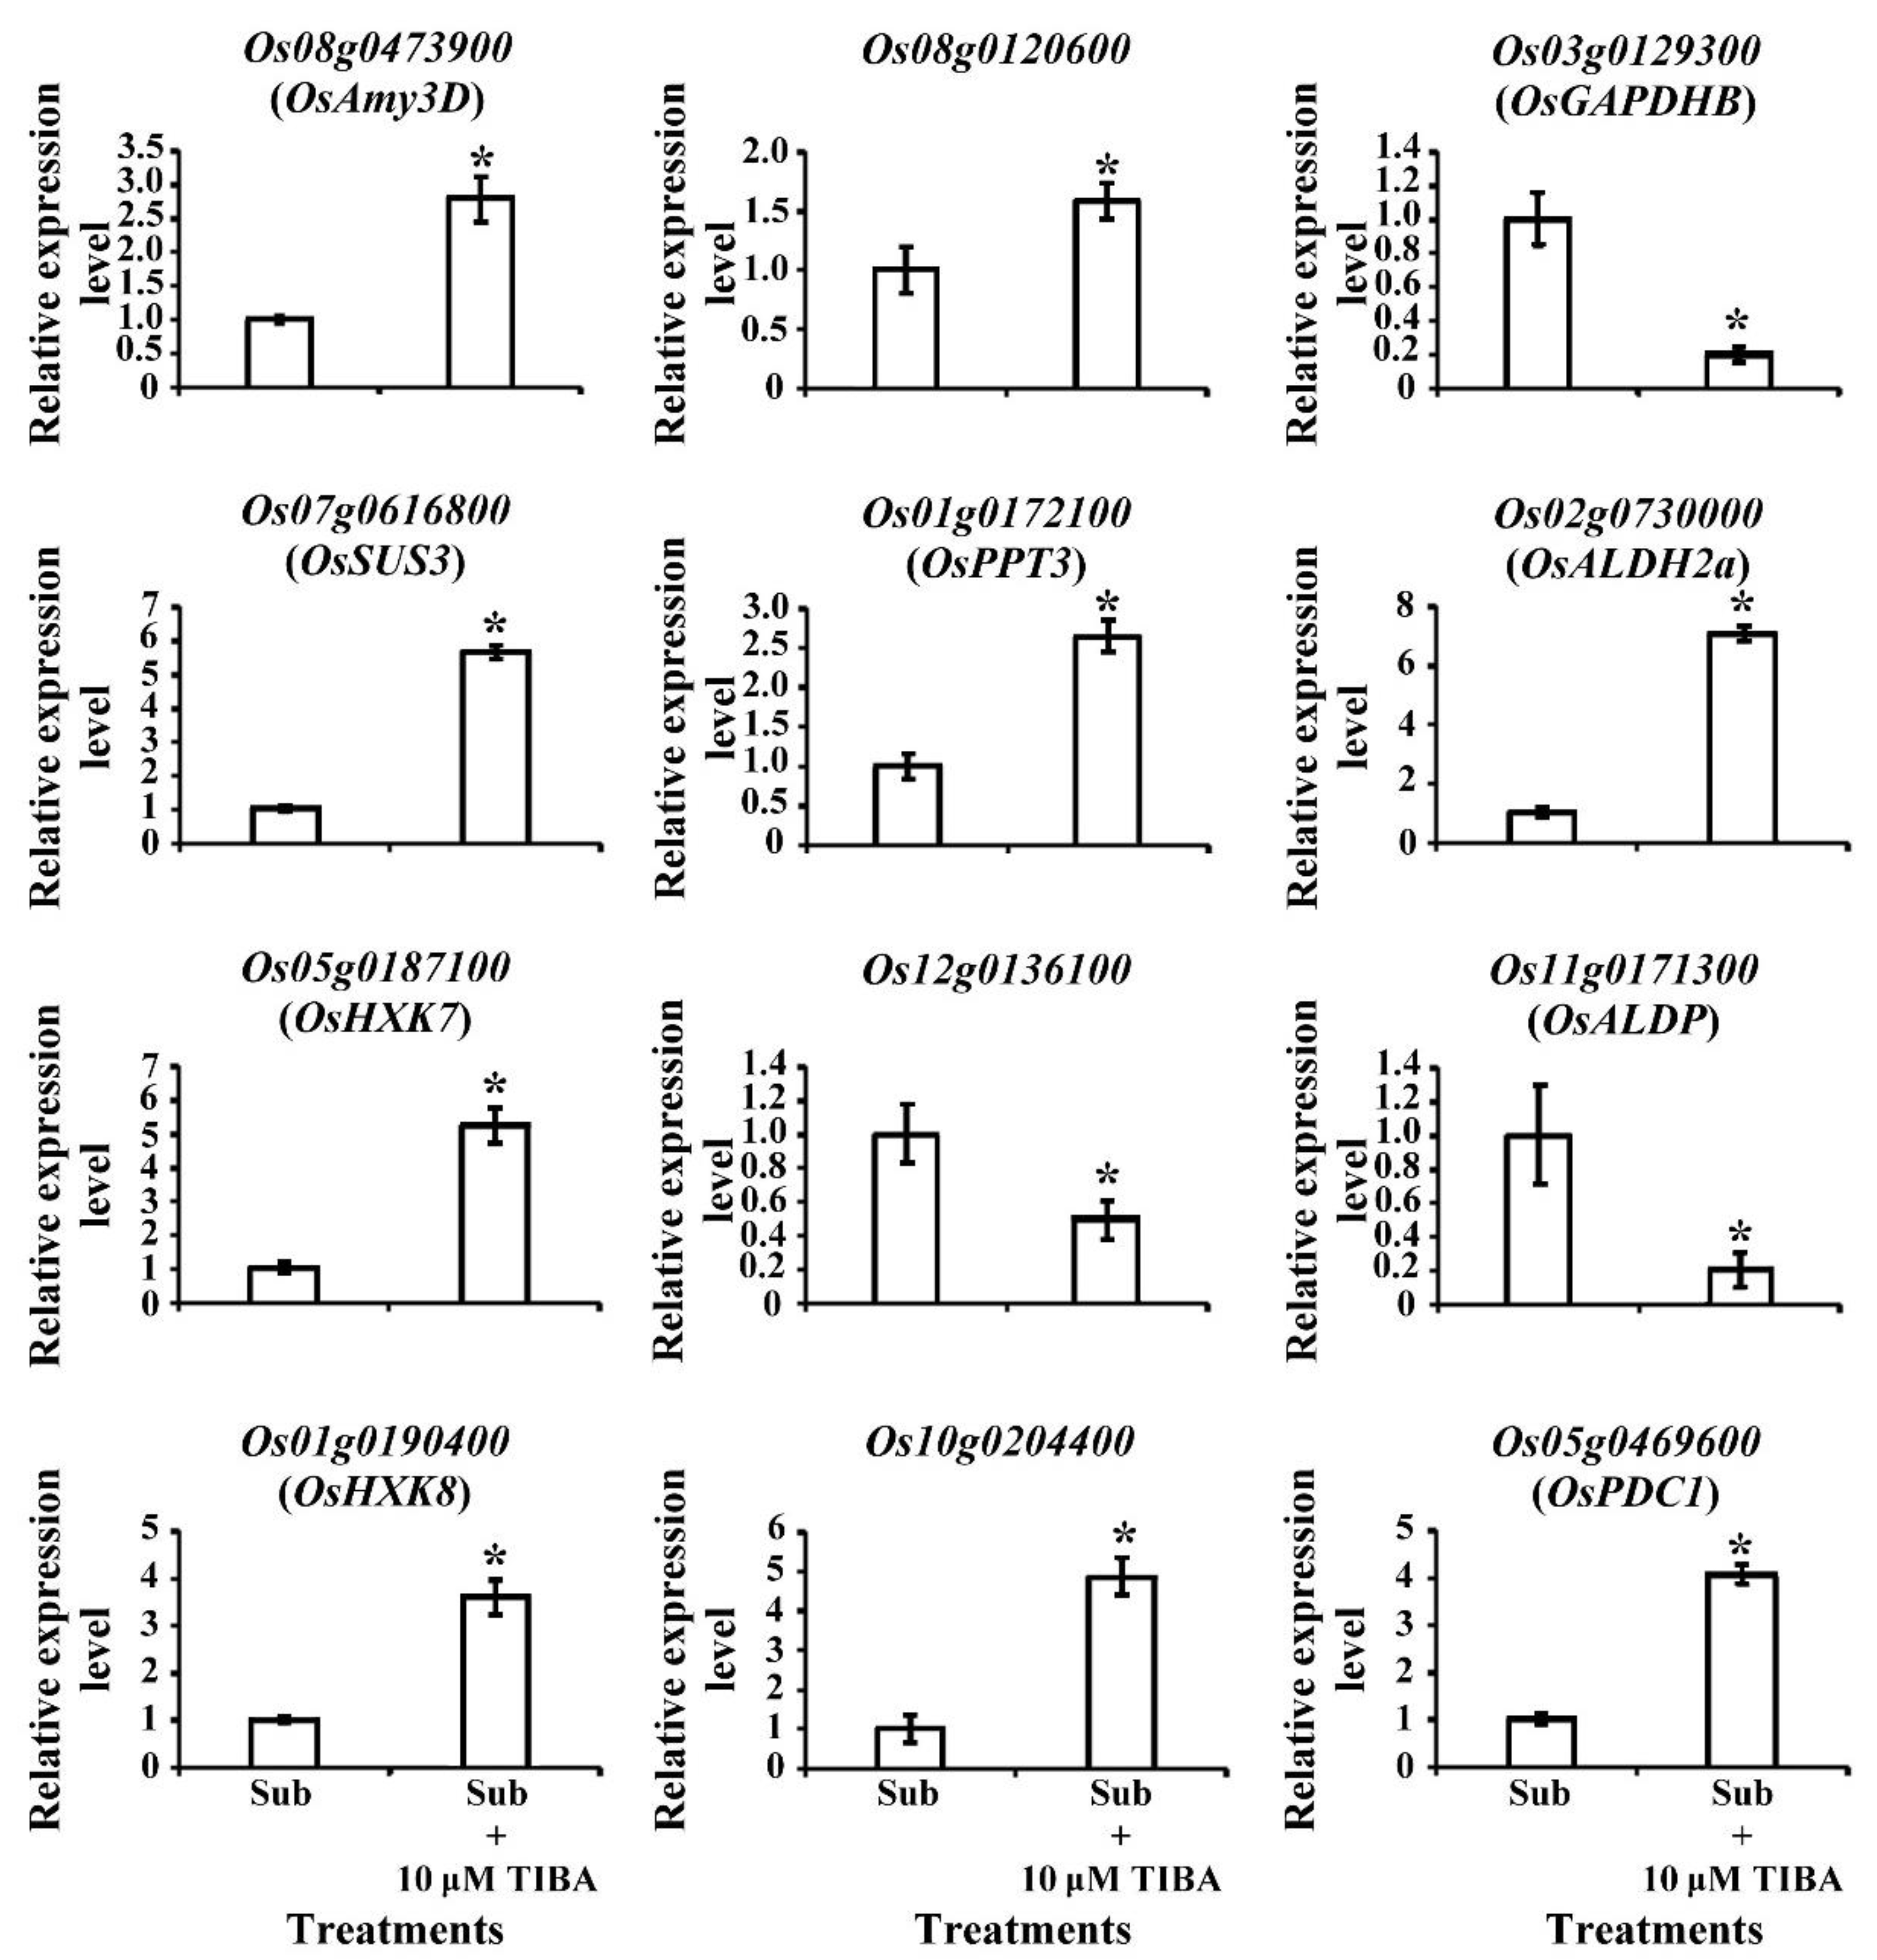
2.5. Transcript Levels of Carbohydrate-Metabolism-Associated Genes Regulated by Auxin Signaling in Submerged Rice Coleoptiles

In transcriptomic analysis, genes that were related to carbohydrate metabolism exhibited significant expression changes when SUB + TIBA condition (Figure 5). Most of the genes were presented up-regulation in carbohydrate metabolism pathways, including amylase (Os08g0473900; OsAmy3D), which catalyzes the starch into maltose, and sucrose synthase (Os06g0194900, Os03g0401366, Os06g0195150, and Os07g0616800), which has a role in producing UDP-glucose. In the glycolysis pathway, glucose-6-phosphate isomerase (Os03g0776000, Os06g0256500), 2-phosphoglycerate dehydratase (Os06g0136600), and pyruvate orthophosphate dikinase (Os05g0405000) also exhibited an upregulation in the SUB + TIBA condition. Under oxygen-limited conditions, fermentation produces nicotinamide adenine dinucleotide (NAD+) for maintaining glycolysis and converts the glycolysis-derived pyruvate into lactate, ethanol, or acetate. We identified pyruvate decarboxylase (Os03g0293500, Os05g0469600, Os01g0160100, and Os05g0469800), which catalyzes pyruvate into acetaldehyde, and lactic acid dehydrogenase (Os02g0730000 and Os09g0440300), which catalyzes pyruvate into lactate. The TCA cycle–related genes, ATP-citrate synthase (Os11g0693800), and nodule-enhanced malate dehydrogenase (Os07g0630800 and Os08g0562100) were downregulated, but phosphoenolpyruvate carboxykinase (Os10g0204400) was upregulated when receiving TIBA treatment (Figure 5).

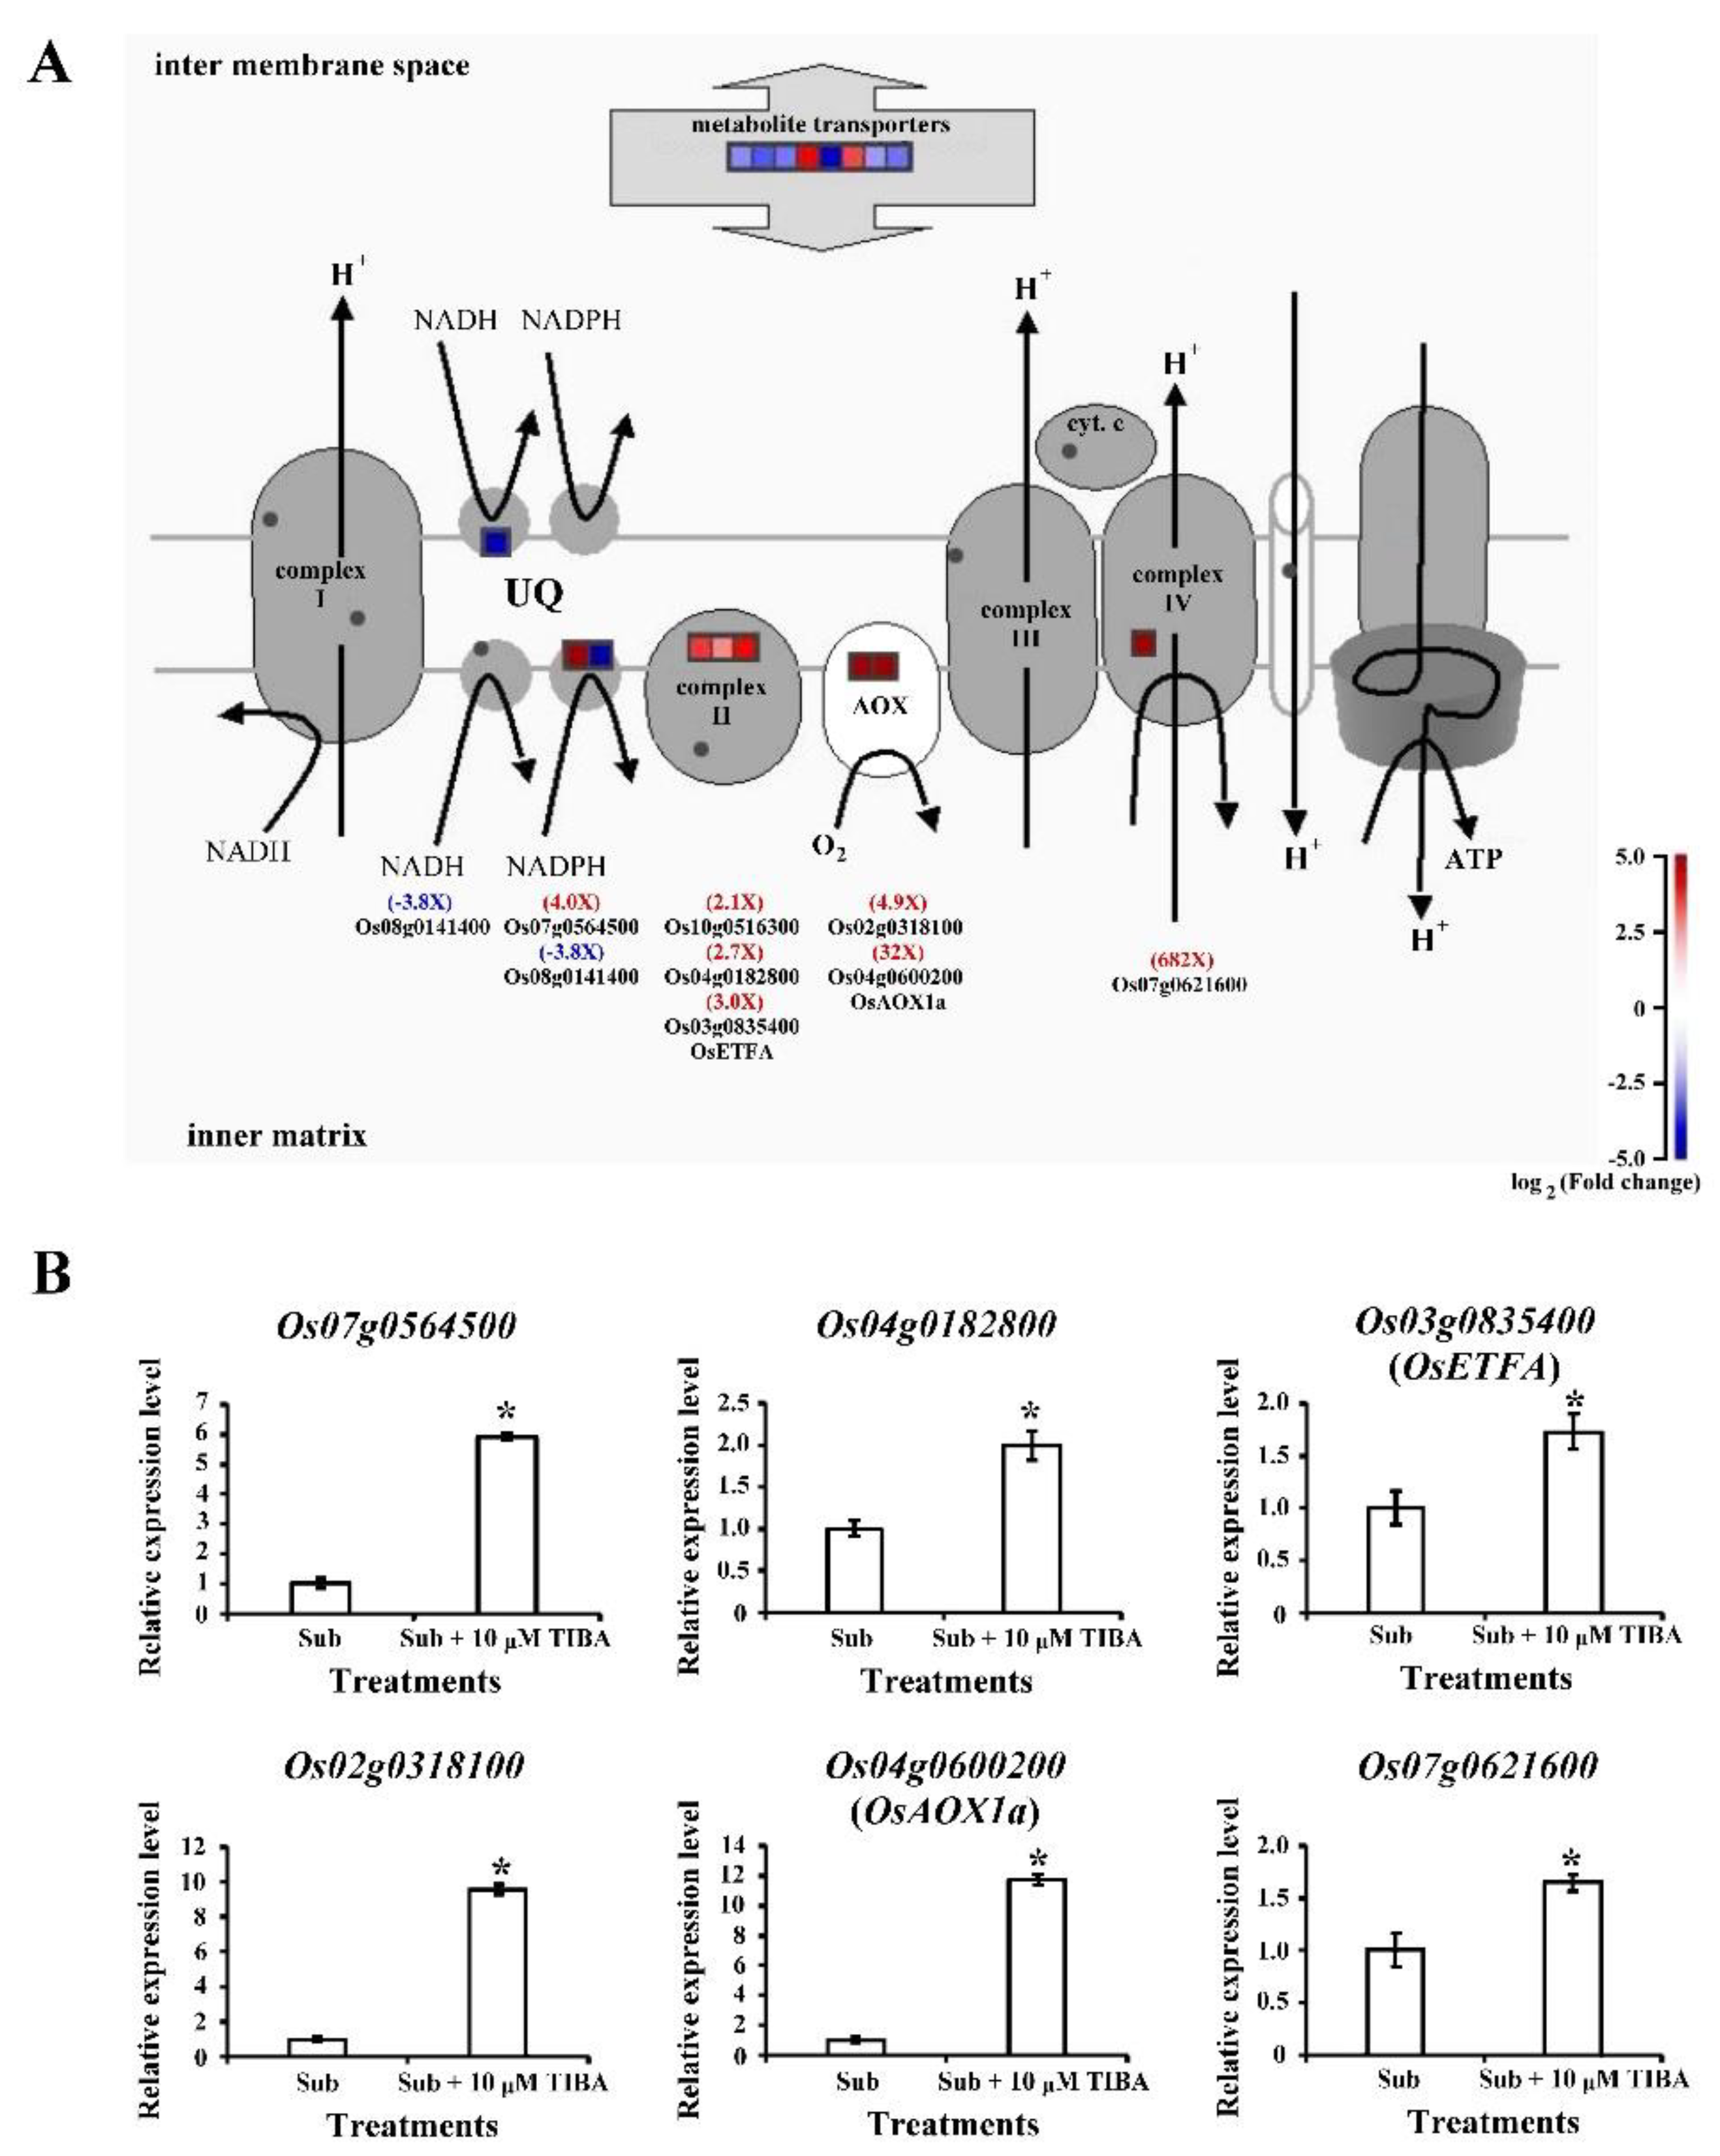
2.6. Transcript Levels of Mitochondrial-Electron-Transport–Associated Genes Regulated by Auxin Signaling in Submerged Rice Coleoptiles

Mitochondrial electron transport flux was reduced in low-oxygen conditions [13]. We identified the DEGs involved in mitochondrial electron transport and then performed a qRT-PCR analysis to investigate whether auxin signaling is involved in cellular respiration processes. Genes encoding succinate dehydrogenase (mitochondrial complex II, Os04g0182800, and Os03g0835400), which is involved in reactive oxygen species (ROS) production, were upregulated. The genes encoding alternative oxidase, such as Os02g0318100 and Os04g0600200, were upregulated under SUB + TIBA treatment, where the function was transferred electrons from ubiquinone to oxygen, thereby preventing ROS production from the ubiquinone pool in mitochondria (Figure 7A,B).

3. Discussion

Rice germination under submergence was characterized by coleoptile elongation and delayed radicle emergence [14]. Under oxygen deprivation, the primary leaf fails to elongate, and a much longer coleoptile is produced. The elongated coleoptiles can reach the water surface and, subsequently, provide a path for O2 diffusion to the submerged parts [15,16]. The auxin phytohormone regulates many critical growth and developmental processes in rice. Auxin is synthesized in plant cells and actively transported between cells through polar transport. Auxin mediates rice root system growth, tiller number change, leaf shape growth, and grain size [17]. Cell division and the cell cycle are regulated by coleoptile elongation under submerged conditions. The base and tip parts of coleoptiles exhibited different transcriptomic profiles under hypoxia [18]. In our study, rice coleoptile elongation was significantly reduced for 3.0 fold change under submergence treatment with an auxin polar transport inhibitor compared with submergence only in four days treatment (Figure 1). The coleoptiles had a shorter and curlier phenotype in the submergence with auxin polar transport inhibitor condition, indicating that auxin signaling is involved in the rice coleoptile elongation response.
ROS participate in plant stress responses and the ROS scavenging enzyme that are involved in the detoxification of excess ROS to maintain cellular redox homeostasis. Glutathione S-transferases are ubiquitous enzymes that play a key role in cellular detoxification. The transcript levels of Os03g0785900 and Os09g0367700 were enhanced by herbicide treatment in Avenafatua plants [19]. Under drought stress, the transcript level of Os10g0527400 increased in mutant osrbohA as compared with wild type [20]. Our results revealed significantly upregulated genes, such as 1-cysperoxiredoxin (Os07g0638300), cytochrome P450 (Os01g0628000), and glutathione S-transferase (Os03g0785900, Os09g0367700, and Os10g0527400), involved in redox processes (Table 1). It is demonstrated that those ROS scavenging enzymes that were involved in rice coleoptile elongation were regulated by auxin signaling during submergence stress. Our data shown significantly downregulated genes in coleoptiles under SUB + TIBA treatment including ethylene response transcription factor (Os01g0968800, Os02g0781300, and Os09g0522200), myb-like DNA-binding domain containing protein (Os05g0442400), WRKY transcription factor (Os01g0821300), and LBD family transcription factor (Os12g0106200) (Table 2). The study indicated that rice seedlings with Os01g0968800 line overexpression had an increased tolerance to salt stress [21]. The transcript levels of Os01g0968800 and Os09g0522200 were significantly increased in rice seedlings under low-temperature stress [22]. Os12g0106200 encoded for LBD proteins that are essential for adventitious root formation and it was upregulated in rice seedling roots under water-deficient conditions [23]. Our data presented that these genes were not only involved in abiotic stress, but also regulated by auxin signaling under submergence. In addition, the genes encoding laccase (Os03g0273200, Os05g0458600, Os05g0458300, Os01g0374600, Os03g0297900, Os01g0850800, and Os11g0108700) were downregulated under SUB + TIBA treatment (Figure 3 and Table S4). Reduced expression levels of laccases result in low lignification phenotypes, increased stem thickness, and they have a tendency to lodge and reduce stem and leaf length [24]. Our results further indicated that laccase genes are regulated by auxin signaling and affected the coleoptile appearance change under submergence.
The auxin phytohormone is involved in many stages of plant development, including root growth, apical dominance, and seed germination [25]. Auxin-induced seed dormancy and delayed seed germination are affected by ABA and GA signal transduction in wheat and Arabidopsis plants [26,27]. We obtained shorter and curlier coleoptile phenotypes under TIBA treatment as compared with submergence treatment only (Figure 1A). The transcript levels of the cell-cycle-related gene (Os06g0236600) were significantly downregulated. The cell-cycle-related gene Os06g0236600 encodes cyclin-D1-1, which is a rate-limiting component in the G1 phase. In rice, members of the CDK proteins regulate root and shoot meristem cell mitosis [28]. The results imply that auxin signaling is involved in cell mitosis under submergence.
When submerged, coleoptiles must mobilize sugar and elongate to enhance the chances of seedling survival. The transporters eventually export sucrose loading and unloading through sucrose transporters or sugars (SWEET proteins) [29]. Many studies have reported that SWEET proteins are involved in plant development and biotic stress. OsSWEET11 affects pollen development [30], and OsSWEET14-knockout mutant reduces the seed size and delays growth [31]. Under abiotic stress, OsSWEET11, OsSWEET13, and OsSWEET14 enhance rice resistance to bacterial blight [31,32]. In this study, four SWEET genes, namely Os12g0476200 (OsSWEET13), Os11g0508600 (OsSWEET14), Os01g0700100 (OsSWEET2b), and Os01g0606000 (OsSWEET6a), were downregulated in rice coleoptiles under SUB + TIBA treatment. We demonstrated that Os12g0476200 and Os11g0508600 genes are affected by not only biotic stress, but also auxin signaling under submergence (Table 3 and Figure 4). In addition, auxin signaling might mediate rice coleoptile phenotypes through sucrose transport (SWEET proteins). Furthermore, some transcript levels of mitochondrial electron transport complex II members (Os10g0516300, Os04g0182800, and Os03g0835400) and alternative oxidase members (Os02g0318100 and Os04g0600200) are upregulated in SUB + TIBA treatment (Figure 7A,B). Our results also demonstrated that auxin signaling is involved in the regulation of mitochondria energy production and the AOX signaling pathway in rice coleoptile under submergence.
Taken together, our results presented that auxin signaling was involved in the effect of genes that are related to secondary metabolism, development, carbohydrate metabolism, and mitochondrial electron transport, and also regulated the elongation of rice coleoptiles under submergence. It can provide important information for the breeding program of wet direct-seed system.

4. Materials and Methods

4.1. Plant Materials and Growth Conditions

We used rice cultivar Taikeng 9 (Oryza sativa L. japonica; Taiwan) as the plant material in this study. Taikeng 9 has high quality, good taste, and it was one of the famous cultivars in Taiwan. The seeds were removed from the husk to obtain husked rice. The surface of the husked rice was sterilized with 3% sodium hypochlorite for 40 min in a 50-mL centrifuge tube and washed several times with sterile deionized water in laminar flow. After being subjected to cleaning and sterilization, the seeds were imbibed in sterile deionized water and then covered with a black cloth for one day at 28 °C in a 16-h-light/8-h-dark cycle in a growth chamber. For the submergence treatments with (SUB + TIBA) and without TIBA (SUB), the seeds were placed in test tubes (five seeds per tube) after imbibition, and the tubes were filled with a Kimura B solution with or without 10 μM TIBA to reach 10 cm in height. TIBA are used as an auxin polar transport inhibitor [33]. The test tubes were covered with black cloth in a growth chamber for two, three, four, five, and six days.

4.2. Measurement Length of Coleoptiles

The coleoptile length was measured while using an ordinary ruler after submergence treatment with or without TIBA for two, three, four, five, and six days, and the lengths of each coleoptile were recorded for the indicated times. The experiments were repeated three times, and at least 30 coleoptiles were measured independently each time. The coleoptiles were collected after five days of treatment, frozen in liquid nitrogen, and then stored at −80 °C for RNA isolation. The submerged coleoptile samples with and without TIBA treatment were analyzed at least six times independently.

4.3. Transcriptomic Analysis by RNA Sequencing

The total RNA for each five-day treatment was extracted while using the RNeasy Protect Mini Kit (Qiagen, Hilden, Germany). The RNA concentration was measured using the NanoDrop Lite (Thermo, Waltham, MA, USA), and RNA integrity was assessed while using the RNA Nano 6000 Assay Kit in the Agilent 2100 Bioanalyzer system (Agilent Technologies, Santa Clara, CA, USA). RNA samples with 260/280 ratios greater than 2.0 and RNA integrity numbers greater than 9.0 measured using a bioanalyzer were used. RNA sample quality was required to be greater than 200 ng/µL, and a total amount of 1 µg RNA per sample was used as input material for the RNA sample preparations. Library preparation for RNA-seq was performed while using the NEBNext® UltraTM RNA Library Preparation Kit (San Diego, USA) and followed the manufacturer’s recommendations and index codes were added to attribute sequences to each sample. The final library quality was assessed on the Agilent Bioanalyzer 2100 system while using DNA High Sensitivity Chips. RNA sequencing on an Illumina HiSeqTM 2000 were commercially performed (BGI; https://www.bgi.com/bgi-online) to generate paired-end reads, with each being 100 base pairs in length. Removing the adapters and low quality reads with FASTX-Toolkit was utilized to filter the raw data (http://hannonlab.cshl.edu/fastx_toolkit/index.html). After RNA sequencing was conducted, all of the clean data were calculated while using Q20, Q30, GC-content, and sequence duplication levels and they were compared with the rice reference genome in the Rice Genome Annotation Project Database (MSU7.0, http://rice.plantbiology.msu.edu/)(Table S1).

4.4. Functional Analysis of Differentially Expressed Genes

Differentially expressed genes (DEGs) exhibiting 1.5-fold changes and Benjamini–Hochberg adjusted P values (FDR) of < 0.01 were selected. The functions of DEGs were identified while using the Gene Ontology (GO) and Kyoto Encyclopedia of Genes and Genomes (KEGG) databases. GO functional enrichment analysis was performed using Blast2GO (version 2.3.5, BioBam, valencia, Spain) (http://www.blast2go.org/) [34]. The KEGG pathway analyses of the DEGs were performed using the public pathway database (https://www.genome.jp/kegg/pathway.html). Significant genes can be integrated with high-throughput data analysis to produce diverse overviews by using MapMan (http://MapMan.gabipd.org) [35]. The genes were mapped to the OS-Nipponbare-Osa-RAPDB reference genome and used to visualize the involvement of the DEGs in the pathways by using MapMan version 3.6.0RC1.

4.5. Extraction of Total RNA and Quantitative Real-Time Polymerase Chain Reaction

The coleoptile samples for each treatment were frozen in liquid nitrogen and ground into powder, and the total RNA was extracted while using TRI Reagent (Invitrogen, MA, USA). For DNase treatment, the total RNA was reacted at 37 °C for 30 min. and at 70 °C for 10 min. to stop the reaction by using the TURBO DNA-free kit (Ambion, Austin, TX, USA). First-strand complementary DNA (cDNA) was synthesized with the Moloney murine leukemia virus (MMLV) first-strand synthesis kit (Gene DireX, Las Vegas, NV, USA). The RNA concentration was spectrophotometrically determined, and the 260/280-nm absorbance ratio exhibited expected values between 1.8 and 2.0. The first-strand cDNA synthesis process was performed, as follows: 2 µg of total RNA was mixed with 1 µL of Oligo dT (1 µg/µL) and 1 µL of 10 mM dNTP, then reacted for 10 min. at 70 °C and for 5 min. at 4 °C. After the reaction, we mixed 4 µL of 5× reaction buffer, 2 µL of 0.1 M dithiothreitol (DTT), 1.75 µL of diethylpyrocarbonate (DEPC) H2O, and 0.25 µL of MMLV reverse transcriptase into the solution and reacted it for 1 h at 37 °C and 10 min. at 65 °C. Finally, 80 µL of sterilized deionized water was added to a 0.2-mL microcentrifuge tube for the subsequent quantitative real-time polymerase chain reaction (qRT-PCR) experiment. For the qRT-PCR, the cDNA was amplified while using the CFX ConnectTM real-time system (Bio-Rad, Hercules, CA, USA), and the data were analyzed using Bio-Rad CFX Manager 3.1. The reaction conditions were as follows: 5 min. of predenaturation at 94 °C, 45 cycles of 30 s at 94 °C, 30 s at 55 °C, and 30 s at 72 °C, followed by melting curve generation. Table S2 lists the primers used for qRT-PCR analyses. Primer 3 designed the primers in this study (http://bioinfo.ut.ee/primer3-0.4.0/) [36]. The ubiquitin-conjugating enzyme (Os02g0634800) gene was used as an internal control to normalize the cDNA levels. Furthermore, we used the delta-delta CT method to calculate the relative expression level between SUB and SUB + TIBA treatment samples [37]. The experiments were independently repeated at least six times.

5. Conclusions

The study results indicate that auxin signaling was involved in the effect of genes that are related to secondary metabolism, development, carbohydrate metabolism, and mitochondrial electron transport in submerged rice coleoptiles growth.

Supplementary Materials

Supplementary materials can be found at https://www.mdpi.com/1422-0067/21/4/1292/s1.

Author Contributions

Conceptualization, C.-Y.Y.; data curation, Y.-S.W.; formal analysis, Y.-S.W.; project administration, C.-Y.Y.; supervision, C.-Y.Y.; writing (original draft preparation), Y.-S.W. and C.-Y.Y. All authors have read and agreed to the published version of the manuscript.

Funding

This work was partially supported by the Ministry of Science and Technology under grant 108-2634-F-005-003 through the Pervasive AI Research (PAIR) Labs, Taiwan.

Conflicts of Interest

The authors declare that they have no conflict of interest. The funders had no role in the design of the study; in the collection, analyses, or interpretation of data; in the writing of the manuscript, or in the decision to publish the results.

Abbreviations

SUBSubmergence
TIBA2,3,5-triiodobenzoic acid
DEGsDifferentially expressed genes
qRT-PCRQuantitative real time polymerase chain reaction

References

  1. Miro, B.; Ismail, A.M. Tolerance of anaerobic conditions caused by flooding during germination and early growth in rice (Oryza sativa L.). Front. Plant Sci. 2013, 4, 269. [Google Scholar] [CrossRef] [PubMed] [Green Version]
  2. de Melo, R.B.; Franco, A.C.; Silva, C.O.; Piedade, M.T.; Ferreira, C.S. Seed germination and seedling development in response to submergence in tree species of the Central Amazonian floodplains. AoB Plants 2015, 7. [Google Scholar] [CrossRef] [PubMed] [Green Version]
  3. Mahender, A.; Anandan, A.; Pradhan, S.K. Early seedling vigour, an imperative trait for direct-seeded rice: An overview on physio-morphological parameters and molecular markers. Planta 2015, 241, 1027–1050. [Google Scholar] [CrossRef] [PubMed]
  4. Howden, S.M.; Soussana, J.F.; Tubiello, F.N.; Chhetri, N.; Dunlop, M.; Meinke, H. Adapting agriculture to climate change. Proc. Natl. Acad. Sci. USA 2007, 104, 19691–19696. [Google Scholar] [CrossRef] [PubMed] [Green Version]
  5. Yin, C.C.; Ma, B.; Collinge, D.P.; Pogson, B.J.; He, S.J.; Xiong, Q.; Duan, K.X.; Chen, H.; Yang, C.; Lu, X.; et al. Ethylene responses in rice roots and coleoptiles are differentially regulated by a carotenoid isomerase-mediated abscisic acid pathway. Plant Cell 2015, 27, 1061–1081. [Google Scholar] [CrossRef] [Green Version]
  6. Zhao, F.Y.; Cai, F.X.; Gao, H.J.; Zhang, S.Y.; Wang, K.; Liu, T.; Wang, X. ABA plays essential roles in regulating root growth by interacting with auxin and MAPK signaling pathways and cell-cycle machinery in rice seedlings. Plant Growth Regul. 2015, 75, 535–547. [Google Scholar] [CrossRef]
  7. Watanabe, H.; Takahashi, K. Effects of abscisic acid, fusicoccin, and potassium on growth and morphogenesis of leaves and internodes in dark-grown rice seedlings. Plant Growth Regul. 1997, 21, 109–114. [Google Scholar] [CrossRef]
  8. Ishizawa, K.; Esashi, Y. Cooperation of ethylene and auxin in the growth-regulation of rice coleoptile segments. J. Exp. Bot. 1983, 34, 74–82. [Google Scholar] [CrossRef]
  9. Perrot-Rechenmann, C. Cellular responses to auxin: Division versus expansion. Cold Spring Harb. Perspect. Biol. 2010, 2, a001446. [Google Scholar] [CrossRef]
  10. Haga, K.; Takano, M.; Neumann, R.; Iino, M. The Rice COLEOPTILE PHOTOTROPISM1 gene encoding an ortholog of Arabidopsis NPH3 is required for phototropism of coleoptiles and lateral translocation of auxin. Plant Cell 2005, 17, 103–115. [Google Scholar] [CrossRef] [Green Version]
  11. Waller, F.; Furuya, M.; Nick, P. OsARF1, an auxin response factor from rice, is auxin-regulated and classifies as a primary auxin responsive gene. Plant Mol. Biol. 2002, 50, 415–425. [Google Scholar] [CrossRef]
  12. Burdach, Z.; Kurtyka, R.; Siemieniuk, A.; Karcz, W. Role of chloride ions in the promotion of auxin-induced growth of maize coleoptile segments. Ann. Bot. 2014, 114, 1023–1034. [Google Scholar] [CrossRef] [PubMed] [Green Version]
  13. Bailey-Serres, J.; Voesenek, L. Flooding stress: Acclimations and genetic diversity. Annu. Rev. Plant Biol. 2008, 59, 313–339. [Google Scholar] [CrossRef] [PubMed] [Green Version]
  14. Magneschi, L.; Kudahettige, R.; Alpi, A.; Perata, P. Comparative analysis of anoxic coleoptile elongation in rice varieties: Relationship between coleoptile length and carbohydrate levels, fermentative metabolism and anaerobic gene expression. Plant Biol. 2009, 11, 561–573. [Google Scholar] [CrossRef] [PubMed]
  15. Nghi, K.N.; Tondelli, A.; Valè, G.; Tagliani, A.; Marè, C.; Perata, P.; Pucciariello, C. Dissection of coleoptile elongation in japonica rice under submergence through integrated genome-wide association mapping and transcriptional analyses. Plant Cell Environ. 2019, 42, 1832–1846. [Google Scholar] [CrossRef]
  16. Narsai, R.; Secco, D.; Schultz, M.D.; Ecker, J.R.; Lister, R.; Whelan, J. Dynamic and rapid changes in the transcriptome and epigenome during germination and in developing rice (Oryza sativa) coleoptiles under anoxia and re-oxygenation. Plant J. 2017, 89, 805–824. [Google Scholar] [CrossRef] [Green Version]
  17. Wang, Y.; Zhang, T.; Wang, R.; Zhao, Y. Recent advances in auxin research in rice and their implications for crop improvement. J. Exp. Bot. 2017, 69, 255–263. [Google Scholar] [CrossRef]
  18. Narsai, R.; Edwards, J.M.; Roberts, T.H.; Whelan, J.; Joss, G.H.; Atwell, B.J. Mechanisms of growth and patterns of gene expression in oxygen-deprived rice coleoptiles. Plant J. 2015, 82, 25–40. [Google Scholar] [CrossRef]
  19. Burns, E.; Keith, B.; Refai, M.; Bothner, B.; Dyer, W. Proteomic and biochemical assays of glutathione-related proteins in susceptible and multiple herbicide resistant Avena fatua L. Pestic. Biochem. Physiol. 2017, 140, 69. [Google Scholar] [CrossRef] [Green Version]
  20. Wang, X.; Zhang, M.M.; Wang, Y.J.; Gao, Y.T.; Li, R.; Wang, G.F.; Li, W.Q.; Liu, W.T.; Chen, K.M. The plasma membrane NADPH oxidase OsRbohA plays a crucial role in developmental regulation and drought-stress response in rice. Physiol. Plant. 2016, 156, 421–443. [Google Scholar] [CrossRef]
  21. Wang, Q.; Guan, Y.; Wu, Y.; Chen, H.; Chen, F.; Chu, C. Overexpression of a rice OsDREB1F gene increases salt, drought, and low temperature tolerance in both Arabidopsis and rice. Plant Mol. Biol. 2008, 67, 589–602. [Google Scholar] [CrossRef] [PubMed]
  22. Buti, M.; Pasquariello, M.; Ronga, D.; Milc, J.A.; Pecchioni, N.; Ho, V.T.; Pucciariello, C.; Perata, P.; Francia, E. Transcriptome profiling of short-term response to chilling stress in tolerant and sensitive Oryza sativa ssp. Japonica seedlings. Funct. Integr. Genom. 2018, 18, 627–644. [Google Scholar] [CrossRef] [PubMed]
  23. Ray, S.; Dansana, P.K.; Giri, J.; Deveshwar, P.; Arora, R.; Agarwal, P.; Khurana, J.P.; Kapoor, S.; Tyagi, A.K. Modulation of transcription factor and metabolic pathway genes in response to water-deficit stress in rice. Funct. Integr. Genom. 2011, 11, 157–178. [Google Scholar] [CrossRef] [PubMed]
  24. Swetha, C.; Basu, D.; Pachamuthu, K.; Tirumalai, V.; Nair, A.; Prasad, M.; Shivaprasad, P.V. Major domestication-related phenotypes in Indica rice are due to loss of mirna-mediated laccase silencing. Plant Cell 2018, 30, 2649–2662. [Google Scholar] [CrossRef] [PubMed] [Green Version]
  25. Strader, L.C.; Zhao, Y. Auxin perception and downstream events. Curr. Opin. Plant Biol. 2016, 33, 8–14. [Google Scholar] [CrossRef] [Green Version]
  26. Liu, X.; Zhang, H.; Zhao, Y.; Feng, Z.; Li, Q.; Yang, H.Q.; Luan, S.; Li, J.; He, Z.H. Auxin controls seed dormancy through stimulation of abscisic acid signaling by inducing ARF-mediated ABI3 activation in Arabidopsis. Proc. Natl. Acad. Sci. USA 2013, 110, 15485–15490. [Google Scholar] [CrossRef] [Green Version]
  27. Ramaih, S.; Guedira, M.; Paulsen, G.M. Relationship of indoleacetic acid and tryptophan to dormancy and preharvest sprouting of wheat. Funct. Plant Biol. 2003, 30, 939–945. [Google Scholar] [CrossRef]
  28. Umeda, M.; Umeda-Hara, C.; Yamaguchi, M.; Hashimoto, J.; Uchimiya, H. Differential expression of genes for cyclin-dependent protein kinases in rice plants. Plant Physiol. 1999, 119, 31–40. [Google Scholar] [CrossRef] [Green Version]
  29. Yu, S.M.; Lo, S.F.; Ho, T.H.D. Source–sink communication: Regulated by hormone, nutrient, and stress cross-signaling. Trends Plant Sci. 2015, 20, 844–857. [Google Scholar] [CrossRef]
  30. Chu, Z.; Yuan, M.; Yao, J.; Ge, X.; Yuan, B.; Xu, C.; Li, X.; Fu, B.; Li, Z.; Bennetzen, J.L. Promoter mutations of an essential gene for pollen development result in disease resistance in rice. Genes Dev. 2006, 20, 1250–1255. [Google Scholar] [CrossRef] [Green Version]
  31. Antony, G.; Zhou, J.; Huang, S.; Li, T.; Liu, B.; White, F.; Yang, B. Rice xa13 recessive resistance to bacterial blight is defeated by induction of the disease susceptibility gene Os-11N3. Plant Cell 2010, 22, 3864–3876. [Google Scholar] [CrossRef] [PubMed] [Green Version]
  32. Römer, P.; Recht, S.; Strauß, T.; Elsaesser, J.; Schornack, S.; Boch, J.; Wang, S.; Lahaye, T. Promoter elements of rice susceptibility genes are bound and activated by specific TAL effectors from the bacterial blight pathogen, Xanthomonas oryzae pv. oryzae. New Phytol. 2010, 187, 1048–1057. [Google Scholar] [CrossRef] [PubMed]
  33. Depta, H.; Elisele, K.H.; Hertel, R. Specific inhibitors of auxin transport: Action on tissue segments and in vitro binding to membranes from maize coleoptiles. Plant Sci. Lett. 1993, 31, 181–192. [Google Scholar] [CrossRef]
  34. Conesa, A.; Götz, S.; García-Gómez, J.M.; Terol, J.; Talón, M.; Robles, M. Blast2GO: A universal tool for annotation, visualization and analysis in functional genomics research. Bioinformatics 2005, 21, 3674–3676. [Google Scholar] [CrossRef] [Green Version]
  35. Thimm, O.; Bläsing, O.; Gibon, Y.; Nagel, A.; Meyer, S.; Krüger, P.; Selbig, J.; Müller, L.A.; Rhee, S.Y.; Stitt, M. MAPMAN: A user-driven tool to display genomics data sets onto diagrams of metabolic pathways and other biological processes. Plant J. 2004, 37, 914–939. [Google Scholar] [CrossRef]
  36. Untergasser, A.; Cutcutache, I.; Koressaar, T.; Ye, J.; Faircloth, B.C.; Remm, M.; Rozen, S.G. Primer3-new capabilities and interfaces. Nucleic Acids Res. 2012, 40, e115. [Google Scholar] [CrossRef] [Green Version]
  37. Livak, K.J.; Schmittgen, T.D. Analysis of relative gene expression data using real-time quantitative PCR and the 2(-Delta Delta C(T)) Method. Methods 2001, 25, 402–408. [Google Scholar] [CrossRef]
Figure 1. The effects of auxin polar transport inhibitor 2,3,5-triiodobenzoic acid (TIBA) on submerged rice coleoptiles. (A) Rice seeds after submergence (SUB) and submergence combined with 10 µM TIBA (SUB + TIBA) for five days. (B) Lengths of rice coleoptiles after SUB and SUB + TIBA treatment for 2–6 days. Bar = 1 cm. Data expressed as average values ± standard deviations from six biologically independent experiments. * p < 0.05 versus value in submergence treatment (Student’s t-test).
Ijms 21 01292 g001
Figure 2. Volcano plots and Gene Ontology (GO) classification of differentially expressed genes in 10 μM TIBA treatment compared with submergence treatment. (A) Volcano plots of differentially expressed genes between between SUB and SUB + TIBA treatment. The log2 fold change (FC) of each gene on x-axis and log10 false discovery rate (FDR) of each gene on y-axis. The log2 fold change ≥ 0.584 (up-regulated genes) and ≤−0.584 (down-regulated genes) and FDR less than 0.01 were considered as significantly differentially expressed gene. (B) GO classification of differentially expressed genes in upregulation. The filter condition was fold change ≥ 1.5 and FDR less than 0.01. (C) GO classification of the differentially expressed genes in downregulation. The filter condition was fold change ≤ 0.66 and FDR less than 0.01. Table S3 presents the complete list of differentially expressed genes in GO classification.
Ijms 21 01292 g002
Figure 3. Metabolism overview of differentially expressed genes between submergence treatment and submergence treatment with polar auxin transport inhibitor in coleoptiles, illustrated using MapMan. The log2 fold change (FC) color scale ranges from −5 to 5. Red and blue squares represent up- and down-regulated responses in coleoptiles under SUB + TIBA when compared with SUB only. Minor carbohydrate (Minor CHO), Miscellaneous enzyme (Misc), Oxidative pentose phosphate (OPP), Citric acid (TCA), One carbon metabolism (C-1 metabolism). Table S4 presents the complete list of genes and calculated FC.
Ijms 21 01292 g003
Figure 4. Transcript levels of development-associated genes regulated by auxin signaling in submerged coleoptiles. Total RNA was isolated from the coleoptiles after submergence treatment with or without 10 µM 2,3,5-triiodobenzoic acid (TIBA) for 5 days. Relative expression levels of Os06g0236600 (OsCYCD1-1), Os01g0281200 (OsCYCB1-3), Os12g0476200 (OsSWEET13), Os01g0700100 (OsSWEET2a), Os11g0508600 (OsSWEET14), and Os01g0606000 (OsSWEET6b) were determined while using quantitative RT-PCR. These genes were calculated and normalized with ubiquitin gene (Os02g0634800) as an internal standard. Values are presented as mean ± standard deviation based on 30 coleoptiles of each treatment obtained from six biologically independent experiments. * p < 0.05 versus the submergence treatment value (Student’s t-test).
Ijms 21 01292 g004
Figure 5. Differentially expressed genes involved in starch degradation, glycolysis, and fermentation pathways. Red text represents fold change (FC) and significant upregulation in SUB + TIBA treatment compared with SUB treatment. Blue text represents FC and significant downregulation. The qRT-PCR profile confirmed that the transcript levels of carbohydrate-metabolism–related genetic expression were similar to the RNA-Seq results. The transcript levels of amylase (Os08g0473900), sucrose synthase (Os07g0616800), hexokinase (Os05g0187100 and Os01g0190400), fructose-bisphosphate aldolase (Os08g0120600), phosphoenolpyruvate carboxykinase (Os10g0204400), lactic acid dehydrogenase (Os02g0730000), pyruvate decarboxylase (Os05g0469600), and phosphoenolpyruvate/phosphate translocator (Os01g0172100) were induced, and plastidic phosphate translocator (Os12g0136100), fructose-bisphosphate aldolase (Os11g0171300), and glyceraldehyde-3-phosphate dehydrogenase (Os03g0129300) were reduced under SUB + TIBA treatment (Figure 6). Our results indicate that auxin signaling is involved in energy production processes under submerged conditions. The red word showed upregulated genes, whereas the blue word showed downregulated genes.
Ijms 21 01292 g005
Figure 6. Transcript levels of glycolysis-pathway-associated genes in submerged coleoptiles with 10 μM TIBA. Total RNA was isolated from the coleoptile after 5 days of submergence treatment with or without 10 µM TIBA. The relative expression levels of glycolysis-pathway–-associated genes were determined using quantitative RT-PCR. These genes were calculated and normalized with ubiquitin gene (Os02g0634800) as an internal standard. Values are presented as mean ± standard deviation based on 30 coleoptiles of each treatment obtained from six biologically independent experiments. * p < 0.05 versus the submergence treatment value (Student’s t-test).
Ijms 21 01292 g006
Figure 7. Transcript levels of mitochondrial-electron-transport–associated genes regulated by auxin signaling in submerged coleoptiles. (A) The differentially expressed genes of mitochondrial electron transport in the SUB and SUB + TIBA treatments in coleoptiles were illustrated using MapMan. The log2 fold change color scale ranges from −5 to 5. Red and blue squares represent up- or down-regulated response, respectively, in coleoptiles submerged with 10 μM TIBA compared with those submerged without TIBA treatment. (B) Relative expression levels of mitochondrial-electron-transport–associated genes were determined using a quantitative real-time polymerase chain reaction. Total RNA was isolated from the coleoptiles after 5 days of submergence treatment with or without 10 µM TIBA. The expression levels of Os04g0182800, Os02g0318100, Os07g0564500, Os03g0835400 (OsETFA), Os04g0600200 (OsAOX1a), and Os07g0621600 were determined. These genes were calculated and normalized with ubiquitin gene (Os02g0634800) as an internal standard. The red word showed upregulated genes, whereas the blue word showed downregulated genes. The values are presented as mean ± standard deviation based on 30 coleoptiles for each treatment obtained from six biologically independent experiments. * p < 0.05 versus the submergence treatment value (Student’s t-test).
Ijms 21 01292 g007
Table 1. The differentially expressed gene was significantly upregulation between submergence (SUB) and submergence with 10 μM TIBA (SUB + TIBA) in coleoptiles.
GO FunctionGene IDNameDescriptionFPKMFold ChangeFDR
SUBTIBA
Biotic or abiotic stressOs06g0195800OsDJC53DnaJ domain protein0.018.85885.0 4.9 × 10⁻¹⁴
Os11g0592200OsPR4Pathogenesis-related protein0.016.27627.0 8.1 × 10⁻⁸
Hormone metabolismOs11g0453900OsRAB16DResponsive to ABA 16D 0.013.15315.0 3.3 × 10⁻⁵
Os04g0339400OsAKRAaldo-keto reductase1.58387.55245.3 0.0
Protein degradationOs08g0126000 E3 ubiquitin-protein ligase0.013.51351.0 1.6 × 10⁻¹⁵
Os09g0243200 E3 ubiquitin-protein ligase0.012.7270.0 8.8 × 10⁻⁴
RedoxOs07g0638300 1-Cys peroxiredoxin0.017.91791.0 3.1 × 10⁻⁵
Os01g0628000 Cytochrome P4500.013.85385.0 8.8 × 10⁻⁶
Os03g0785900 Glutathione S-transferase4.971269.51255.4 0.0
Os09g0367700 Glutathione S-transferase0.63148.56235.8 4.5 × 10−268
Os10g0527400 Glutathione S-transferase 0.2754.7202.6 2.2 × 10−119
RNA transcriptionOs06g0719900 Endo/excinuclease amino terminal domain-containing protein0.016.36636.0 1.2 × 10⁻¹⁴
Os05g0223200 Glycine-rich RNA-binding protein0.014.58458.0 6.1 × 10⁻⁷
Os05g0404700 Methyl-CpG-binding domain-containing protein0.012.07207.0 1.7 × 10⁻³
Secondary metabolismOs08g0112300 Acetyltransferase0.015.07507.0 7.9 × 10⁻¹⁶
Os03g0184550 Dihydroflavonol-4-reductase0.013.98398.0 2.8 × 10⁻⁹
Signalling transductionOs06g0225000OsSAR1dGTP-binding protein0.015.18518.0 6.1 × 10⁻⁷
Os04g0655400 G-type lectin S-receptor-like serine/threonine-protein kinase0.012.65265.0 1.7 × 10⁻⁵
OtherOs09g0324000 Oleosin0.017.99799.03.6 × 10−10
Os01g0695800 MDR-like ABC transporter 0.014.90490.02.1 × 10−8
Os07g0529000OsL85Isocitrate lyase0.014.21421.02.5 × 10−17
Os05g0366600 Beta-glucosidase0.013.59359.06.2 × 10−15
Os02g0586900 Glycine-rich cell wall structural protein0.47112.36239.12.3 × 10−146
Gene descriptions were extracted from the NCBI database and MSU Rice Genome Annotation Project Release 7 gene annotation.
Table 2. The differentially expressed gene was significantly downregulation between submergence (SUB) and submergence with 10 μM TIBA (SUB + TIBA) in coleoptiles.
GO FunctionGene IDNameDescriptionFPKMFold ChangeFDR
SUBTIBA
Biotic or abiotic stressOs07g0429600 Tthionin like peptide2.71 0.01 0.0037 7.4 × 10⁻³
Os07g0431160 Tthionin like peptide2.68 0.01 0.0037 2.2 × 10⁻³
Carbohydrate metabolismOs10g0113900 NAD(P)H-dependent oxidoreductase5.09 0.01 0.0020 1.1 × 10⁻¹²
Cell wall metabolismOs10g0545500 Xyloglucan endotransglucosylase/hydrolase protein5.04 0.01 0.0020 2.9 × 10⁻⁷
Os01g0946500 Glucan endo-1,3-beta-glucosidase2.48 0.01 0.0040 7.3 × 10⁻⁶
Os08g0253800 Xyloglucan glycosyltransferase2.07 0.01 0.0048 2.9 × 10⁻⁷
DevelopmentOs01g0606000OsSWEET6aBidirectional sugar transporter2.49 0.01 0.0040 2.6 × 10⁻⁵
Hormone metabolismOs09g0437100OsSAUR37Small auxin-up RNA2.86 0.01 0.0035 1.8 × 10⁻⁴
Lipid metabolismOs01g0882100 Esterase8.07 0.01 0.0012 7.4 × 10⁻³
Os07g0174400 Lipid transfer protein7.27 0.01 0.0014 2.6 × 10⁻⁵
Os04g0554500 Lipid transfer protein 2.98 0.01 0.0034 3.4 × 10⁻⁴
Os11g0299300 Phospholipase2.87 0.01 0.0035 3.0 × 10⁻⁹
PhotosynthesisOs04g0545600 Stellacyanin-like protein8.27 0.01 0.0012 5.7 × 10⁻¹³
Os01g0869800 Photosystem II 22 kDa protein4.26 0.01 0.0023 1.1 × 10⁻⁸
Os04g0545400 Stellacyanin2.72 0.01 0.0037 4.0 × 10⁻³
Os02g0758800 Blue copper protein2.00 0.01 0.0050 3.4 × 10⁻⁴
Protein degradationOs06g0278000 Glucoamylase8.43 0.01 0.0012 3.9 × 10⁻¹⁶
Os06g0257600 Esterase4.70 0.01 0.0021 5.7 × 10⁻¹³
Os01g0727840 Subtilisin-like protease2.20 0.01 0.0045 7.4 × 10⁻³
Protein synthesis and modificationOs09g0535400 Proline-rich receptor-like protein kinase2.18 0.01 0.0046 7.3 × 10⁻⁶
RedoxOs12g0263000 Glutathione synthase5.69 0.01 0.0018 5.5 × 10⁻¹⁵
Os03g0339300 Peroxidase2.36 0.01 0.0042 7.3 × 10⁻⁶
Os07g0677300 Peroxidase2.17 0.01 0.0046 2.6 × 10⁻⁵
Os06g0203200 Flavin-containing monooxygenase2.08 0.01 0.0048 4.1 × 10⁻⁸
RNA transcriptionOs01g0968800OsDREB1fDehydration-responsive element-binding protein6.54 0.01 0.0015 2.2 × 10⁻¹⁰
Os05g0442400OsMID1Myb-like DNA-binding domain containing protein3.74 0.01 0.0027 1.1 × 10⁻⁶
Os01g0821300OsWRKY86WRKY transcription factor3.23 0.01 0.0031 5.0 × 10⁻⁵
Os12g0106200OsLBD12-1Lateral organ boundaries domain (LBD) family transcription factor2.90 0.01 0.0034 6.3 × 10⁻⁴
Os09g0414500 Mini zinc finger protein2.59 0.01 0.0039 2.2 × 10⁻³
Os02g0781300OsERF11Ethylene-responsive transcription factor2.53 0.01 0.0040 6.3 × 10⁻⁴
Os04g0590800OsbHLH94Basic helix-loop-helix protein2.40 0.01 0.0042 2.2 × 10⁻³
Os09g0522200 Dehydration-responsive element-binding protein2.30 0.01 0.0043 3.4 × 10⁻⁴
Os09g0538000 Ribonuclease2.04 0.01 0.0049 9.5 × 10⁻⁵
Secondary metabolismOs04g0609300 Shikimate O-hydroxycinnamoyltransferase2.01 0.01 0.0050 2.0 × 10⁻⁶
Signaling transductionOs06g0339500 LRR receptor-like serine/threonine-protein kinase 2.55 0.01 0.0039 7.4 × 10⁻³
Os11g0105000OsCML25Calcium-binding protein2.24 0.01 0.0045 7.4 × 10⁻³
Os12g0104900OsCML26Calcium-binding protein2.24 0.01 0.0045 7.4 × 10⁻³
TransportOs05g0338933OsNRT1Proton-dependent oligopeptide transporter4.07 0.01 0.0025 4.0 × 10⁻³
Os02g0658100OsTIP2Aquaporin3.60 0.01 0.0028 7.3 × 10⁻⁶
Gene descriptions were extracted from the NCBI database and MSU Rice Genome Annotation Project Release 7 gene annotation.
Table 3. The differentially expressed genes of development responsive were compared with submergence (SUB) and submergence with 10 μM TIBA (SUB + TIBA) in rice coleoptiles.
Log2 (FC)Gene IDNameDescriptionFPKMFold ChangeFDR
SUBTIBA
Os06g0273200 Trichome birefringence-like protein0.011.54154.04.6 × 10−4 Ijms 21 01292 i001
Os01g0306400OsDOG1L-3Delay of germination 1-like protein0.011.37137.04.6 × 10−4
Os02g0616600 Meiosis arrested at leptotene like protein0.8587.01102.40.0
Os01g0762500OsGLUA-1Glutelin type-A-10.122.2518.73.7 × 10−6
Os01g0606000OsSWEET6aBidirectional sugar transporter2.490.010.0042.6 × 10−5
Os09g0307300 Microtubule-associated protein1.830.010.0051.8 × 10−4
Os03g0578500 Myosin1.950.010.0051.2 × 10−3
Os08g0477500OsPLP2Patatin-like protein1.540.010.0067.3 × 10−6
Os06g0234600OsTBL52Trichome birefringence-like protein1.530.010.0079.5 × 10−5
Os01g0803300 Walls are thin1 (WAT1)-related protein1.260.010.0082.2 × 10−3
Os09g0375300 Trichome birefringence-like protein1.120.010.0094.0 × 10−3
Os03g0291200 Trichome birefringence-like protein1.040.010.012.2 × 10−3
Os01g0281200OsCYCB1-3G2/mitotic-specific cyclin-B1-30.770.010.0137.4 × 10−3
Os08g0443800OsTET12Tetraspanin4.960.150.037.1 × 10−9
Os07g0671000 Flowering-promoting factor 1-like protein24.620.830.0346.1 × 10−15
Os01g0563000OsFKBP73Peptidyl-prolyl cis-trans isomerase77.112.590.0343.0 × 10−17
Os01g0968400 Root cap family protein5.330.260.0498.8 × 10−10
Os05g0557400OsNSL1Membrane attack complex/perforin (MACPF) domain containing protein2.080.130.0632.1 × 10−7
Os07g0691700OsWAVE5Suppressor of cAMP receptors (SCAR)-like domain containing protein0.760.050.0667.5 × 10−4
Os11g0508600OsSWEET14Bidirectional sugar transporter7.580.510.0674.0 × 10−16
Os05g0563000 NAC transcription factor1.450.10.0691.3 × 10−3
Os12g0476200OsSWEET13Bidirectional sugar transporter9.440.650.0694.9 × 10−22
Os01g0172800 Embryo-specific 3 family protein35.492.470.077.6 × 10−40
Os04g0422300 Walls are thin1 (WAT1)-related protein1.390.10.0722.3 × 10−3
Os01g0700100OsSWEET2bBidirectional sugar transporter1.550.130.0847.1 × 10−3
Os03g0229600 MFP1 attachment factor 1 (MAF1)-like protein 1.470.130.0884.0 × 10−5
Os06g0210000 Walls are thin1 (WAT1)-related protein2.730.240.0887.1 × 10−5
Os06g0236600OsCYCD1-1G1/S-specific cyclin-D1-13.160.280.0897.1 × 10−5
Os07g0601600 3-oxo-delta(4,5)-steroid 5-beta-reductase2.710.240.0897.1 × 10−5
The log2 fold change color scale ranges from −8 to 8. Gene descriptions were extracted from the NCBI database and MSU Rice Genome Annotation Project Release 7 gene annotation.

