In Vivo Modulation of Angiogenesis and Immune Response on a Collagen Matrix via Extracorporeal Shockwaves


 ,
,  ,
,
Abstract
: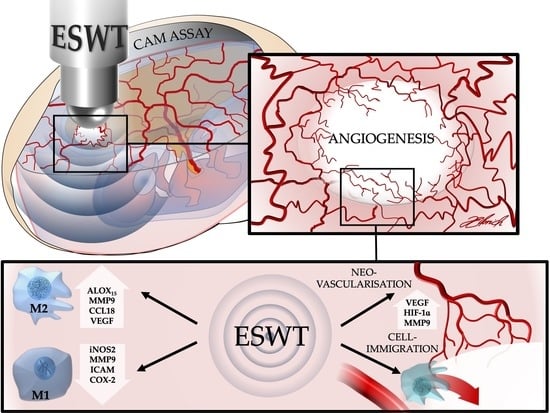
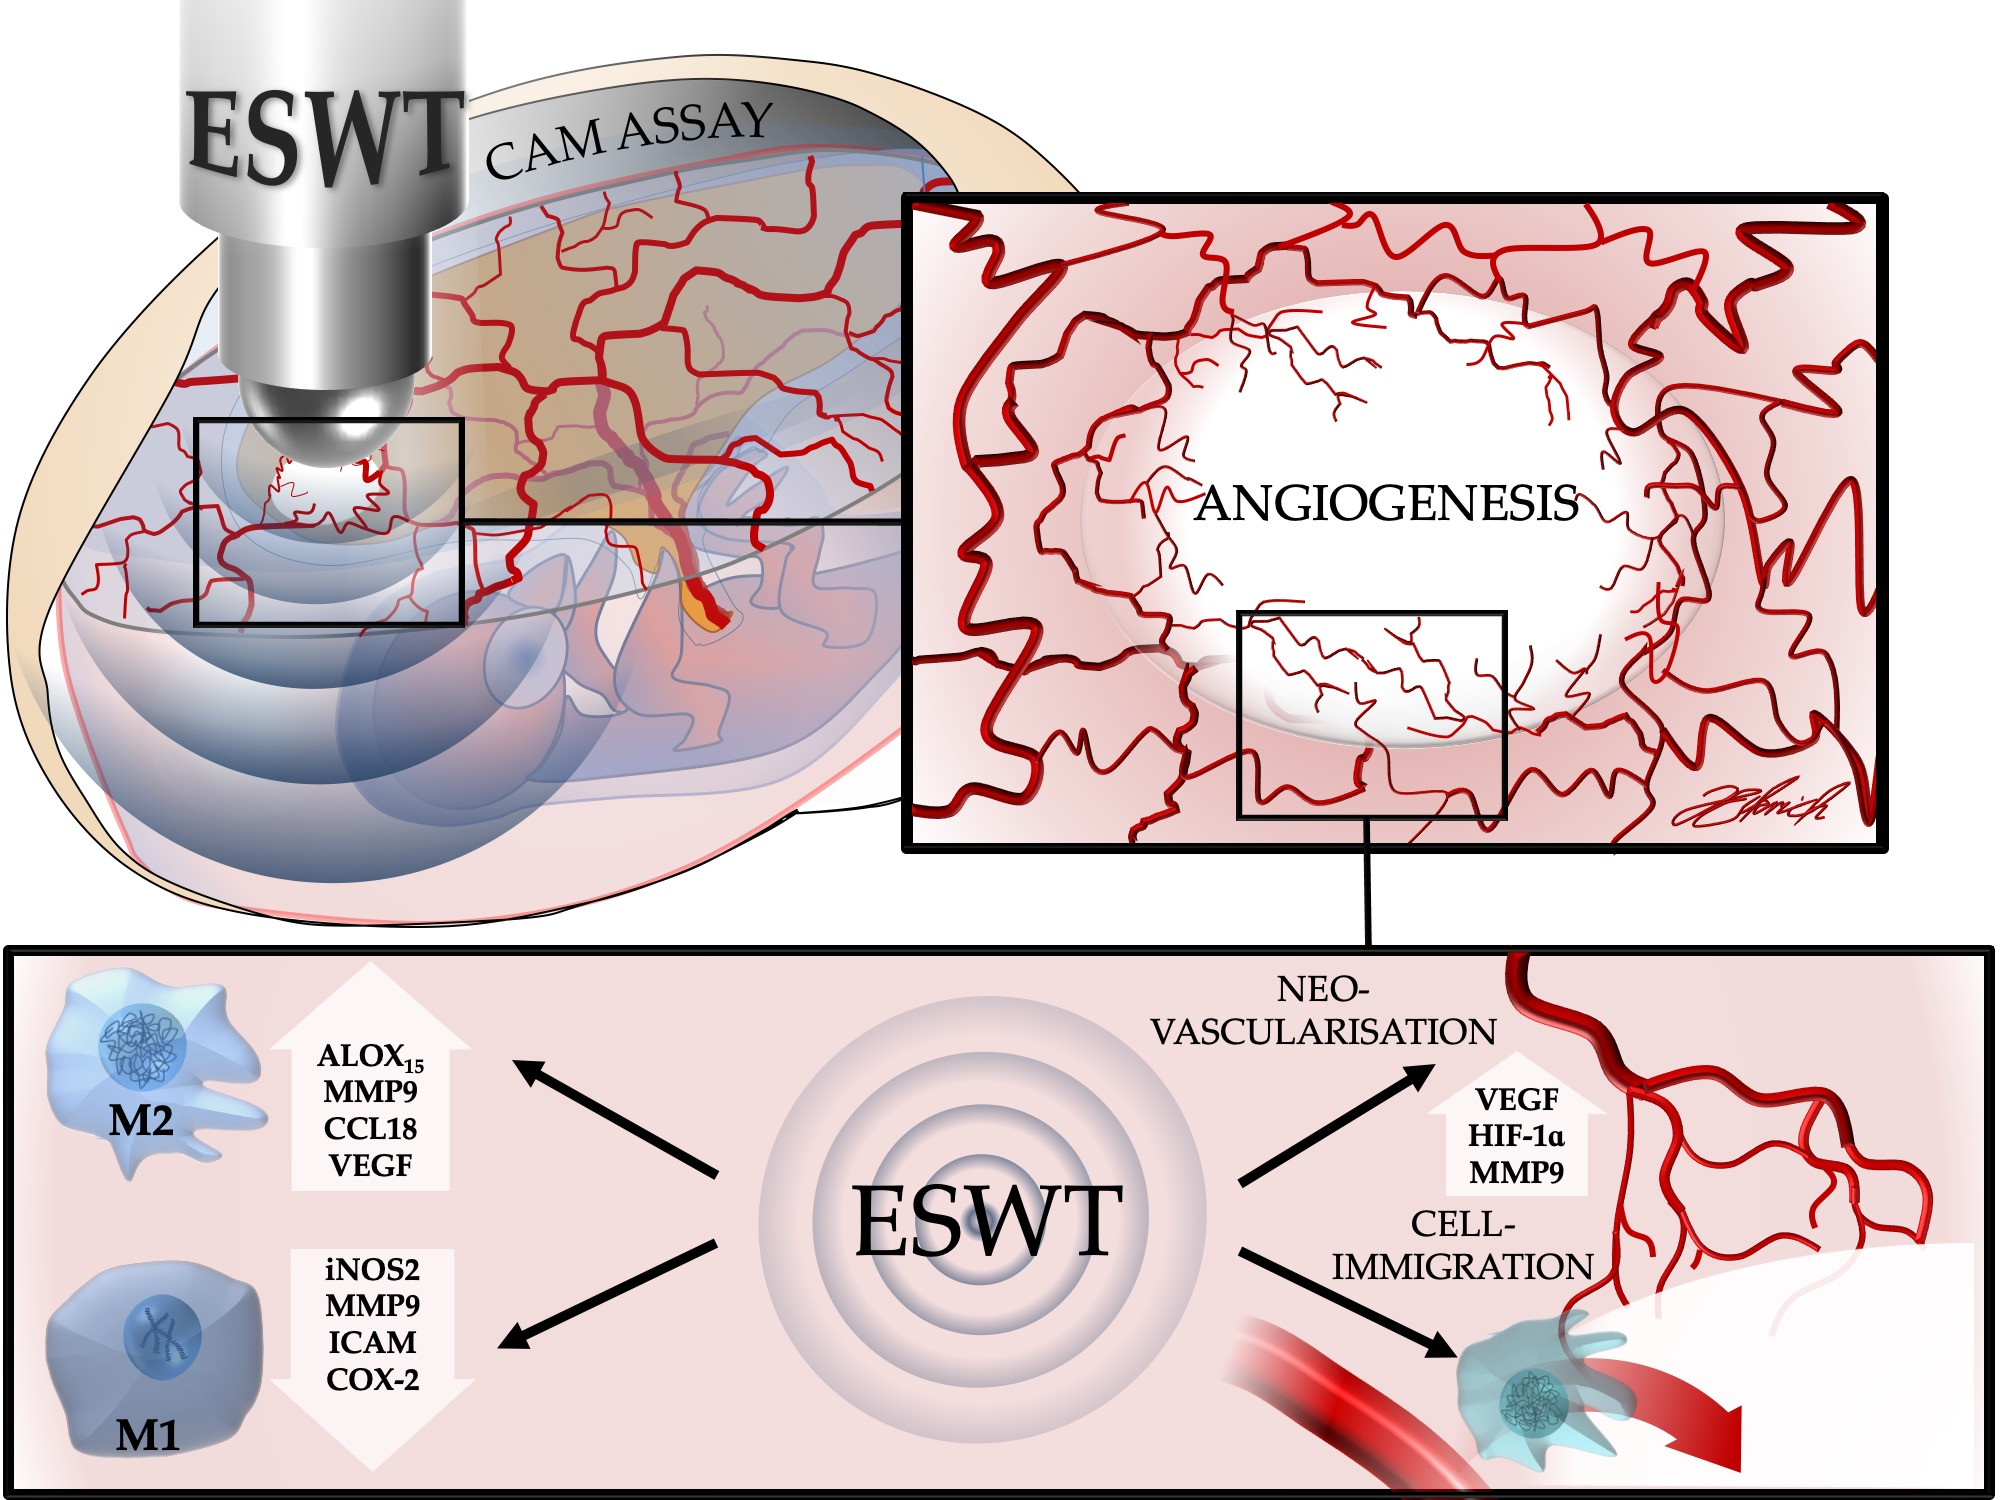
1. Introduction
2. Results
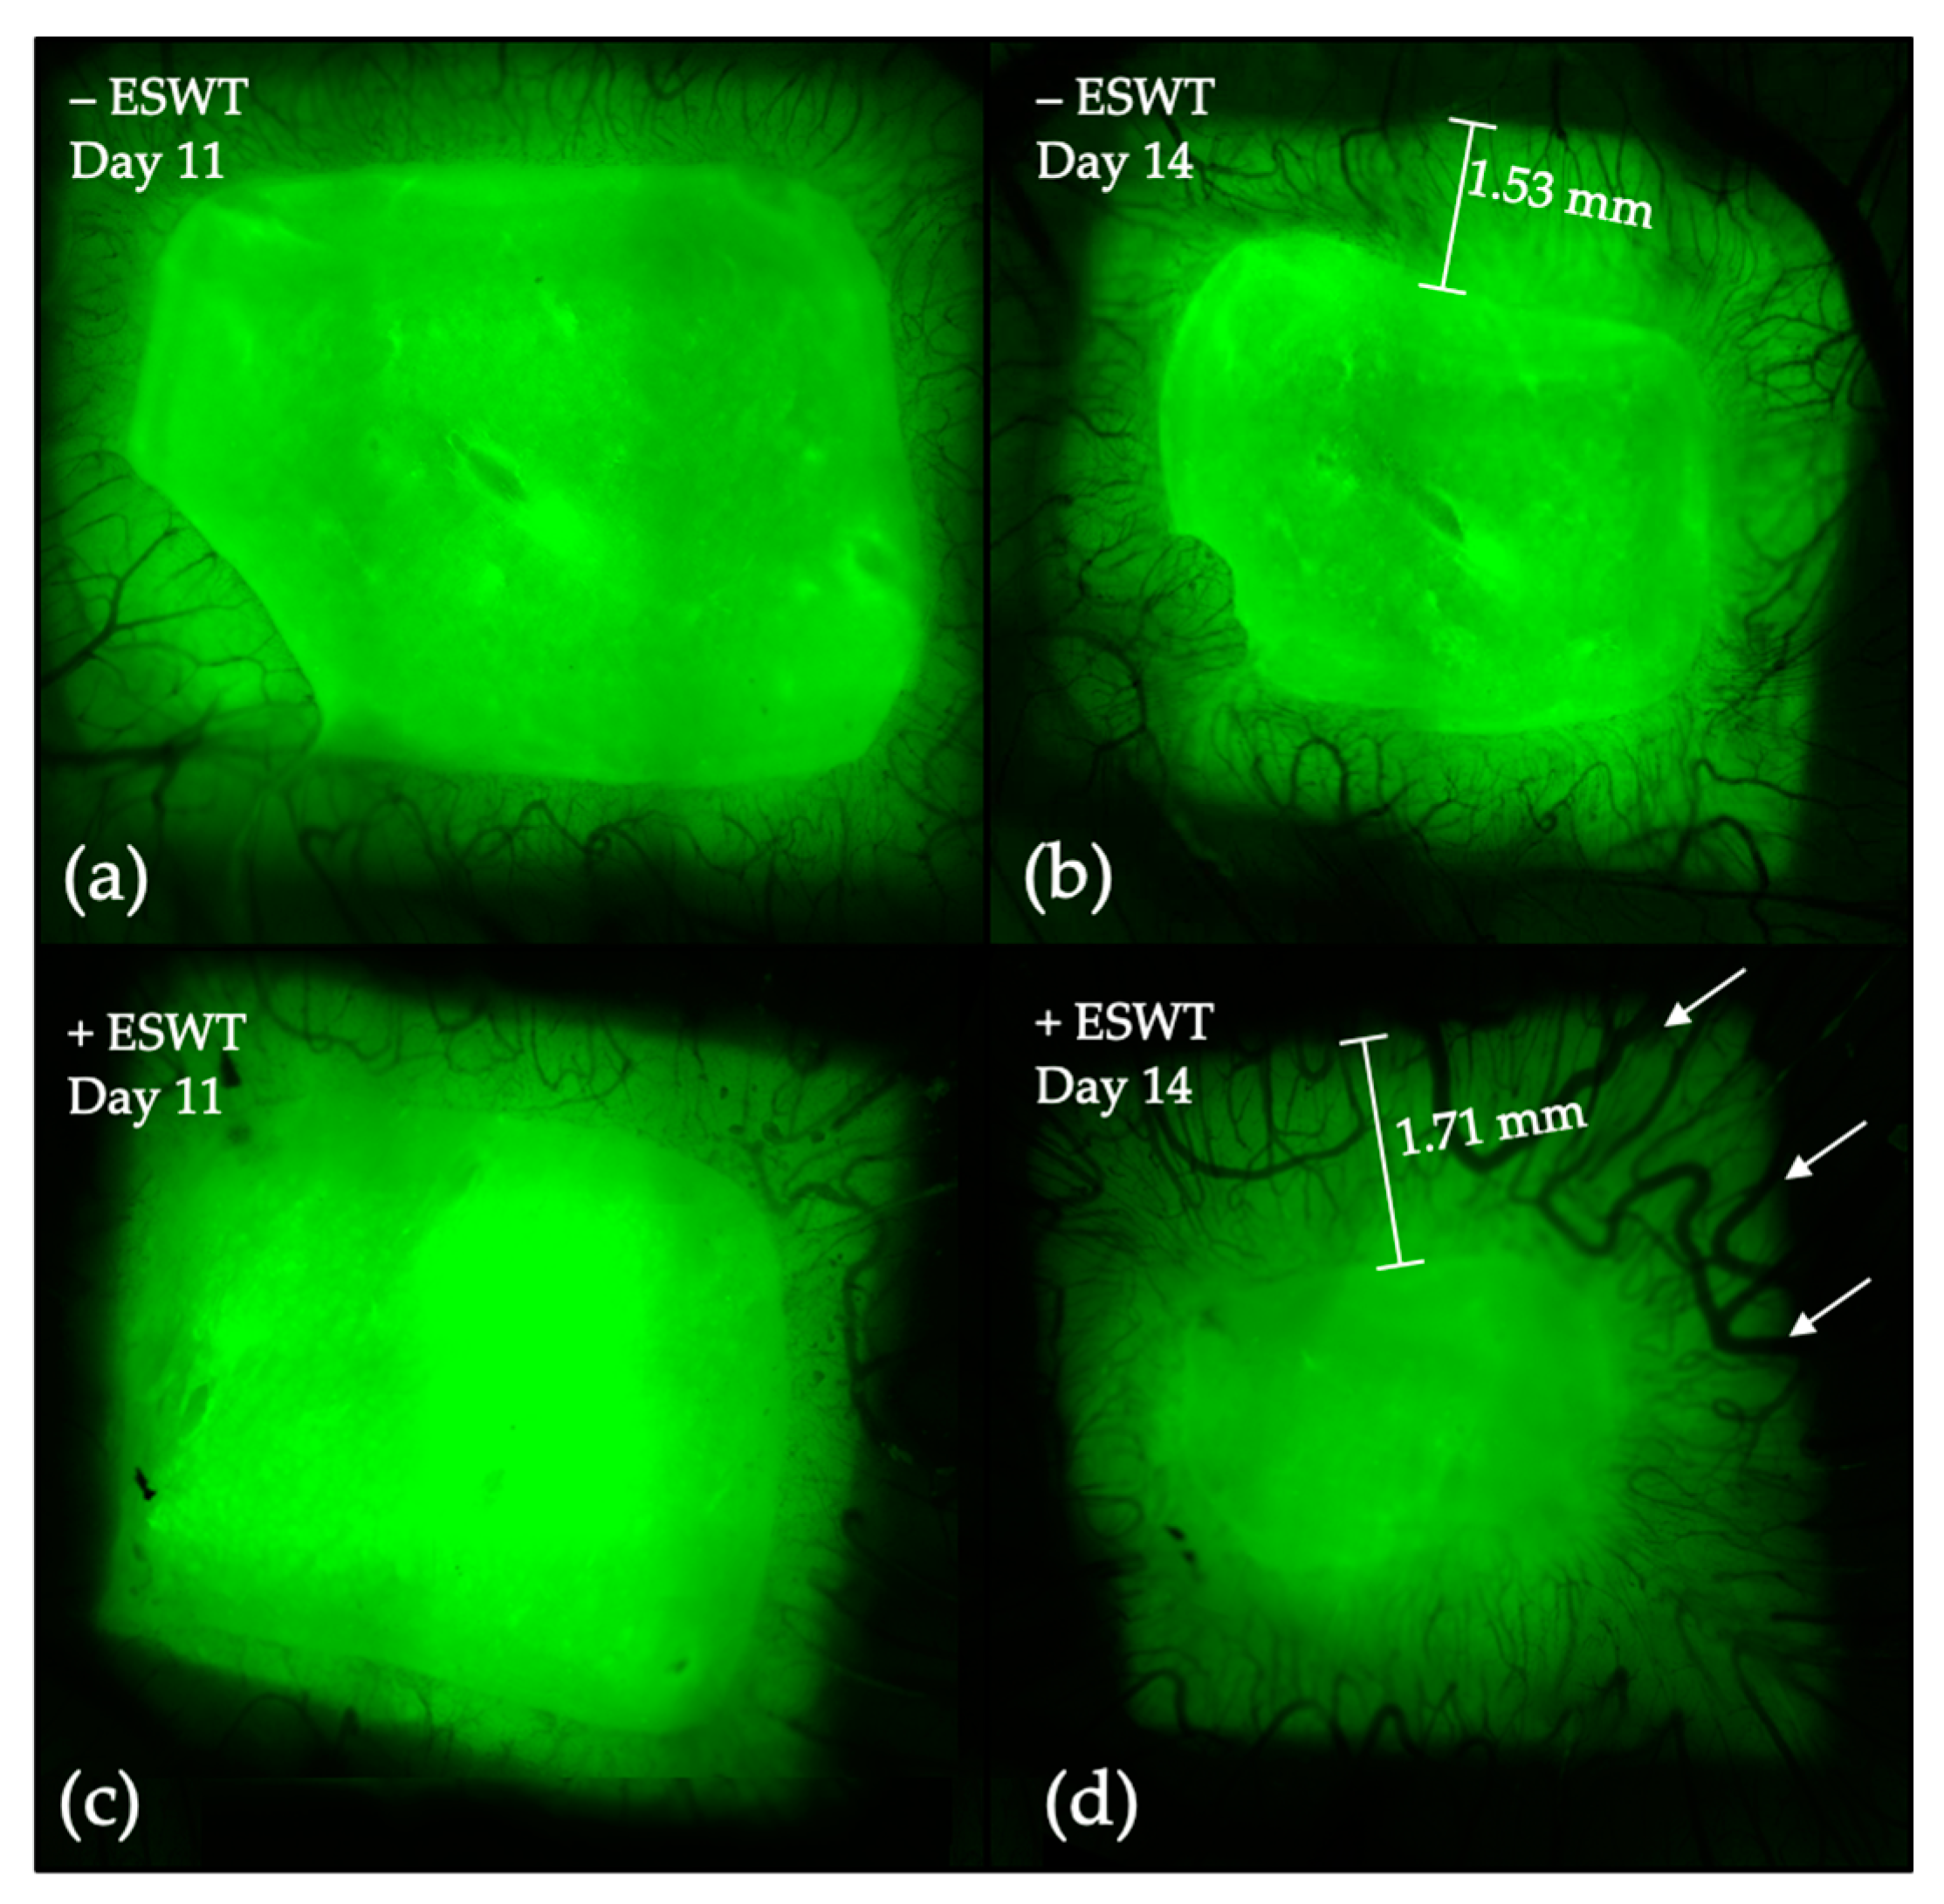
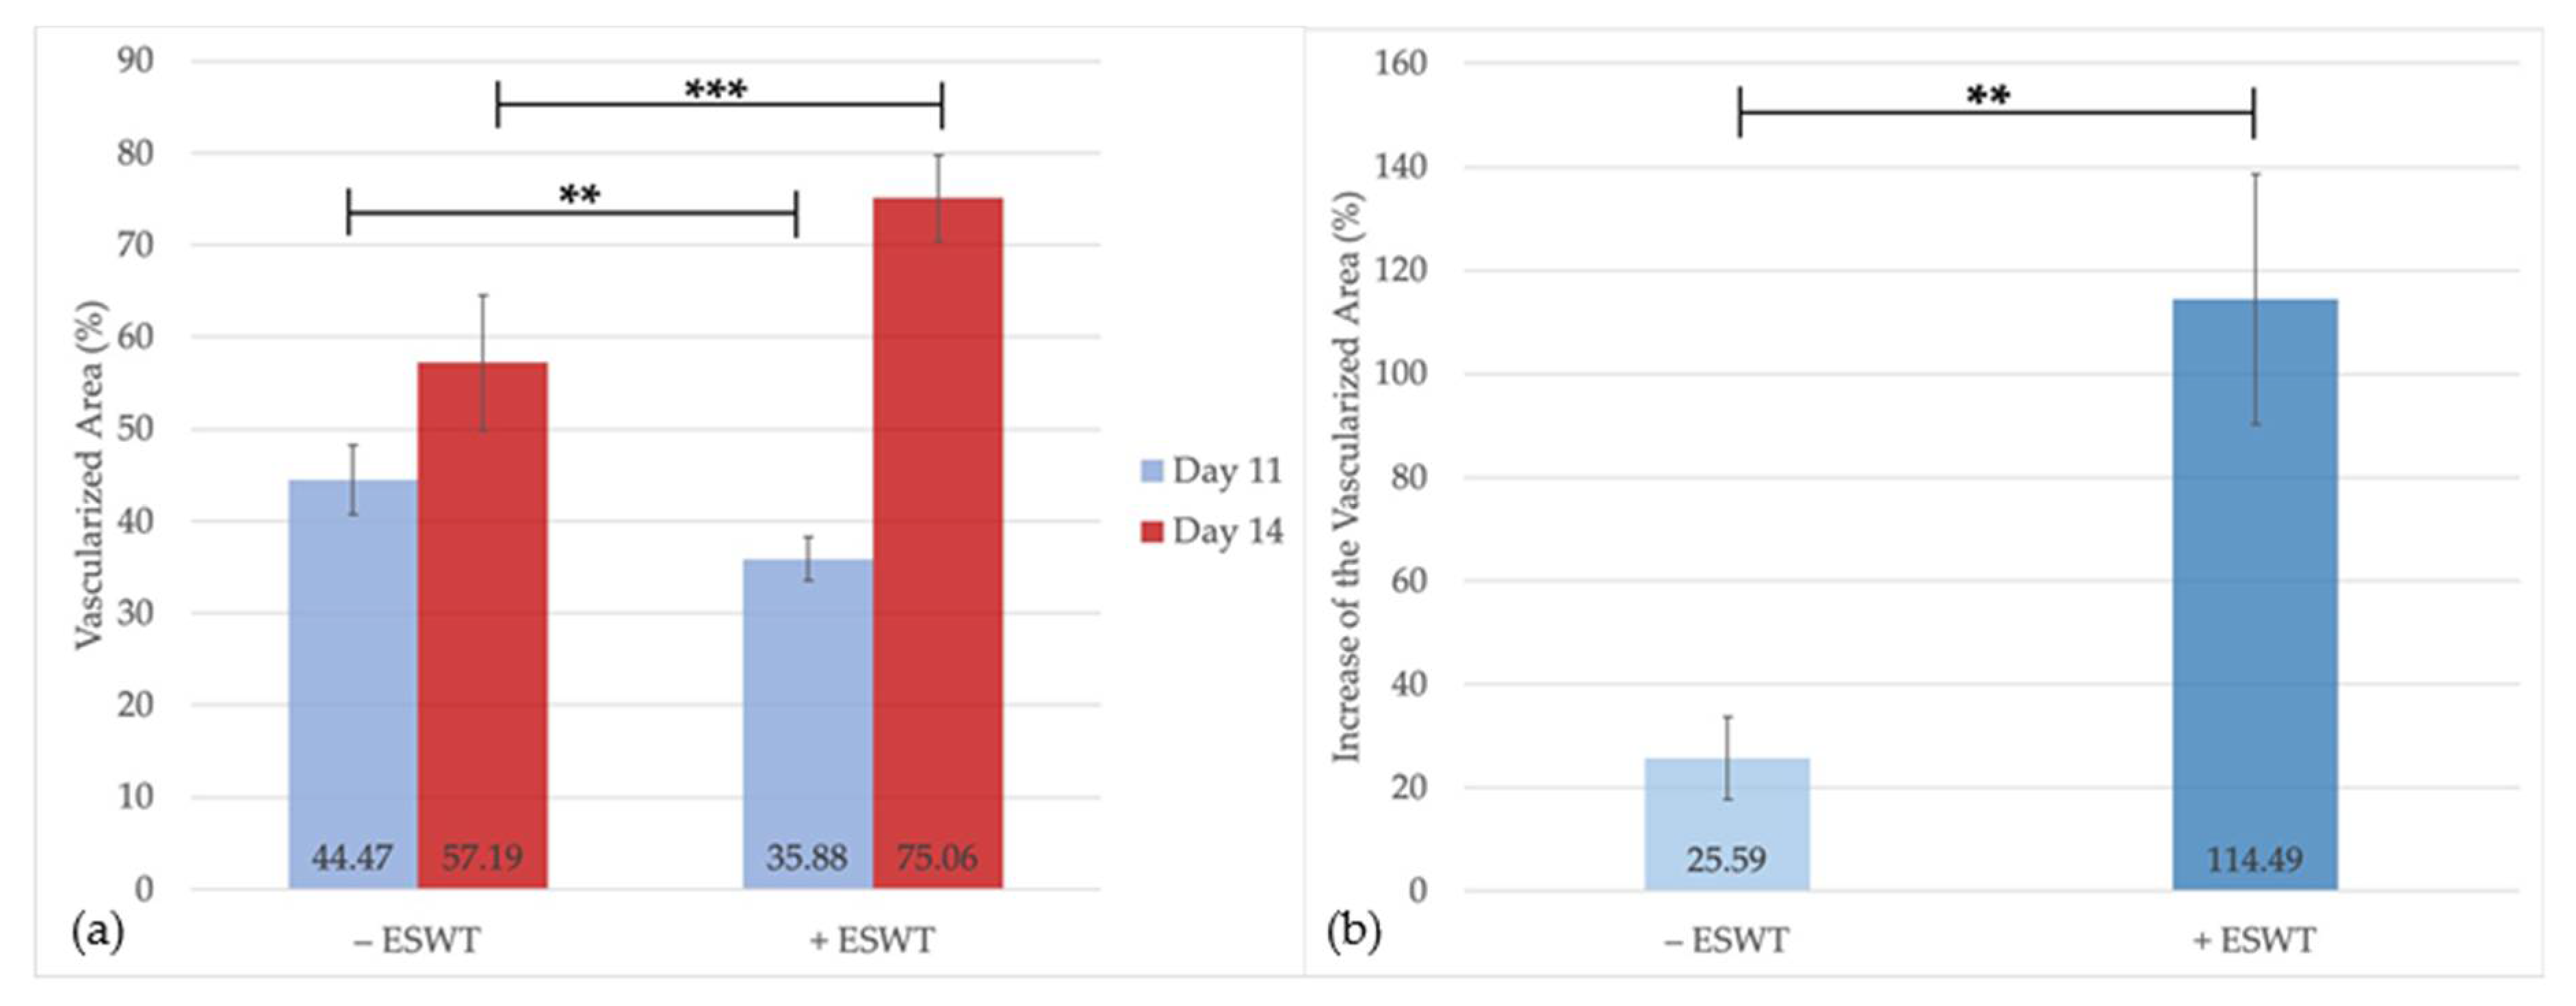
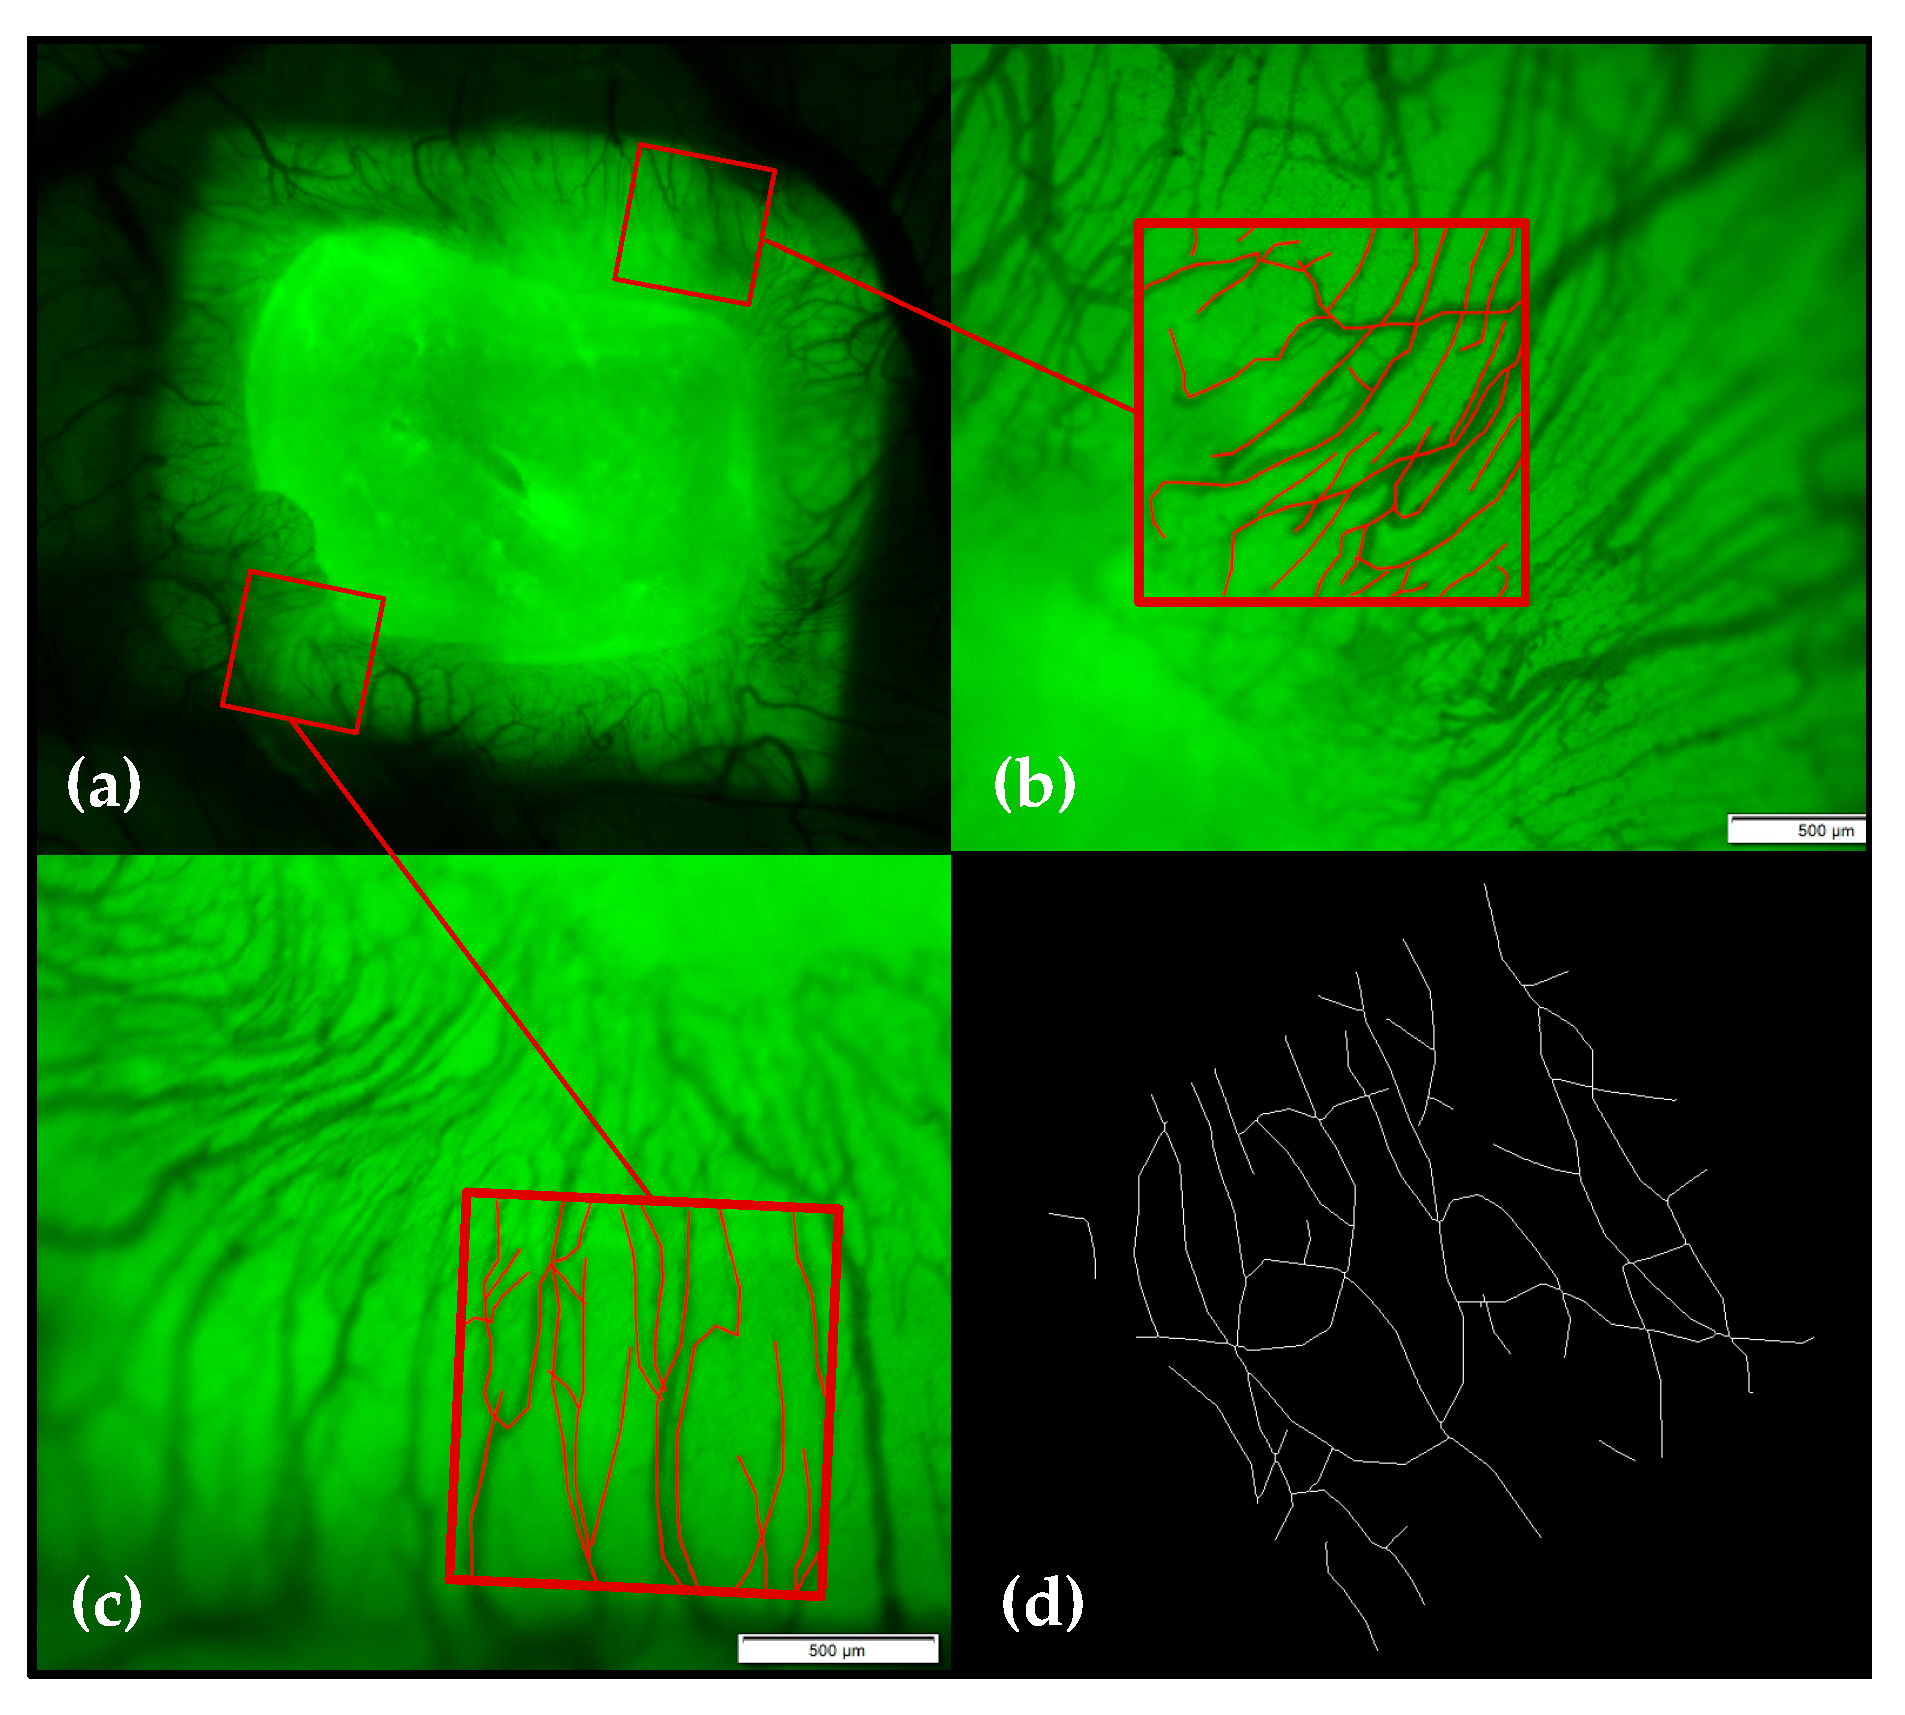
2.1. Intravital Fluorescence Microscopy
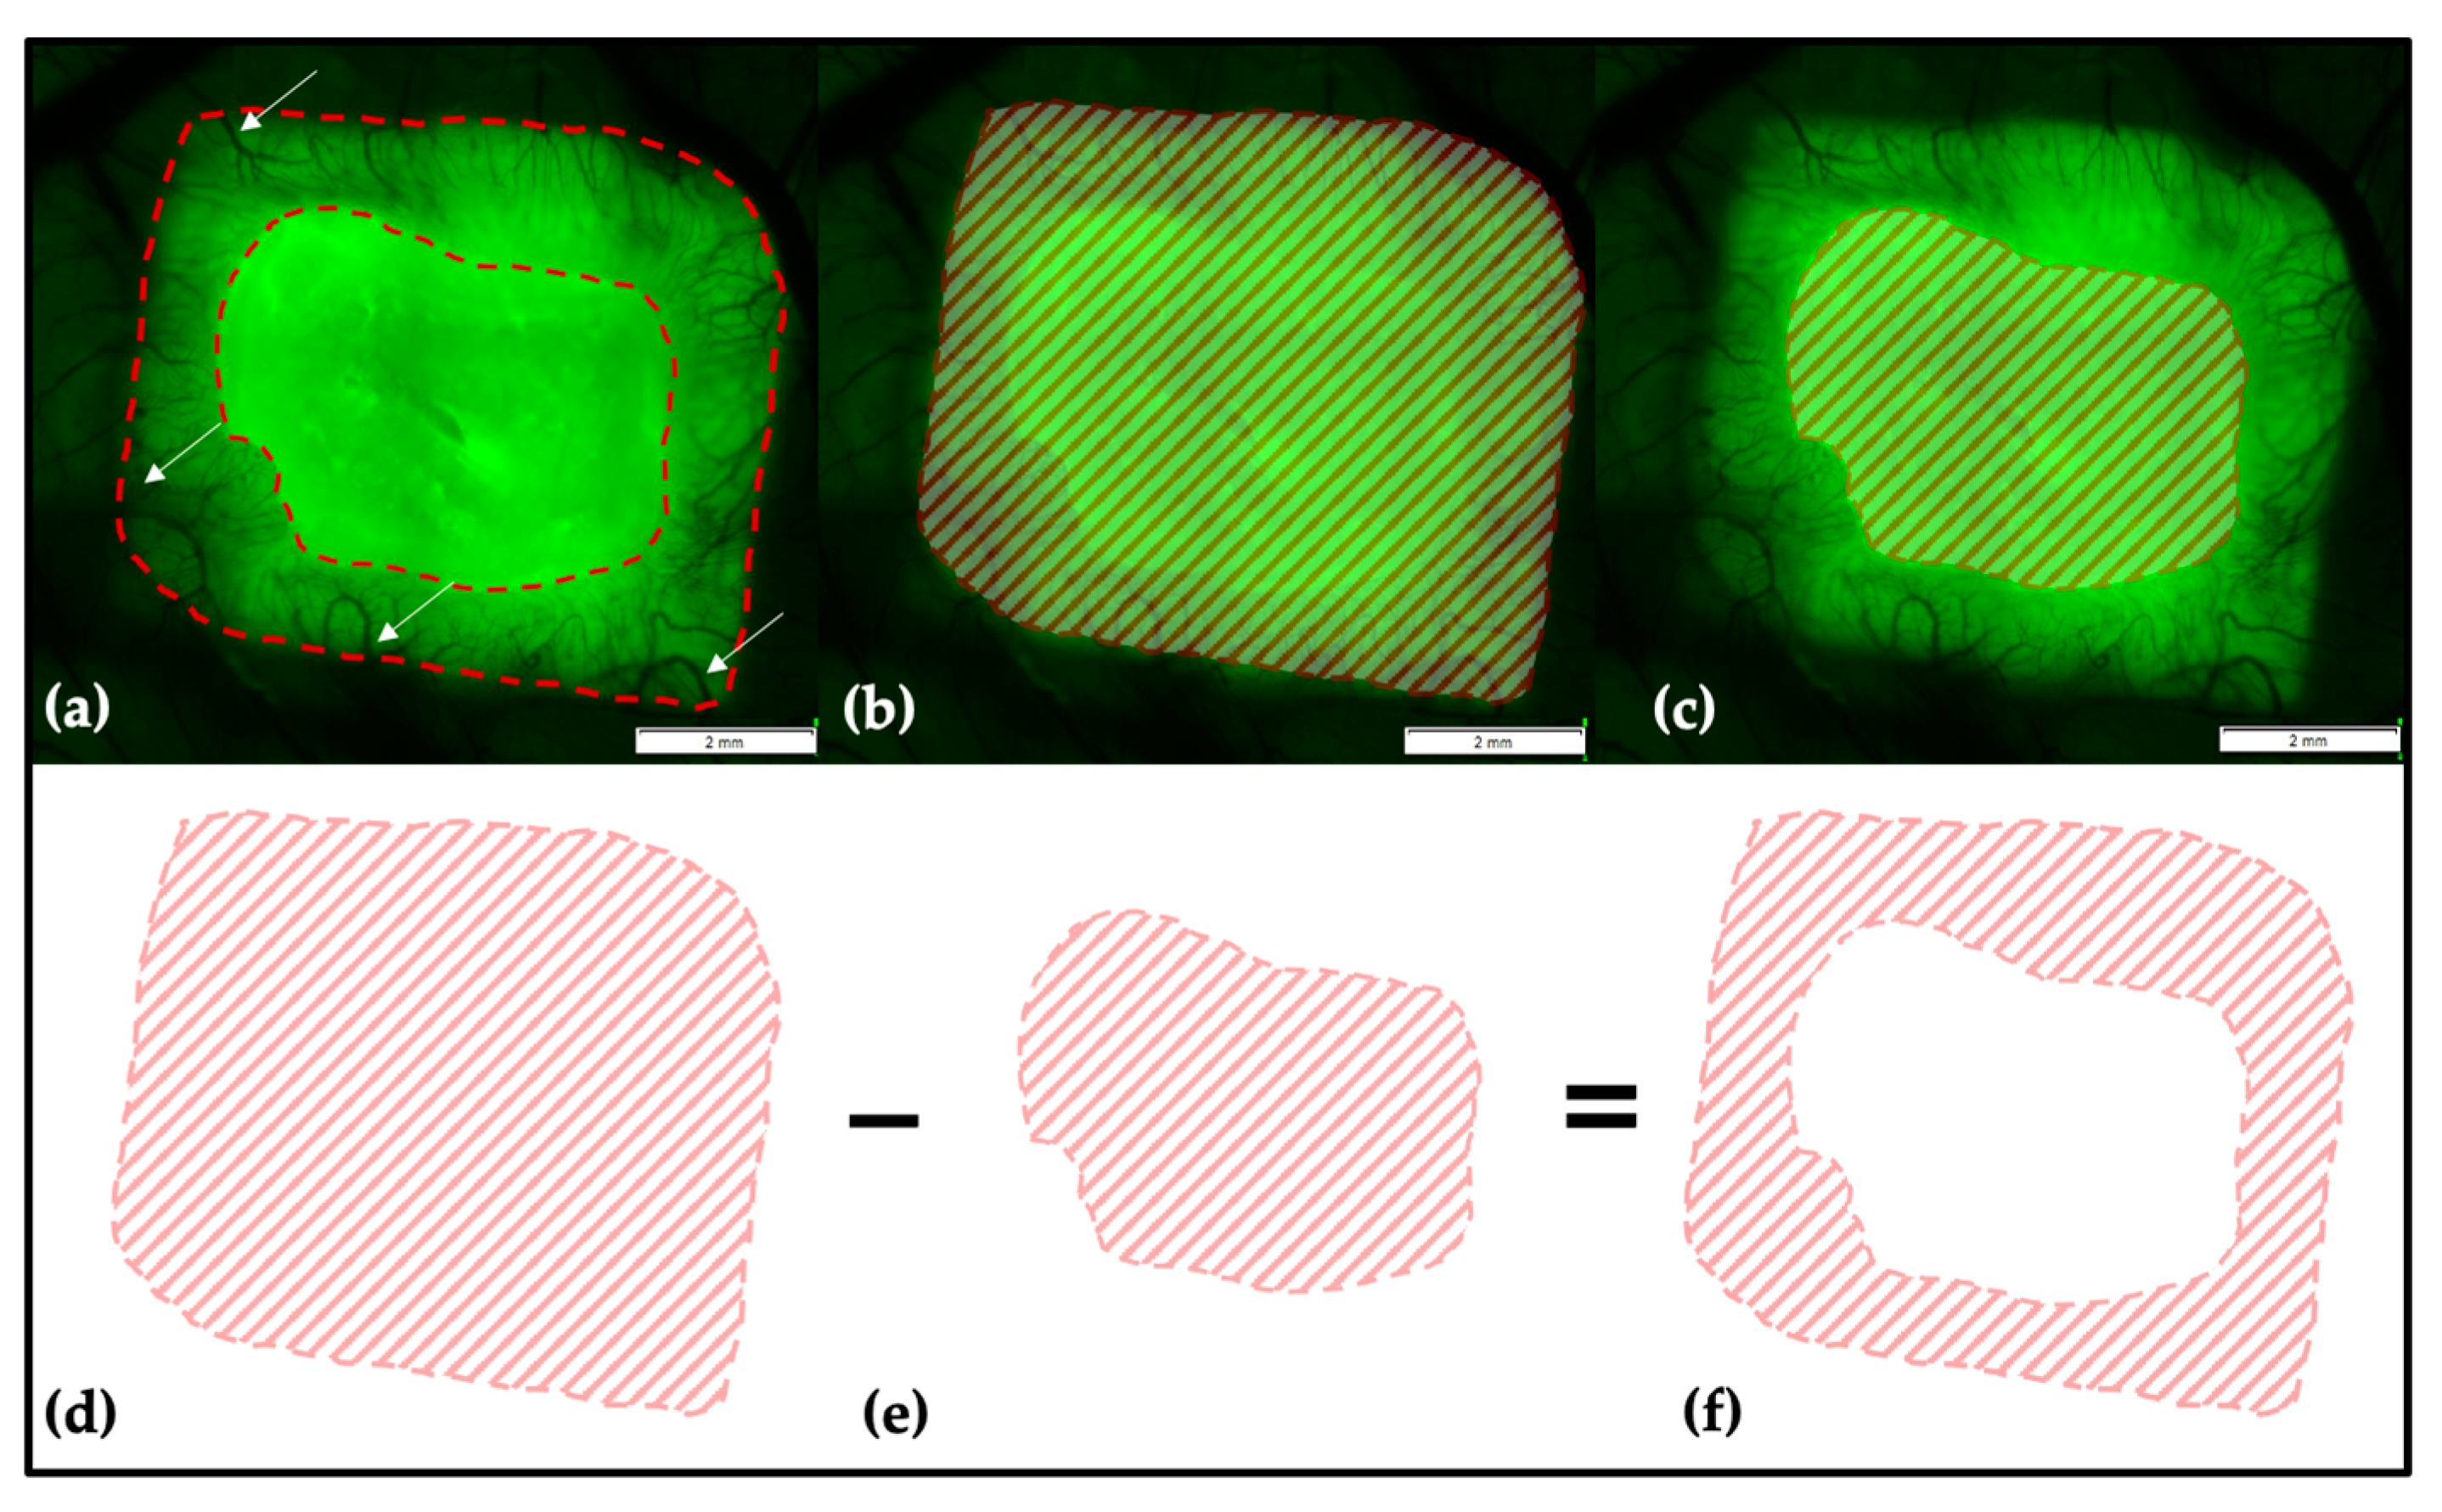
2.1.1. Determination of the Vascularized Area on the Collagen Matrix
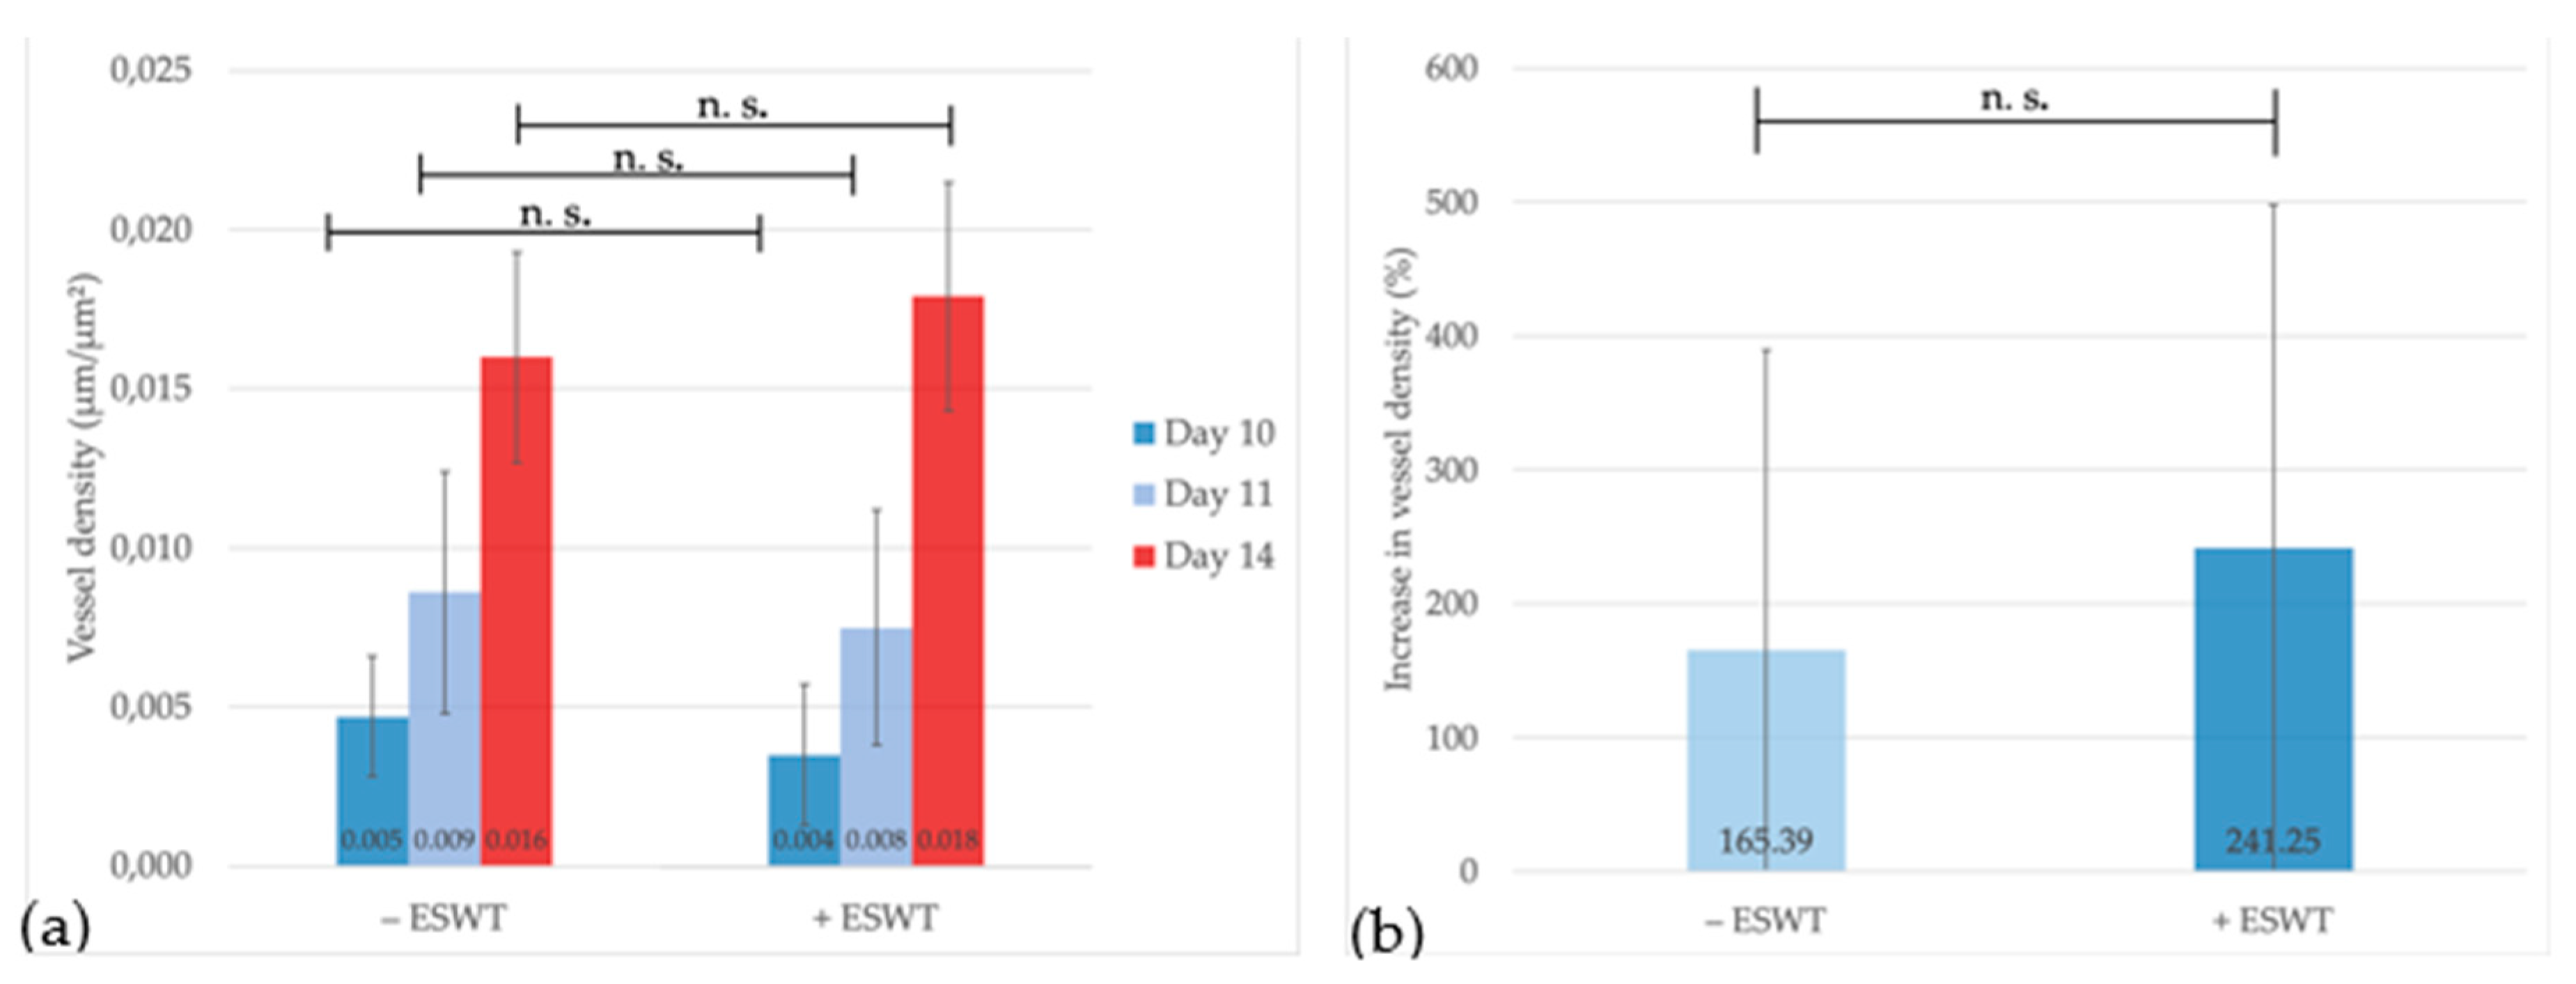
2.1.2. Vessel Density Analysis
2.1.3. Vessel Junction Analysis
2.2. Gene Expression Analysis
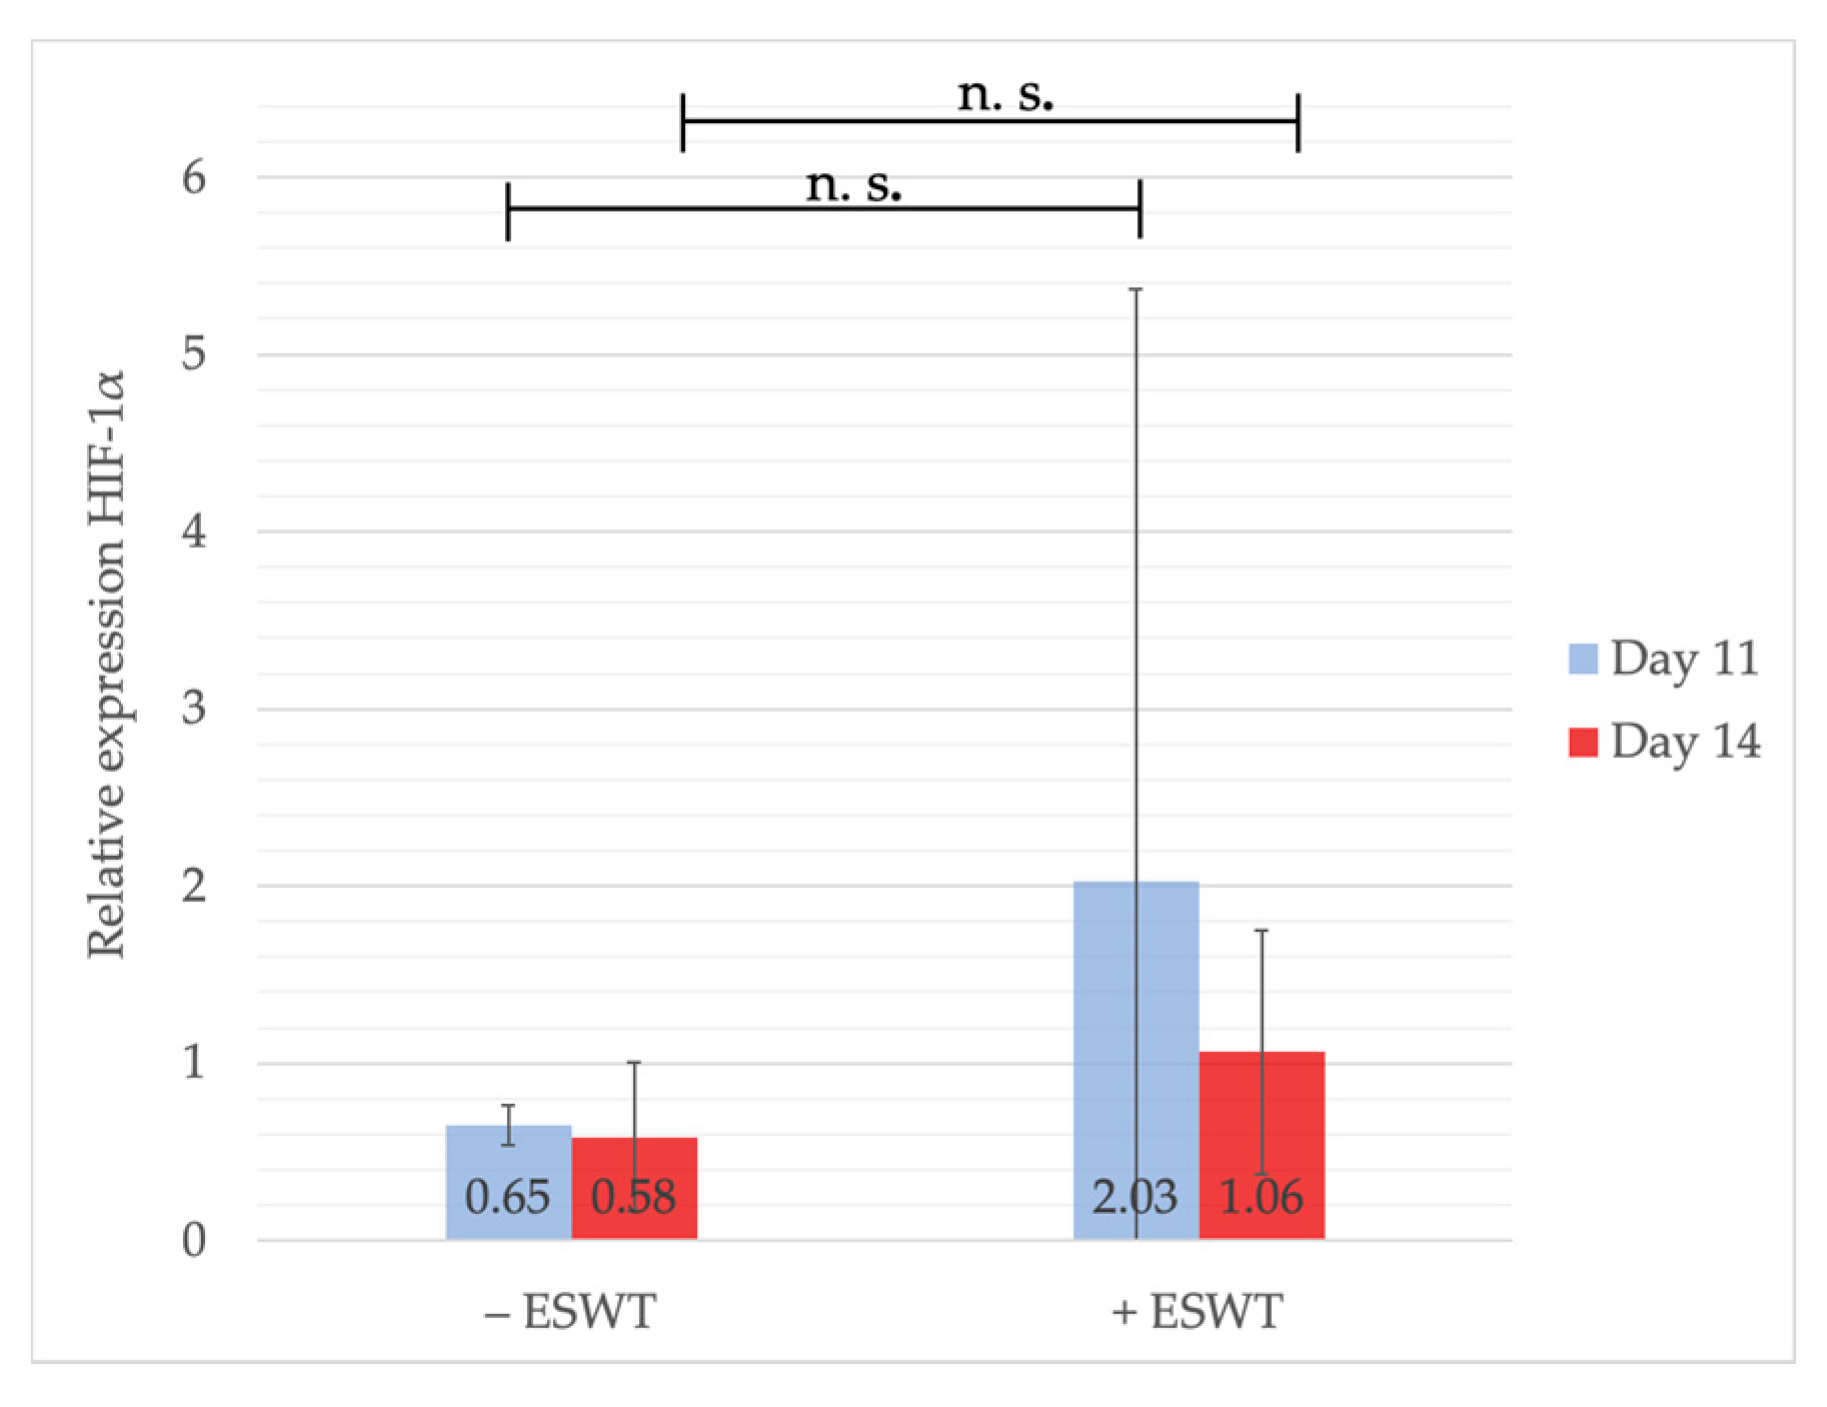
2.2.1. HIF-1α
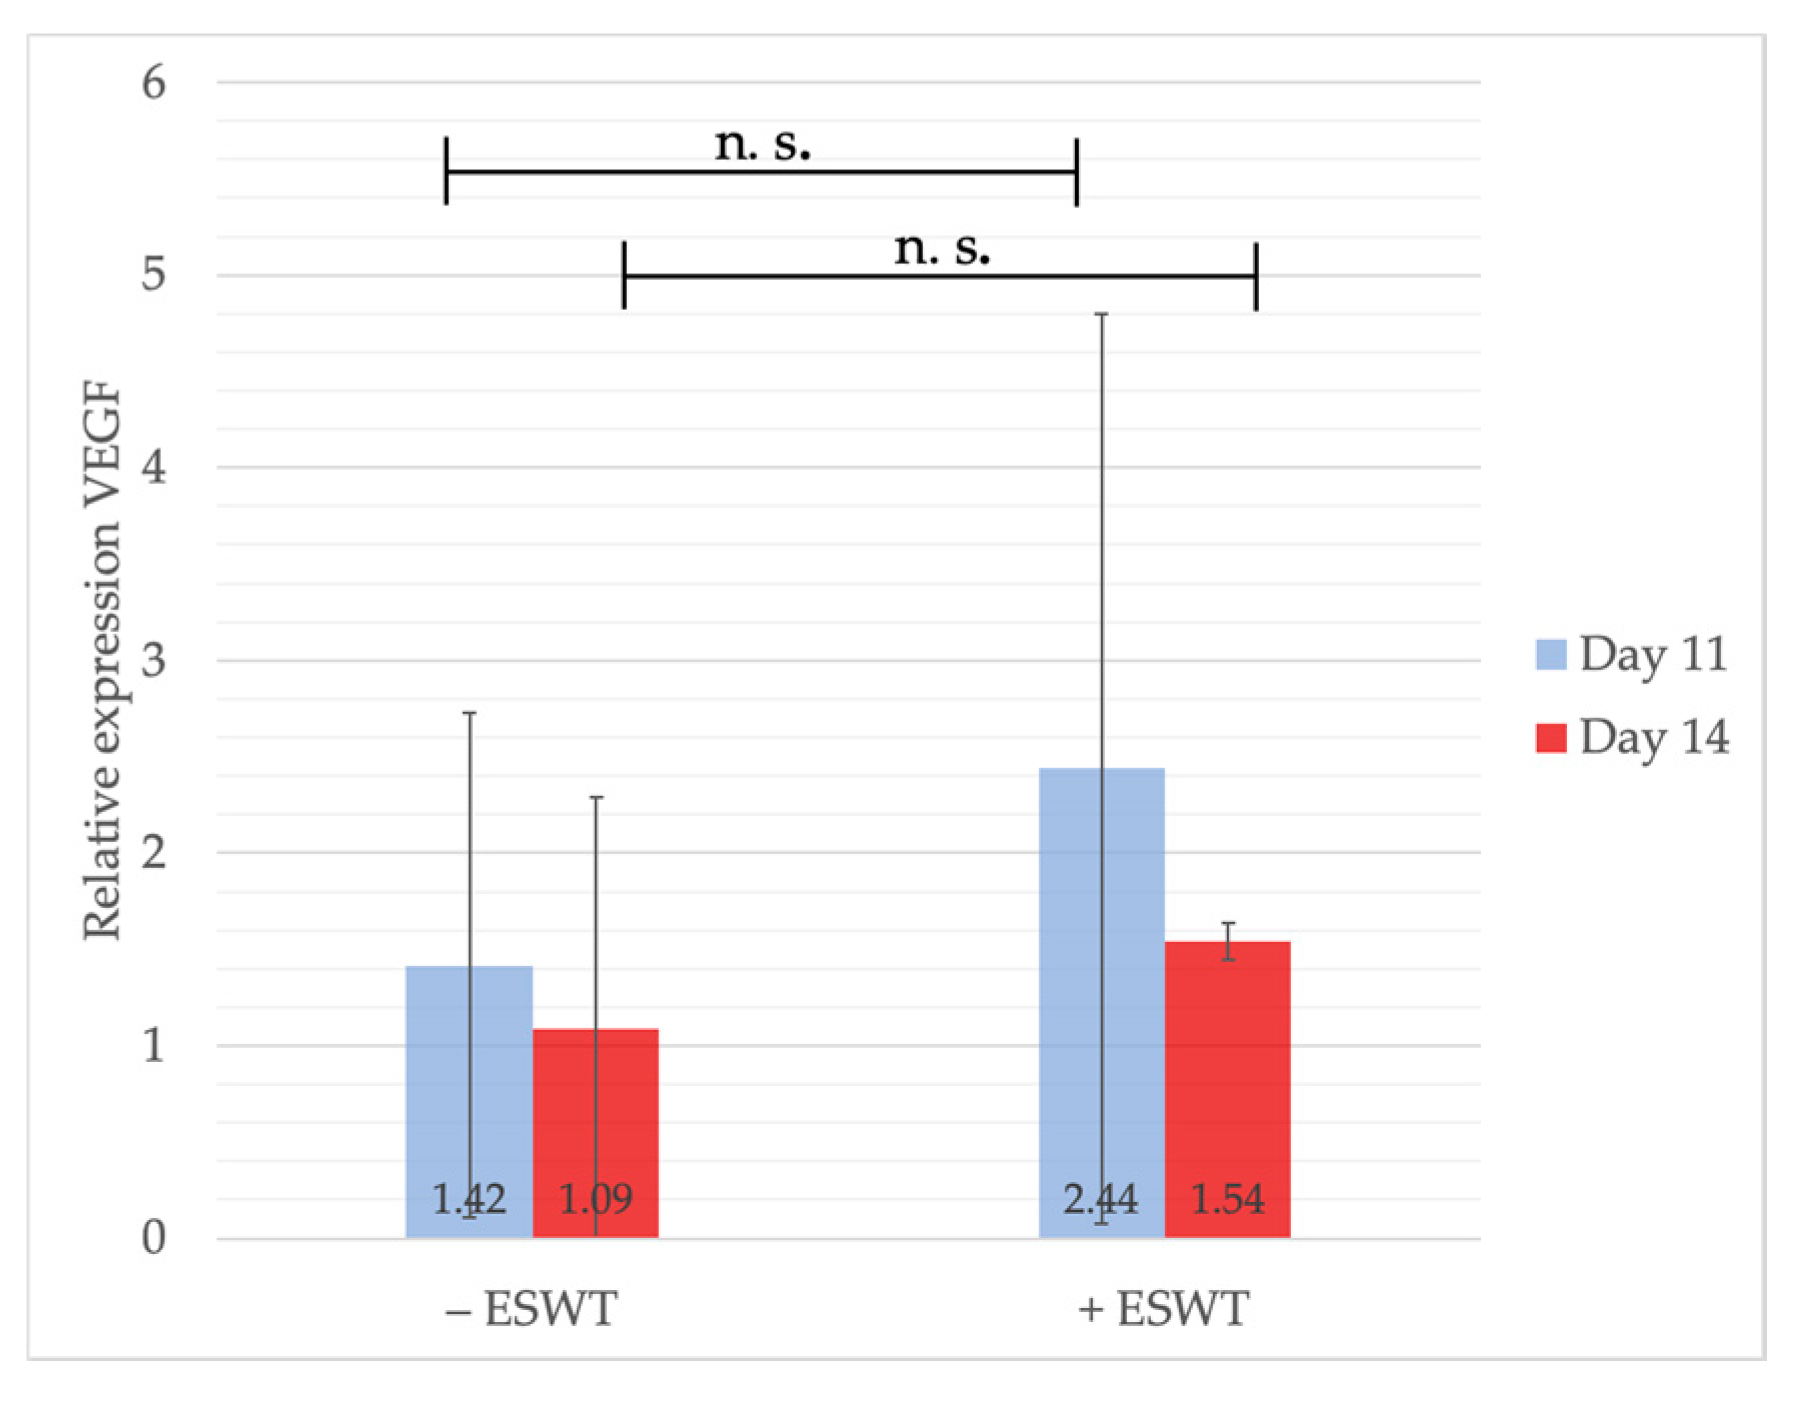
2.2.2. VEGF
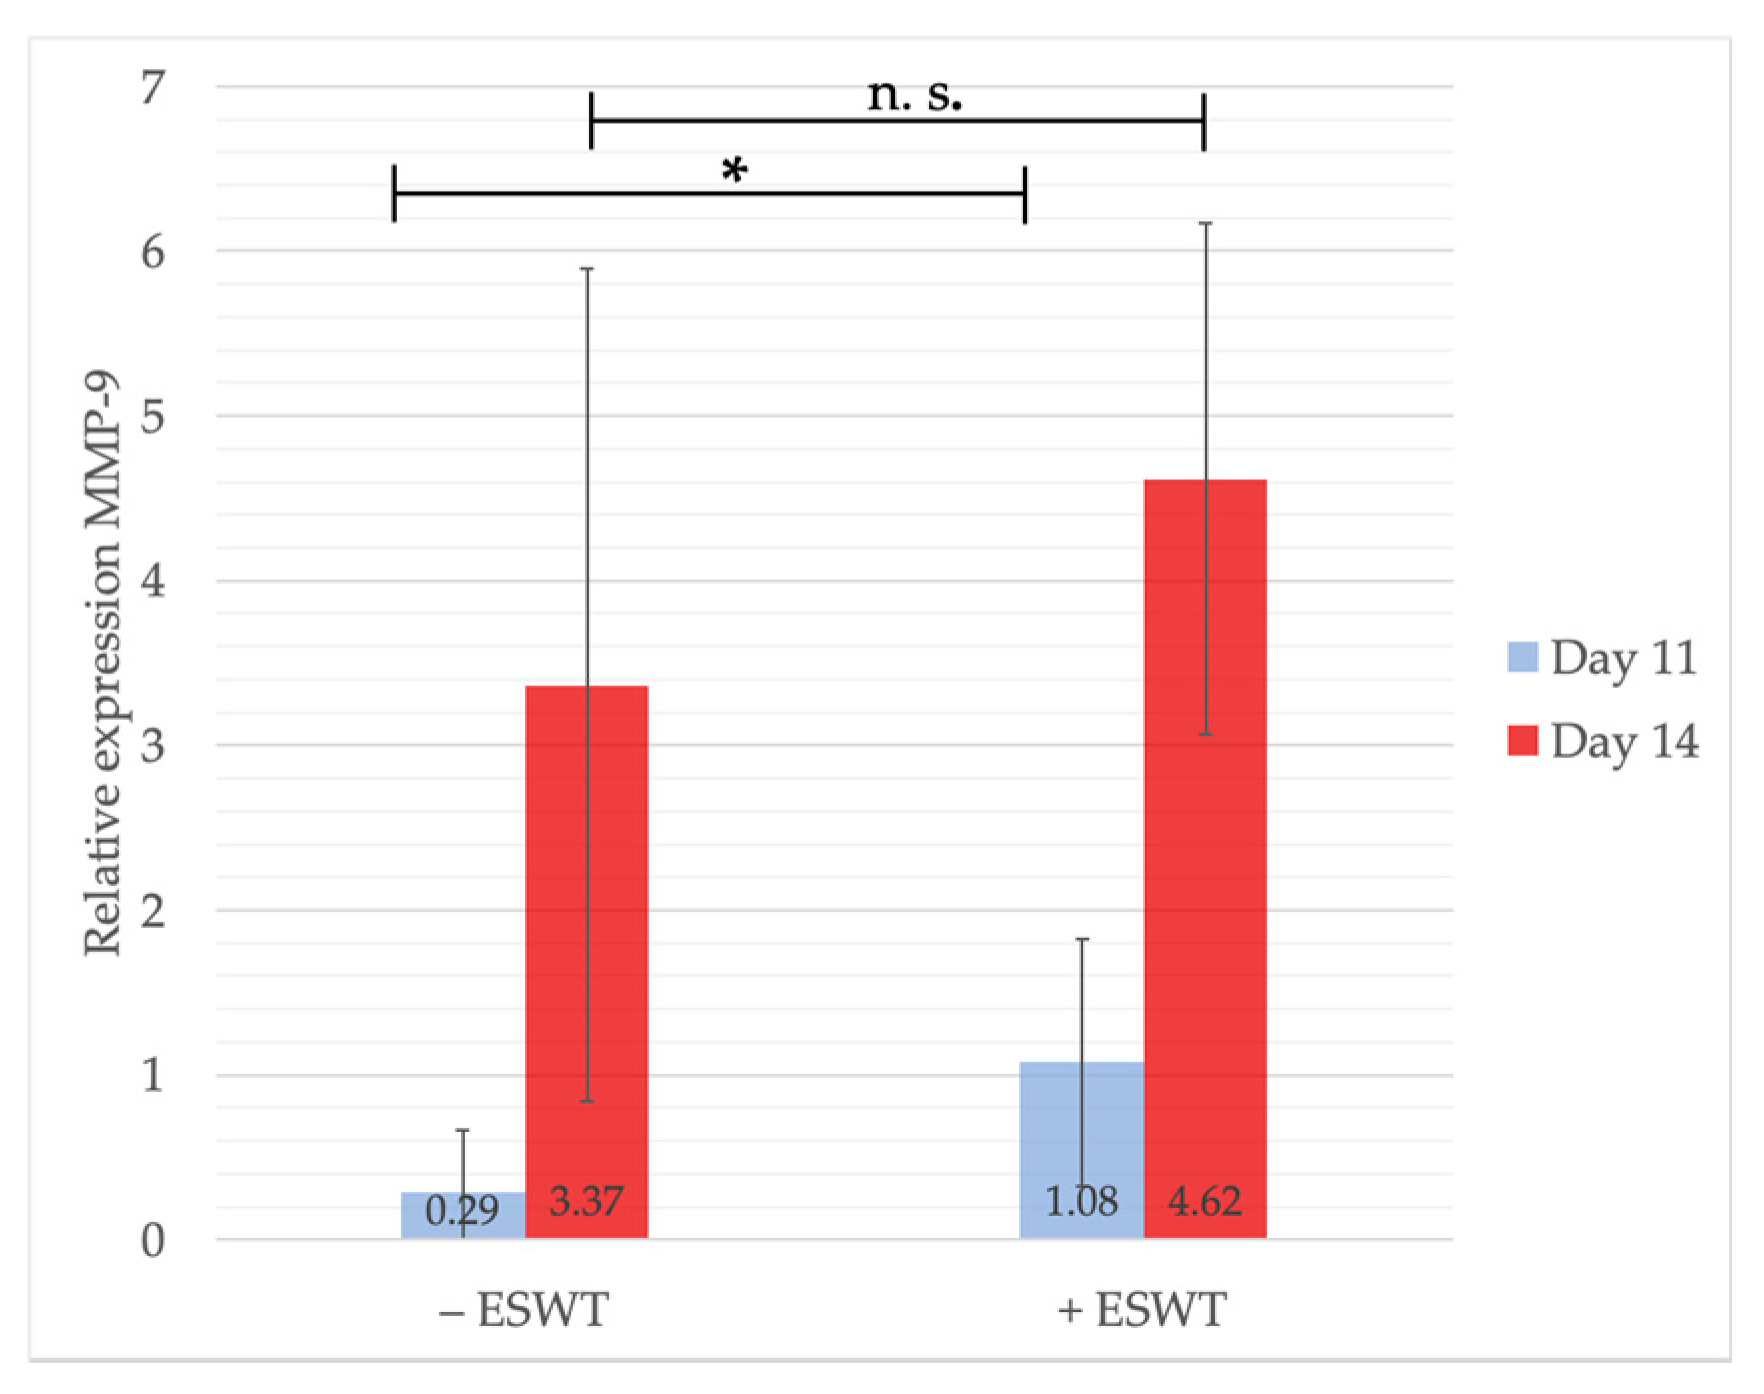
2.2.3. MMP-9
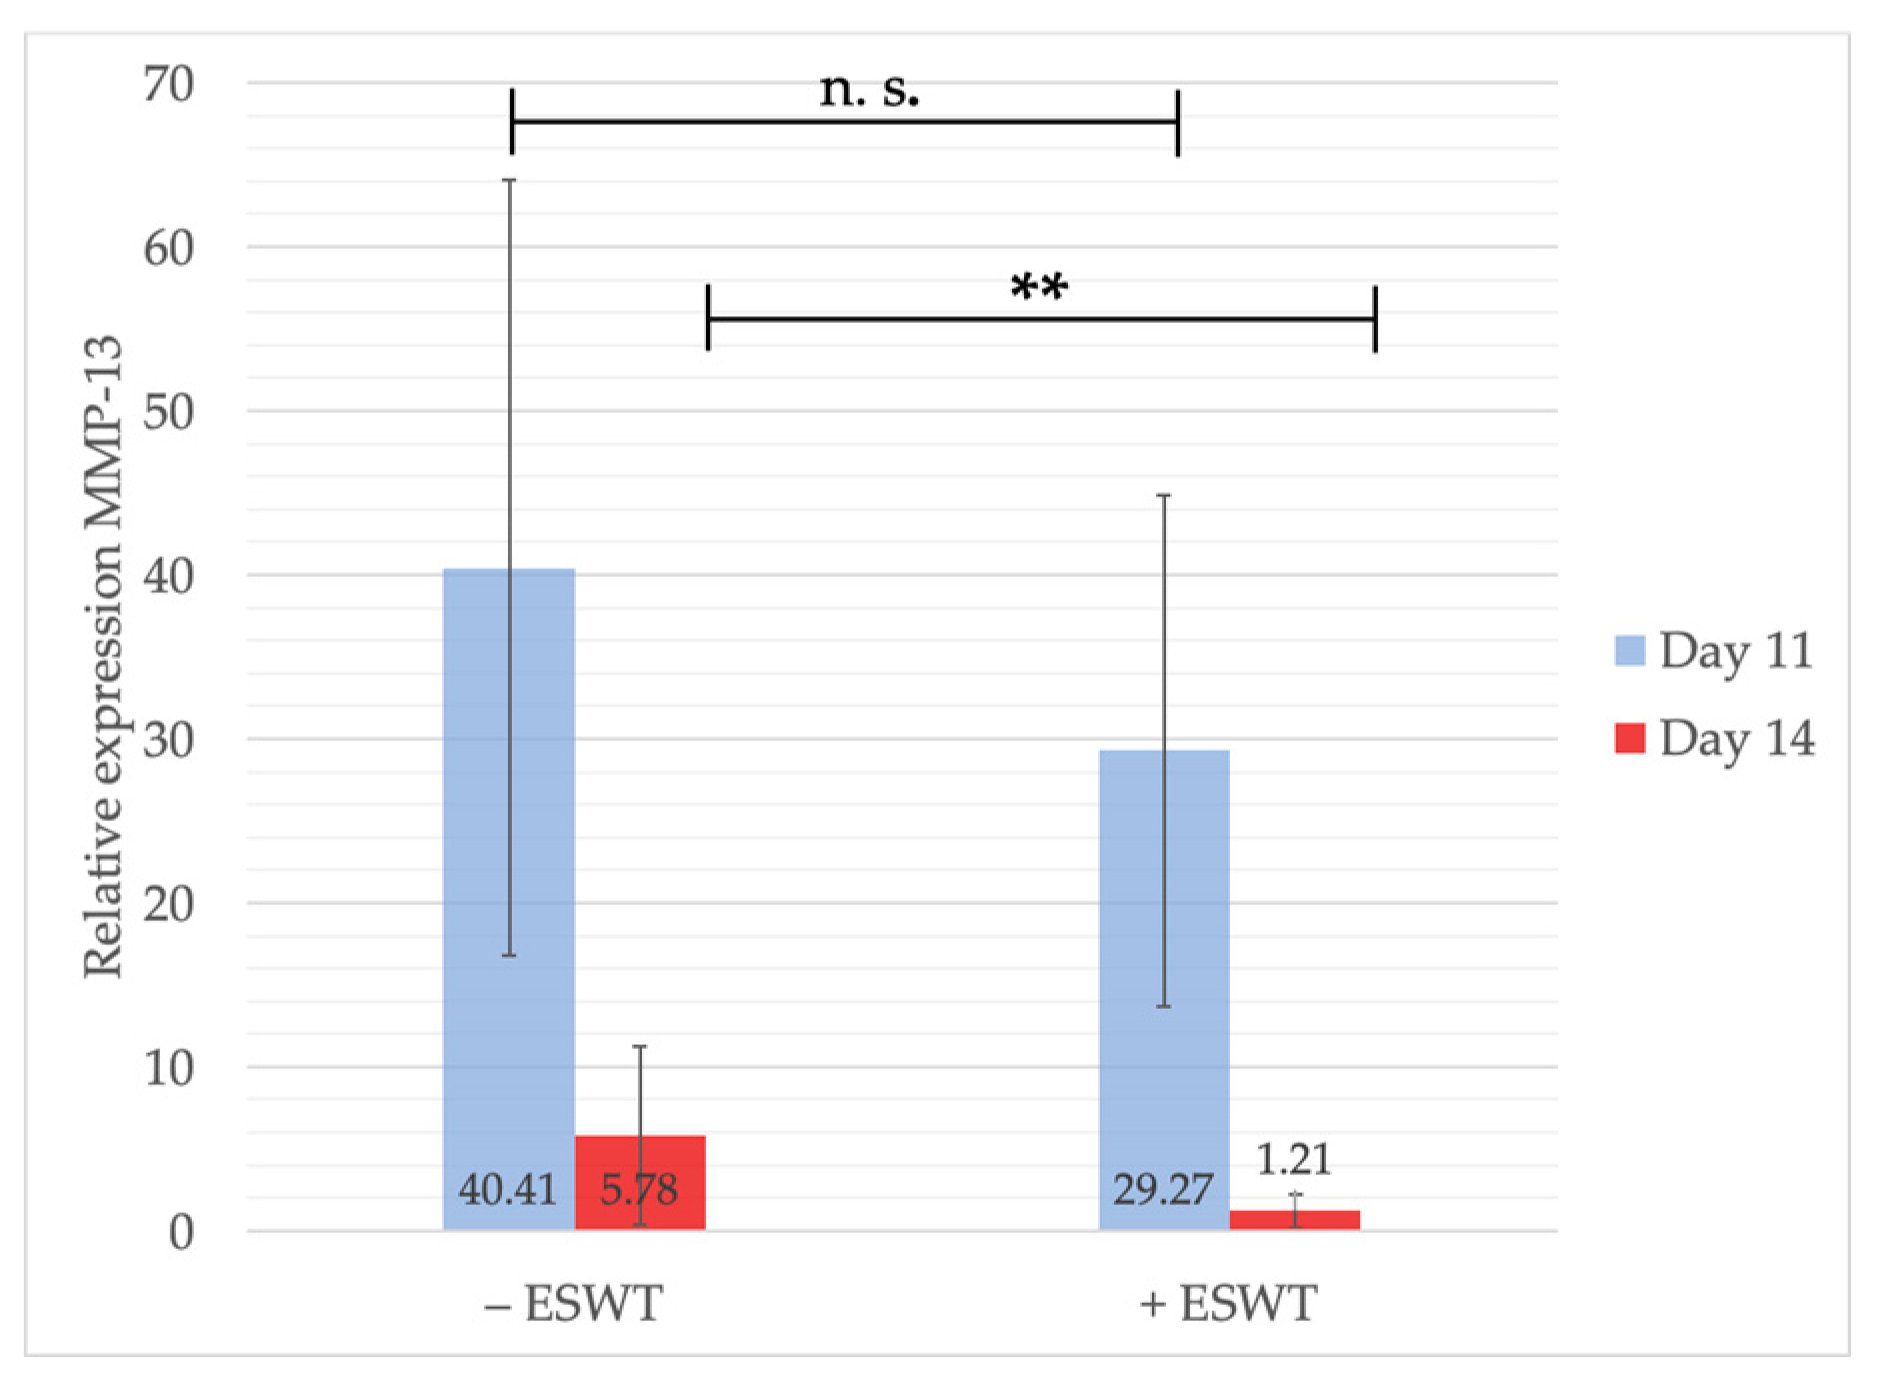
2.2.4. MMP-13
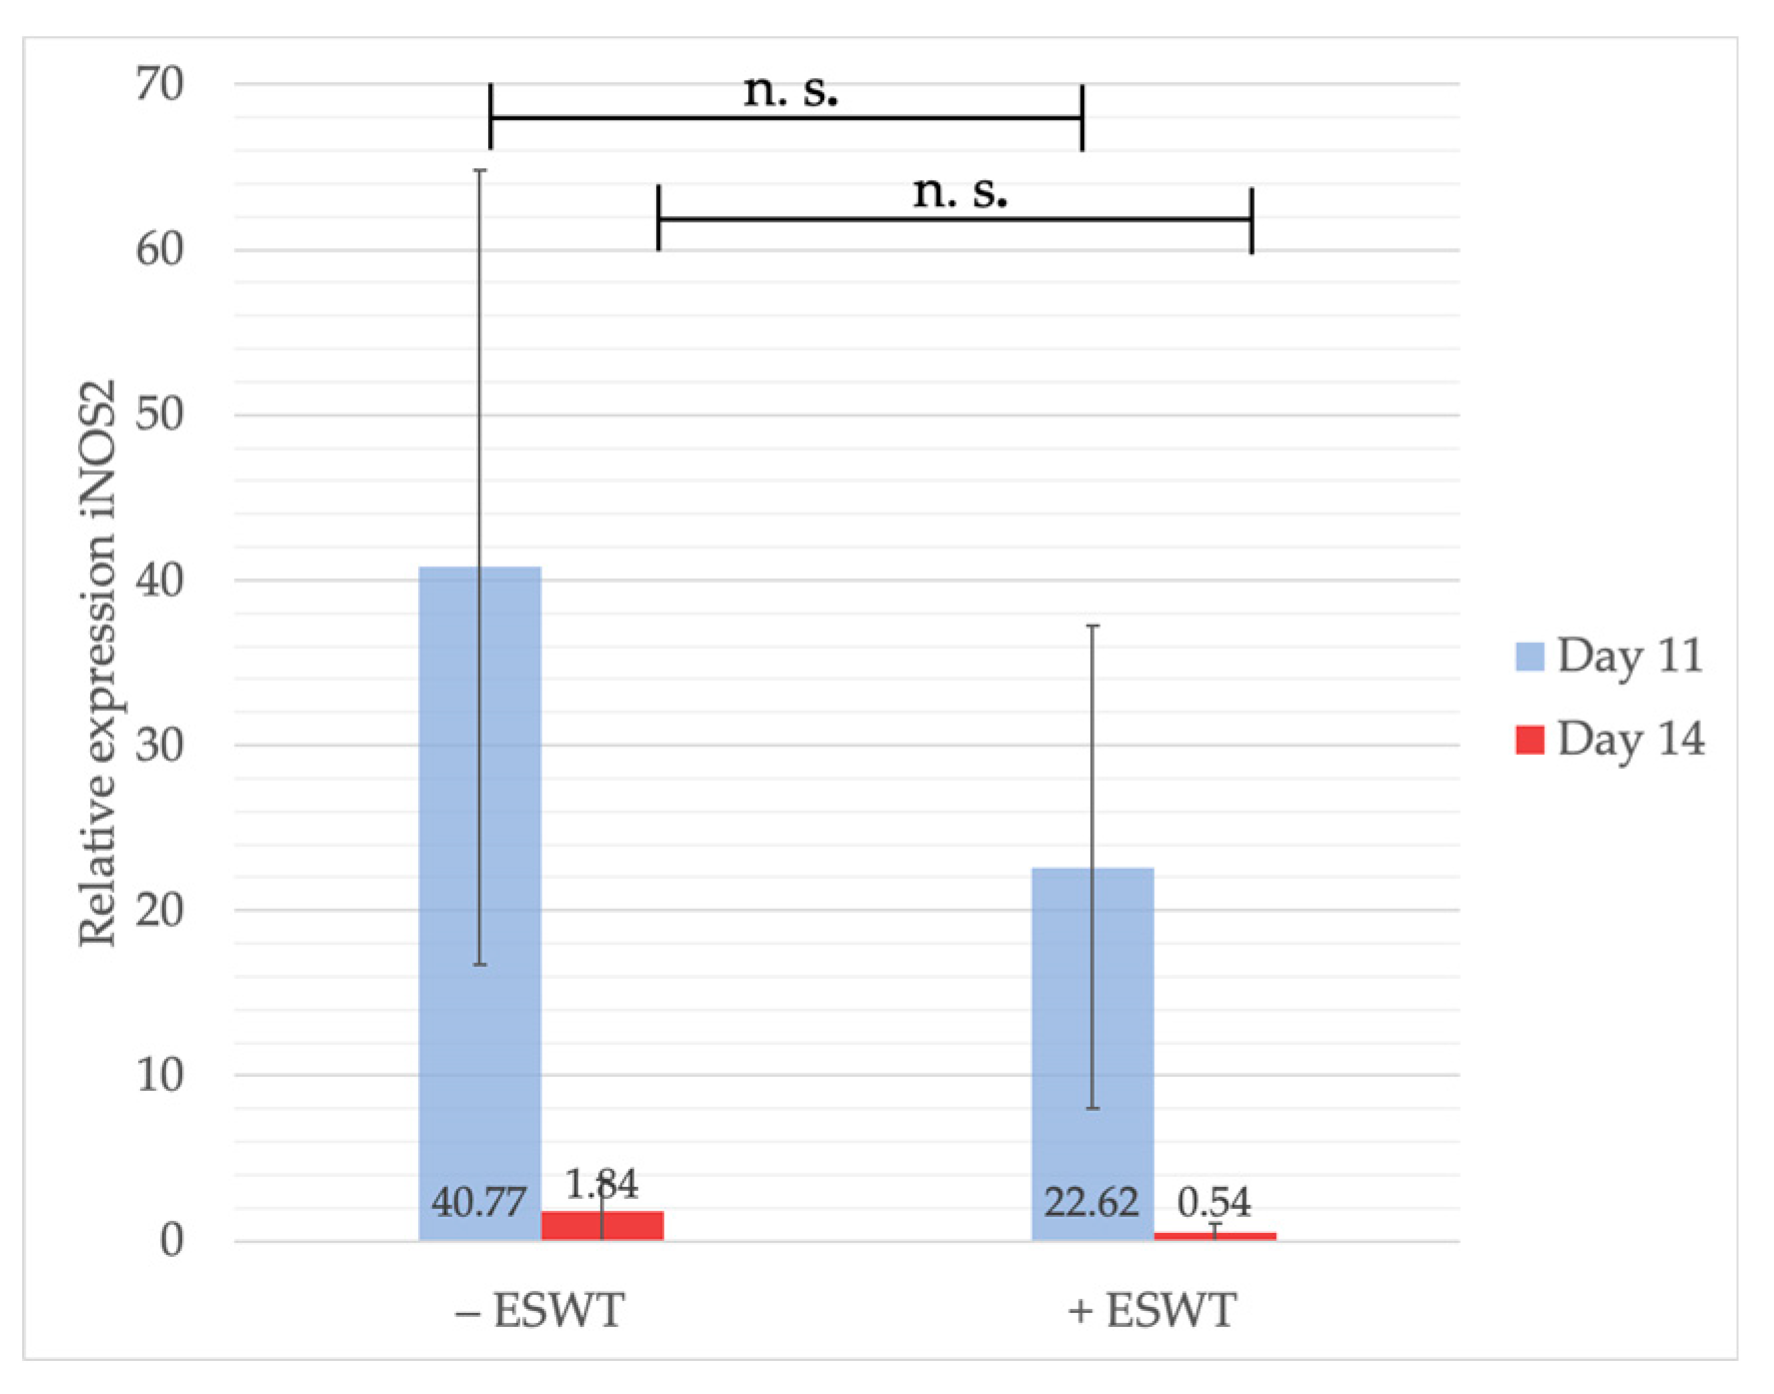
2.2.5. iNOS2
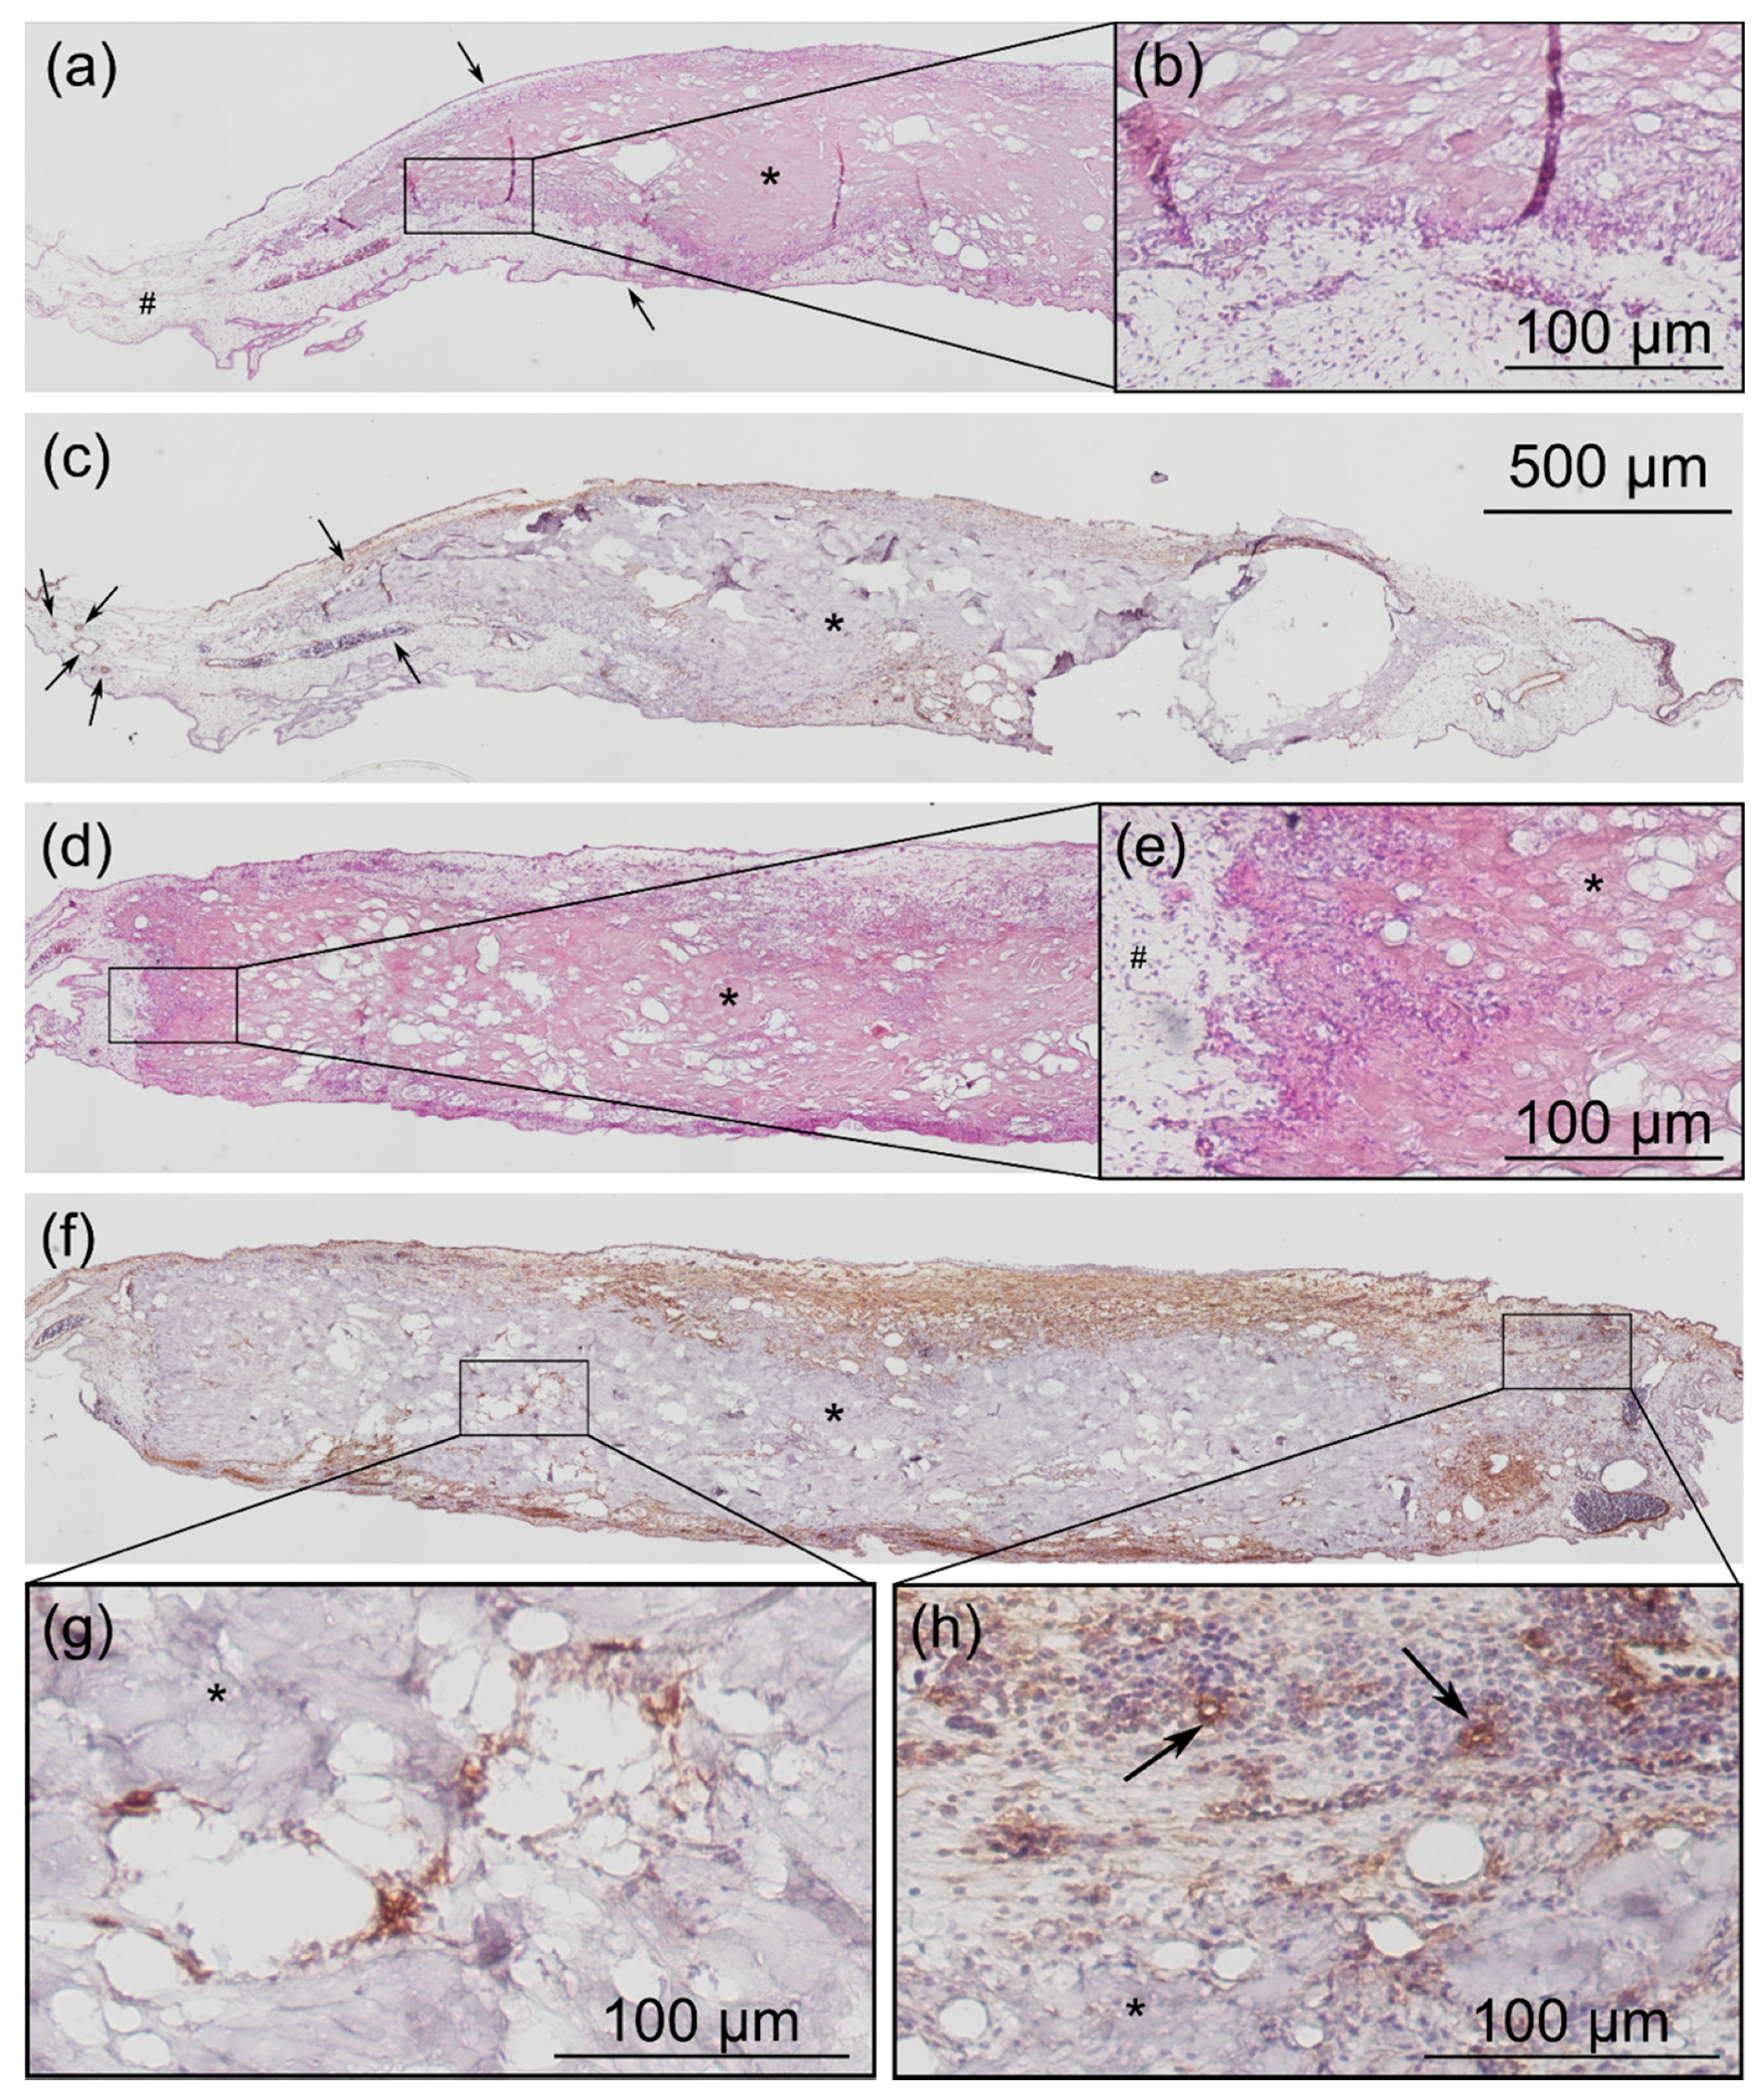
2.3. Immunohistochemical Staining of CM Integration into CAM Tissue
3. Discussion
4. Materials and Methods
4.1. Collagen Matrices
4.2. In Ovo Chorioallantoic Membrane Assay (CAM Assay)
4.3. Extracorporeal Shockwave Therapy (ESWT)
4.4. Intravital Fluorescence Microscopy
4.4.1. Determination of the Vascularized Area on the Collagen Matrix
4.4.2. Vessel Density and Vessel Junction Analysis
VL/1,000,000 µm2 = vd (µm/µm2)
vd1 + vd2 = VD (µm/µm2)
4.5. mRNA Isolation and Quantitative Polymerase Chain Reaction (qPCR)
4.6. Immunohistochemical Staining
4.7. Statistics
Author Contributions
Funding
Acknowledgments
Conflicts of Interest
Abbreviations
| ALOX | Arachidonate lipoxygenase |
| CAM | Chorioallantoic membrane |
| CCL | C-C motif chemokine ligand |
| CM | Collagen matrix |
| COX | Cyclooxygenase |
| CXCL | C-X-C motif chemokine ligand |
| EDD | Embryonic development day |
| EFD | Energy flux density |
| eNOS | Endothelial NO-synthase |
| ESW | Extracorporeal shockwave |
| ESWT | Extracorporeal shockwave therapy |
| HE | Hematoxylin and eosin |
| HIF | Hypoxia-inducible factor |
| ICAM | Intracellular adhesion molecule |
| IL | Interleukin |
| iNOS | Inducible NO-synthase |
| LPS | Lipopolysaccharide |
| MIA | Multi image array |
| MMP | Matrix metalloprotease |
| NF-κB | Nuclear factor kappa-light-chain-enhancer of activated B-cells |
| NO | Nitric oxygen |
| PCNA | Proliferating-Cell-Nuclear-Antigen |
| PDGF | Platelet Derived Growth Factor |
| ROI | Region of interest |
| ROS | Reactive oxygen species |
| TGF | Transforming growth factor |
| TIMP | Tissue inhibitor of metalloproteases |
| TNF | Tumor necrosis factor |
| VCAM | Vascular cell adhesion protein |
| VEGF | Vascular endothelial growth factor |
References
- Mueller, C.K.; Schultze-Mosgau, S. Histomorphometric analysis of the phenotypical differentiation of recruited macrophages following subcutaneous implantation of an allogenous acellular dermal matrix. Int. J. Oral Maxillofac. Surg. 2011, 40, 401–407. [Google Scholar] [CrossRef] [PubMed]
- Kyyak, S.; Blatt, S.; Pabst, A.; Thiem, D.; Al-Nawas, B.; Kämmerer, P.W. Combination of an allogenic and a xenogenic bone substitute material with injectable platelet-rich fibrin – A comparative in vitro study. J. Biomater. Appl. 2020, 35, 83–96. [Google Scholar] [CrossRef] [PubMed]
- Pabst, A.; Kämmerer, P.W. Collagen matrices: Opportunities and perspectives in oral hard and soft tissue regeneration. Quintessence Int 2020, 51, 318–327. [Google Scholar] [PubMed]
- Spiller, K.L.; Anfang, R.R.; Spiller, K.J.; Ng, J.; Nakazawa, K.R.; Daulton, J.W.; Vunjak-Novakovic, G. The role of macrophage phenotype in vascularization of tissue engineering scaffolds. Biomater. 2014, 35, 4477–4488. [Google Scholar] [CrossRef] [PubMed] [Green Version]
- Lasola, J.J.M.; Kamdem, H.; McDaniel, M.W.; Pearson, R.M. Biomaterial-Driven Immunomodulation: Cell Biology-Based Strategies to Mitigate Severe Inflammation and Sepsis. Front. Immunol. 2020, 11, 1726. [Google Scholar] [CrossRef]
- Blatt, S.; Burkhardt, V.; Kämmerer, P.W.; Pabst, A.M.; Sagheb, K.; Heller, M.; Al-Nawas, B.; Schiegnitz, E. Biofunctionalization of porcine-derived collagen matrices with platelet rich fibrin: Influence on angiogenesis in vitro and in vivo. Clin. Oral Investig. 2020, 1–12. [Google Scholar] [CrossRef] [Green Version]
- Elgali, I.; Omar, O.; Dahlin, C.; Thomsen, P. Guided bone regeneration: Materials and biological mechanisms revisited. Eur. J. Oral Sci. 2017, 125, 315–337. [Google Scholar] [CrossRef]
- Liu, J.; Kerns, D.G. Mechanisms of Guided Bone Regeneration: A Review. Open Dent. J. 2014, 8, 56–65. [Google Scholar] [CrossRef] [Green Version]
- Koerdt, S.; Ristow, O.; Wannhoff, A.; Kübler, A.C.; Reuther, T. Expression of growth factors during the healing process of alveolar ridge augmentation procedures using autogenous bone grafts in combination with GTR and an anorganic bovine bone substitute. Clin. Oral Investig. 2013, 18, 179–188. [Google Scholar] [CrossRef]
- Dau, M.; Volprich, L.; Grambow, E.; Vollmar, B.; Frerich, B.; Al-Nawas, B.; Kämmerer, P.W. Collagen membranes of dermal and pericardial origin—In vivo evolvement of vascularization over time. J. Biomed. Mater. Res. Part A 2020. [Google Scholar] [CrossRef]
- Mueller, C.K.; Lee, S.-Y.; Schultze-Mosgau, S. Characterization of interfacial reactions between connective tissue and allogenous implants used for subdermal soft tissue augmentation. Int. J. Oral Maxillofac. Surg. 2009, 38, 1194–1200. [Google Scholar] [CrossRef] [PubMed]
- Chu, C.; Deng, J.; Sun, X.; Qu, Y.; Man, Y. Collagen Membrane and Immune Response in Guided Bone Regeneration: Recent Progress and Perspectives. Tissue Eng. Part B: Rev. 2017, 23, 421–435. [Google Scholar] [CrossRef] [PubMed]
- Calcagni, M.; Chen, F.; Högger, D.C.; Lindenblatt, N.; Keel, M.; Giovanoli, P.; Contaldo, C. Microvascular Response to Shock Wave Application in Striated Skin Muscle. J. Surg. Res. 2011, 171, 347–354. [Google Scholar] [CrossRef] [PubMed] [Green Version]
- Tamma, R.; Dell’Endice, S.; Notarnicola, A.; Moretti, L.; Patella, S.; Patella, V.; Zallone, A.; Moretti, B. Extracorporeal Shock Waves Stimulate Osteoblast Activities. Ultrasound Med. Biol. 2009, 35, 2093–2100. [Google Scholar] [CrossRef]
- Ginini, J.G.; Maor, G.; Emodi, O.; Shilo, D.; Gabet, Y.; Aizenbud, D.; Rachmiel, A. Effects of Extracorporeal Shock Wave Therapy on Distraction Osteogenesis in Rat Mandible. Plast. Reconstr. Surg. 2018, 142, 1501–1509. [Google Scholar] [CrossRef]
- Császár, N.B.M.; Angstman, N.B.; Milz, S.; Sprecher, C.M.; Kobel, P.; Farhat, M.; Furia, J.P.; Schmitz, C. Radial Shock Wave Devices Generate Cavitation. PLoS ONE 2015, 10, e0140541. [Google Scholar] [CrossRef] [Green Version]
- Meirer, R.; Kamelger, F.; Huemer, G.; Wanner, S.; Piza-Katzer, H. Extracorporal shock wave may enhance skin flap survival in an animal model. Br. J. Plast. Surg. 2005, 58, 53–57. [Google Scholar] [CrossRef]
- Morais, T.M.D.L.; Meyer, P.F.; De Vasconcellos, L.S.; Silva, J.C.E.; Andrade, I.F.E.; De Farias, V.A.F.; Da Silva, I.C.; Araújo, R.M.F.G.; Da Silva, R.M.V.; Pacheco, E.F.; et al. Effects of the extracorporeal shock wave therapy on the skin: An experimental study. Lasers Med Sci. 2018, 34, 389–396. [Google Scholar] [CrossRef]
- Wang, F.-S.; Wang, C.-J.; Sheen-Chen, S.-M.; Kuo, Y.-R.; Chen, R.-F.; Yang, K.D. Superoxide Mediates Shock Wave Induction of ERK-dependent Osteogenic Transcription Factor (CBFA1) and Mesenchymal Cell Differentiation toward Osteoprogenitors. J. Biol. Chem. 2002, 277, 10931–10937. [Google Scholar] [CrossRef] [Green Version]
- Tam, K.-F.; Cheung, W.-H.; Lee, K.-M.; Qin, L.; Leung, K.-S. Osteogenic Effects of Low-Intensity Pulsed Ultrasound, Extracorporeal Shockwaves and Their Combination—An In Vitro Comparative Study on Human Periosteal Cells. Ultrasound Med. Biol. 2008, 34, 1957–1965. [Google Scholar] [CrossRef]
- Meirer, R.; Brunner, A.; Deibl, M.; Oehlbauer, M.; Kamelger, F.S.; Piza-Katzer, H. Shock Wave Therapy Reduces Necrotic Flap Zones and Induces VEGF Expression in Animal Epigastric Skin Flap Model. J. Reconstr. Microsurg. 2007, 23, 231–236. [Google Scholar] [CrossRef]
- Wang, F.-S.; Wang, C.-J.; Hueng-Chen, H.; Chang, P.-R.; Huang, Y.-T.; Sun, Y.-C.; Huang, H.C.; Yang, Y.-J.; Yang, K.D. Ras Induction of Superoxide Activates ERK-dependent Angiogenic Transcription Factor HIF-1α and VEGF-A Expression in Shock Wave-stimulated Osteoblasts. J. Biol. Chem. 2003, 279, 10331–10337. [Google Scholar] [CrossRef] [PubMed] [Green Version]
- Alshihri, A.A.; Kämmerer, P.W.; Heimes, D.; Niu, W.; Alnassar, T.; Spector, M. Extracorporeal Shock Wave Stimulates Angiogenesis and Collagen Production in Facial Soft Tissue. J. Surg. Res. 2019, 245, 483–491. [Google Scholar] [CrossRef] [PubMed] [Green Version]
- Wang, C.-J.; Huang, H.-Y.; Pai, C.-H. Shock wave-enhanced neovascularization at the tendon-bone junction: An experiment in dogs. J. Foot Ankle Surg. 2002, 41, 16–22. [Google Scholar] [CrossRef]
- Rasmussen, S.; Christensen, M.; Mathiesen, I.; Simonson, O. Shockwave therapy for chronic Achilles tendinopathy: A double-blind, randomized clinical trial of efficacy. Acta Orthop. 2008, 79, 249–256. [Google Scholar] [CrossRef]
- Kuo, Y.-R.; Wang, C.-T.; Wang, F.-S.; Chiang, Y.-C.; Wang, C.-J. Extracorporeal shock-wave therapy enhanced wound healing via increasing topical blood perfusion and tissue regeneration in a rat model of STZ-induced diabetes. Wound Repair Regen. 2009, 17, 522–530. [Google Scholar] [CrossRef] [PubMed]
- Sukubo, N.G.; Tibalt, E.; Respizzi, S.; Locati, M.; D’Agostino, M. Effect of shock waves on macrophages: A possible role in tissue regeneration and remodeling. Int. J. Surg. 2015, 24, 124–130. [Google Scholar] [CrossRef]
- Mariotto, S.; De Prati, A.C.; Cavalieri, E.; Amelio, E.; Marlinghaus, E.; Suzuki, H. Extracorporeal Shock Wave Therapy in Inflammatory Diseases: Molecular Mechanism that Triggers Anti-Inflammatory Action. Curr. Med. Chem. 2009, 16, 2366–2372. [Google Scholar] [CrossRef]
- Moghadam, A.S.; Mohammadian, S.; Vazini, H.; Taghadosi, M.; Esmaeili, S.-A.; Mardani, F.; Seifi, B.; Mohammadi, A.; Afshari, J.T.; Sahebkar, A. Macrophage plasticity, polarization, and function in health and disease. J. Cell. Physiol. 2018, 233, 6425–6440. [Google Scholar] [CrossRef]
- Ribatti, D.; Nico, B.; Vacca, A.; Presta, M. The gelatin sponge–chorioallantoic membrane assay. Nat. Protoc. 2006, 1, 85–91. [Google Scholar] [CrossRef]
- Merckx, M.G.; Tay, M.H.; Monaco, M.M.L.; Van Zandvoort, M.A.M.J.; De Spiegelaere, W.; Lambrichts, I.; Bronckaers, A. Chorioallantoic Membrane Assay as Model for Angiogenesis in Tissue Engineering: Focus on Stem Cells. Tissue Eng. Part B Rev. 2020. [Google Scholar] [CrossRef] [PubMed]
- Hincke, M.T.; Da Silva, M.; Guyot, N.; Gautron, J.; McKee, M.D.; Guabiraba-Brito, R.; Rehault-Godbert, S. Dynamics of Structural Barriers and Innate Immune Components during Incubation of the Avian Egg: Critical Interplay between Autonomous Embryonic Development and Maternal Anticipation. J. Innate Immun. 2018, 11, 111–124. [Google Scholar] [CrossRef] [PubMed]
- Kaspers, B.; Kaiser, P. Avian Antigen-Presenting Cells. In Avian Immunology; Elsevier BV: Amsterdam, The Netherlands, 2014; pp. 169–188. [Google Scholar]
- Kuo, Y.-R.; Wu, W.-S.; Hsieh, Y.-L.; Wang, F.-S.; Wang, C.-T.; Chiang, Y.-C.; Wang, C.-J. Extracorporeal Shock Wave Enhanced Extended Skin Flap Tissue Survival via Increase of Topical Blood Perfusion and Associated with Suppression of Tissue Pro-Inflammation. J. Surg. Res. 2007, 143, 385–392. [Google Scholar] [CrossRef] [PubMed]
- Basoli, V.; Chaudary, S.; Cruciani, S.; Santaniello, S.; Balzano, F.; Ventura, C.; Redl, H.; Dungel, P.; Maioli, M. Mechanical Stimulation of Fibroblasts by Extracorporeal Shock Waves: Modulation of Cell Activation and Proliferation Through a Transient Proinflammatory Milieu. Cell Transplant. 2020, 29, 29. [Google Scholar] [CrossRef] [PubMed] [Green Version]
- Mattyasovszky, S.G.; Langendorf, E.K.; Ritz, U.; Schmitz, C.; Schmidtmann, I.; Nowak, T.E.; Wagner, D.; Hofmann, A.; Rommens, P.M.; Drees, P. Exposure to radial extracorporeal shock waves modulates viability and gene expression of human skeletal muscle cells: A controlled in vitro study. J. Orthop. Surg. Res. 2018, 13, 75. [Google Scholar] [CrossRef] [Green Version]
- Martini, L.; Giavaresi, G.; Fini, M.; Torricelli, P.; Borsari, V.; Giardino, R.; De Pretto, M.; Remondini, D.; Castellani, G. Shock Wave Therapy as an Innovative Technology in Skeletal Disorders: Study on Transmembrane Current in Stimulated Osteoblast-Like Cells. Int. J. Artif. Organs 2005, 28, 841–847. [Google Scholar] [CrossRef]
- Ciampa, A.R.; De Prati, A.C.; Amelio, E.; Cavalieri, E.; Persichini, T.; Colasanti, M.; Musci, G.; Marlinghaus, E.; Suzuki, H.; Mariotto, S. Nitric oxide mediates anti-inflammatory action of extracorporeal shock waves. FEBS Lett. 2005, 579, 6839–6845. [Google Scholar] [CrossRef] [PubMed]
- Wang, F.S.; Yang, K.D.; Chen, R.F.; Wang, C.J.; Sheen-Chen, S.M. Extracorporeal shock wave promotes growth and differentiation of bone-marrow stromal cells towards osteoprogenitors associated with induction of TGF-beta1. J. Bone Jt. Surg. Br 2002, 84, 457–461. [Google Scholar] [CrossRef]
- Kiessling, M.C.; Milz, S.; Frank, H.-G.; Korbel, R.; Schmitz, C. Radial extracorporeal shock wave treatment harms developing chicken embryos. Sci. Rep. 2015, 5, 8281. [Google Scholar] [CrossRef] [Green Version]
- Lee, J.-W.; Bae, S.-H.; Jeong, J.-W.; Kim, S.-H.; Kim, K.-W. Hypoxia-inducible factor (HIF-1)α: Its protein stability and biological functions. Exp. Mol. Med. 2004, 36, 1–12. [Google Scholar] [CrossRef]
- Ribatti, D.; De Falco, G.; Nico, B.; Ria, R.; Crivellato, E.; Vacca, A. In vivo time-course of the angiogenic response induced by multiple myeloma plasma cells in the chick embryo chorioallantoic membrane. J. Anat. 2003, 203, 323–328. [Google Scholar] [CrossRef] [PubMed]
- Zijlstra, A.; Aimes, R.T.; Zhu, D.; Regazzoni, K.; Kupriyanova, T.; Seandel, M.; Deryugina, E.I.; Quigley, J.P. Collagenolysis-dependent Angiogenesis Mediated by Matrix Metalloproteinase-13 (Collagenase-3). J. Biol. Chem. 2004, 279, 27633–27645. [Google Scholar] [CrossRef] [PubMed] [Green Version]
- Zijlstra, A.; Seandel, M.; Kupriyanova, T.A.; Partridge, J.J.; Madsen, M.A.; Hahn-Dantona, E.A.; Quigley, J.P.; Deryugina, E.I. Proangiogenic role of neutrophil-like inflammatory heterophils during neovascularization induced by growth factors and human tumor cells. Blood 2006, 107, 317–327. [Google Scholar] [CrossRef] [PubMed] [Green Version]
- Deryugina, E.I.; Quigley, J.P. Chick embryo chorioallantoic membrane model systems to study and visualize human tumor cell metastasis. Histochem. Cell Biol. 2008, 130, 1119–1130. [Google Scholar] [CrossRef] [PubMed] [Green Version]
- Van Hinsbergh, V.W.M.; Engelse, M.A.; Quax, P.H.A. Pericellular Proteases in Angiogenesis and Vasculogenesis. Arter. Thromb. Vasc. Biol. 2006, 26, 716–728. [Google Scholar] [CrossRef] [Green Version]
- Van Hinsbergh, V.W.M.; Koolwijk, P. Endothelial sprouting and angiogenesis: Matrix metalloproteinases in the lead. Cardiovasc. Res. 2008, 78, 203–212. [Google Scholar] [CrossRef] [PubMed] [Green Version]
- Kudo, Y.; Iizuka, S.; Yoshida, M.; Tsunematsu, T.; Kondo, T.; Subarnbhesaj, A.; Deraz, E.M.; Siriwardena, S.B.S.M.; Tahara, H.; Ishimaru, N.; et al. Matrix Metalloproteinase-13 (MMP-13) Directly and Indirectly Promotes Tumor Angiogenesis. J. Biol. Chem. 2012, 287, 38716–38728. [Google Scholar] [CrossRef] [Green Version]
- Christoffersson, G.; Vågesjö, E.; Vandooren, J.; Lidén, M.; Massena, S.; Reinert, R.B.; Brissova, M.; Powers, A.C.; Opdenakker, G.; Phillipson, M. VEGF-A recruits a proangiogenic MMP-9–delivering neutrophil subset that induces angiogenesis in transplanted hypoxic tissue. Blood 2012, 120, 4653–4662. [Google Scholar] [CrossRef]
- Nozawa, H.; Chiu, C.; Hanahan, D. Infiltrating neutrophils mediate the initial angiogenic switch in a mouse model of multistage carcinogenesis. Proc. Natl. Acad. Sci. USA 2006, 103, 12493–12498. [Google Scholar] [CrossRef] [Green Version]
- Bausch, D.; Pausch, T.; Krauss, T.; Hopt, U.T.; Fernandez-Del-Castillo, C.; Warshaw, A.L.; Thayer, S.P.; Keck, T. Neutrophil granulocyte derived MMP-9 is a VEGF independent functional component of the angiogenic switch in pancreatic ductal adenocarcinoma. Angiogenesis 2011, 14, 235–243. [Google Scholar] [CrossRef] [Green Version]
- Fetz, M.A.E.; Radic, M.; Bowlin, G.L. Neutrophils in Biomaterial-Guided Tissue Regeneration: Matrix Reprogramming for Angiogenesis. Tissue Eng. Part B Rev. 2020. [Google Scholar] [CrossRef] [PubMed]
- Ardi, V.C.; Kupriyanova, T.A.; Deryugina, E.I.; Quigley, J.P. Human neutrophils uniquely release TIMP-free MMP-9 to provide a potent catalytic stimulator of angiogenesis. Proc. Natl. Acad. Sci. USA 2007, 104, 20262–20267. [Google Scholar] [CrossRef] [Green Version]
- Cai, Z.; Falkensammer, F.; Andrukhov, O.; Chen, J.; Mittermayr, R.; Rausch-Fan, X. Effects of Shock Waves on Expression of IL-6, IL-8, MCP-1, and TNF-? Expression by Human Periodontal Ligament Fibroblasts: An In Vitro Study. Med Sci. Monit. 2016, 22, 914–921. [Google Scholar] [CrossRef] [PubMed] [Green Version]
- Valentin, J.E.; Badylak, J.S.; McCabe, G.P.; Badylak, S.F. Extracellular matrix bioscaffolds for orthopaedic applications. A comparative histologic study. J. Bone Jt. Surg. Am. 2006, 88, 2673–2686. [Google Scholar] [CrossRef]
- Badylak, S.F.; Valentin, J.E.; Ravindra, A.K.; McCabe, G.P.; Stewart-Akers, A.M. Macrophage Phenotype as a Determinant of Biologic Scaffold Remodeling. Tissue Eng. Part A 2008, 14, 1835–1842. [Google Scholar] [CrossRef]
- Zhang, Y.; Al-Maawi, S.; Wang, X.; Sader, R.; Kirkpatrick, C.J.; Ghanaati, S. Biomaterial-induced multinucleated giant cells express proinflammatory signaling molecules: A histological study in humans. J. Biomed. Mater. Res. Part A 2018. [Google Scholar] [CrossRef]
- Botiss Biomaterials GmbH. Mucoderm® 3d-Kollagenmatrix Für Die Weichgeweberegeneration—Wissenschaftliche Und Klinische Grundlagen; Botiss Biomaterials GmbH: Zossen, Germany, 2020. [Google Scholar]
Publisher’s Note: MDPI stays neutral with regard to jurisdictional claims in published maps and institutional affiliations. |


| Group | Intravital Fluorescence Microscopy | qPCR | Immunohistochemical Staining | |
|---|---|---|---|---|
| Day 10 | −ESWT | 6 | NA | NA |
| +ESWT | 8 | NA | NA | |
| Day 11 | −ESWT | 8 | 8 | NA |
| +ESWT | 9 | 5 | NA | |
| Day 14 | −ESWT | 8 | 7 | 4 |
| +ESWT | 9 | 5 | 5 |
| Gene | Primer Name | Sequence |
|---|---|---|
| Beta actin gene | cACTB-s | ACCCCAAAGCCAACAGA |
| cACTB-as | CCAGAGTCCATCACAATACC | |
| HIF-1α | cHIF1a-s | GCAGCTACTACATCACTTTCTT |
| cHIF1a-as | CAGCAGTCTACATGCTAAATCA | |
| VEGF | cVEGFA-s | CCTGGAAGTCTACGAACGCA |
| cVEGFA-as | CACAGTGAAAGCTGGGTGGT | |
| MMP-9 | cMMP9-s cMMP9-as | GTCCAGACAGTGGACAAGGG |
| CTGGTAACGTGGGGTCATCC | ||
| MMP-13 | cMMP13-s cMMP9-as | CAGGTTTTTCTGGCGACTGC |
| TGGGGTAGCCTGTGTCCATA | ||
| iNOS2 | cNOS2-s cNOS2-as | GGCATGATGAGACCCGTAGG |
| GCCCAATAGCCACCTTCAGT |
© 2020 by the authors. Licensee MDPI, Basel, Switzerland. This article is an open access article distributed under the terms and conditions of the Creative Commons Attribution (CC BY) license (http://creativecommons.org/licenses/by/4.0/).
Share and Cite
Heimes, D.; Wiesmann, N.; Eckrich, J.; Brieger, J.; Mattyasovszky, S.; Proff, P.; Weber, M.; Deschner, J.; Al-Nawas, B.; Kämmerer, P.W. In Vivo Modulation of Angiogenesis and Immune Response on a Collagen Matrix via Extracorporeal Shockwaves. Int. J. Mol. Sci. 2020, 21, 7574. https://doi.org/10.3390/ijms21207574
Heimes D, Wiesmann N, Eckrich J, Brieger J, Mattyasovszky S, Proff P, Weber M, Deschner J, Al-Nawas B, Kämmerer PW. In Vivo Modulation of Angiogenesis and Immune Response on a Collagen Matrix via Extracorporeal Shockwaves. International Journal of Molecular Sciences. 2020; 21(20):7574. https://doi.org/10.3390/ijms21207574
Chicago/Turabian StyleHeimes, Diana, Nadine Wiesmann, Jonas Eckrich, Juergen Brieger, Stefan Mattyasovszky, Peter Proff, Manuel Weber, James Deschner, Bilal Al-Nawas, and Peer W. Kämmerer. 2020. "In Vivo Modulation of Angiogenesis and Immune Response on a Collagen Matrix via Extracorporeal Shockwaves" International Journal of Molecular Sciences 21, no. 20: 7574. https://doi.org/10.3390/ijms21207574