Article

Lactobacillus Strains Alleviated Hyperlipidemia and Liver Steatosis in Aging Rats via Activation of AMPK

1
School of Industrial Technology, Universiti Sains Malaysia, Penang 11800, Malaysia
2
USM-RIKEN International Centre for Ageing Science (URICAS), Universiti Sains Malaysia, Penang 11800, Malaysia
3
Institute of Biological Sciences, Faculty of Science, University of Malaya, Kuala Lumpur 50603, Malaysia
4
School of Biological Science, Universiti Sains Malaysia, Penang 11800, Malaysia
5
School of Data Sciences, Perdana University, MARDI Complex, Selangor 43400, Malaysia
*
Authors to whom correspondence should be addressed.
Int. J. Mol. Sci. 2020, 21(16), 5872; https://doi.org/10.3390/ijms21165872
Submission received: 8 June 2020 / Revised: 1 July 2020 / Accepted: 1 July 2020 / Published: 16 August 2020
(This article belongs to the Special Issue Nutraceuticals in Chronic Diseases)

Abstract

:
In this study, we hypothesized that different strains of Lactobacillus can alleviate hyperlipidemia and liver steatosis via activation of 5′ adenosine monophosphate-activated protein kinase (AMPK), an enzyme that is involved in cellular energy homeostasis, in aged rats. Male rats were fed with a high-fat diet (HFD) and injected with D-galactose daily over 12 weeks to induce aging. Treatments included (n = 6) (i) normal diet (ND), (ii) HFD, (iii) HFD-statin (lovastatin 2 mg/kg/day), (iv) HFD-Lactobacillus fermentum DR9 (10 log CFU/day), (v) HFD-Lactobacillus plantarum DR7 (10 log CFU/day), and (vi) HFD-Lactobacillus reuteri 8513d (10 log CFU/day). Rats administered with statin, DR9, and 8513d reduced serum total cholesterol levels after eight weeks (p < 0.05), while the administration of DR7 reduced serum triglycerides level after 12 weeks (p < 0.05) as compared to the HFD control. A more prominent effect was observed from the administration of DR7, where positive effects were observed, ranging from hepatic gene expressions to liver histology as compared to the control (p < 0.05); downregulation of hepatic lipid synthesis and β-oxidation gene stearoyl-CoA desaturase 1 (SCD1), upregulation of hepatic sterol excretion genes of ATP-binding cassette subfamily G member 5 and 8 (ABCG5 and ABCG8), lesser degree of liver steatosis, and upregulation of hepatic energy metabolisms genes AMPKα1 and AMPKα2. Taken altogether, this study illustrated that the administration of selected Lactobacillus strains led to improved lipid profiles via activation of energy and lipid metabolisms, suggesting the potentials of Lactobacillus as a promising natural intervention for alleviation of cardiovascular and liver diseases.

1. Introduction

Aging is defined as a time-dependent progressive deteriorative change that increases vulnerability to challenges and decreases the ability to survive [1]. Aging is often associated with metabolic diseases, such as hyperlipidemia, that increase the risk of cardiovascular diseases (CVD). According to the World Health Organization, on a global level, CVD accounts for 31% of all deaths, and cardiovascular complications are considered as the main factors of morbidity and mortality. The estimated cost of CVD will exceed one billion Euros by 2030.
Elevated levels of blood lipid, or hyperlipidemia, are well-documented risk factors for CVD. Hyperlipidemia can broadly be classified as isolated elevation of cholesterol, isolated elevated triglyceride (TG), and elevations of both [2]. Hyperlipidemia has also been shown to affect the antioxidant status of different organs, as well as their lipoprotein levels, which in turn can intensify metabolic disturbances and increases the risk of cardiovascular diseases [3], as well as nonalcoholic fatty liver disease (NAFLD) [4]
The use of statin has resulted in significant improvement in morbidity and mortality from CVD [5]. Statin was shown to reduce CVD via reduction of low-density lipoprotein cholesterol (LDL-C) [6]. However, even with the substantial LDL-C lowering achieved with statin treatments, these drugs have reduced coronary heart disease (CHD)-associated mortality and morbidity by only ~30% [7]. Reports are now showing that cardiac events occur in people even without clinically abnormal LDL-C concentrations, suggesting that LDL-C is not the only parameter that need to be monitored [2]. Suggestion to improve the risk prediction and treatment has been to focus on non-high-density-lipoprotein (HDL) cholesterol (includes LDL and other intermediate or end products of triglyceride-rich lipoprotein) levels rather than on just LDL-C [8]. Probiotics, such as those from the genus of Lactobacillus, have been reported to have a long history of safe use, primarily for gut health, antimicrobial properties [9,10], and now in metabolic diseases including hypertension [11] for improvement of blood lipid profiles and reducing total cholesterol (TC) and TG concentrations in blood [12,13]. A recent systematic review and a meta-analysis of 15 randomized controlled trials reported that probiotics consumption was able to decrease total-cholesterol and LDL-cholesterol levels effectively [14].
Conventionally, AMPK has been viewed as a main control governing systemic and cellular energy status while protecting cellular function under energy-restricted conditions. Recent evidence has shown that AMPK can be activated by varying responses, ranging from metabolic stresses, glucose deprivation, exercise, and muscle contraction. Activation of AMPK initiates the reprogramming of metabolism, leading to a restored energy balance, making AMPK a key regulator of crucial biological pathways. We have recently reported the ability of Lactobacillus strains to activate the AMPK pathway in mammalian cell cultures via phosphorylation [15]. In addition to controlling energy metabolism, AMPK has also been shown as a key player in the regulation of hepatic lipid metabolism via lowering hepatic TG level and oxidation of hepatic fat [16].
It is worth noting that the effects, mechanisms, and targets of probiotics are strain-specific. In this study, we aimed to study the effects of Lactobacillus fermentum DR9, Lactobacillus plantarum DR7, and Lactobacillus reuteri 8513d on the lipid metabolism in an aging rat model. While past studies have used a high-fat diet to induce aging, recent studies have shown that aging can also be accelerated via chronic administration of D-galactose, primarily via accumulation of reactive oxygen species, as well as through glycation of end products [17]. The D-galactose-induced model has also been reported to exhibit conditions similar to naturally aged animals [18]. Considering that we have found AMPK activation potentials of certain Lactobacillus strains, we hypothesized that some of these strains can also regulate lipid metabolism, alleviate hyperlipidemia, and restore liver conditions, such as that of steatosis. We postulate that this study will advance the field of nutrition through our efforts to use probiotics a natural dietary intervention against cardiovascular and liver diseases.

2. Results

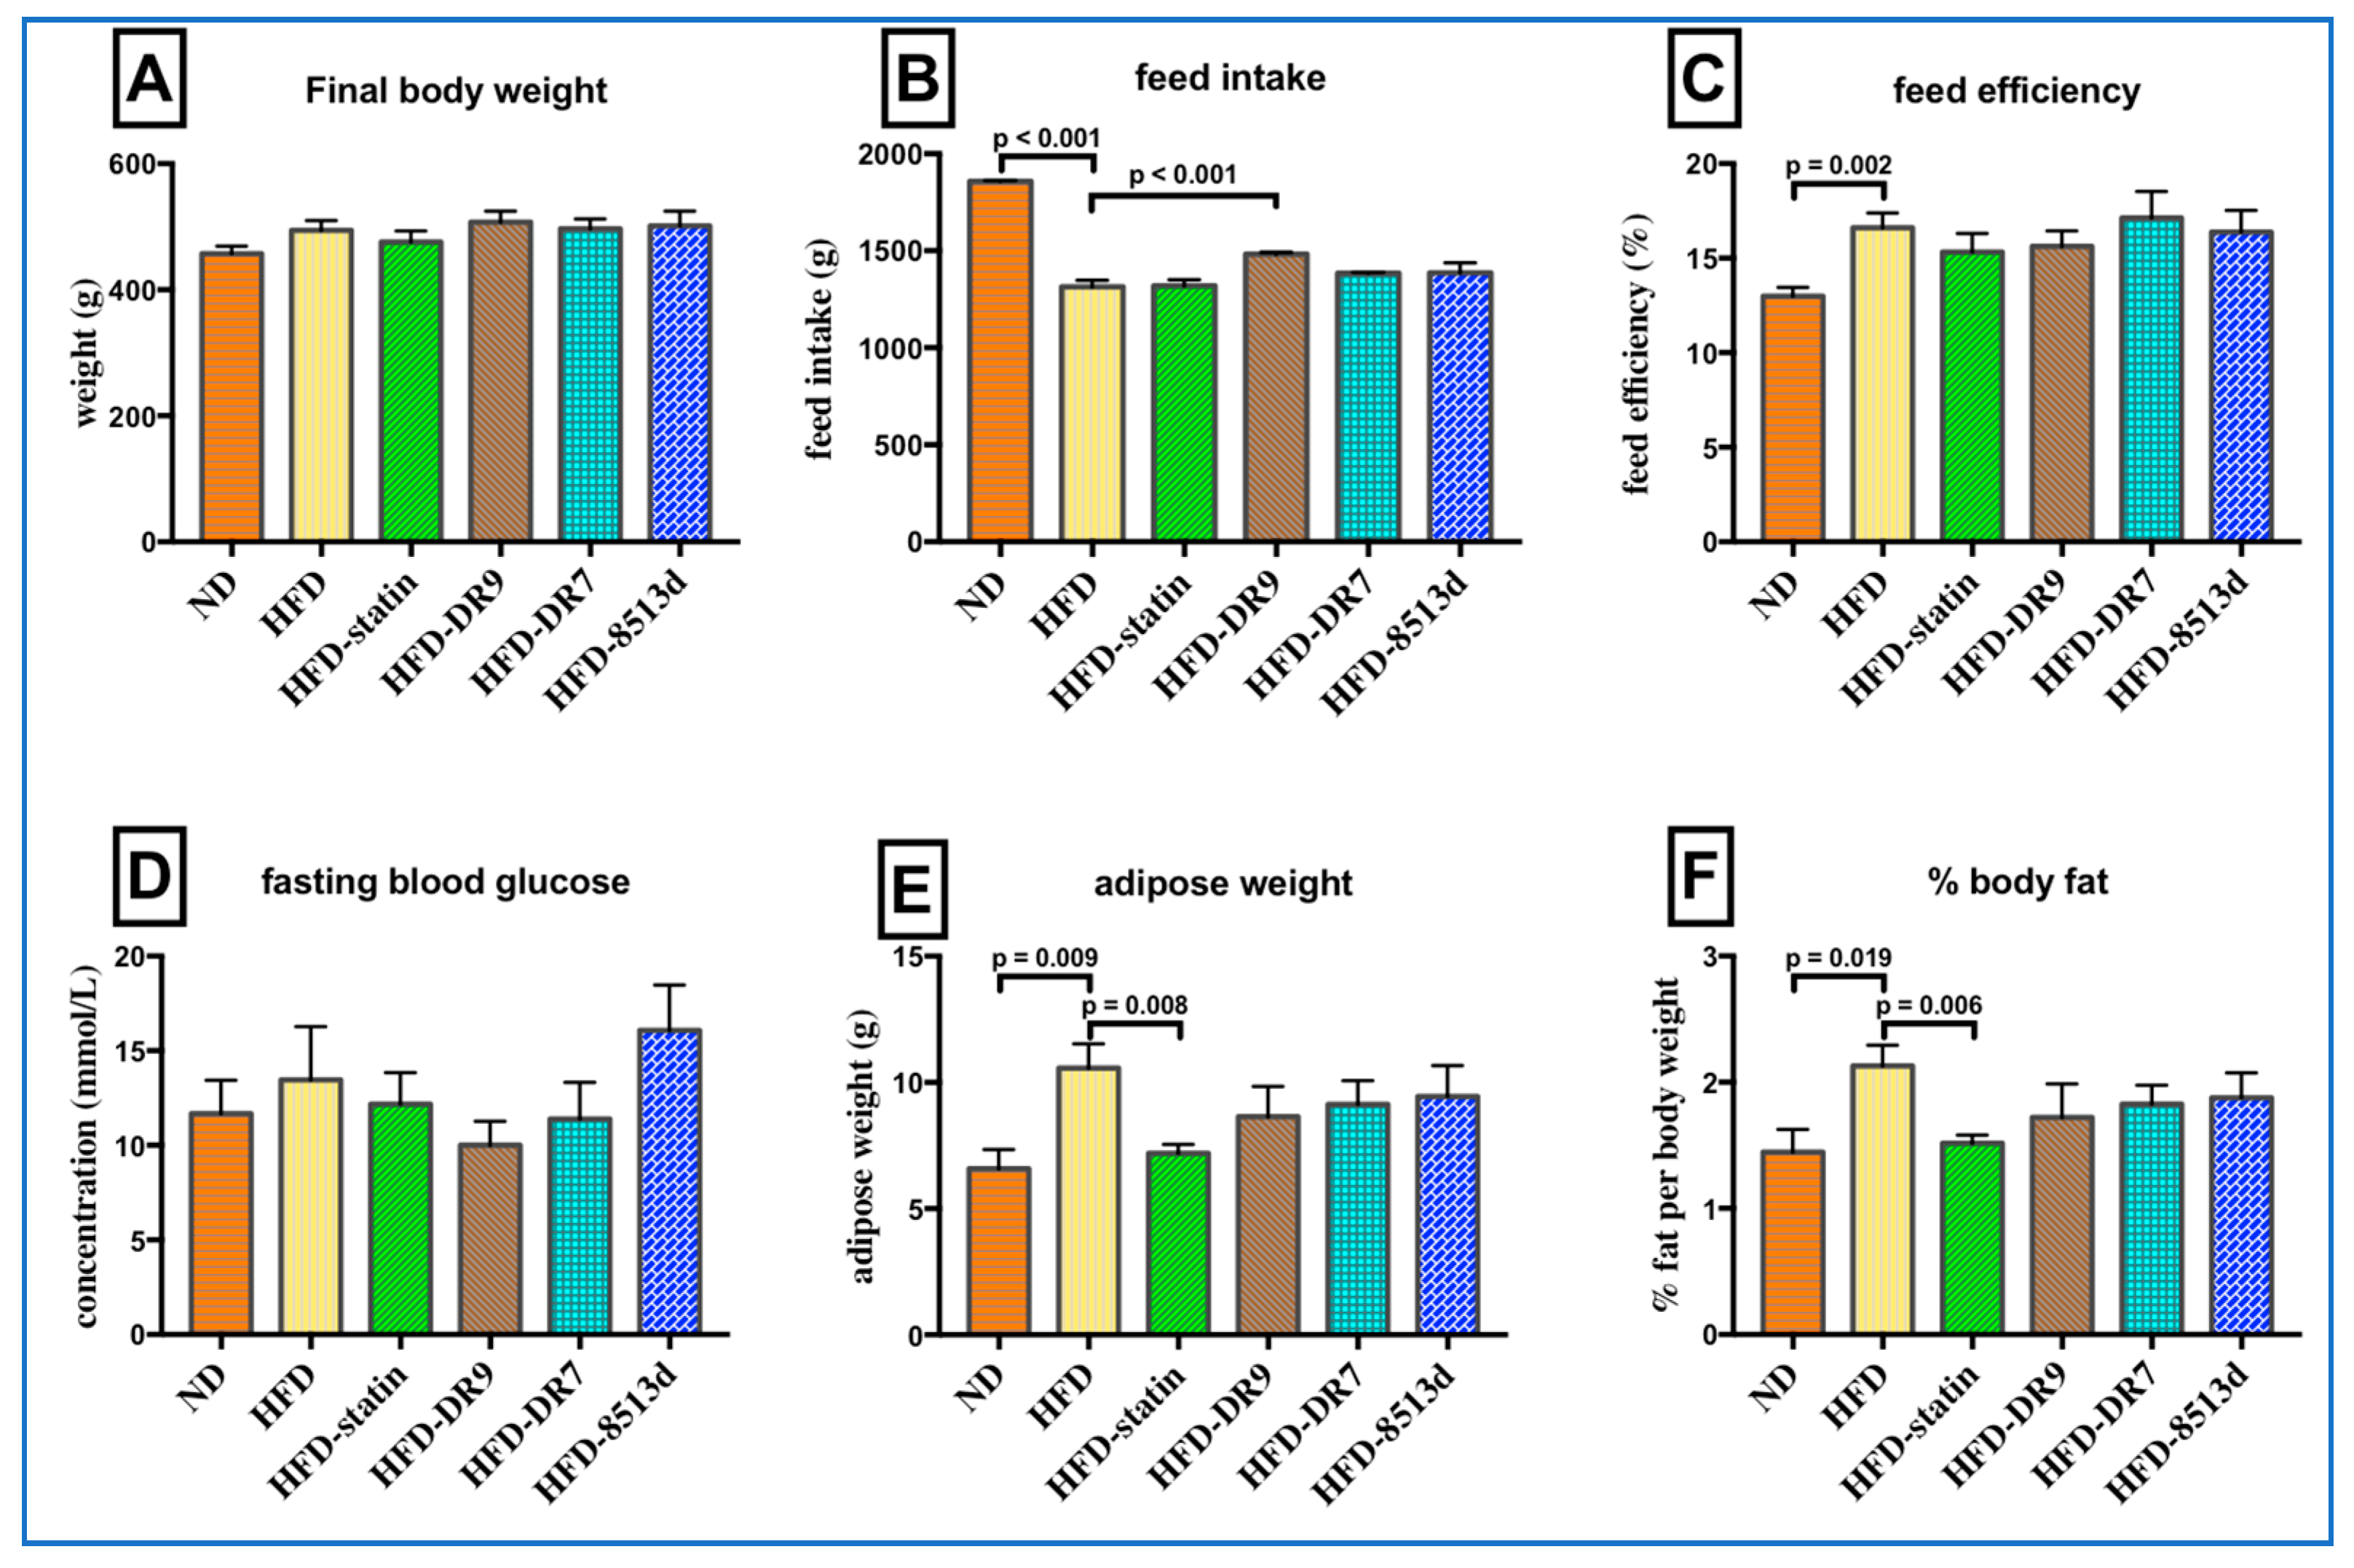
2.1. Body Weight, Feed Intake, Feed Efficacy, Fasting Blood Glucose, Adipose Weight, and Percent Body Fat

The final body weight, food intake and efficiency, fasting blood glucose, adipose weight, and percentage of body fat of the rats after 12 weeks of treatment are as shown in Figure 1. There was no significant difference in final body and fasting blood glucose when comparing between all the treatment groups. Feed intake was highest in the ND group. The HFD-DR9 group showed a significantly higher (p < 0.05) feed intake compared to the HFD group.
Feed efficiency was significantly higher (p < 0.05) in the HFD group as compared to the ND group. It was also observed that the HFD group had a significant higher (p < 0.05) adipose weight and percent body fat as compared to the ND group. Results also showed that the HFD-statin group had a significantly lower (p < 0.05) adipose weight and percent body fat as compared to the HFD group. There was no significant difference (p > 0.05) in adipose weight and percent body fat when comparing the HFD-DR9, HFD-DR7, and HFD-8513d groups with the HFD group.

2.2. Serum Biochemical Analysis

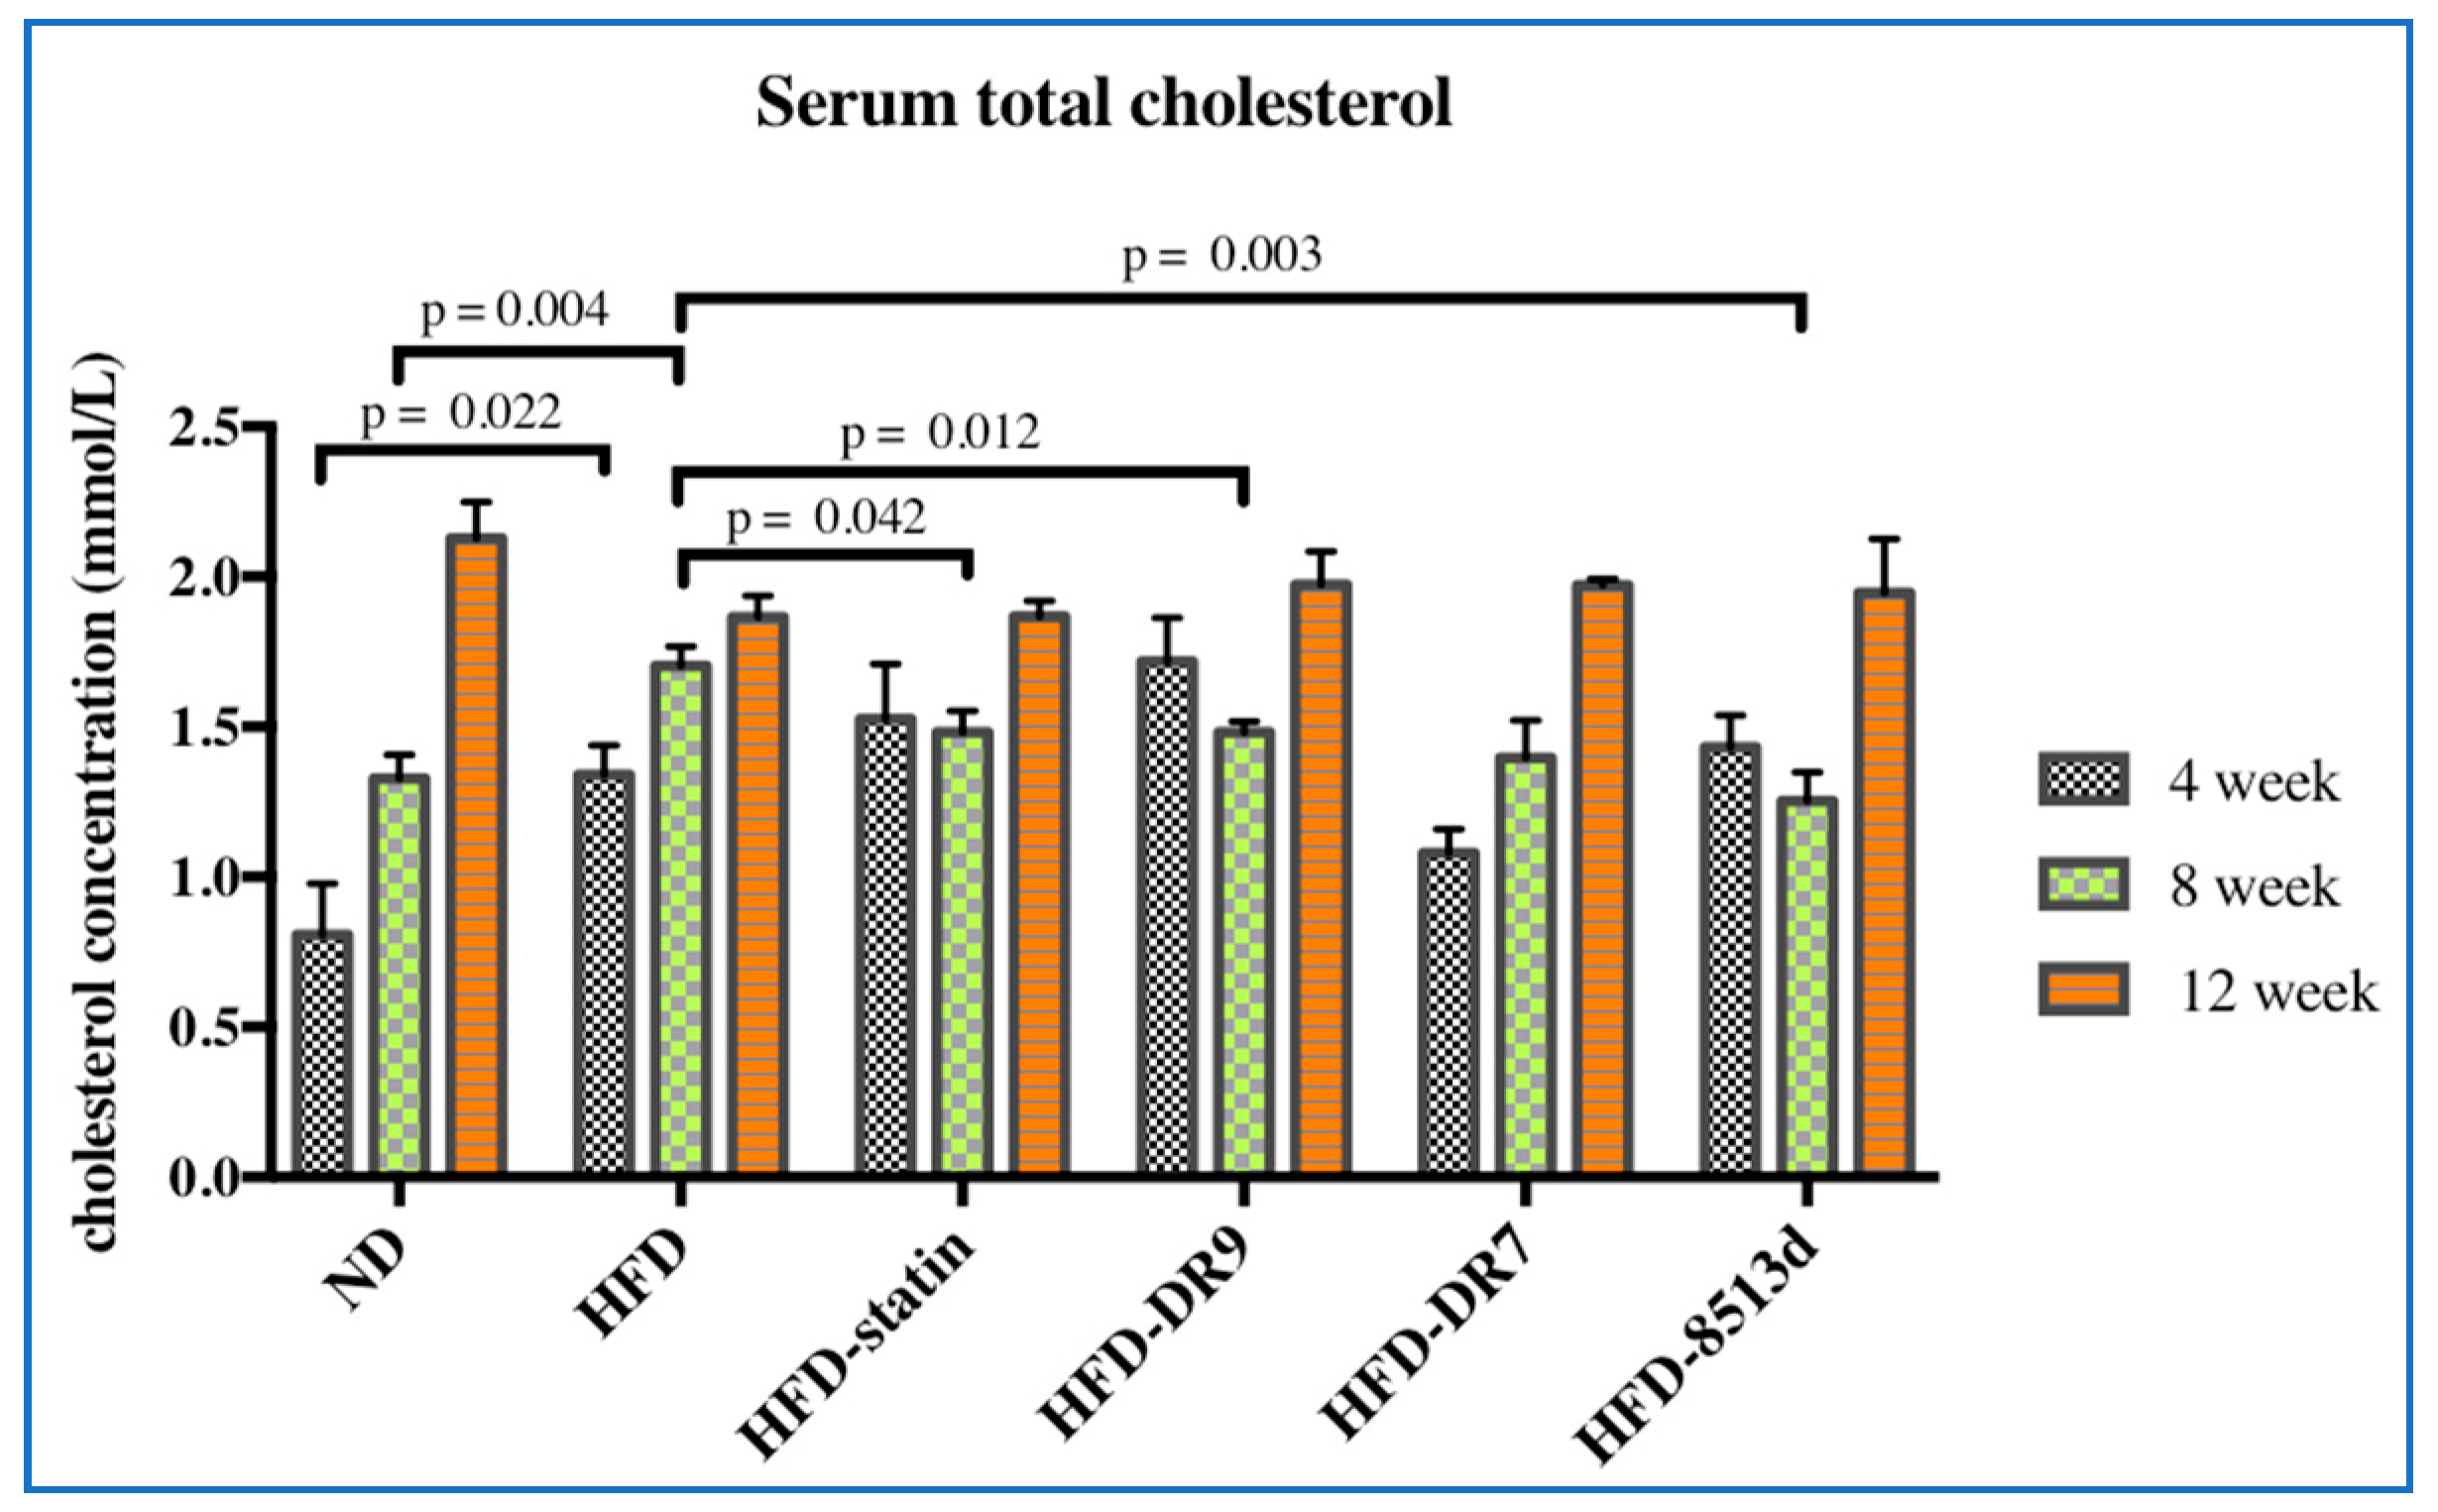
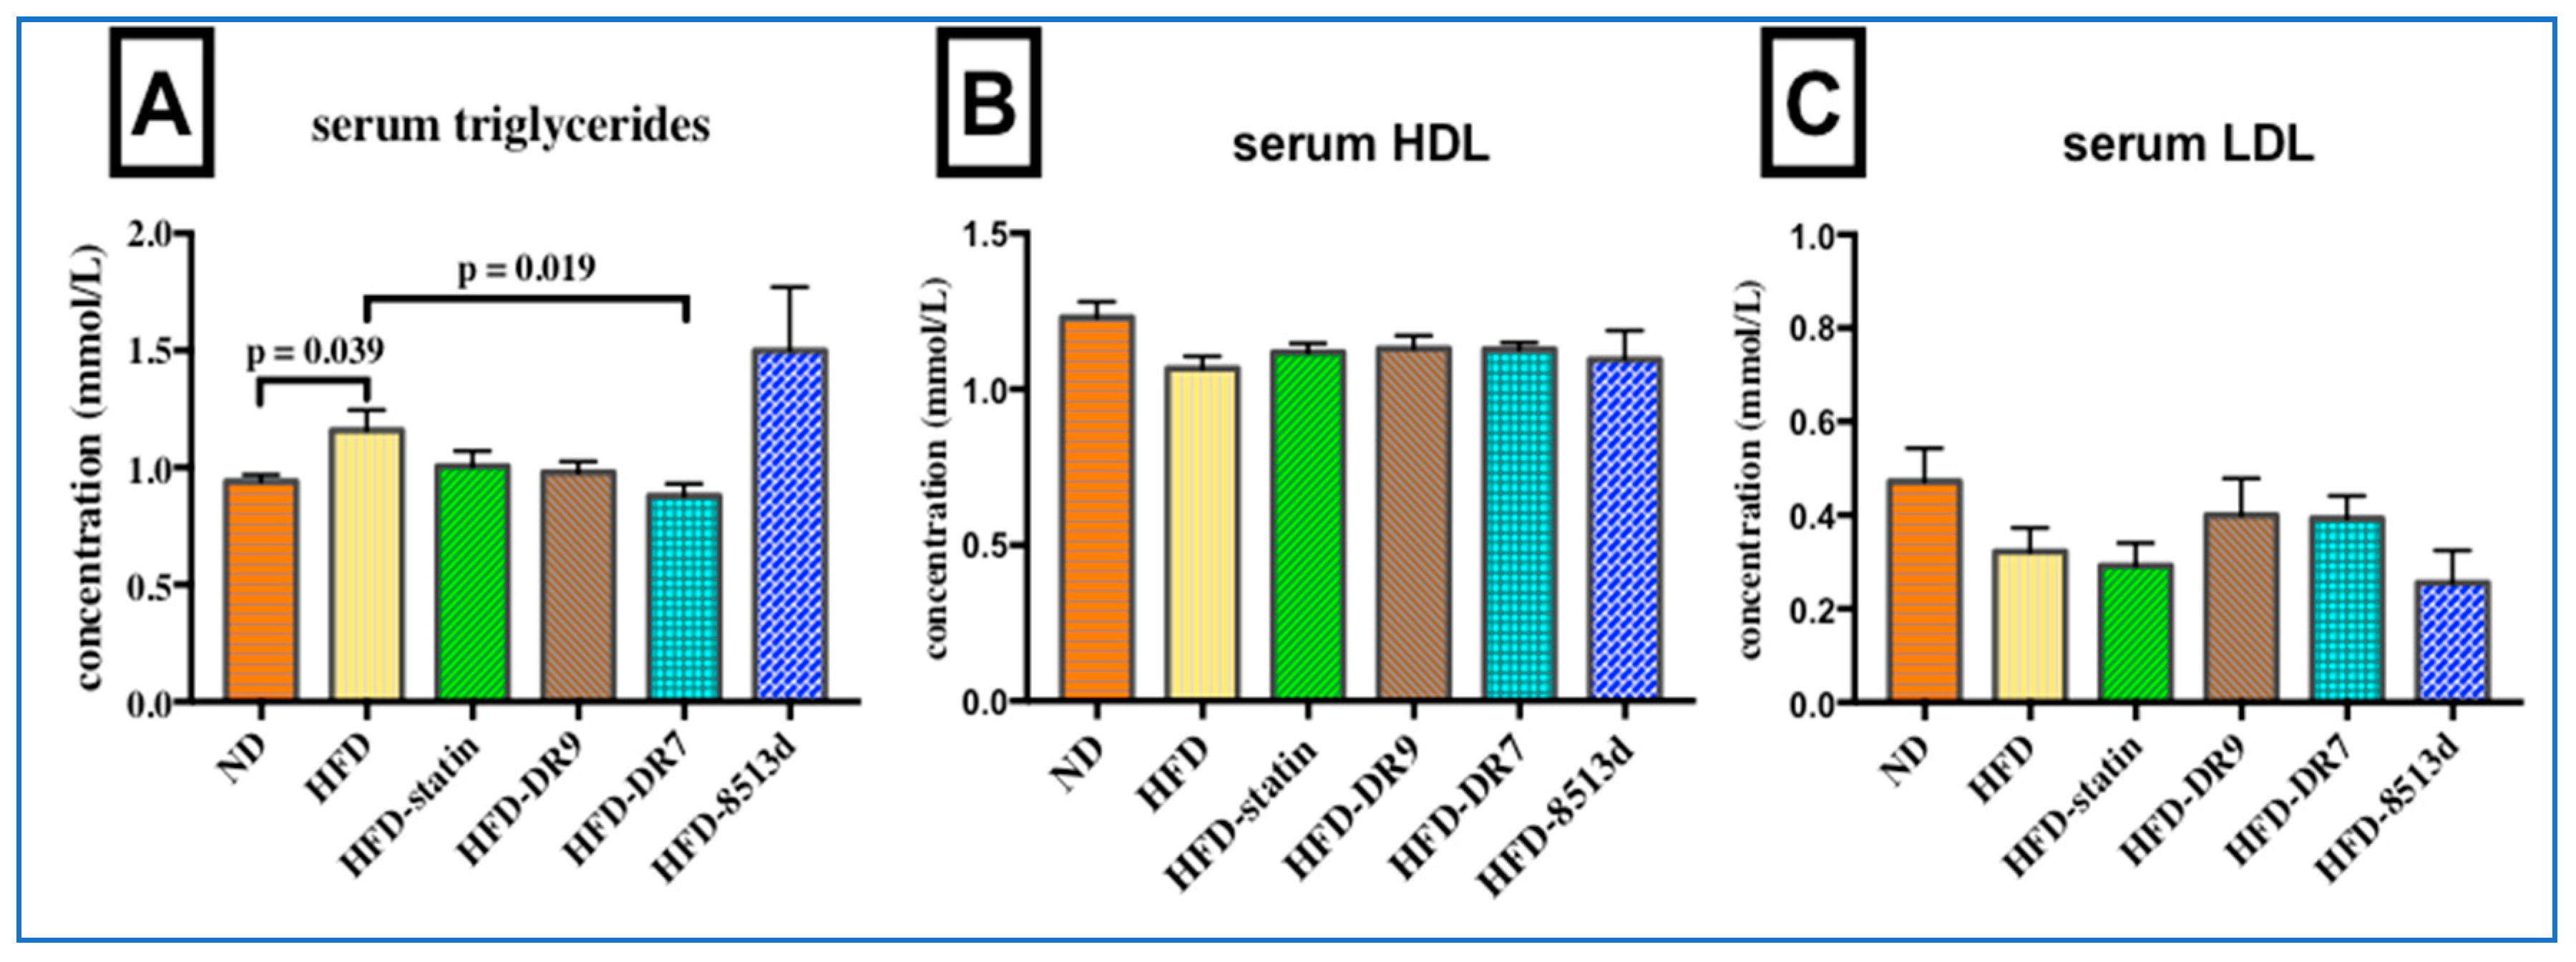
2.2.1. Serum Lipid Profile

Serum total cholesterol levels were as shown in Figure 2. After four weeks of treatment, it was observed that the HFD group had a significantly higher (p < 0.05) total cholesterol level compared to the ND group. No significant changes in the total cholesterol level were observed between the HFD group and the HFD-statin, HFD-DR9, HFD-DR7, and HFD-8513d groups after four weeks of treatment. However, after eight weeks of treatment, results showed that the HFD-statin, HFD-DR9, and HFD-8513d groups had significantly lower (p < 0.05) serum total cholesterol level compared to the HFD group. No significant difference between the different treatment groups was observed at week 12.
Serum triglyceride, HDL, and LDL levels in rats after 12 weeks of treatments were as shown in Figure 3. Results showed that serum triglyceride level was significantly increased (p < 0.05) when the rats were fed with high-fat diet. Only the HFD-DR7 group showed a significantly lower (p < 0.05) triglyceride level when compared to the HFD group. No significant changes in serum HDL and LDL level was observed when comparing between the different groups of rats after 12 weeks of treatment.

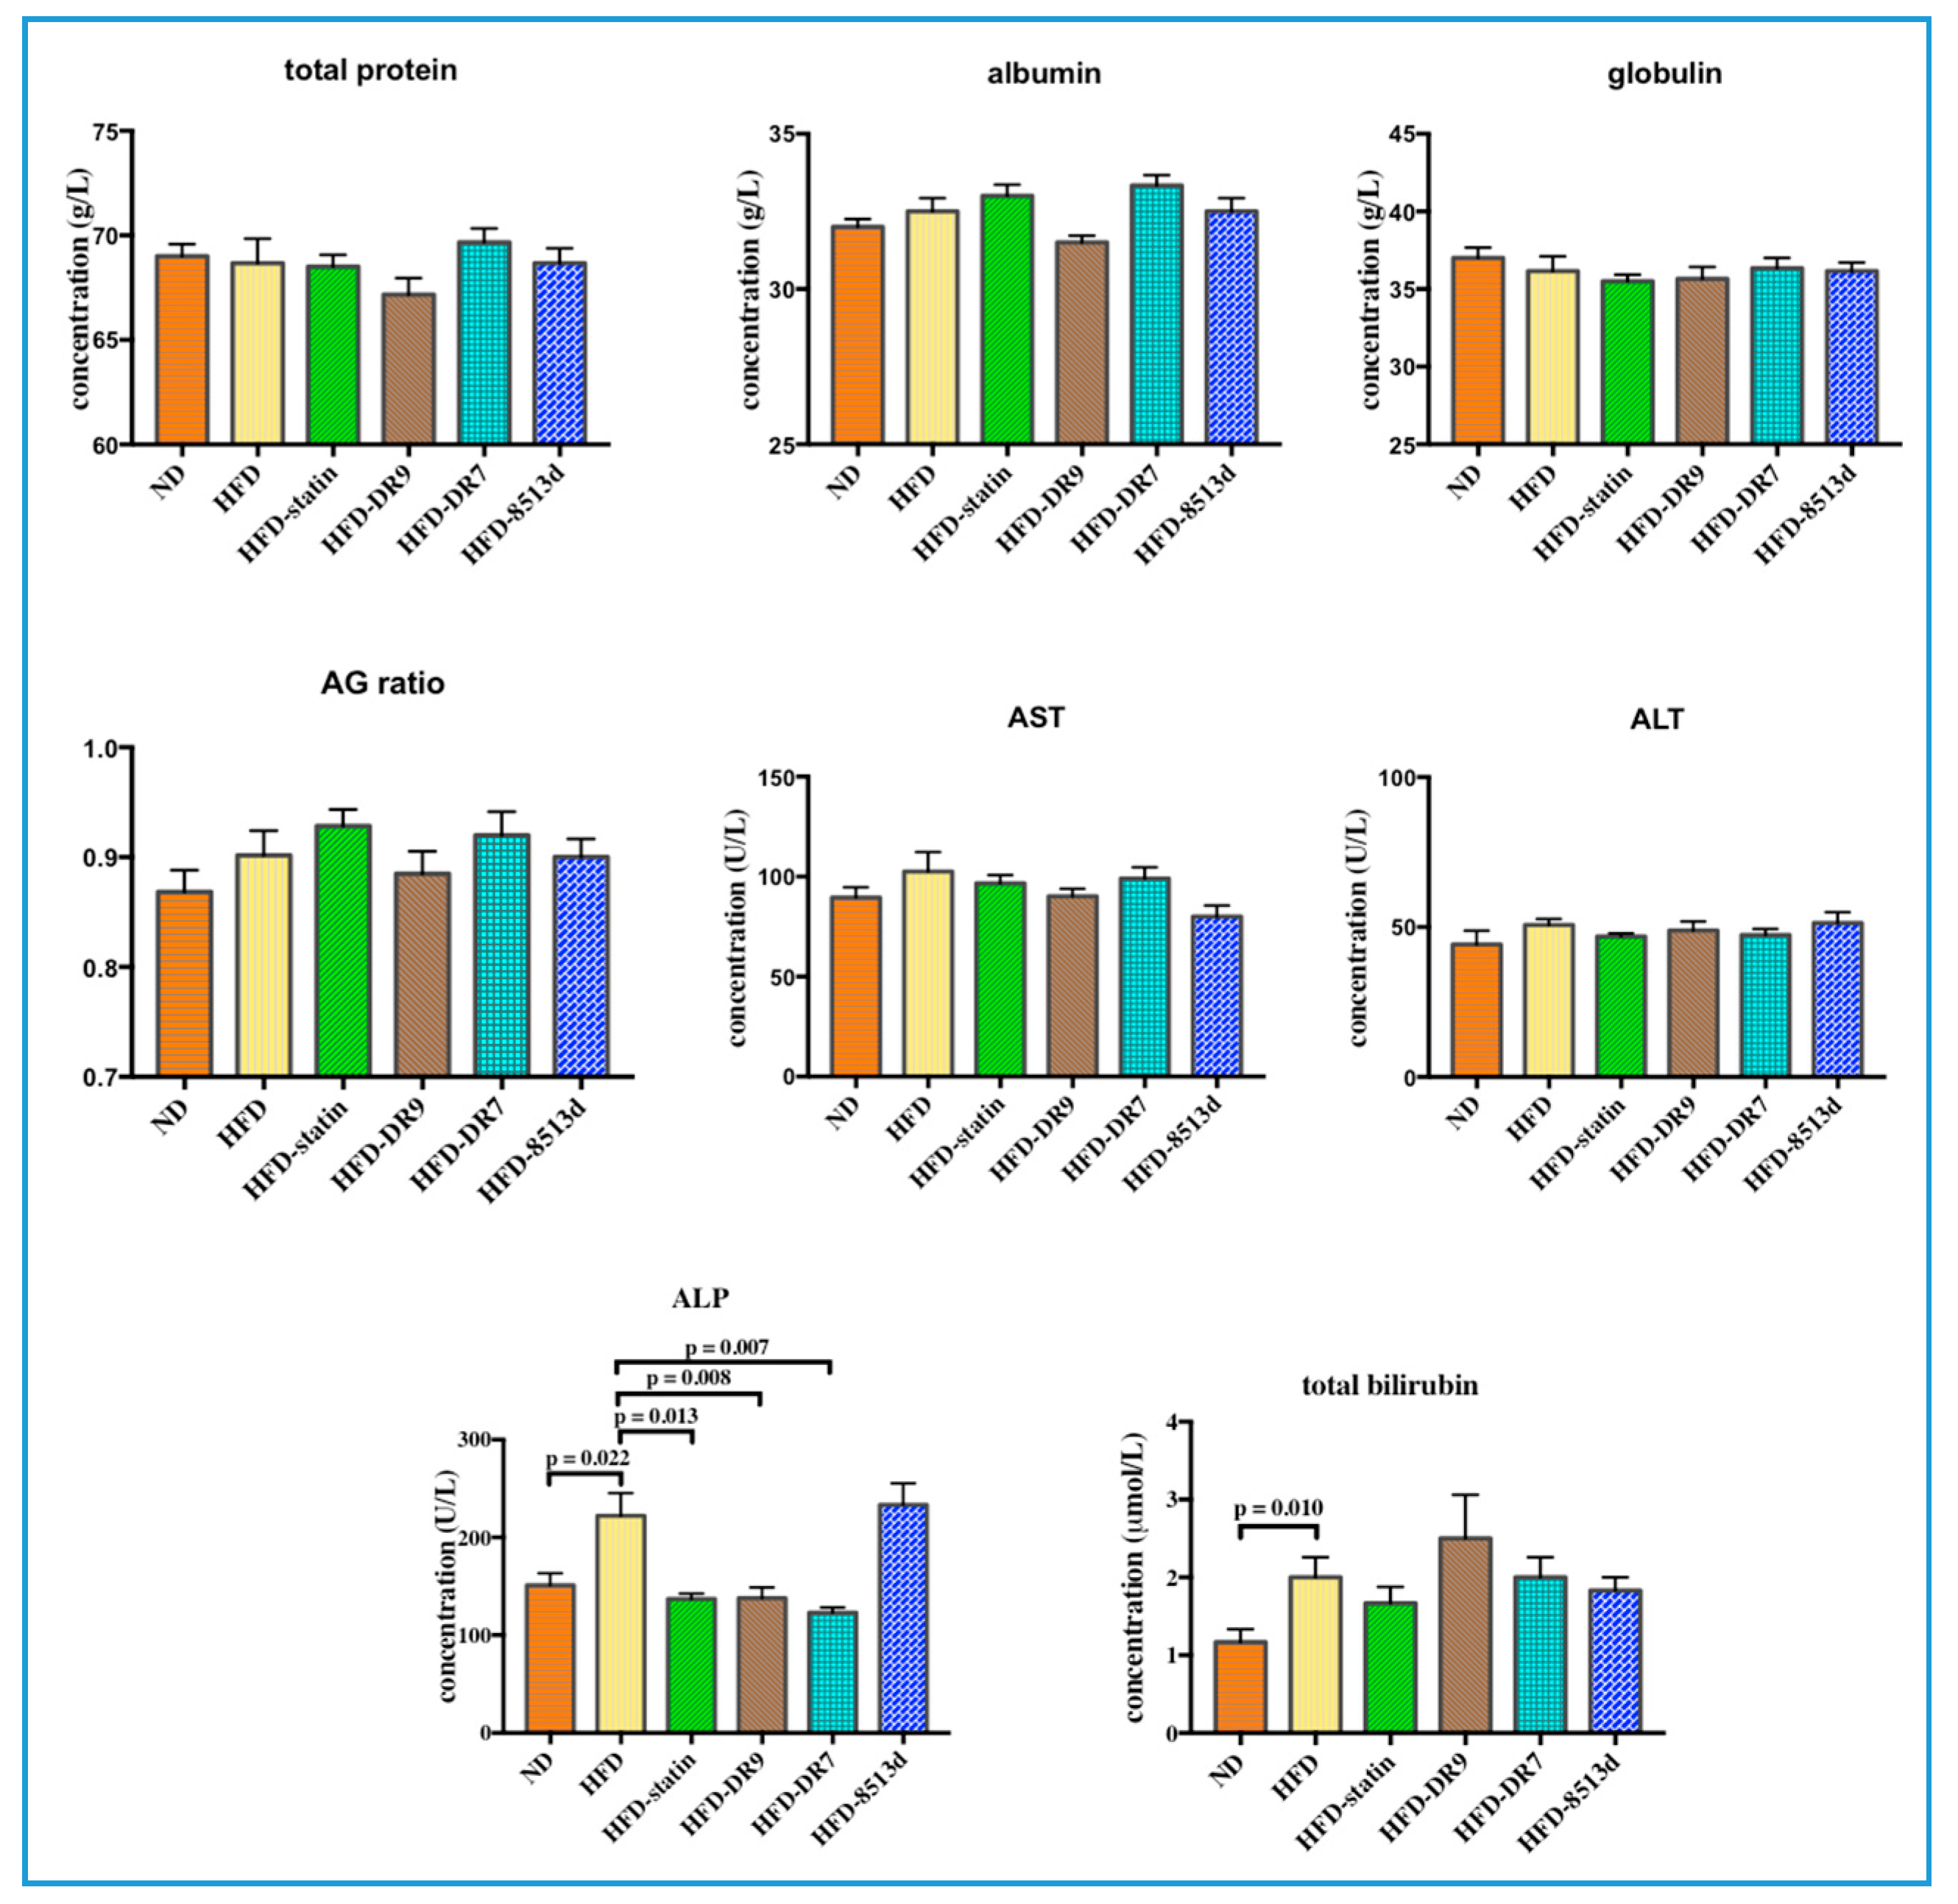
2.2.2. Liver Function Test

The liver function test results, which include total protein, albumin, globulin, AG ratio (Albumin/Globulin ratio), AST (aspartate aminotransferase), ALT (alanine aminotransferase), ALP (alkaline phosphatase), and total bilirubin, are shown in Figure 4. Total bilirubin and ALP were significantly increased (p < 0.05) in the HFD group compared to the ND group. Administration of statin, L. fermentum DR9, and L. plantarum DR7 to rats fed with HFD did not cause any significant changes in all the liver function parameters except for the ALP test, where the concentration was significantly reduced (p < 0.05) when compared to the HFD group. The HFD-8513d group did not show any significant difference on all the liver function parameters when compared to the HFD group.

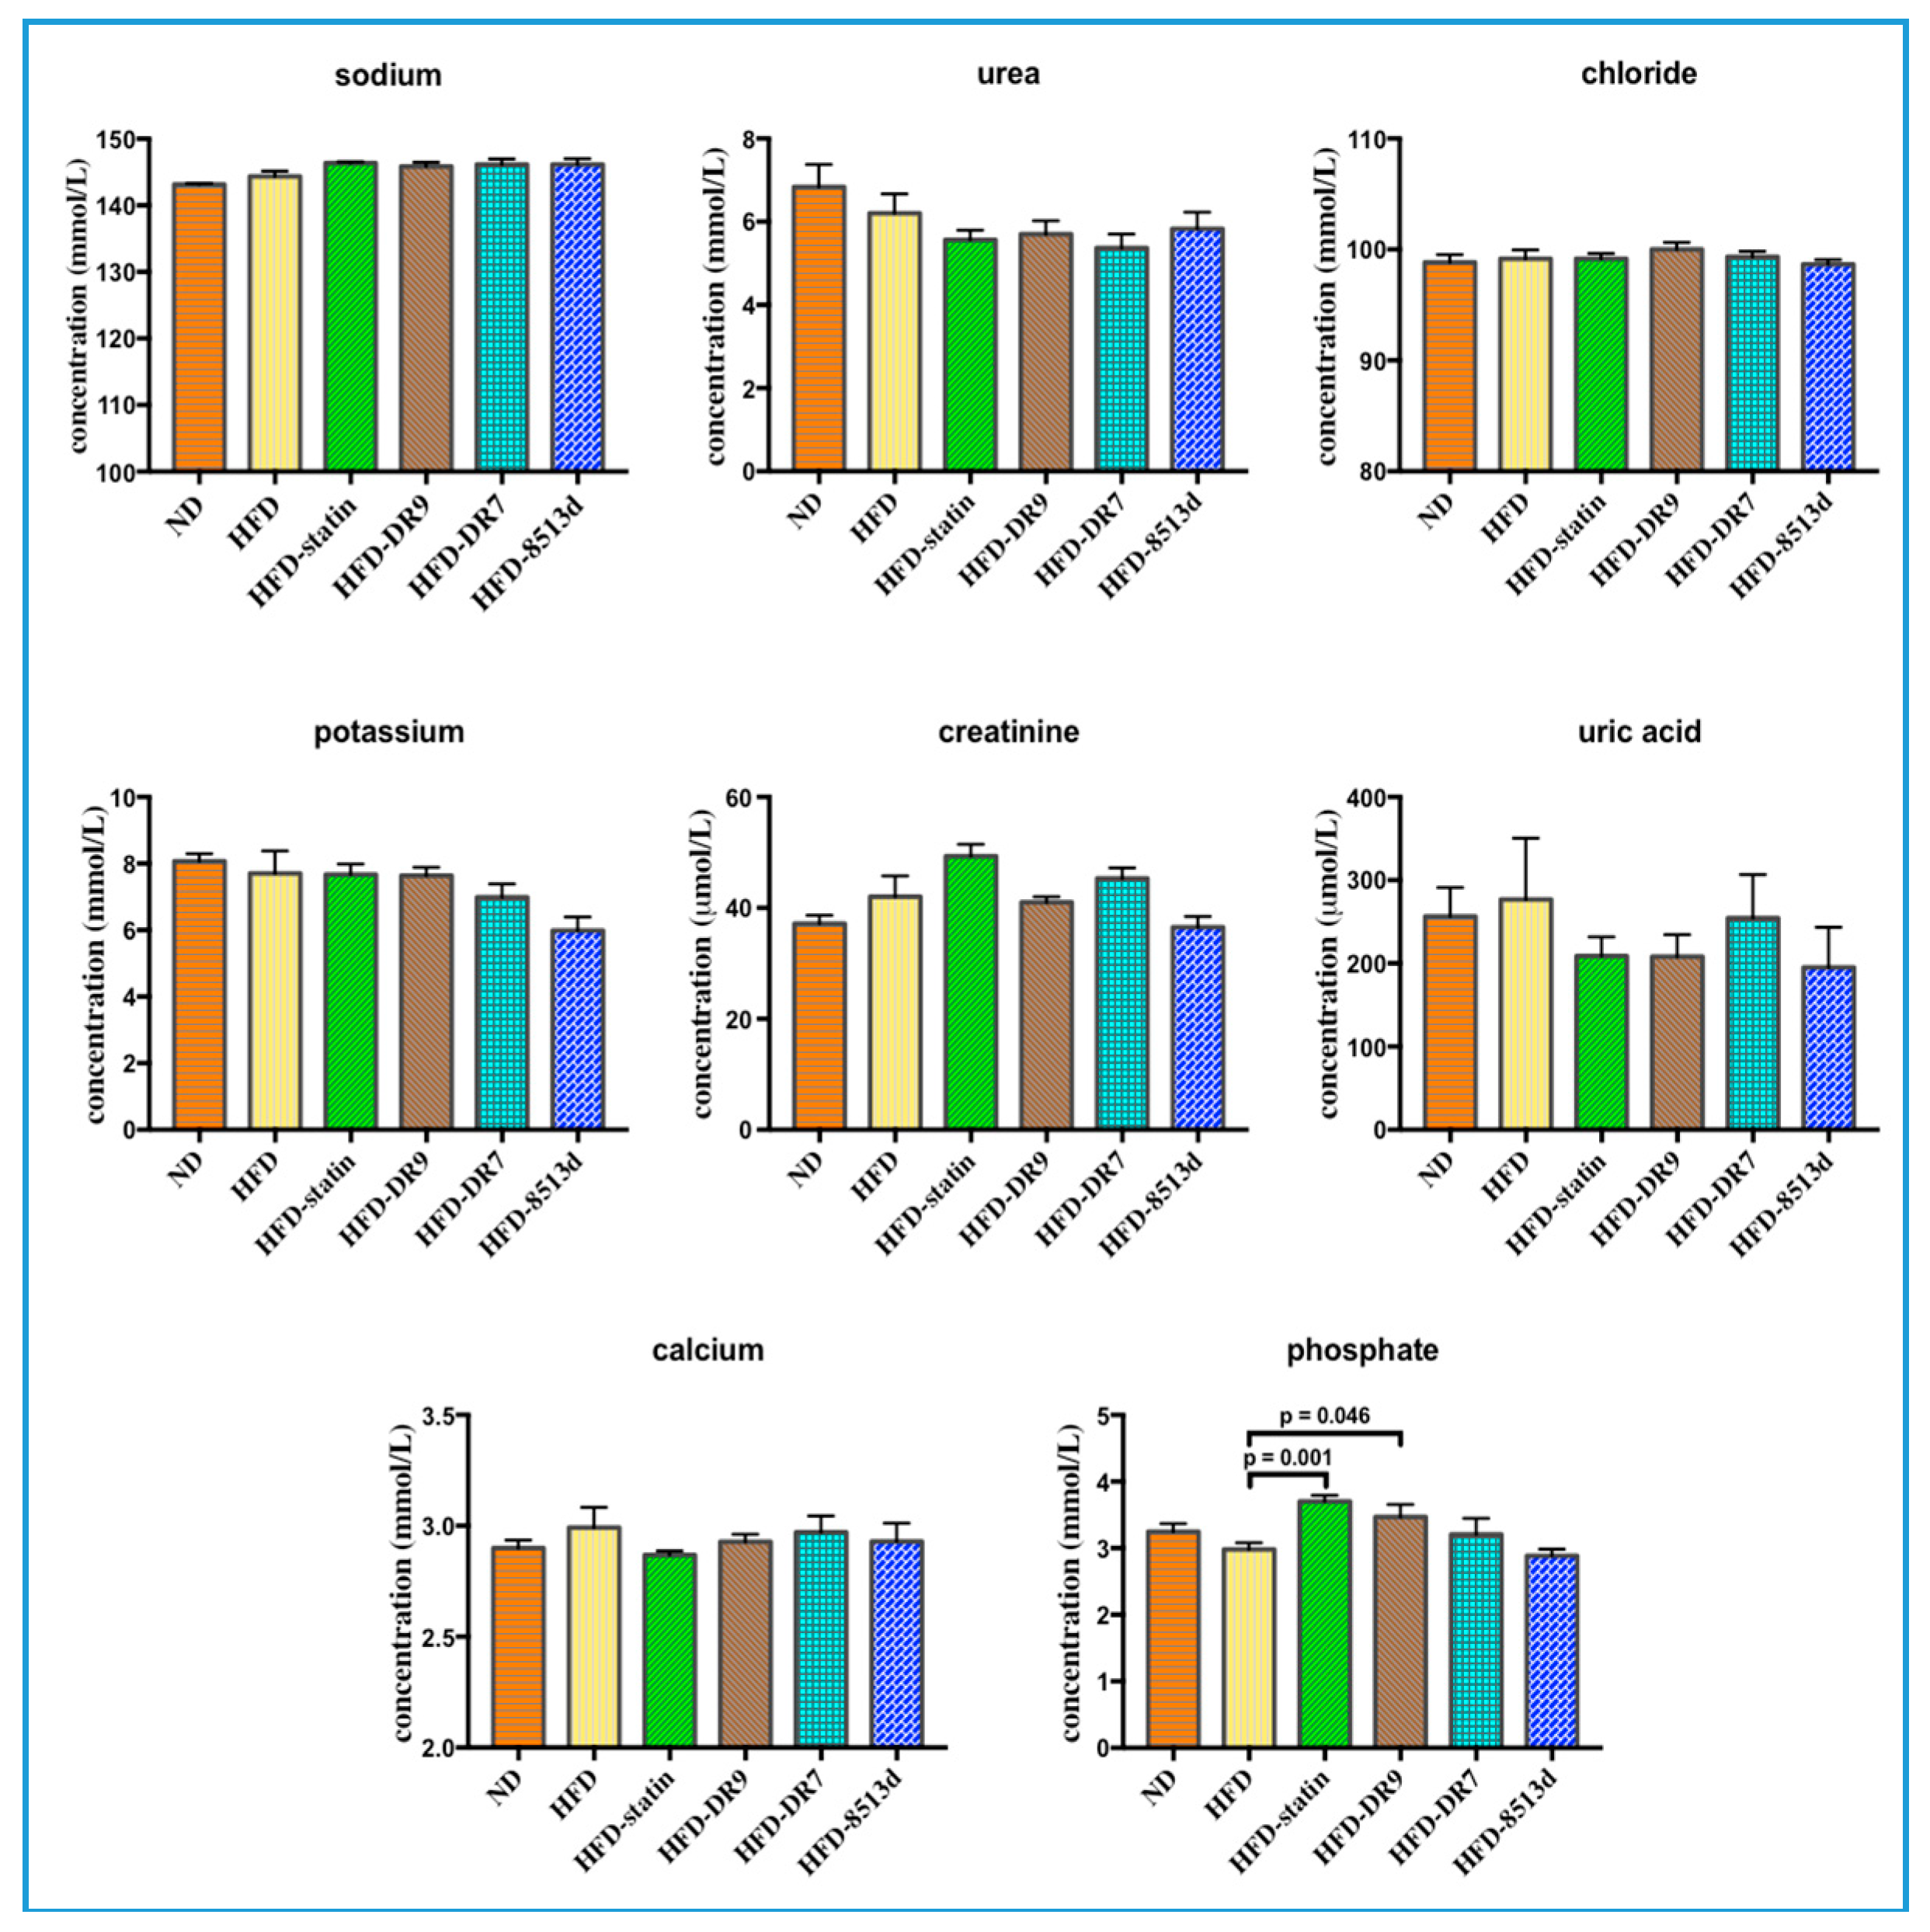
2.2.3. Renal Function Test

The renal function test results, which include sodium, urea, chloride, potassium, creatinine, uric acid, calcium, and phosphate, are shown in Figure 5. Results from this study showed that administration of L. fermentum DR9, L. plantarum DR7, and L. reuteri 8513d to rats fed with HFD did not cause any significant changes in levels of sodium, urea, chloride, potassium, creatinine, uric acid, and calcium. Serum phosphate was significantly higher (p < 0.05) in the HFD-statin and HFD-DR9 groups compared to the HFD group.

2.3. Gene Expression of Lipid Metabolism Pathway

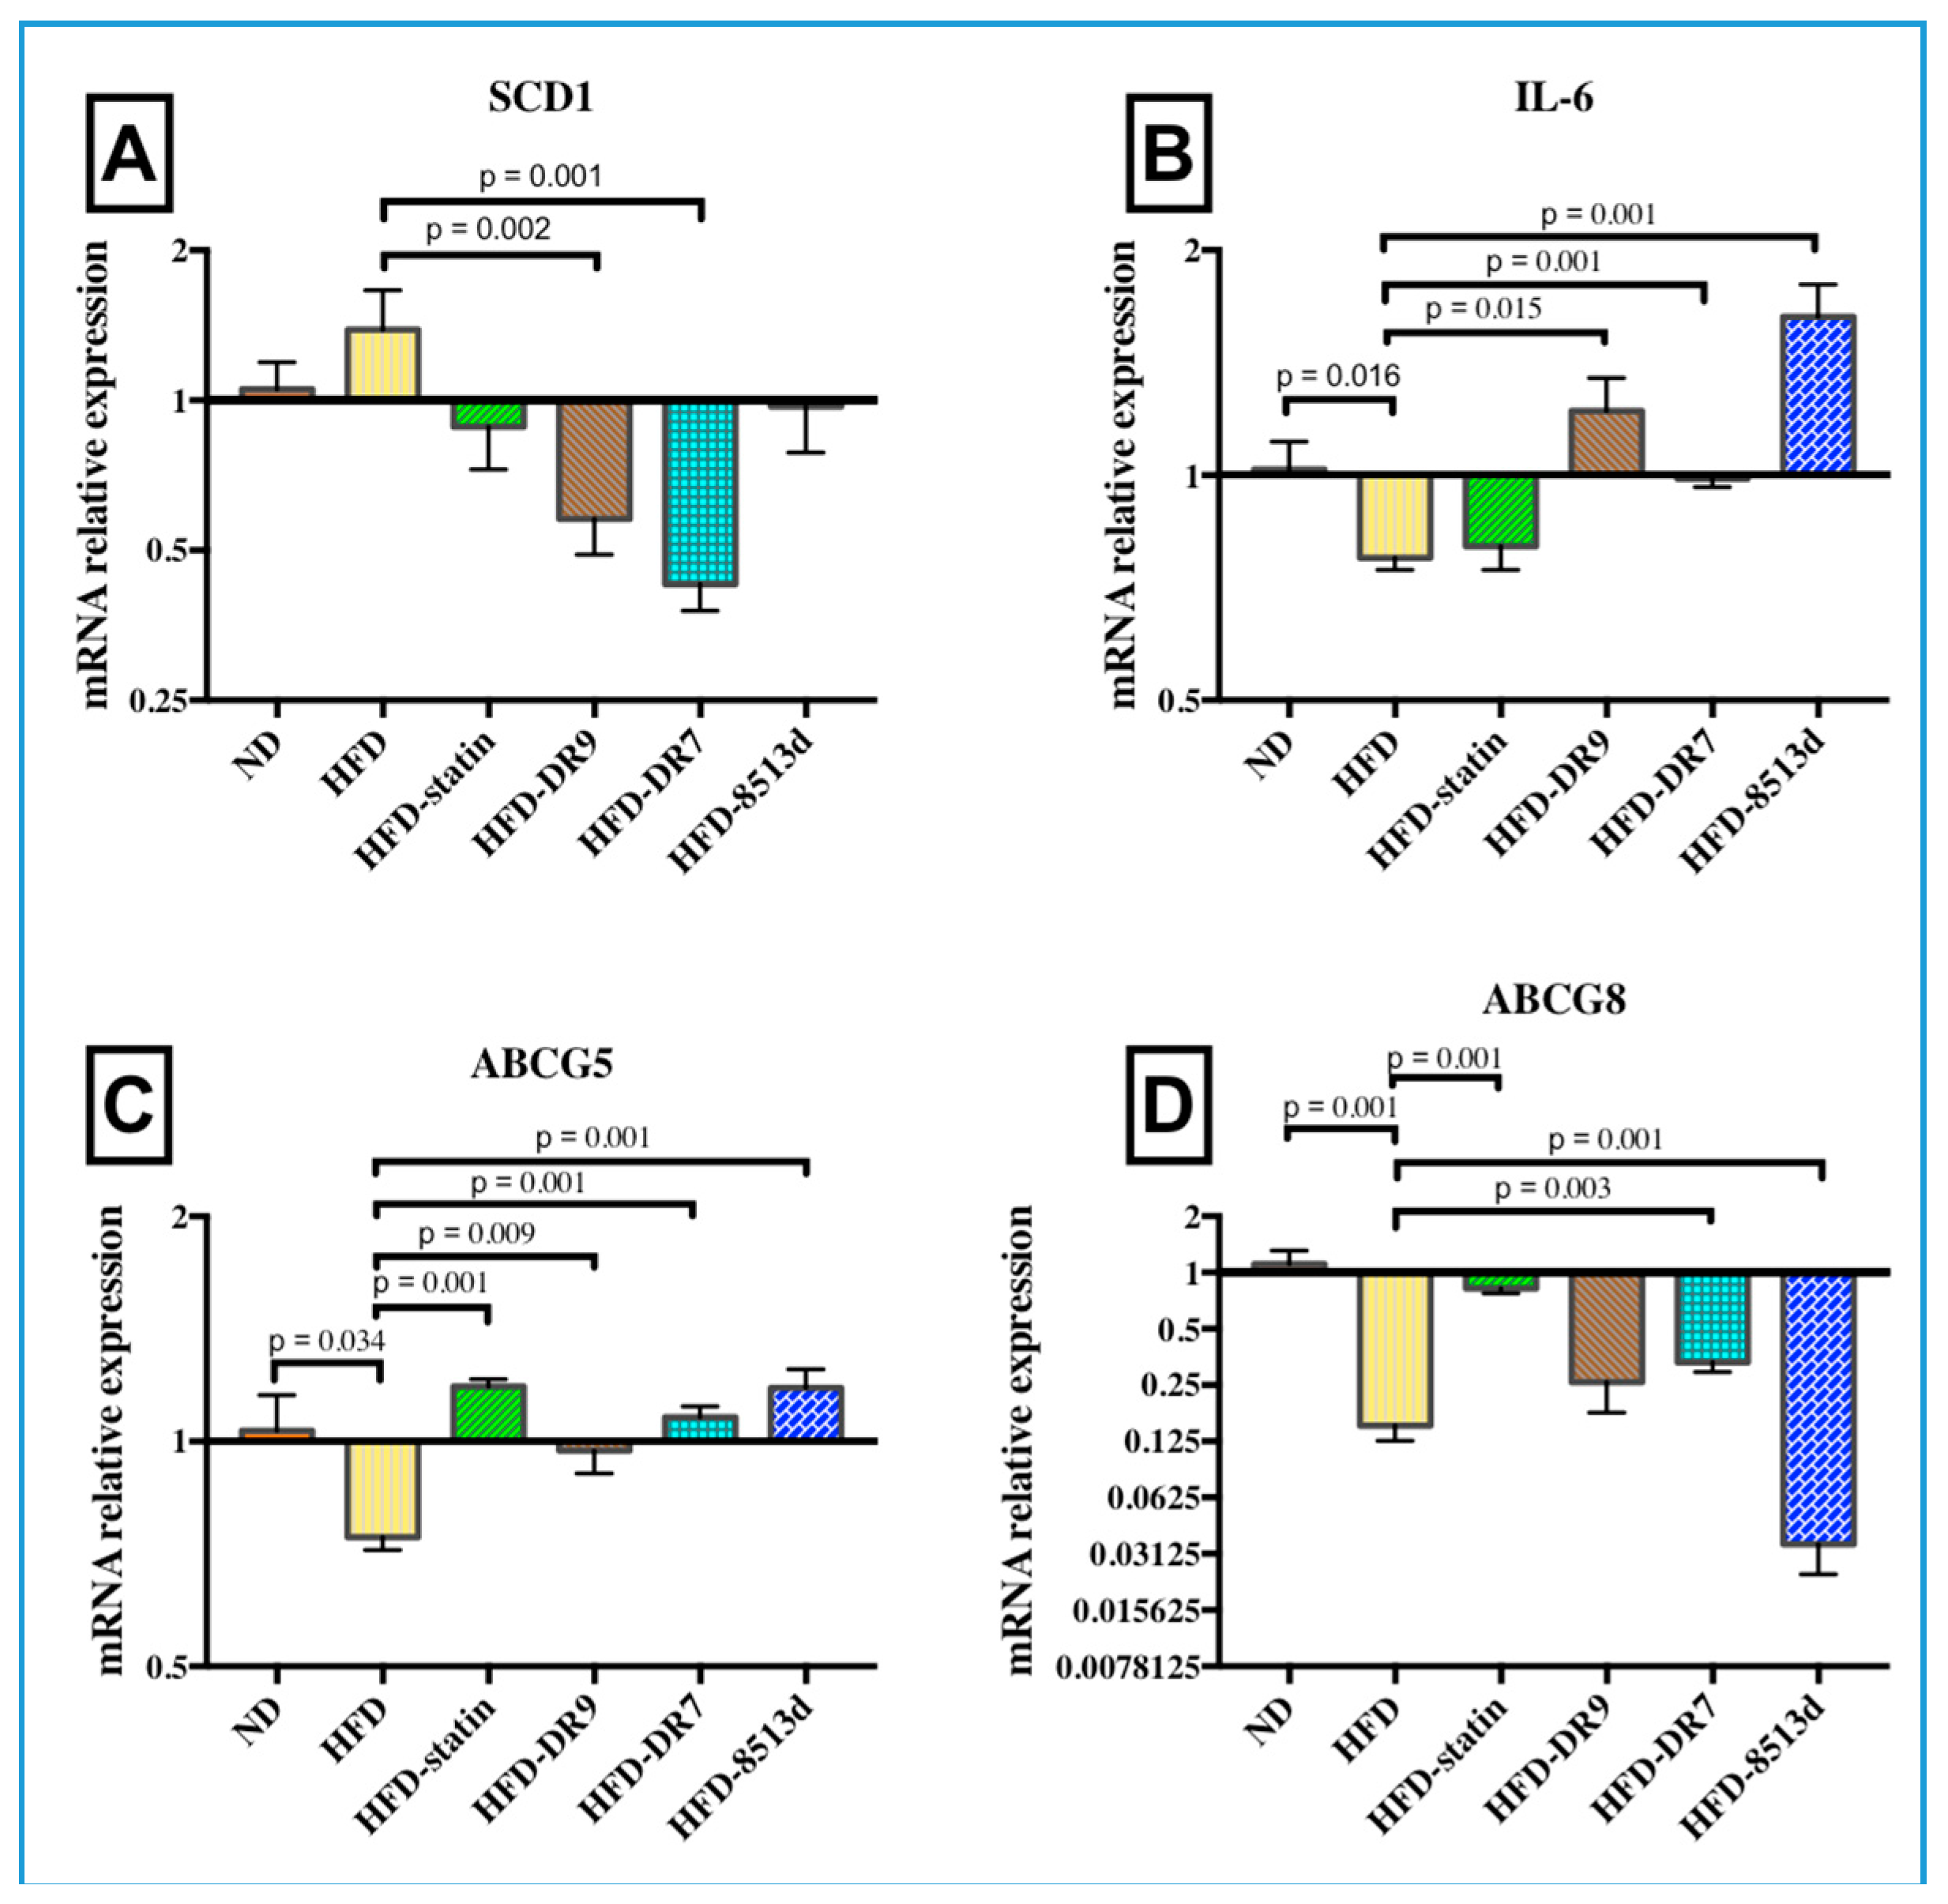
2.3.1. Stearoyl-CoA Desaturase 1 (SCD1)

SCD1 is a delta-9 fatty acid desaturase that catalyzes the synthesis of mono-unsaturated fatty acids (MUFA) and is a critical control point regulating hepatic lipid synthesis and β-oxidation. Results from quantitative real-time PCR analysis showed that mRNA expression levels of SCD1 in liver were significantly downregulated (p < 0.05) in the HFD-DR9 and HFD-DR7 groups (Figure 6A) when compared to the HFD group.

2.3.2. Interleukin-6 (IL-6)

The relative gene expression of IL-6 in liver after 12 weeks of treatment is shown in Figure 6B. Gene expression of IL-6 was significantly lower (p < 0.05) in the HFD group compared to the ND group. It was also observed that administration of L. fermentum DR9, L. plantarum DR7, and L. reuteri 8513d significantly upregulated the expression of IL-6 (p < 0.05).

2.3.3. ATP-Binding Cassette Subfamily G Member 5 and 8 (ABCG5 and ABCG8)

ABCG5 and ABCG8 are half-size ABC transporters that function as heterodimers (ABCG5/G8) to increase sterol excretion from the liver. The relative gene expression of ABCG5 and ABCG8 in liver after 12 weeks of treatment is shown in Figure 6C,D. Results from this study showed that high-fat diet significantly reduced the mRNA expression of ABCG5 and G8 (p < 0.05). The HFD-statin, HFD-DR9, HFD-DR7, and HFD-8513d groups had significantly higher mRNA expression of ABCG5 (p < 0.05). Expression of ABCG8 was also significantly upregulated upon administration of statin and L. plantarum DR7 (p < 0.05).

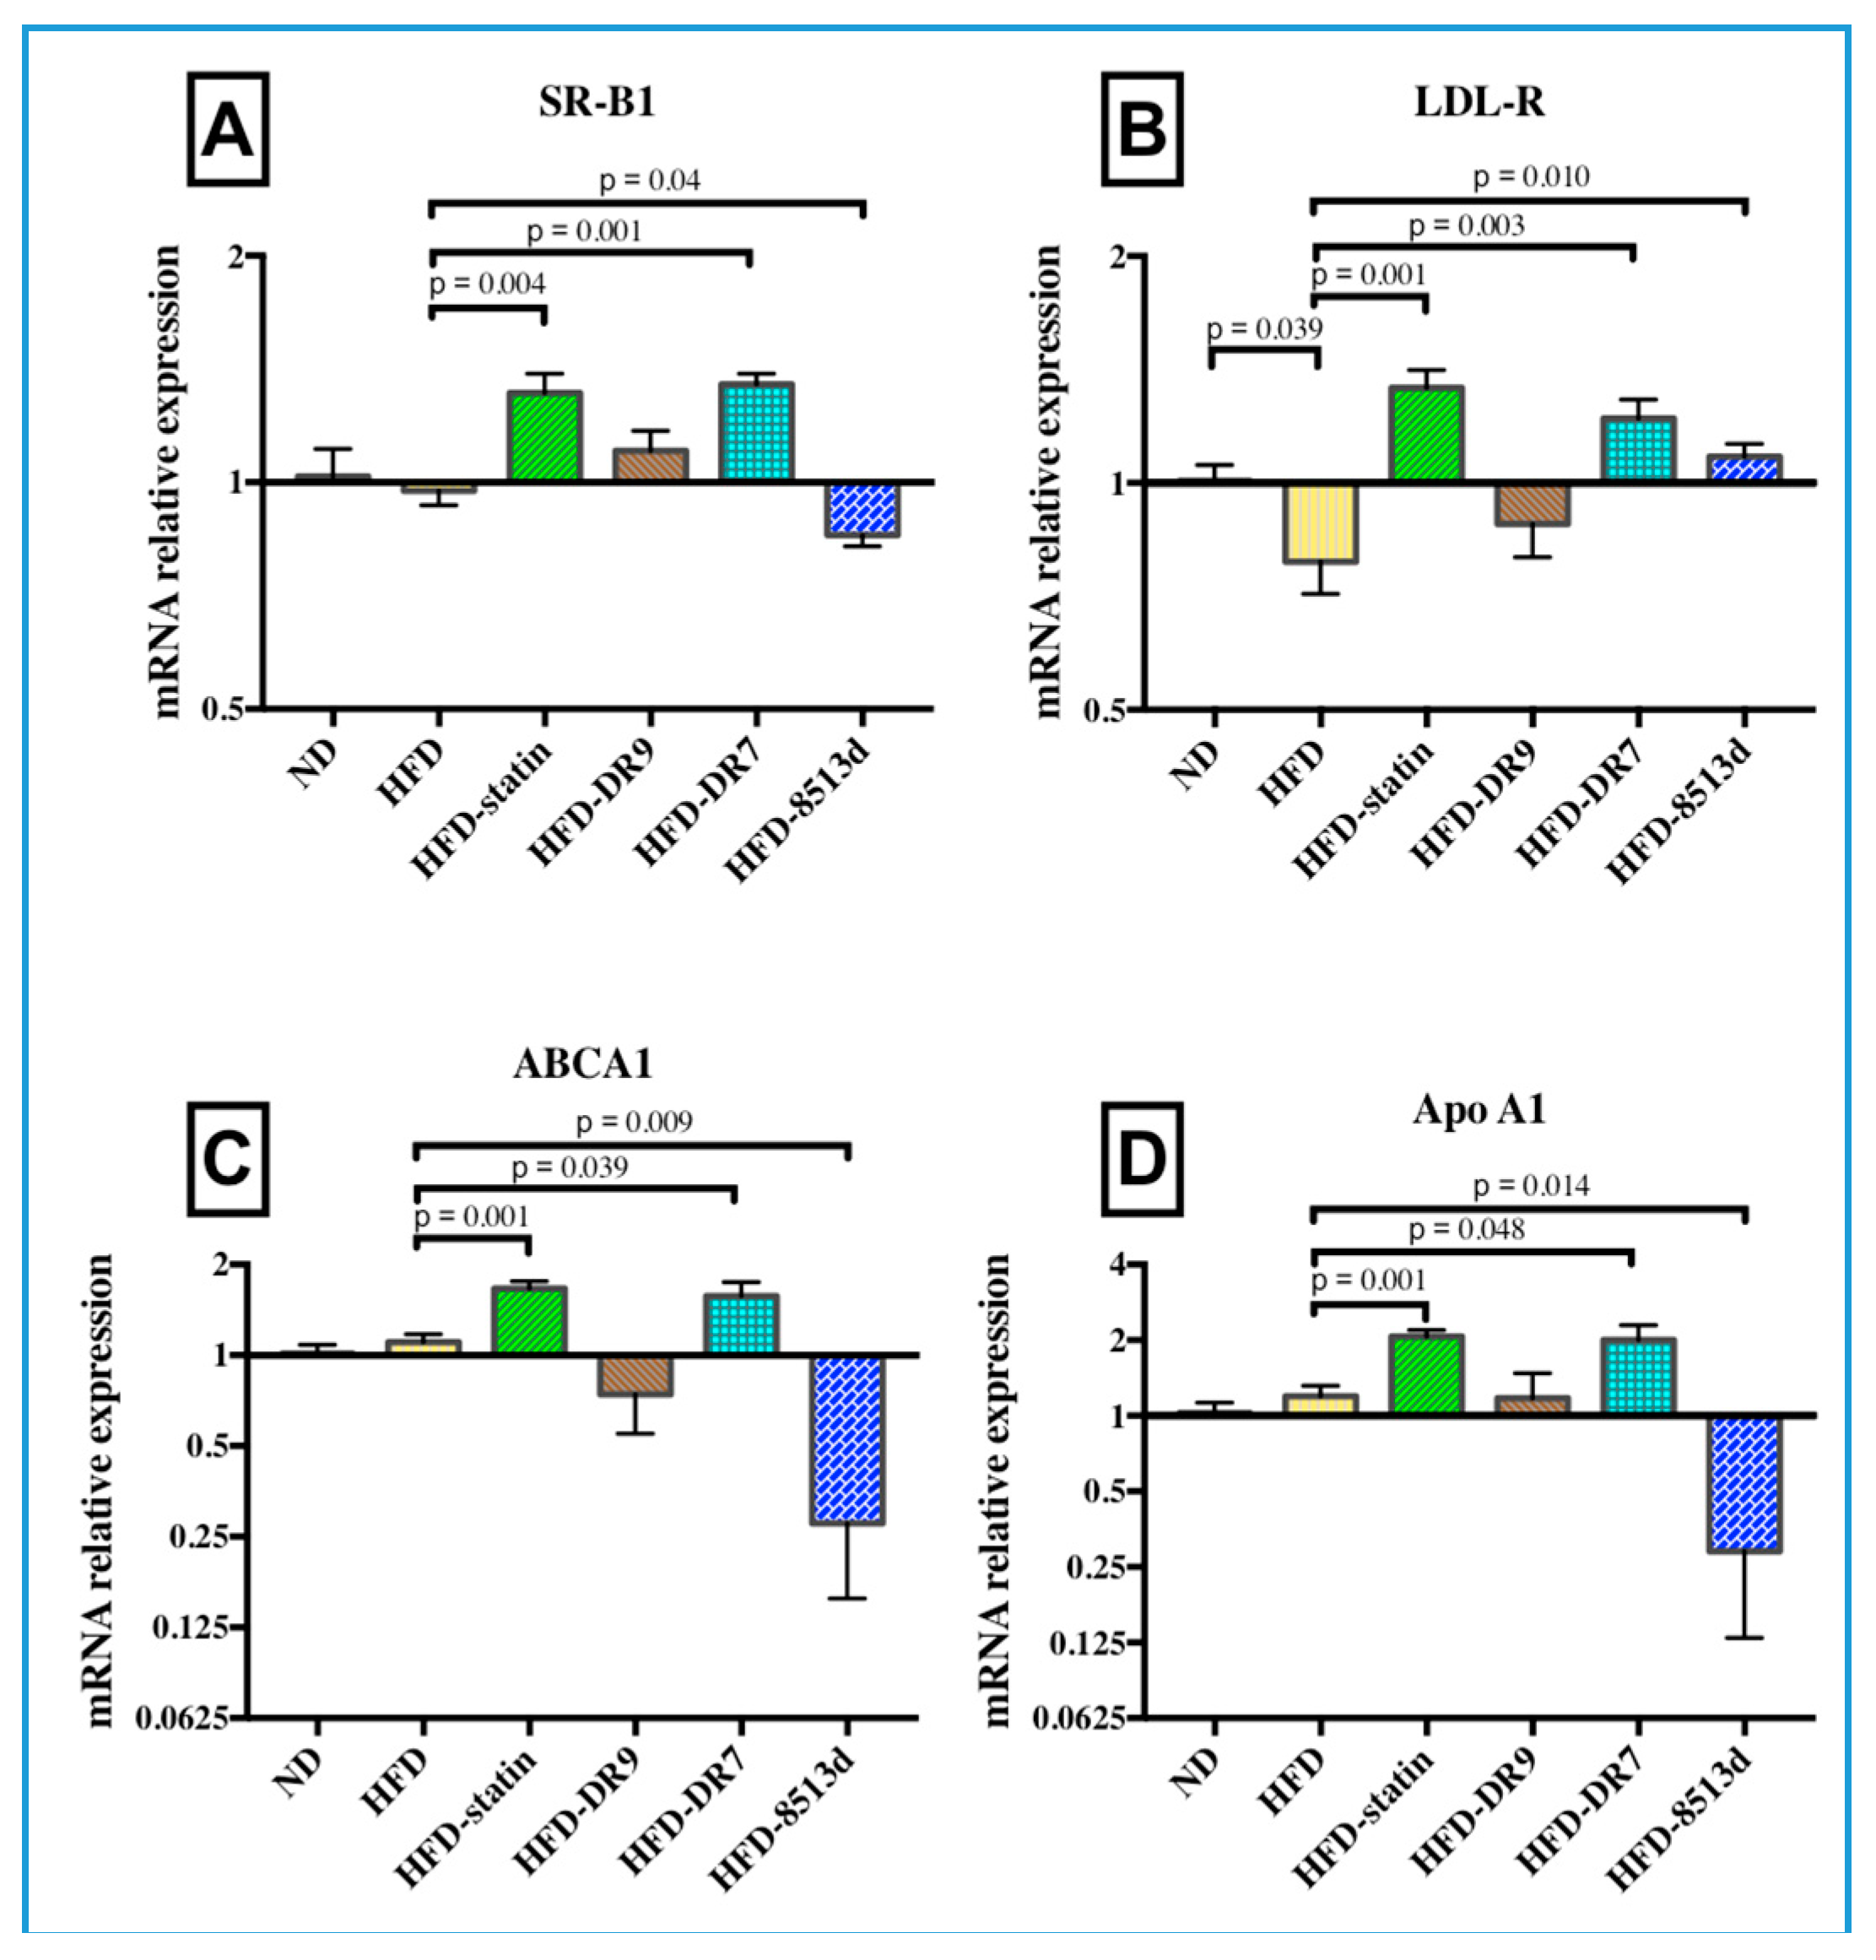
2.3.4. Scavenger Receptor B1 (SR-B1)

The relative gene expression of SR-B1 in liver after 12 weeks of treatment is shown in Figure 7A. It was observed from this study that SR-B1 expression was significantly lower in the HFD group compared to the ND group (p < 0.05). The results also showed that the HFD-statin and HFD-DR7 groups exhibited a significantly higher expression of SR-B1 (p < 0.05) compared to the HFD group. Meanwhile, the HFD-8513d group showed significantly lower SR-B1 expression (p < 0.05) when compared to the HFD group.

2.3.5. Low Density Lipoprotein Receptor (LDL-R)

The relative gene expression of LDL-R in liver after 12 weeks of treatment is shown in Figure 7B. It was observed that the expression of LDL-R was significantly downregulated upon administration of high-fat diet (p < 0.05). Results also showed that LDL-R mRNA expression was significantly higher in the HFD-statin, HFD-DR7, and HFD-8513d groups when compared to the HFD group (p < 0.05).

2.3.6. ATP-Binding Cassette Subfamily A Member 1 (ABCA1)

The relative gene expression of ABCA1 in liver after 12 weeks of treatment is shown in Figure 7C. No significant changes in ABCA1 mRNA expression were observed when comparing between the ND and HFD groups. However, it was observed that the HFD-statin and HFD-DR7 group had significantly higher (p < 0.05) expression of ABCA1 compared to the HFD group. On the other hand, results showed that the HFD-8513d group had a significantly lower (p < 0.05) expression of ABCA1 when compared to the HFD group.

2.3.7. Apolipoprotein A1 (Apo A1)

The relative gene expression of ApoA1 in liver after 12 weeks of treatment is shown in Figure 7D. Similar trends were observed when comparing between ApoA1 and ABCA1 gene expression; the HFD-statin and HFD-DR7 groups had significantly higher (p < 0.05) expression of Apo A1 compared to the HFD group. The HFD-8513d group had a significantly lower (p < 0.05) expression of Apo A1 when compared to the HFD group. In addition, there were no significant changes in Apo A1 mRNA expression when comparing between the ND and HFD groups.

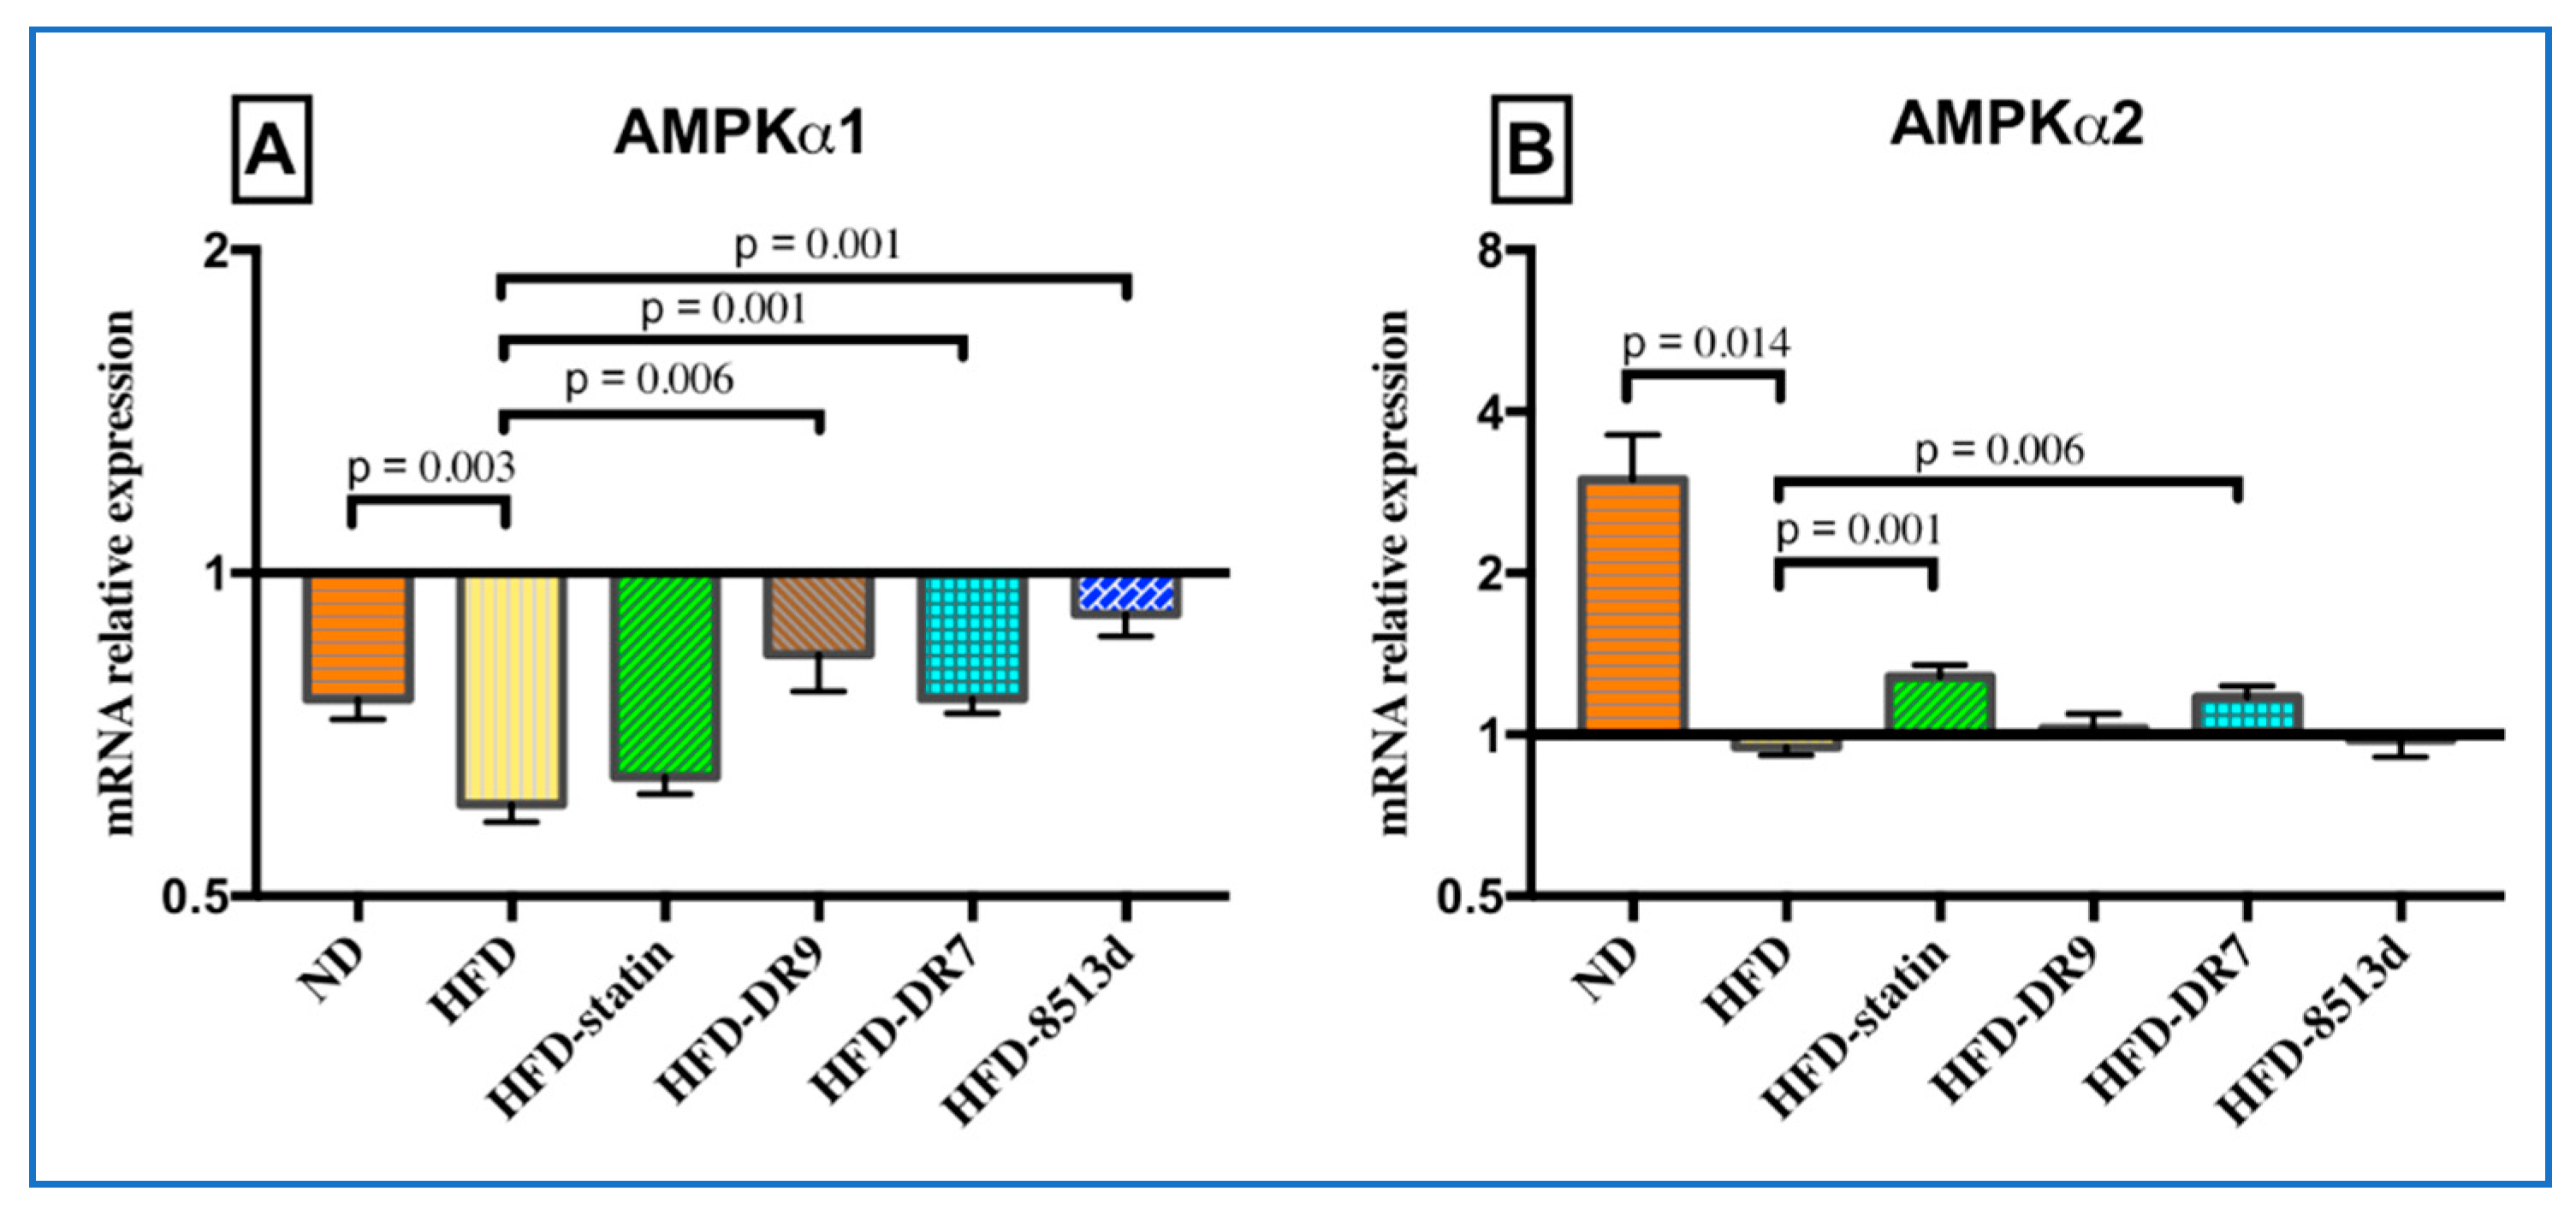
2.3.8. 5′ Adenosine Monophosphate-Activated Protein Kinase (AMPK)

The relative gene expression of AMPKα1 and AMPKα2 in liver after 12 weeks of treatment is shown in Figure 8A,B, respectively. Results showed that both the mRNA expression of AMPKα1 and AMPKα2 were significantly lower in the HFD group as compared to the ND group. The HFD-DR9, HFD-DR7, and HFD-8513d groups showed significantly higher expression of AMPKα1 compared to the HFD group. Meanwhile, only the HFD-statin and HFD-DR7 groups had significantly higher mRNA expression of AMPKα2 when compared to the HFD group.

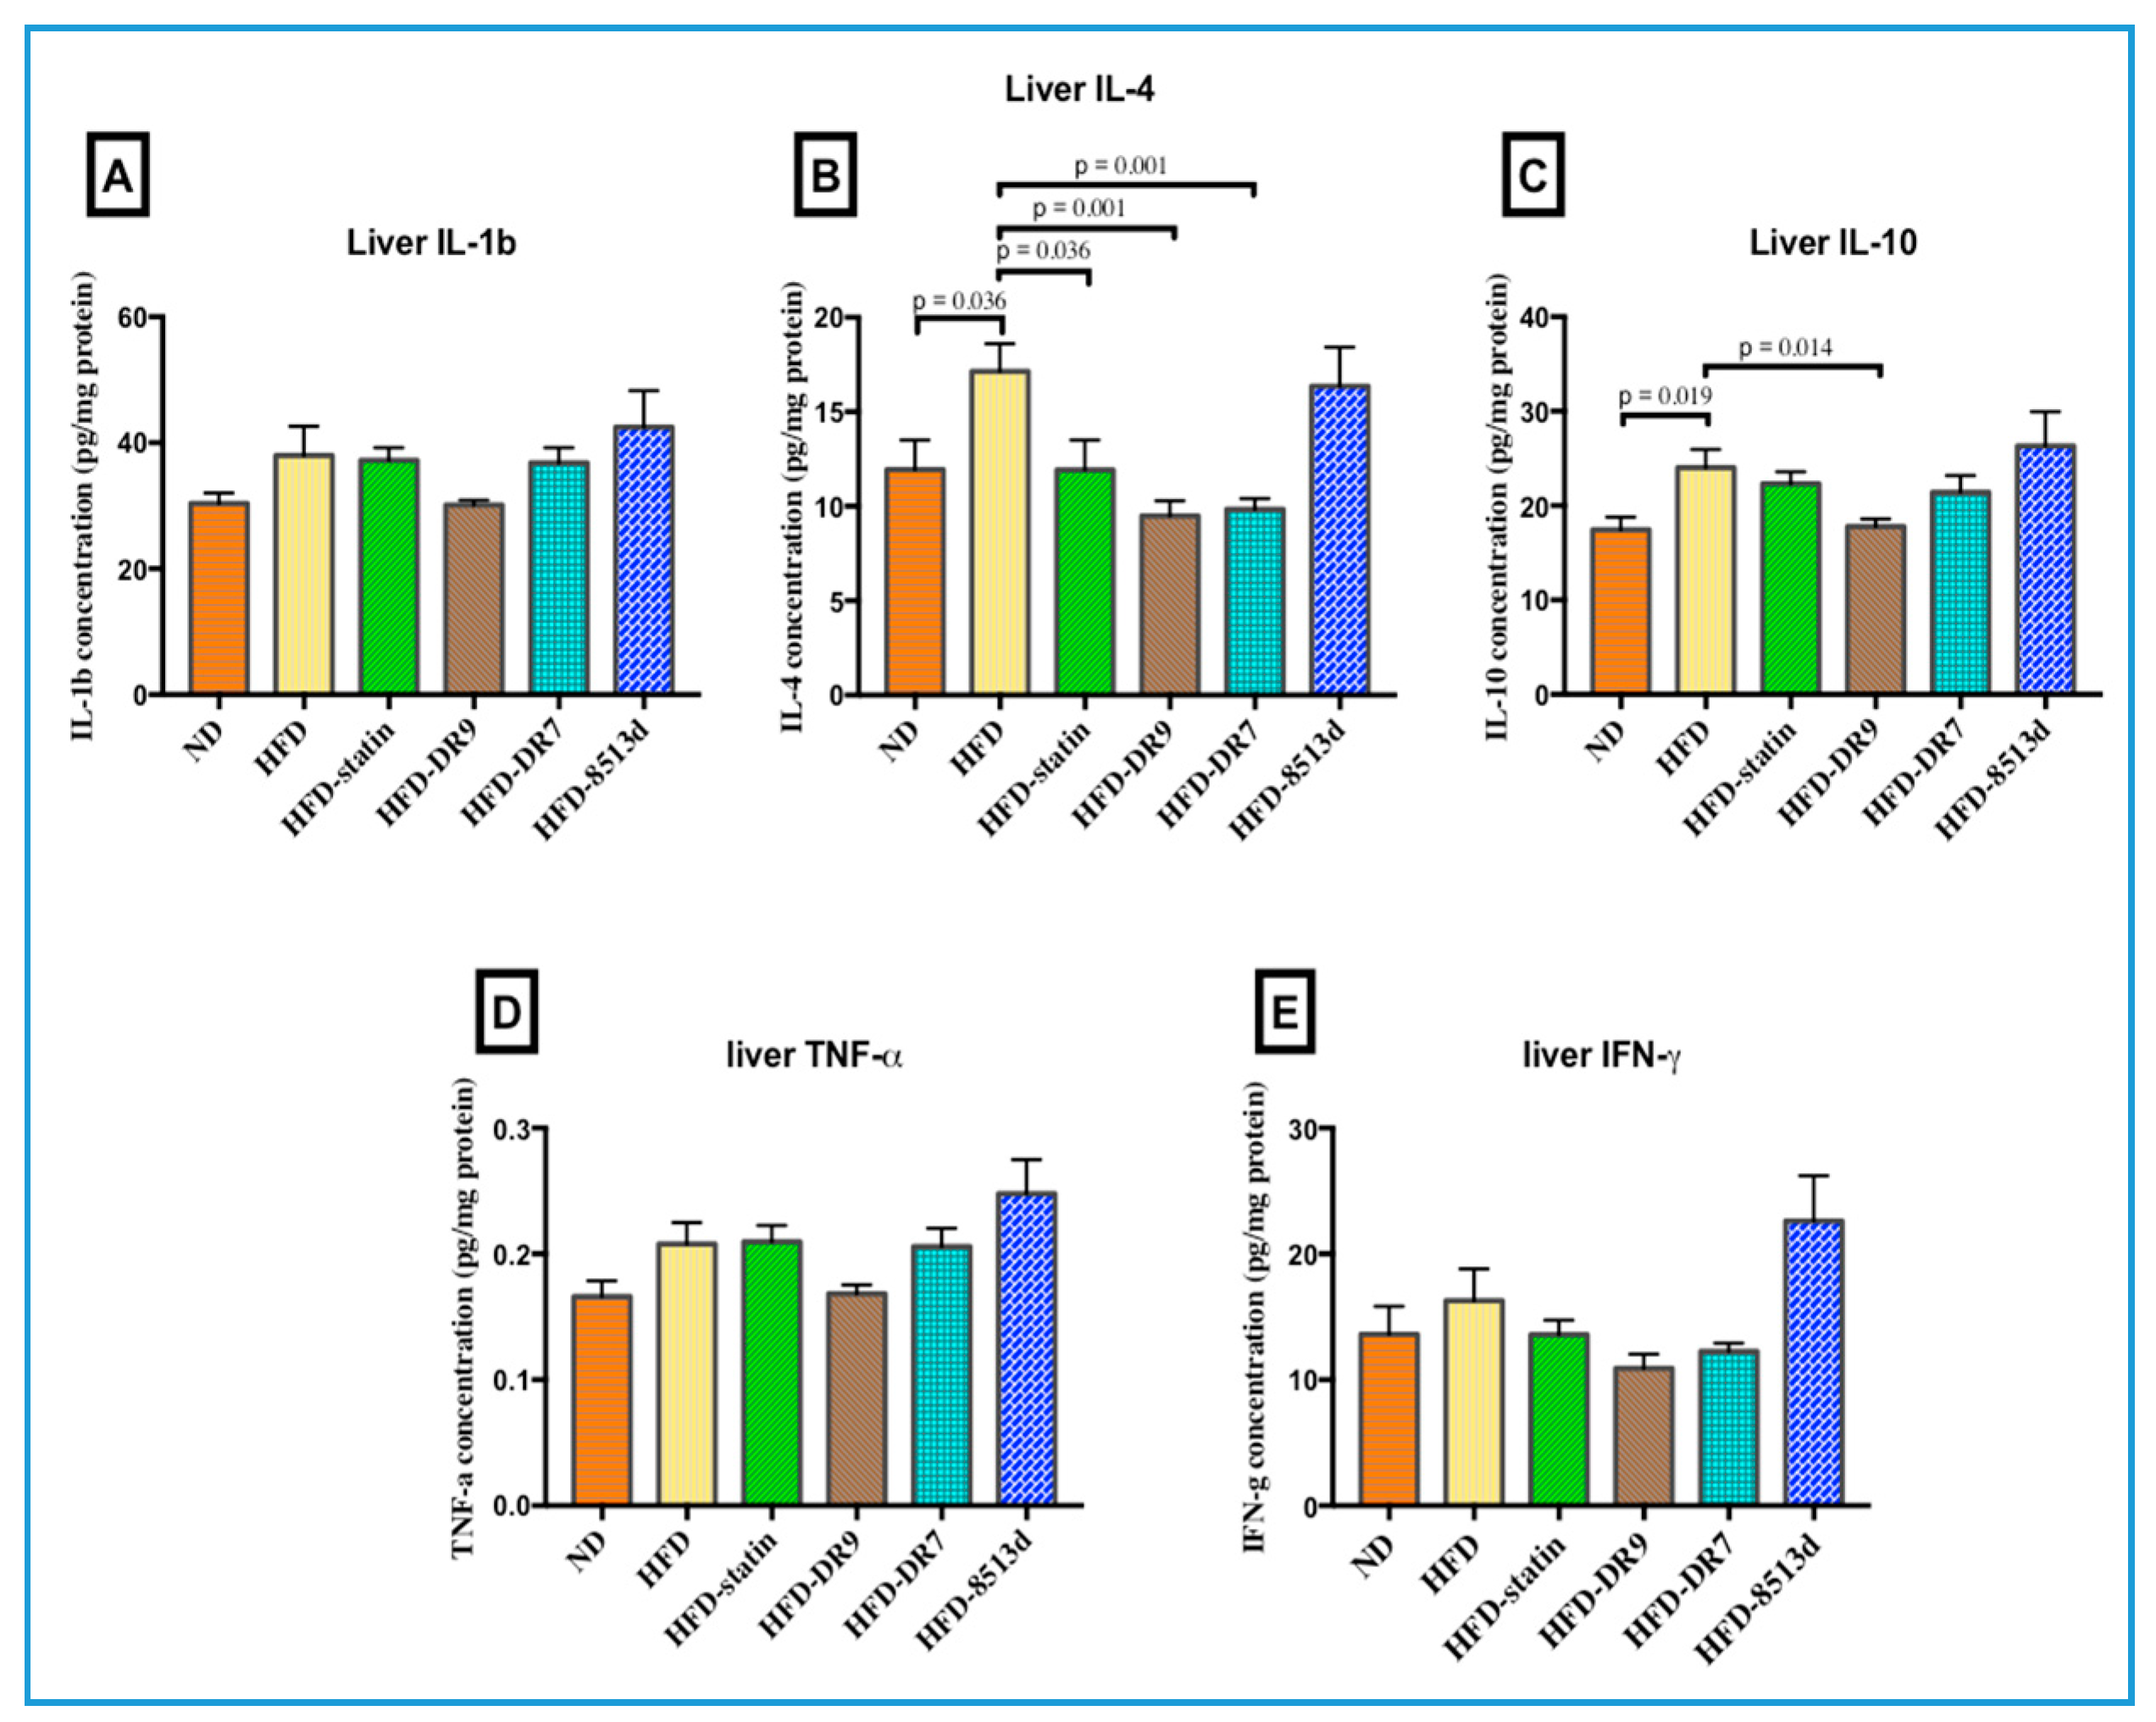
2.4. Liver Immune Response: IL-1β, IL-4, IL-10, TNF-α, and IFN-γ

Protein expression (Interleukin-1beta (IL-1β), Interleukin-4 (IL-4), Interleukin-10 (IL-10), Tumor necrosis factor alpha (TNF-α), Interferon gamma (IFN-γ)) in liver tissue after 12 weeks of treatment was measured using Multiplex ELISA and is shown in Figure 9. There was no significant difference in liver IL-1b, TNF-α, and IFN-γ when comparing between the groups. Results showed that IL-4 was significantly increased in the HFD group compared to the ND group. Compared to the HFD group, the HFD-statin, HFD-DR9, and HFD-DR7 groups had lower (p < 0.05) IL-4 levels. The liver IL-10 level was significantly higher (p < 0.05) in the HFD group as compared to the ND group. The HFD-DR9 group had a lower (p < 0.05) level of IL-10 than the HFD group.

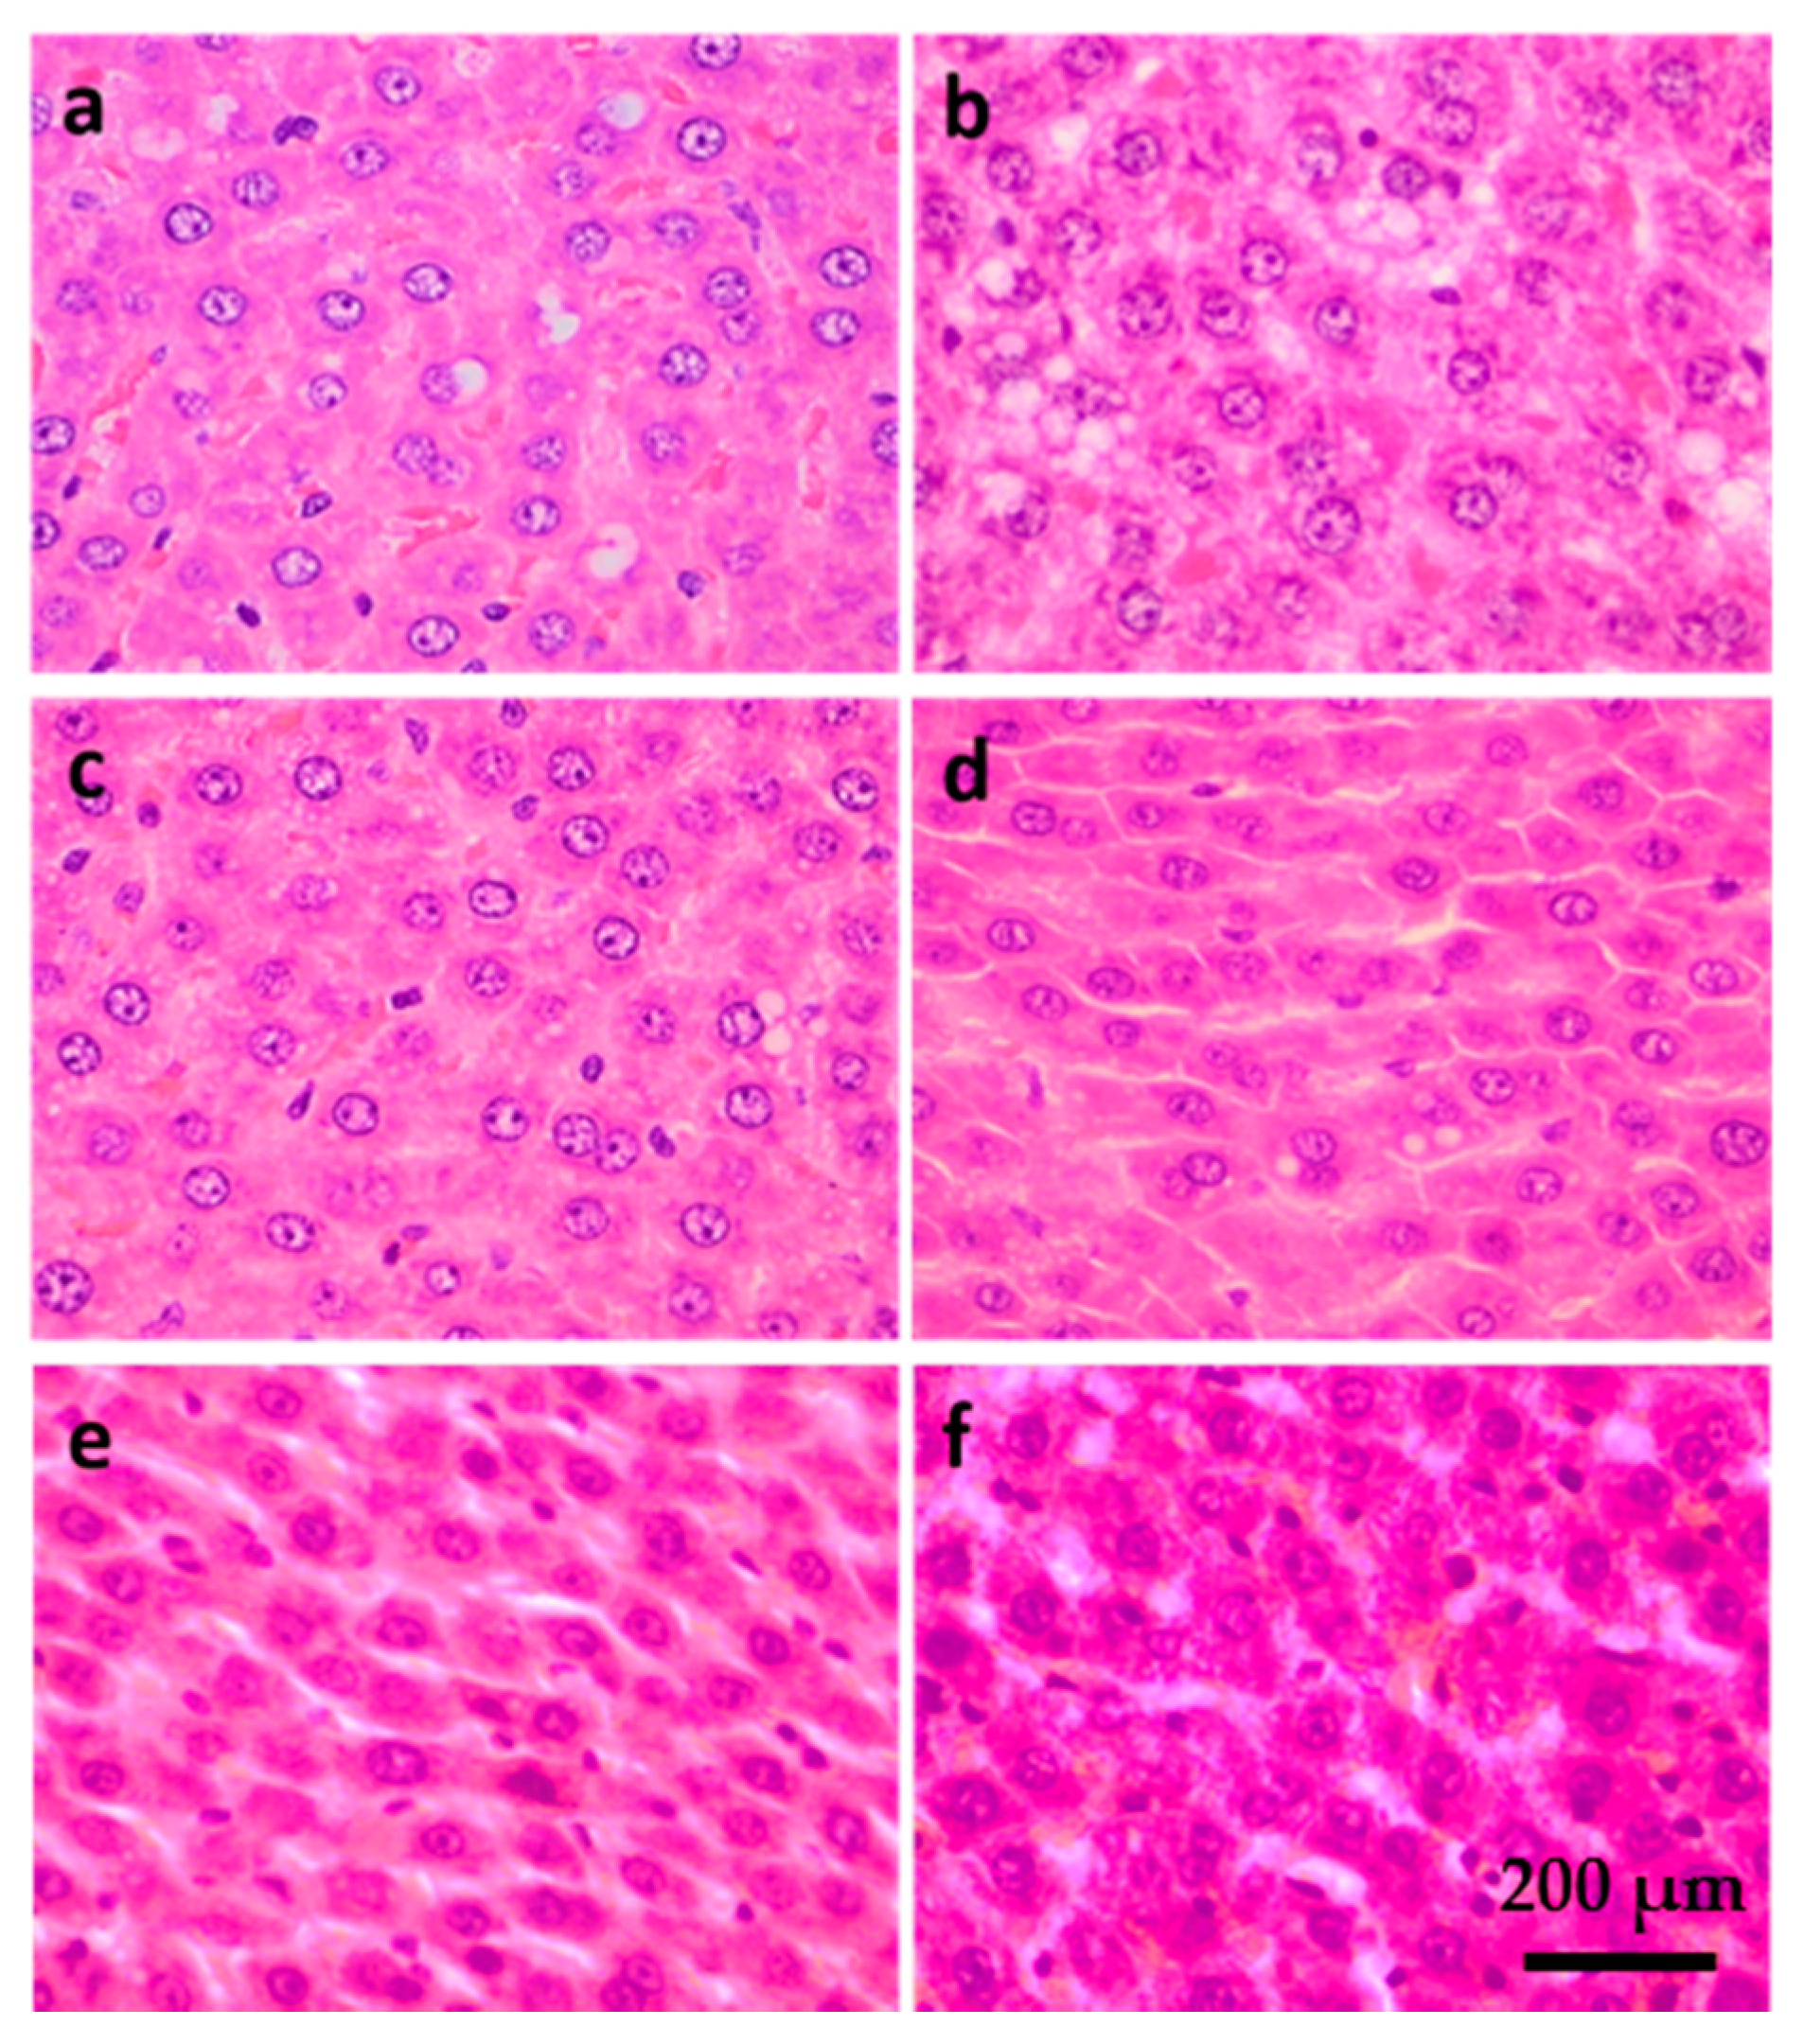
2.5. Liver Histology

Samples stained with hematoxylin and eosin (H&E) are shown in Figure 10. A higher degree of lipid accumulation and less organized structure were observed in the HFD group when compared to the ND group. The HFD-statin, HFD-DR7, HFD-DR9, and HFD-8513d groups showed less lipid accumulation compared to the HFD group. Interestingly, a more well-organized structure was observed for the HFD-DR7 and HFD-DR9 groups compared to the other treatment groups.

3. Discussion

Hyperlipidemia, which refers to increased levels of cholesterol and triglycerides in the blood, is among the known risk factors for the development of cardiovascular diseases. The term hyperlipidemia also includes disorders of lipoprotein metabolism that lead to atherosclerosis. Probiotics have been shown to improve the blood lipid profile both in animal and human clinical studies. Increasing studies have shown the ability of lactobacilli in reducing TC and TG concentrations [13,19,20,21]. Several mechanisms have been proposed; however, it must be noted that the proposed mechanism for one strain should not be extrapolated to another strain. In this study, we evaluated the effect of three probiotic strains on D-galactose-induced aging model rats fed with a high-fat diet. The current study showed that probiotic strains L. fermentum DR9 and L. reuteri 8513d have a positive effect on serum TC after eight weeks of treatment. However, there was no significant difference between the groups upon continuous feeding of HFD to week 12. This result suggested that probiotics may be useful in delaying the increase of TC, but continuously consuming HFD may mask the cholesterol-lowering effect. Several cholesterol-lowering mechanisms that lead to improvement of the serum lipid profile have been reported. Probiotics have been reported to assimilate cholesterol, thereby lowering luminal cholesterol levels available for absorption [22], as well as via bile salt hydrolase activity [10]. Probiotics have also been reported to combat hypercholesterolemia via alteration of the gut microbiota profile [23].
Interestingly, we observed that although L. plantarum DR7 did not significantly affect the serum TC level, serum TG level was significantly reduced after 12 weeks of treatment compared to the control. TG has now been recognized as a strong marker for CVD and diabetes, as well as NAFLD [4]. Probiotics have been reported to exert their lipid-modulating effect by regulating the host genes responsible for lipid metabolism [20,24,25]. In this study, it was observed that L. plantarum DR7 and L. fermentum DR9 significantly downregulated the gene expression of SCD1 in the liver, where the former showed a more prominent effect. SCD1 is a rate-limiting enzyme that converts saturated fatty acids into MUFAs, mainly oleate (18:1) and palmitoleate (16:1), which represent the major MUFAs of membrane phospholipids, TGs, and cholesterol esters [26]. Previous studies have shown that SCD1-deficient mice are protected from hypertriglyceridemia largely through increased fatty acid oxidation and reduced fatty acid synthesis in the liver [27]. It was suggested that SCD1 activity might be rate-limiting for triglyceride production in a wide array of dyslipidemias [28]. We thus postulated that L. plantarum DR7 exerted its TG-lowering effect via downregulation of SCD1 gene expression.
Inhibition of SCD1 has also been reported to activate AMPK using in vitro [29] and in vivo models where global deletion of SCD1 in mice resulted in activation of AMPK in the liver [30] and skeletal muscle [31]. AMPK is an energy sensor that plays an important role in sustaining cellular energy levels [32] and thus has emerged as a potential therapeutic target for metabolic diseases. AMPK is also the upstream kinase for the critical metabolic enzymes such as HMG-CoA reductase, the rate-limiting enzyme responsible for de novo synthesis of cholesterol in the liver [33]. When activated, AMPK phosphorylates downstream pathways that are critical for lipid and carbohydrate metabolism [34]. More studies have now suggested increasing the activity of AMPK as a treatment strategy for hyperlipidemia [35,36]. Exercise has also been reported to increase AMPK activity [37]. In our previous in vitro study using liver cell line HepG2, we showed that L. plantarum DR7 could activate AMPK [15]. This observation was further corroborated in our current in vivo study using rats where expression of both AMPK subunits, α-1 and α-2, was significantly upregulated in the liver. AMPK’s main catalytic subunit alpha has two isoforms, α1 and α2, which are widely expressed in cardiac muscle and liver. All these indicated that L. plantarum DR7 might be activating AMPK via downregulation of SCD1 gene expression.
NAFLD is characterized by excessive lipid accumulation in hepatocytes in the form of TG, and elevated serum TG has now been proven to be a strong marker for NAFLD in a cohort study [4]. Histology analysis showed that the HFD group liver contained more lipid droplets in the form of macrovesicular and microvesicular steatosis. Administration of L. plantarum DR7, L. fermentum DR9 and statin reduced the accumulation of lipid in the liver and showed lesser degree of steatosis as compared to the HFD group. We hypothesized that the TG-lowering effects of probiotics may lead to alleviation of NAFLD symptoms in rats fed with HFD. Reduction in serum ALP was also observed in the L. plantarum DR7, L. fermentum DR9, and statin-treated groups. Elevated ALP has also been shown to be a risk factor for nonalcoholic fatty liver disease [38]. It has been reported that consumption of high-fat meal led to higher serum ALP [39]. ALP in the blood is primarily derived from excess ALP that is released from cells of the liver, bones, and bile ducts. High levels of ALP may indicate liver and bone diseases. A rise in ALP activity occurs with all forms of cholestasis (decrease in bile flow due to impaired secretion or obstruction of bile flow). In a recent large prospective study involving 132,377 adults, a strong correlation between ALP concentration and metabolic disorders, such as type-2 diabetes, was observed [40]. Potential of probiotics in regulation of serum ALP has been shown previously in an animal study using rats where administration of L. plantarum and L. casei significantly reduced the serum ALP concentration [41].
In this study, it was also observed that probiotic strains L. plantarum DR7, L. fermentum DR9, and L. reuteri 8513d significantly increased the expression of IL-6 in the liver tissue. Although IL-6 has been reported to exhibit both pro- and anti-inflammatory properties, there is also information indicating that this cytokine can protect against cardiovascular diseases [42]. Interleukin-6 has been reported to exhibit atheroprotective effects by lowering of plasma LDL via upregulation of LDL receptor gene expression [43]. LDL-R expression was higher in L. plantarum DR7, L. reuteri 8513d, and statin-treated groups. IL-6 has also been reported to exert a positive impact on lipid metabolism through upregulation of ABCA1 by increasing the cholesterol efflux to Apo A1 in macrophages [44], and thus reduces the risk of CVD. ABCA1 is the rate-controlling protein in the Apo A1-dependent active transport of cholesterol and phospholipids [45]. SR-B1, on the other hand, promotes cholesterol efflux from cells to lipid-poor Apo A1 [46]. Cholesterol from peripheral tissue, carried by HDL, is metabolized in the liver after uptake by the SR-B1 [47]. In this study, it was observed that ABCA1, Apo A1, and SR-B1 expression was increased in the HFD-DR7 and HFD-statin group. This study also showed that ABCG5 is upregulated upon treatment with L. plantarum DR7, L. fermentum DR9, L. reuteri 8513d and statin. However, ABCG8 is only upregulated upon treatment with L. plantarum DR7. ABCG5 and G8 have been reported to play a critical role in maintaining sterol balance via a reverse cholesterol transport mechanism. It has been reported that increased expression of ABCG5 and ABCG8 selectively drives biliary neutral sterol secretion and reduces intestinal cholesterol absorption. The ability of probiotic strains to modulate the expression of ABCG5 and G8 has also been reported from several previous in vitro studies using cell lines [48,49].
Experimental data from this study also showed that HFD increased liver IL-4 level. It was also observed that liver IL-4 levels decreased in the HFD-DR9, HFD-DR7, and HFD-statin groups. According to a recent review, IL-4 is a complicated cytokine whose role varies between anti- and proinflammation in autoimmunity [50]. However, in experimental, immune-mediated liver injury, IL-4 is clearly proinflammatory, where the target cells can be CD4+ T cells or macrophages [48]. Of note, the level of anti-inflammatory cytokine IL-10 was persistently elevated in the HFD group, and administration of L. fermentum DR9 decreased the IL-10 level. A similar observation was reported in previous studies in mice [51,52] and humans [53] where HFD increased hepatic IL-10 levels, and likely represents a protective response of the body to counteract proinflammatory events.
In conclusion, it was observed that administration of different probiotic strains may lead to alteration of lipid metabolism in different ways, as shown in their different gene and protein expression profiles. We hypothesized that probiotic strains with potential in reducing TG will be a promising natural intervention for alleviation of CVD as well as NAFLD.

4. Materials and Methods

4.1. Bacterial Culture

Lactobacillus reuteri 8513d was obtained from School of Industrial Technology, Universiti Sains Malaysia (Penang, Malaysia). Lactobacillus plantarum DR7 and Lactobacillus fermentum DR9 were isolated from fresh cow’s milk from Penang and were obtained via courtesy of Clinical Nutrition Intl (M) Sdn. Bhd., Malaysia. The screening and selection of these strains are as previously described [15]. All stock cultures were preserved in 20% (v/v) glycerol (−20 °C), activated in sterile de Mann, Rogosa, Sharpe (MRS) broth (Hi-media, Mumbai, India) for three successive times using 10% (v/v) inoculums and incubated at 37 °C for 24 h prior to use.

4.2. Animal Experiments

All animal experiments were approved by the USM Animal Care and Use Committee (USM/Animal Ethics Approval/2016/(724)) and were carried out under the institutional guidelines for ethical animal use. Sprague–Dawley rats at eight weeks of age were used in this study. Animals were housed with alternating 12 h light and dark cycles with free access to food and water. Food intake and body weight were recorded once a week. The adverse events (including signs of illness or mortality) of animals were monitored daily, and no adverse events were observed throughout the study.
After 1 week of acclimatization, the rats were assigned to one of the following six groups (n = 6) for 12 weeks: (1) ND (normal diet), (2) HFD (high-fat diet), (3) HFD-statin (high-fat diet, receiving lovastatin 2 mg/kg/day), (4) HFD-DR9 (high-fat diet, receiving L. fermentum DR9 (10 log CFU/day), (5) HFD-DR7 (high-fat diet, receiving L. plantarum DR7 (10 log CFU/day), (6) HFD-8513d (high-fat diet, receiving L. reuteri 8513d (10 log CFU/day). To induce aging, all rats were injected subcutaneously with 600 mg/kg/day of D-galactose daily. Diets used included a normal diet (ND) of standard chow diet (Altromin, Lage, Germany), a high-fat diet (HFD) containing standard chow diet augmented with 25% (w/w) animal fat (ghee, 99% fat content) (Table 1). Suspension of lactobacilli and controls were dissolved in 100 µL of saline and mixed into 1 g of food pellet prior to daily feeding. The rats were placed in individual cages during feeding of treatment to ensure complete ingestion.

4.3. Collection of Tissues

At the end of the twelve-week treatment period, the rats were fasted for 12 h before being sacrificed by inhalation of carbon dioxide. Blood samples were collected by cardiac puncture. All tissues were excised immediately and rinsed in saline. Tissue samples for total RNA isolation were kept in RNAlater (Sigma-Aldrich, St. Louis, MO, USA), while tissue samples for Multiplex ELISA were snap frozen and stored at −80 °C until analysis. Tissue samples for histology analysis were fixed in 10% neutral-buffered formalin.

4.4. Serum Biochemical Analysis

Whole blood was collected in clot activator tube, centrifuged at 1500× g for 15 min at 4 °C to obtain the serum, and analyzed within 48 h. Serum lipid profile (total cholesterol (TC)), TG, LDL and HDL, liver function (total protein, albumin, globulin, AG ratio), AST, ALT, ALP, total bilirubin, and renal function (sodium, urea, chloride, potassium, creatinine, uric acid, calcium, and phosphate) profile were performed in a MS ISO 15189 certified Advanced Diagnostic laboratory using an autoanalyzer AU5822 (Beckman Coulter, Brea, CA, USA) according to the method recommended by International Federation for Clinical Chemistry (IFCC).

4.5. Total RNA Isolation and cDNA Conversion

Total RNA was isolated using TRISURE reagent (Bioline, London, UK) and was converted to cDNA by reverse transcription using the RevertAid RT Kit (Thermo Scientific, Vilnius, Lithuania) with random hexamer primers according to manufacturer’s instructions. Briefly, 1 µg of total RNA was reverse transcribed and amplified by incubating the reaction mixture at 25 °C for 5 min, followed 42 °C for 60 min. The reaction was terminated by incubating the mixture at 70 °C for 5 min. The cDNA was diluted 10 times using nuclease-free water and used as template in qPCR or stored at −80 °C until use. The cDNA conversion was performed using the Techne Prime Thermal Cycler (Cole-Parmer, Staffordshire, UK).

4.6. qRT-PCR

The mRNA expression of genes involved in lipid metabolism was determined by real-time PCR analysis using the Agilent AriaMx Realtime PCR System (Agilent Technologies, Santa Clara, CA, USA). Twenty microliter PCR reactions consisted of 10 µL of 2× SensiFAST SYBR mix (Bioline, London, UK), 0.8 µL each of 10 µM forward and reverse primers, and 1 µL of cDNA. The primer sequences are shown in Table 2, using amplification conditions suggested by the manufacturer. The GAPDH gene was used as the housekeeping gene for normalization of data. The mRNA expression was expressed as fold-change relative to the control.

4.7. Multiplex ELISA

Frozen tissue samples were manually disrupted on a cold stainless-steel mortar and pestle and immediately homogenized in RIPA buffer (Merck, Darmstadt, Germany) containing a protease and phosphatase inhibitor cocktail (Promega, Madison, WI, USA). Supernatants were obtained by centrifugation at 10,000× g for 10 min at 4 °C, split into aliquots, and stored at −80 °C until analysis.
Assays were run according to the MILLIPLEX® MAP Rat Cytokine/Chemokine magnetic bead panel kit (Merck, Billerica, MA, USA) instructions with overnight incubation with shaking at 4 °C (18 h, 750 rpm) and using a hand-held magnetic block for wash steps. Standards were assayed in duplicate as recommended by the manufacturer. Data were acquired on a validated and calibrated Luminex® xMAP platform (Luminex, Austin, TX, USA). All data were standardized to protein concentration using the Bradford method.

4.8. Liver Histology

Samples fixed in neutral-buffered formalin were trimmed, followed by a dehydration and clearing step in an automatic tissue processor (Thermo ScientificTM Shandon Excelsior, Kalamazoo, MI, USA). The samples were then embedded in paraffin wax and sectioned using cryotome. Sectioned samples were then stained with hematoxylin and eosin; and observed under light microscope.

4.9. Statistical Analysis

Data were analyzed using SPSS version 23.0 (SPSS Inc, Chicago, IL, USA). Independent t-tests were used to study the significant differences between sample means, with a significance level of α = 0.05. All data presented are mean values obtained from six replicates per group (n = 6).

Author Contributions

L.-C.L., Y.-Y.H., M.-H.J., A.-S.-Y.L., L.-O.C. performed the study. L.-C.L. analysed the data. B.-K.L., G.A., A.A., K.-P.Y., S.-B.C. provided psychological and experimental advice and services. L.-C.L., Y.-Y.H. and M.-T.L. conceived and designed the experiments. L.-C.L. drafted the work and wrote the manuscript. M.-T.L. critically revised for intellectual content. All authors have read and agreed to the published version of the manuscript.

Funding

This work was supported by the URICAS grant [1001/PTEKIND/870030]; and the MyBrain Scholarship provided by Ministry of Higher Education Malaysia; and funding by Clinical Nutrition Intl (M) Sdn. Bhd.

Conflicts of Interest

The authors declare no conflict of interest. The funders had no role in the design of the study; in the collection, analyses, or interpretation of data; in the writing of the manuscript, or in the decision to publish the results.

Abbreviation

ABCA1ATP-binding cassette subfamily A member 1
ABCG5 & ABCG8ATP-binding cassette subfamily G member 5 and 8
AMPK5’ adenosine monophosphate-activated protein kinase
ALPAlkaline phosphatase
ALTAlanine aminotransferase
Apo A1Apolipoprotein A1
ASTAspartate aminotransferase
CVDCardiovascular disease
HDLHigh-density lipoprotein
HFDHigh-fat diet
IL-6Interleukin-6
LDL-CLow-density lipoprotein cholesterol
NAFLDNon-alcoholic fatty liver disease
NDNormal diet
SCD1Stearoyl-CoA desaturase 1
SR-B1Scavenger Receptor B1
TCTotal cholesterol
TGTotal triglyceride

References

  1. Trapani, L.; Pallottini, V. Age-related hypercholesterolemia and HMG-CoA reductase dysregulation: Sex does matter (A Gender Perspective). Curr. Gerontol. Geriatr. Res. 2010, 2010, 1–7. [Google Scholar] [CrossRef] [Green Version]
  2. Nelson, R.H. Hyperlipidemia as a risk factor for cardiovascular disease. Prim. Care 2012, 40, 195–211. [Google Scholar] [CrossRef] [Green Version]
  3. Singh, S.V.; Shrivastava, A.J.; Chaturvedi, U.; Singh, S.C.; Shanker, K.; Saxena, J.K.; Bhatia, G.; Pal, A. A mechanism-based pharmacological evaluation of efficacy of Flacourtia indica in management of dyslipidemia and oxidative stress in hyperlipidemic rats. J. Basic Clin. Physiol. Pharmacol. 2016, 27, 121–129. [Google Scholar] [CrossRef]
  4. Tomizawa, M.; Kawanabe, Y.; Shinozaki, F.; Sato, S.; Motoyoshi, Y.; Sugiyama, T.; Yamamoto, S.; Sueishi, M. Triglyceride is strongly associated with nonalcoholic fatty liver disease among markers of hyperlipidemia and diabetes. Biomed. Rep. 2014, 2, 633–636. [Google Scholar] [CrossRef]
  5. Wadhera, R.K.; Steen, D.L.; Khan, I.; Giugliano, R.P.; Foody, J.M. A review of low-density lipoprotein cholesterol, treatment strategies, and its impact on cardiovascular disease morbidity and mortality. J. Clin. Lipidol. 2016, 10, 472–489. [Google Scholar] [CrossRef] [PubMed] [Green Version]
  6. Storey, B.C.; Staplin, N.; Haynes, R.; Reith, C.; Emberson, J.; Herrington, W.G.; Wheeler, D.C.; Walker, R.; Fellström, B.; Wanner, C.; et al. Lowering LDL cholesterol reduces cardiovascular risk independently of presence of inflammation. Kidney Int. 2017, 93, 1000–1007. [Google Scholar] [CrossRef] [PubMed] [Green Version]
  7. National Cholesterol Education Program Expert Panel on Detection Evaluation and Treatment of High Blood Cholesterol in Adults (Adult Treatment Panel III). Third Report of the National Cholesterol Education Program (NCEP) Expert Panel on Detection, Evaluation, and Treatment of High Blood Cholesterol in Adults (Adult Treatment Panel III) final report. Circulation 2002, 106, 3143–3421. [Google Scholar] [CrossRef]
  8. Seki, R.; Inoue, K.; Yamamoto, S.; Akimoto, K. Non-HDL cholesterol is better than Friedewald-Estimated LDL cholesterol to associate with cardiometabolic markers. Biomed. Res. Clin. Pract. 2017, 2, 1–6. [Google Scholar] [CrossRef] [Green Version]
  9. Tham, C.S.-C.; Peh, K.-K.; Bhat, R.; Liong, M.-T. Probiotic properties of bifidobacteria and lactobacilli isolated from local dairy products. Ann. Microbiol. 2011, 62, 1079–1087. [Google Scholar] [CrossRef]
  10. Hor, Y.Y.; Liong, M.-T. Use of extracellular extracts of lactic acid bacteria and bifidobacteria for the inhibition of dermatological pathogen Staphylococcus aureus. Dermatol. Sin. 2014, 32, 141–147. [Google Scholar] [CrossRef] [Green Version]
  11. Fung, W.-Y.; Liong, M.-T. Evaluation of proteolytic and ACE-inhibitory activity of Lactobacillus acidophilus in soy whey growth medium via response surface methodology. LWT Food Sci. Tehcnol. 2010, 43, 563–567. [Google Scholar] [CrossRef]
  12. Ben Salah, R.; Trabelsi, I.; Hamden, K.; Chouayekh, H.; Bejar, S. Lactobacillus plantarum TN8 exhibits protective effects on lipid, hepatic and renal profiles in obese rat. Anaerobe 2013, 23, 55–61. [Google Scholar] [CrossRef] [PubMed]
  13. Xie, N.; Cui, Y.; Yin, Y.-N.; Zhao, X.; Yang, J.-W.; Wang, Z.-G.; Fu, N.; Tang, Y.; Wang, X.-H.; Liu, X.-W.; et al. Effects of two Lactobacillus strains on lipid metabolism and intestinal microflora in rats fed a high-cholesterol diet. BMC Complement. Altern. Med. 2011, 11, 53. [Google Scholar] [CrossRef] [Green Version]
  14. Wu, Y.; Zhang, Q.; Ren, Y.; Ruan, Z. Effect of probiotic Lactobacillus on lipid profile: A systematic review and meta-analysis of randomized, controlled trials. PLoS ONE 2017, 12, e0178868. [Google Scholar] [CrossRef]
  15. Lew, L.C.; Choi, S.-B.; Khoo, B.-Y.; Sreenivasan, S.; Ong, K.-L.; Liong, M.-T. Lactobacillus plantarum DR7 reduces cholesterol via phosphorylation of AMPK that down-regulated the mRNA expression of HMG-CoA reductase. Korean J. Food Sci. Anim. 2018, 38, 350–361. [Google Scholar]
  16. Foretz, M.; Even, P.; Viollet, B. AMPK activation reduces hepatic lipid content by increasing fat oxidation in vivo. Int. J. Mol. Sci. 2018, 19, 2826. [Google Scholar] [CrossRef] [PubMed] [Green Version]
  17. Chen, P.; Chen, F.; Zhou, B. Antioxidative, anti-inflammatory and anti-apoptotic effects of ellagic acid in liver and brain of rats treated by D-galactose. Sci. Rep. 2018, 8, 1465. [Google Scholar] [CrossRef] [Green Version]
  18. Ji, M.; Su, X.; Liu, J.; Zhao, Y.; Li, Z.; Xu, X.; Li, H.; Nashun, B. Comparison of naturally aging and D-galactose induced aging model in beagle dogs. Exp. Ther. Med. 2017, 14, 5881–5888. [Google Scholar] [CrossRef] [Green Version]
  19. Bendali, F.; Kerdouche, K.; Hamma-Faradji, S.; Drider, D. In vitro and in vivo cholesterol lowering ability of Lactobacillus pentosus KF923750. Benef. Microbes 2017, 8, 271–280. [Google Scholar] [CrossRef]
  20. Hu, X.; Wang, T.; Li, W.; Jin, F.; Wang, L. Effects of NS lactobacillus strains on lipid metabolism of rats fed a high-cholesterol diet. Lipids Health Dis. 2013, 12, 67. [Google Scholar] [CrossRef] [Green Version]
  21. Rerksuppaphol, S.; Rerksuppaphol, L. A randomized double-blind controlled trial of Lactobacillus acidophilus plus Bifidobacterium bifidum versus placebo in patients with hypercholesterolemia. J. Clin. Diagn. Res. 2015, 9, KC01–KC04. [Google Scholar] [CrossRef] [PubMed]
  22. Lye, H.-S.; Rahmat-Ali, G.R.; Liong, M.-T. Mechanisms of cholesterol removal by lactobacilli under conditions that mimic the human gastrointestinal tract. Int. Dairy J. 2010, 20, 169–175. [Google Scholar] [CrossRef]
  23. Lye, H.-S.; Kato, T.; Low, W.-Y.; Taylor, T.; Prakash, T.; Lew, L.C.; Ohno, H.; Liong, M.-T. Lactobacillus fermentum FTDC 8312 combats hypercholesterolemia via alteration of gut microbiota. J. Biotechnol. 2017, 262, 75–83. [Google Scholar] [CrossRef]
  24. Hong, Y.-F.; Kim, H.; Kim, H.S.; Park, W.J.; Kim, J.-Y.; Chung, D.K. Lactobacillus acidophilus K301 inhibits atherogenesis via induction of 24 (S), 25-epoxycholesterol-mediated ABCA1 and ABCG1 production and cholesterol efflux in macrophages. PLoS ONE 2016, 11, e0154302. [Google Scholar] [CrossRef] [Green Version]
  25. Michael, D.R.; Davies, T.S.; Moss, J.; Calvente, D.L.; Ramji, D.P.; Marchesi, J.R.; Pechlivanis, A.; Plummer, S.F.; Hughes, T.R. The anti-cholesterolaemic effect of a consortium of probiotics: An acute study in C57BL/6J mice. Sci. Rep. 2017, 7, 2883. [Google Scholar] [CrossRef] [Green Version]
  26. Enoch, H.G.; Catalá, A.; Strittmatter, P. Mechanism of rat liver microsomal stearyl-CoA desaturase. Studies of the substrate specificity, enzyme-substrate interactions, and the function of lipid. J. Biol. Chem. 1976, 251, 5095–5103. [Google Scholar]
  27. Miyazaki, M.; Kim, Y.-C.; Gray-Keller, M.P.; Attie, A.D.; Ntambi, J.M. The biosynthesis of hepatic cholesterol esters and triglycerides is impaired in mice with a disruption of the gene for stearoyl-CoA desaturase 1. J. Biol. Chem. 2000, 275, 30132–30138. [Google Scholar] [CrossRef] [Green Version]
  28. Attie, A.; Krauss, R.M.; Gray-Keller, M.P.; Brownlie, A.; Miyazaki, M.; Kastelein, J.J.; Lusis, A.J.; Stalenhoef, A.F.H.; Stoehr, J.P.; Hayden, M.R.; et al. Relationship between stearoyl-CoA desaturase activity and plasma triglycerides in human and mouse hypertriglyceridemia. J. Lipid Res. 2002, 43, 1899–1907. [Google Scholar] [CrossRef] [Green Version]
  29. Kim, E.; Lee, J.-H.; Ntambi, J.M.; Hyun, C.-K. Inhibition of stearoyl-CoA desaturase1 activates AMPK and exhibits beneficial lipid metabolic effects in vitro. Eur. J. Pharmacol. 2011, 672, 38–44. [Google Scholar] [CrossRef]
  30. Dobrzyń, P.; Dobrzyń, A.; Miyazaki, M.; Cohen, P.; Asilmaz, E.; Hardie, D.G.; Friedman, J.M.; Ntambi, J.M. Stearoyl-CoA desaturase 1 deficiency increases fatty acid oxidation by activating AMP-activated protein kinase in liver. Proc. Natl. Acad. Sci. USA 2004, 101, 6409–6414. [Google Scholar] [CrossRef] [PubMed] [Green Version]
  31. Ntambi, J.M.; Miyazaki, M.; Stoehr, J.P.; Lan, H.; Kendziorski, C.M.; Yandell, B.S.; Song, Y.; Cohen, P.; Friedman, J.M.; Attie, A.D. Loss of stearoyl-CoA desaturase-1 function protects mice against adiposity. Proc. Natl. Acad. Sci. USA 2002, 99, 11482–11486. [Google Scholar] [CrossRef] [Green Version]
  32. Hardie, D.G.; Ross, F.A.; Hawley, S.A. AMPK: A nutrient and energy sensor that maintains energy homeostasis. Nat. Rev. Mol. Cell Biol. 2012, 13, 251–262. [Google Scholar] [CrossRef] [Green Version]
  33. Hawley, S.A.; Davison, M.; Woods, A.; Davies, S.P.; Beri, R.K.; Carling, D.; Hardie, D.G. Characterization of the AMP-activated protein kinase kinase from rat liver and identification of threonine 172 as the major site at which it phosphorylates AMP-activated protein kinase. J. Biol. Chem. 1996, 271, 27879–27887. [Google Scholar] [CrossRef] [Green Version]
  34. Towler, M.C.; Hardie, D.G.; Hardie, D.G. AMP-activated protein kinase in metabolic control and insulin signaling. Circ. Res. 2007, 100, 328–341. [Google Scholar] [CrossRef] [PubMed]
  35. Lee, M.-S.; Cho, S.-M.; Lee, M.-H.; Lee, E.-O.; Kim, S.-H.; Lee, H.-J. Ethanol extract of Pinus koraiensis leaves containing lambertianic acid exerts anti-obesity and hypolipidemic effects by activating adenosine monophosphate-activated protein kinase (AMPK). BMC Complement. Altern. Med. 2016, 16, 51. [Google Scholar] [CrossRef] [Green Version]
  36. Lian, Z.; Li, Y.; Gao, J.; Qu, K.; Li, J.; Hao, L.; Wu, S.; Zhu, H. A novel AMPK activator, WS070117, improves lipid metabolism discords in hamsters and HepG2 cells. Lipids Health Dis. 2011, 10, 67. [Google Scholar] [CrossRef] [Green Version]
  37. McGee, S.L.; Howlett, K.; Starkie, R.L.; Cameron-Smith, D.; Kemp, B.E.; Hargreaves, M. Exercise increases nuclear AMPK 2 in human skeletal muscle. Diabetes 2003, 52, 926–928. [Google Scholar] [CrossRef] [Green Version]
  38. Zhou, Y.-J.; Zou, H.; Zheng, J.-N.; Zou, T.-T.; Vitale, A.; Miele, L.; Van Poucke, S.; Liu, W.-Y.; Shen, S.; Zhang, D.-C.; et al. Serum alkaline phosphatase, a risk factor for non-alcoholic fatty liver, but only for women in their 30s and 40s: Evidence from a large cohort study. Expert Rev. Gastroenterol. Hepatol. 2017, 11, 1–8. [Google Scholar] [CrossRef]
  39. Matsushita, M.; Otani, K.; Sakamoto, Y.; Arai, T.; Yukimasa, N.; Muramoto, Y.; Komoda, T. Increase in alkaline phosphatase activity after high-fat meal ingestion is correlated to the amount of ABH substances in saliva. Rinsho Byori. Jpn. J. Clin. Pathol. 2015, 63, 543–547. [Google Scholar]
  40. Chen, S.C.-C.; Tsai, S.P.; Jhao, J.-Y.; Jiang, W.-K.; Tsao, C.K.; Chang, L.-Y. Liver fat, hepatic enzymes, alkaline phosphatase and the risk of incident Type 2 diabetes: A prospective study of 132,377 adults. Sci. Rep. 2017, 7, 4649. [Google Scholar] [CrossRef]
  41. Zavisic, G.; Petricevic, S.; Radulovic, Z.; Begovic, J.; Golic, N.; Topisirovic, L.; Strahinic, I. Probiotic features of two oral Lactobacillus isolates. Braz. J. Microbiol. 2012, 43, 418–428. [Google Scholar] [CrossRef] [PubMed]
  42. Scheller, J.; Chalaris, A.; Schmidt-Arras, D.; Rose-John, S. The pro- and anti-inflammatory properties of the cytokine interleukin-6. BBA Mol. Cell Res. 2011, 1813, 878–888. [Google Scholar] [CrossRef] [PubMed] [Green Version]
  43. Gierens, H.; Nauck, M.; Roth, M.; Schinker, R.; Schürmann, C.; Scharnagl, H.; Neuhaus, G.; Wieland, H.; März, W. Interleukin-6 stimulates LDL receptor gene expression via activation of sterol-responsive and Sp1 binding elements. Arterioscler. Thromb. Vasc. Biol. 2000, 20, 1777–1783. [Google Scholar] [CrossRef] [Green Version]
  44. Frisdal, E.; Lesnik, P.; Olivier, M.; Robillard, P.; Chapman, M.J.; Huby, T.; Guerin, M.; Le Goff, W. Interleukin-6 protects human macrophages from cellular cholesterol accumulation and attenuates the proinflammatory response. J. Biol. Chem. 2011, 286, 30926–30936. [Google Scholar] [CrossRef] [Green Version]
  45. Voloshyna, I.; Reiss, A.B. The ABC transporters in lipid flux and atherosclerosis. Prog. Lipid Res. 2011, 50, 213–224. [Google Scholar] [CrossRef]
  46. Duong, M.; Collins, H.L.; Jin, W.; Zanotti, I.; Favari, E.; Rothblat, G.H. Relative contributions of ABCA1 and SR-BI to cholesterol efflux to serum from fibroblasts and macrophages. Arterioscler. Thromb. Vasc. Biol. 2006, 26, 541–547. [Google Scholar] [CrossRef] [Green Version]
  47. Ganesan, L.P.; Mates, J.M.; Cheplowitz, A.M.; Avila, C.L.; Zimmerer, J.M.; Yao, Z.; Maiseyeu, A.; Rajaram, M.V.S.; Robinson, J.M.; Anderson, C.L. Scavenger receptor B1, the HDL receptor, is expressed abundantly in liver sinusoidal endothelial cells. Sci. Rep. 2016, 6, 20646. [Google Scholar] [CrossRef] [Green Version]
  48. Michael, D.; Moss, J.; Calvente, D.L.; Garaiová, I.; Plummer, S.; Ramji, D.P. Lactobacillus plantarum CUL66 can impact cholesterol homeostasis in Caco-2 enterocytes. Benef. Microbes 2016, 7, 443–451. [Google Scholar] [CrossRef]
  49. Yoon, H.-S.; Ju, J.-H.; Kim, H.; Lee, J.; Park, H.; Ji, Y.; Shin, H.-K.; Do, M.-S.; Lee, J.-M.; Holzapfel, W. Lactobacillus rhamnosus BFE 5264 and Lactobacillus plantarum NR74 promote cholesterol excretion through the up-regulation of ABCG5/8 in Caco-2 cells. Probiot. Antimicrob. Proteins 2011, 3, 194–203. [Google Scholar] [CrossRef] [PubMed]
  50. Njoku, D.B. Suppressive and pro-inflammatory roles for IL-4 in the pathogenesis of experimental drug-induced liver injury: A review. Expert Opin. Drug Metab. Toxicol. 2010, 6, 519–531. [Google Scholar] [CrossRef] [Green Version]
  51. Oliveira, M.C.; Menezes-Garcia, Z.; Henriques, M.C.C.; Soriani, F.M.; Pinho, V.; Faria, A.C.; Santiago, A.F.; Cara, D.C.; Souza, D.G.; Teixeira, M.M.; et al. Acute and sustained inflammation and metabolic dysfunction induced by high refined carbohydrate-containing diet in mice. Obesity 2013, 21, E396–E406. [Google Scholar] [CrossRef] [PubMed]
  52. Van Der Heijden, R.A.; Sheedfar, F.; Morrison, M.C.; Hommelberg, P.P.H.; Kor, D.; Kloosterhuis, N.J.; Gruben, N.; Youssef, S.A.; De Bruin, A.; Hofker, M.H.; et al. High-Fat diet induced obesity primes inflammation in adipose tissue prior to liver in C57BL/6j mice. Aging 2015, 7, 256–267. [Google Scholar] [CrossRef] [PubMed] [Green Version]
  53. Esposito, K.; Pontillo, A.; Di Palo, C.; Giugliano, G.; Masella, M.; Marfella, R.; Giugliano, D. Effect of weight loss and lifestyle changes on vascular inflammatory markers in obese women: A randomized trial. JAMA 2003, 289, 1799. [Google Scholar] [CrossRef] [PubMed] [Green Version]
Figure 1. Final body weight (A), feed intake (B), feed efficiency (C), fasting blood glucose (D), adipose weight (E), and percent body fat (F) in D-galactose-induced aging rats (600 mg/kg/day) after 12 weeks of treatment. ND (normal diet), HFD (high-fat diet), HFD-statin (high-fat diet, receiving lovastatin 2 mg/kg/day), HFD-DR9 (high-fat diet, receiving L. fermentum DR9 (1010 CFU/day), HFD-DR7 (high-fat diet, receiving L. plantarum DR7 (1010 CFU/day), HFD-8513d (high-fat diet, receiving L. reuteri 8513d (1010 CFU/day). Results are expressed as mean; error bars (SEM); n = 6. Results are expressed as mean; error bars (SEM); n = 6. Statistical analysis was performed using independent t-tests. * Food efficiency, weight gain (g)/feed intake (g) × 100.
Ijms 21 05872 g001
Figure 2. Serum total cholesterol in D-galactose-induced aging rats (600 mg/kg/day) after 4, 8, and 12 weeks of treatment. ND (normal diet), HFD (high-fat diet), HFD-statin (high-fat diet, receiving lovastatin 2 mg/kg/day), HFD-DR9 (high-fat diet, receiving L. fermentum DR9 (1010 CFU/day), HFD-DR7 (high-fat diet, receiving L. plantarum DR7 (1010 CFU/day), HFD-8513d (high-fat diet, receiving L. reuteri 8513d (1010 CFU/day). Results are expressed as mean; error bars (SEM); n = 6. Statistical analysis was performed using independent t-tests.
Ijms 21 05872 g002
Figure 3. Serum triglyceride (A), HDL (B), and LDL (C) in D-galactose-induced aging rats (600 mg/kg/day) after 12 weeks of treatment. ND (normal diet), HFD (high-fat diet), HFD-statin (high-fat diet, receiving lovastatin 2 mg/kg/day), HFD-DR9 (high-fat diet, receiving L. fermentum DR9 (1010 CFU/day), HFD-DR7 (high-fat diet, receiving L. plantarum DR7 (1010 CFU/day), HFD-8513d (high-fat diet, receiving L. reuteri 8513d (1010 CFU/day). Results are expressed as mean; error bars (SEM); n = 6. Statistical analysis was performed using independent t-tests.
Ijms 21 05872 g003
Figure 4. Liver function test, including total protein, albumin, globulin, AG ratio (Albumin/Globulin ratio), AST (aspartate aminotransferase), ALT (alanine aminotransferase), ALP (alkaline phosphatase), and total bilirubin in D-galactose-induced aging rats (600 mg/kg/day) after 12 weeks of treatment. ND (normal diet), HFD (high-fat diet), HFD-statin (high-fat diet, receiving lovastatin 2 mg/kg/day), HFD-DR9 (high-fat diet, receiving L. fermentum DR9 (1010 CFU/day), HFD-DR7 (high-fat diet, receiving L. plantarum DR7 (1010 CFU/day), HFD-8513d (high-fat diet, receiving L. reuteri 8513d (1010 CFU/day). Results are expressed as mean; error bars (SEM); n = 6. Statistical analysis was performed using independent t-tests.
Ijms 21 05872 g004
Figure 5. Renal function test, including sodium, urea, chloride, potassium, creatinine, uric acid, calcium, and phosphate of D-galactose-induced aging rats (600 mg/kg/day) after 12 weeks of treatment. ND (normal diet), HFD (high-fat diet), HFD-statin (high-fat diet, receiving lovastatin 2 mg/kg/day), HFD-DR9 (high-fat diet, receiving L. fermentum DR9 (1010 CFU/day), HFD-DR7 (high-fat diet, receiving L. plantarum DR7 (1010 CFU/day), HFD-8513d (high-fat diet, receiving L. reuteri 8513d (1010 CFU/day). Results are expressed as mean; error bars (SEM); n = 6. Statistical analysis was performed using independent t-tests.
Ijms 21 05872 g005
Figure 6. Relative gene expression of (A) SCD1, (B) IL-6, (C) ABCG5, and (D) ABCG8 in liver of D-galactose-induced aging rats (600 mg/kg/day) after 12 weeks of treatment. ND (normal diet), HFD (high-fat diet), HFD-statin (high-fat diet, receiving lovastatin 2 mg/kg/day), HFD-DR9 (high-fat diet, receiving L. fermentum DR9 (1010 CFU/day), HFD-DR7 (high-fat diet, receiving L. plantarum DR7 (1010 CFU/day), HFD-8513d (high-fat diet, receiving L. reuteri 8513d (1010 CFU/day). Results are expressed as mean; error bars (SEM); n = 6. Statistical analysis was performed using independent t-tests.
Ijms 21 05872 g006
Figure 7. Relative gene expression of (A) SR-B1, (B) LDL-R, (C) ABCA1, and (D) Apo A1 in liver of D-galactose-induced aging rats (600 mg/kg/day) after 12 weeks of treatment. ND (normal diet), HFD (high-fat diet), HFD-statin (high-fat diet, receiving lovastatin 2 mg/kg/day), HFD-DR9 (high-fat diet, receiving L. fermentum DR9 (1010 CFU/day), HFD-DR7 (high-fat diet, receiving L. plantarum DR7 (1010 CFU/day), HFD-8513d (high-fat diet, receiving L. reuteri 8513d (1010 CFU/day). Results are expressed as mean; error bars (SEM); n = 6. Statistical analysis was performed using independent t-tests.
Ijms 21 05872 g007
Figure 8. Relative gene expression of (A) AMPKα1 (B) AMPKα2 in liver of D-galactose-induced aging rats (600 mg/kg/day) after 12 weeks of treatment. ND (normal diet), HFD (high-fat diet), HFD-statin (high-fat diet, receiving lovastatin 2 mg/kg/day), HFD-DR9 (high-fat diet, receiving L. fermentum DR9 (1010 CFU/day), HFD-DR7 (high-fat diet, receiving L. plantarum DR7 (1010 CFU/day), HFD-8513d (high-fat diet, receiving L. reuteri 8513d (1010 CFU/day). Results are expressed as mean; error bars (SEM); n = 6. Statistical analysis was performed using independent t-tests.
Ijms 21 05872 g008
Figure 9. Cytokine levels of (A): Interleukin 1-beta (IL-1b), (B): Interleukin-4 (IL-4), (C): Interleukin-10 (IL-10), (D): Tumor necrosis factor-alpha (TNF-α), (E): Interferon-gamma (IFN-γ)) in liver of D-galactose-induced aging rats (600 mg/kg/day) after 12 weeks of treatment. ND (normal diet), HFD (high-fat diet), HFD-statin (high-fat diet, receiving lovastatin 2 mg/kg/day), HFD-DR9 (high-fat diet, receiving L. fermentum DR9 (1010 CFU/day), HFD-DR7 (high-fat diet, receiving L. plantarum DR7 (1010 CFU/day), HFD-8513d (high-fat diet, receiving L. reuteri 8513d (1010 CFU/day). Results are expressed as mean; error bars (SEM); n = 6. Statistical analysis was performed using independent t-tests.
Ijms 21 05872 g009
Figure 10. Hematoxylin and eosin (H&E) staining of liver sections of D-galactose-induced aging rats (600 mg/kg/day) after 12 weeks of treatment. (a) ND (normal diet), (b) HFD (high-fat diet), (c) HFD-statin (high-fat diet, receiving lovastatin 2 mg/kg/day), (d) HFD-DR7 (high-fat diet, receiving L. plantarum DR7 (1010 CFU/day), (e) HFD-DR9 (high-fat diet, receiving L. fermentum DR9 (1010 CFU/day), (f) HFD-8513d (high-fat diet, receiving L. reuteri 8513d (1010 CFU/day).
Ijms 21 05872 g010
Table 1. Compositions of normal diet (ND) and high-fat diet (HFD) administered to rats over 12 weeks.
ContentNormal Diet (ND)High-Fat Diet (HFD)
g/kg%g/kg%
Crude protein192.1119.2144.0814.4
Crude fat40.804.1280.6028.0
Crude fiber60.746.145.564.6
Crude ash58.555.943.914.4
Moisture113.4311.385.078.5
Nitrogen-free extractives534.3753.4400.7840.1
Total1000.00100.01000.00100.0
kcal/kg%kcal/kg%
Fat36711.0252554.0
Protein76824.057612.3
Carbohydrates209165.0157533.7
Total3226100.04676100.0
Treatments included (n = 6) (i) ND, (ii) HFD, (iii) HFD-statin (lovastatin 2 mg/kg/day), (iv) HFD-L. fermentum DR9 (10 log CFU/day), (v) HFD-L. plantarum DR7 (10 log CFU/day), (vi) HFD-L. reuteri 8513d (10 log CFU/day).
Table 2. List of primer sequences used for quantitative real-time polymerase chain reaction.
Target GenesPrimer Sequences (5′–3′)NCBI Accession No.
GAPDHF: CCA TCC CAG ACC CCA TAA CNM_017008.4
R: GCA GCG AAC TTT ATT GAT GG
SCD-1F: CAC TGG TGC CCT GGT ACT GCTNM_139192.2
R: GGA TGT TCT CCC GAG ATT GAA
IL-6F: TAG TCC TTC CTA CCC CAA CTT CNM_012589.2
R: GCC GAG TAG ACC TCA TAG TGA C
ABCG5F: TGT GAC CCT GGC ATC TATNM_053754.2
R: ATC ATT GGA CCA GTT CAG T
ABCG8F: GAT GCT GGC TAT CAT AGG GAG CNM_130414.2
R: TCT CTG CCT GTG ATA ACG TCG A
SR-B1F: CCC AGA AGA CAC CAC GANM_031541.1
R: GTG TGG ACA GTG TGA CAT CT
LDL-RF: TGG TGA CCG AGG ACA TCC AGNM_175762.2
R: GTG GAG TTT GGA ATC AAA CCC AAT AG
ABCA1F: CAG CAA CTA CAG TGG CGG TAA CANM_178095.2
R: AAT GCT TAG GGC ACA ATT CCA CA
APO A1F: GGC AGA GAC TAT GTG TCC CAG TTTNM_012738.1
R: TTG AAC CCA GAG TGT CCC AGT T
AMPKα1F: GGG ATC CAT CAG CAA CTA TCGNM_019142.2
R: GGG AGG TCA CGG ATG AGG TA
AMPKα2F: CAT TTG TGC AAG GCC CCT AGTNM_023991.1
R: GAC TGT TGG TAT CTG CCT GTT TCC

