Article

Evolution and Expression of the Membrane Attack Complex and Perforin Gene Family in the Poaceae

State Key Laboratory of Biocontrol, Guangdong Key Laboratory of Plant Resources, School of Life Sciences, Sun Yat-sen University, Guangzhou 510275, China
*
Authors to whom correspondence should be addressed.
Int. J. Mol. Sci. 2020, 21(16), 5736; https://doi.org/10.3390/ijms21165736
Submission received: 15 July 2020 / Revised: 7 August 2020 / Accepted: 8 August 2020 / Published: 10 August 2020
(This article belongs to the Special Issue Plant Cell and Organism Development 2.0)

Abstract

:
Membrane Attack Complex and Perforin (MACPF) proteins play crucial roles in plant development and plant responses to environmental stresses. To date, only four MACPF genes have been identified in Arabidopsis thaliana, and the functions of the MACPF gene family members in other plants, especially in important crop plants, such as the Poaceae family, remain largely unknown. In this study, we identified and analyzed 42 MACPF genes from six completely sequenced and well annotated species representing the major Poaceae clades. A phylogenetic analysis of MACPF genes resolved four groups, characterized by shared motif organizations and gene structures within each group. MACPF genes were unevenly distributed along the Poaceae chromosomes. Moreover, segmental duplications and dispersed duplication events may have played significant roles during MACPF gene family expansion and functional diversification in the Poaceae. In addition, phylogenomic synteny analysis revealed a high degree of conservation among the Poaceae MACPF genes. In particular, Group I, II, and III MACPF genes were exposed to strong purifying selection with different evolutionary rates. Temporal and spatial expression analyses suggested that Group III MACPF genes were highly expressed relative to the other groups. In addition, most MACPF genes were highly expressed in vegetative tissues and up-regulated by several biotic and abiotic stresses. Taken together, these findings provide valuable information for further functional characterization and phenotypic validation of the Poaceae MACPF gene family.

1. Introduction

The Membrane Attack Complex and Perforin (MACPF) protein family gets its name from a functional domain shared between proteins of the membrane attack complex (MAC) and perforin proteins in a variety of organisms [1]. Proteins of the MACPF family are structurally related to cholesterol-dependent cytolysins [2] and form pores in cellular membranes upon oligomerization [3,4]. MACPF proteins also share structural similarities to proteins of the complement system (C6, C7, C8α, C8β, and C9), which participate in an organism’s immune response to bacterial and viral infections [5].
High resolution X-ray crystallography structure analysis of Perforin, C8α, Plu-MACPF, and GNIP1Aa proteins revealed the mechanism of pore formation by MACPF proteins and the associated disruption of cell membranes [2,6,7,8]. The structures of several MACPF proteins have been resolved, highlighting a conserved core fold for MACPF oligomers, but also variation at the C-terminal domains in vertebrates, including a C2 domain in perforin, a thrombospondin type 1 domain in the complement component C8a, and Epidermal Growth Factor-like domain in complement component C9 [5].
Over the last two decades, several MACPF proteins have been shown to play key roles in animal development and immunity [7,9,10,11]. However, the function and molecular mechanism of MACPF proteins in plants is still poorly understood. To date, only CONSTITUTIVELY ACTIVATED CELL DEATH 1 (CAD1, also named NECROTIC SPOTTED LESIONS 2 or NSL2) and NSL1 in Arabidopsis (Arabidopsis thaliana) have been assigned functions in the regulation of the plant immune and salicylic acid (SA)-mediated defense signaling pathways, as well as in the transport of phenolic compounds to restrict fungal invasion [10,12,13,14,15,16].
NSL1 negatively regulates cell death and defense responses in Arabidopsis, as the nsl1 mutant exhibited retarded growth and developed spotted necrotic lesions on its leaves even in the absence of pathogens [12]. The nsl1 mutant accumulated high levels of SA, due to the activation of the SA pathway by a Trp-derived secondary metabolite in the mutant background [14]. These results all indicated that NSL1 plays critical roles in the repression of cell death. In addition, CAD1/NSL2 negatively regulated the expression of SA-related defense genes [10,13], and controlled systemic acquired resistance (SAR) by modulation of the hypersensitive response (HR) [16]. Two other Arabidopsis MACPF genes have been identified (At1g14780, At4g24290), but their functions remain unclear.
To date, many MACPF genes have been discovered in animals and fungi, but only four MACPF genes have been identified in Arabidopsis [10], while the functions of the MACPF gene family in other plants, especially in important crop plants such as Poaceae family members, remain largely unknown. The Poaceae family, formerly named Gramineae, comprises many monocotyledonous flowering plants and constitutes the most important source of food in the world, based on both production and dedicated arable land. With advances in sequencing technology, the complete genomes of many Poaceae species have been sequenced and well annotated, including rice (Oryza sativa) [17] and purple false brome (Brachypodium distachyon) [18], which belong to the BOP (Bambusoideae, Oryzoideae, Pooideae) clade, as well as maize (Zea mays) [19], sorghum (Sorghum bicolor) [20], foxtail millet (Setaria italica) [21], and resurrection grass (Oropetium thomaeum) [22] from the PACMAD (Panicoideae, Arundinoideae, Chloridoideae, Micrairoideae, Aristidoideae, Danthonioideae) clade. The completion of these Poaceae genomes opens the door for a systematic analysis of MACPF genes on a genomic scale. This systematic analysis will inform functional studies of this gene family across the Poaceae.
Here, we report on the full complement of MACPF genes in the Poaceae, with the identification of 42 MACPF genes, a description of their expression profiles and the domain organization of their encoded proteins. We categorized plant MACPF genes into four classes based on phylogeny, motif organization, and gene structure. We also analyzed the expansion of the MACPF gene family across genomes, which revealed that segmental duplications followed by purifying selection were the most important evolutionary driving forces in the Poaceae. Our detailed expression analysis showed that Poaceae MACPF genes were preferentially expressed in vegetative tissues, and induced in response to various environmental stresses. Our data provide a foundation for the study of Poaceae MACPF gene evolution as well as a useful resource for future functional validation of their roles during plant development and stress responses.

2. Results

2.1. Identification of MACPF Genes in Poaceae Genomes

We queried 15 selected plant genomes with the Pfam MACPF domain (PF01823) by a combination of Basic Local Alignment Tool for Protein (BLASTP) and HMMER searches. For this analysis, we selected species that represented the major clades of Poaceae and whose genomes were completely sequenced and well annotated. We also included non-Poaceae species for comparison, focusing our efforts on the genomes of four green algae (Ostreococcus tauri, Ostreococcus lucimarinus, Chlamydomonas reinhardtii, and Volvox carteri), one moss (Physcomitrium [Physcomitrella] patens), one spikemoss (Selaginella moellendorffii), two eudicots (Arabidopsis thaliana and grapevine [Vitis vinifera]), and six Poaceae (Oryza sativa, Zea mays, Sorghum bicolor, Brachypodium distachyon, Setaria italica, and Oropetium thomaeum; Table 1). We then filtered our candidate genes based on the presence of the MACPF domain, as detected by the Simple Modular Architecture Research Tool (SMART, http://smart.embl-heidelberg.de) and the Conserved Domains Database (CDD, https://www.ncbi.nlm.nih.gov/cdd/). Following this filtering step, we retained 57 sequences as putative MACPF genes, in addition to nine partial sequences from the spikemoss S. moellendorffii genome (Table 1). We failed to identify a single MACPF candidate gene in any of the aquatic green algae tested here. However, we did identify candidate MACPF genes in the moss and spikemoss genomes, which suggests that the MACPF protein domain may have appeared after the colonization of land by plants.
We identified six to nine MACPF genes in each Poaceae genome: six genes in the resurrection plant, seven in rice, nine in maize, seven in sorghum, six in purple false brome, and seven in foxtail millet (Table 1). We numbered all MACPF genes based on their chromosomal location and position (Table S1). Out of 42 Poaceae MACPF genes, 16 showed more than two transcript isoforms due to alternative splicing. In these cases, we chose the longest transcripts for further analysis.
The predicted MACPF proteins varied extensively in size, ranging from 406 to 1253 amino acids (Table S1). We determined their physical and chemical properties such as isoelectric point (pI) and molecular weight (MW) using the EXPASY database (http://www.expasy.org/) analysis. pI values varied from 6.38 to 9.48, most being greater than 7.0, indicating that most MACPF proteins are basic. However, resurrection grass OtMACPF5 and foxtail millet SiMACPF6 were acidic, as their pI values were below 7.0 (Table S1). In addition, the MW of MACPF proteins varied widely from 43.2 to 138.3 kDa.

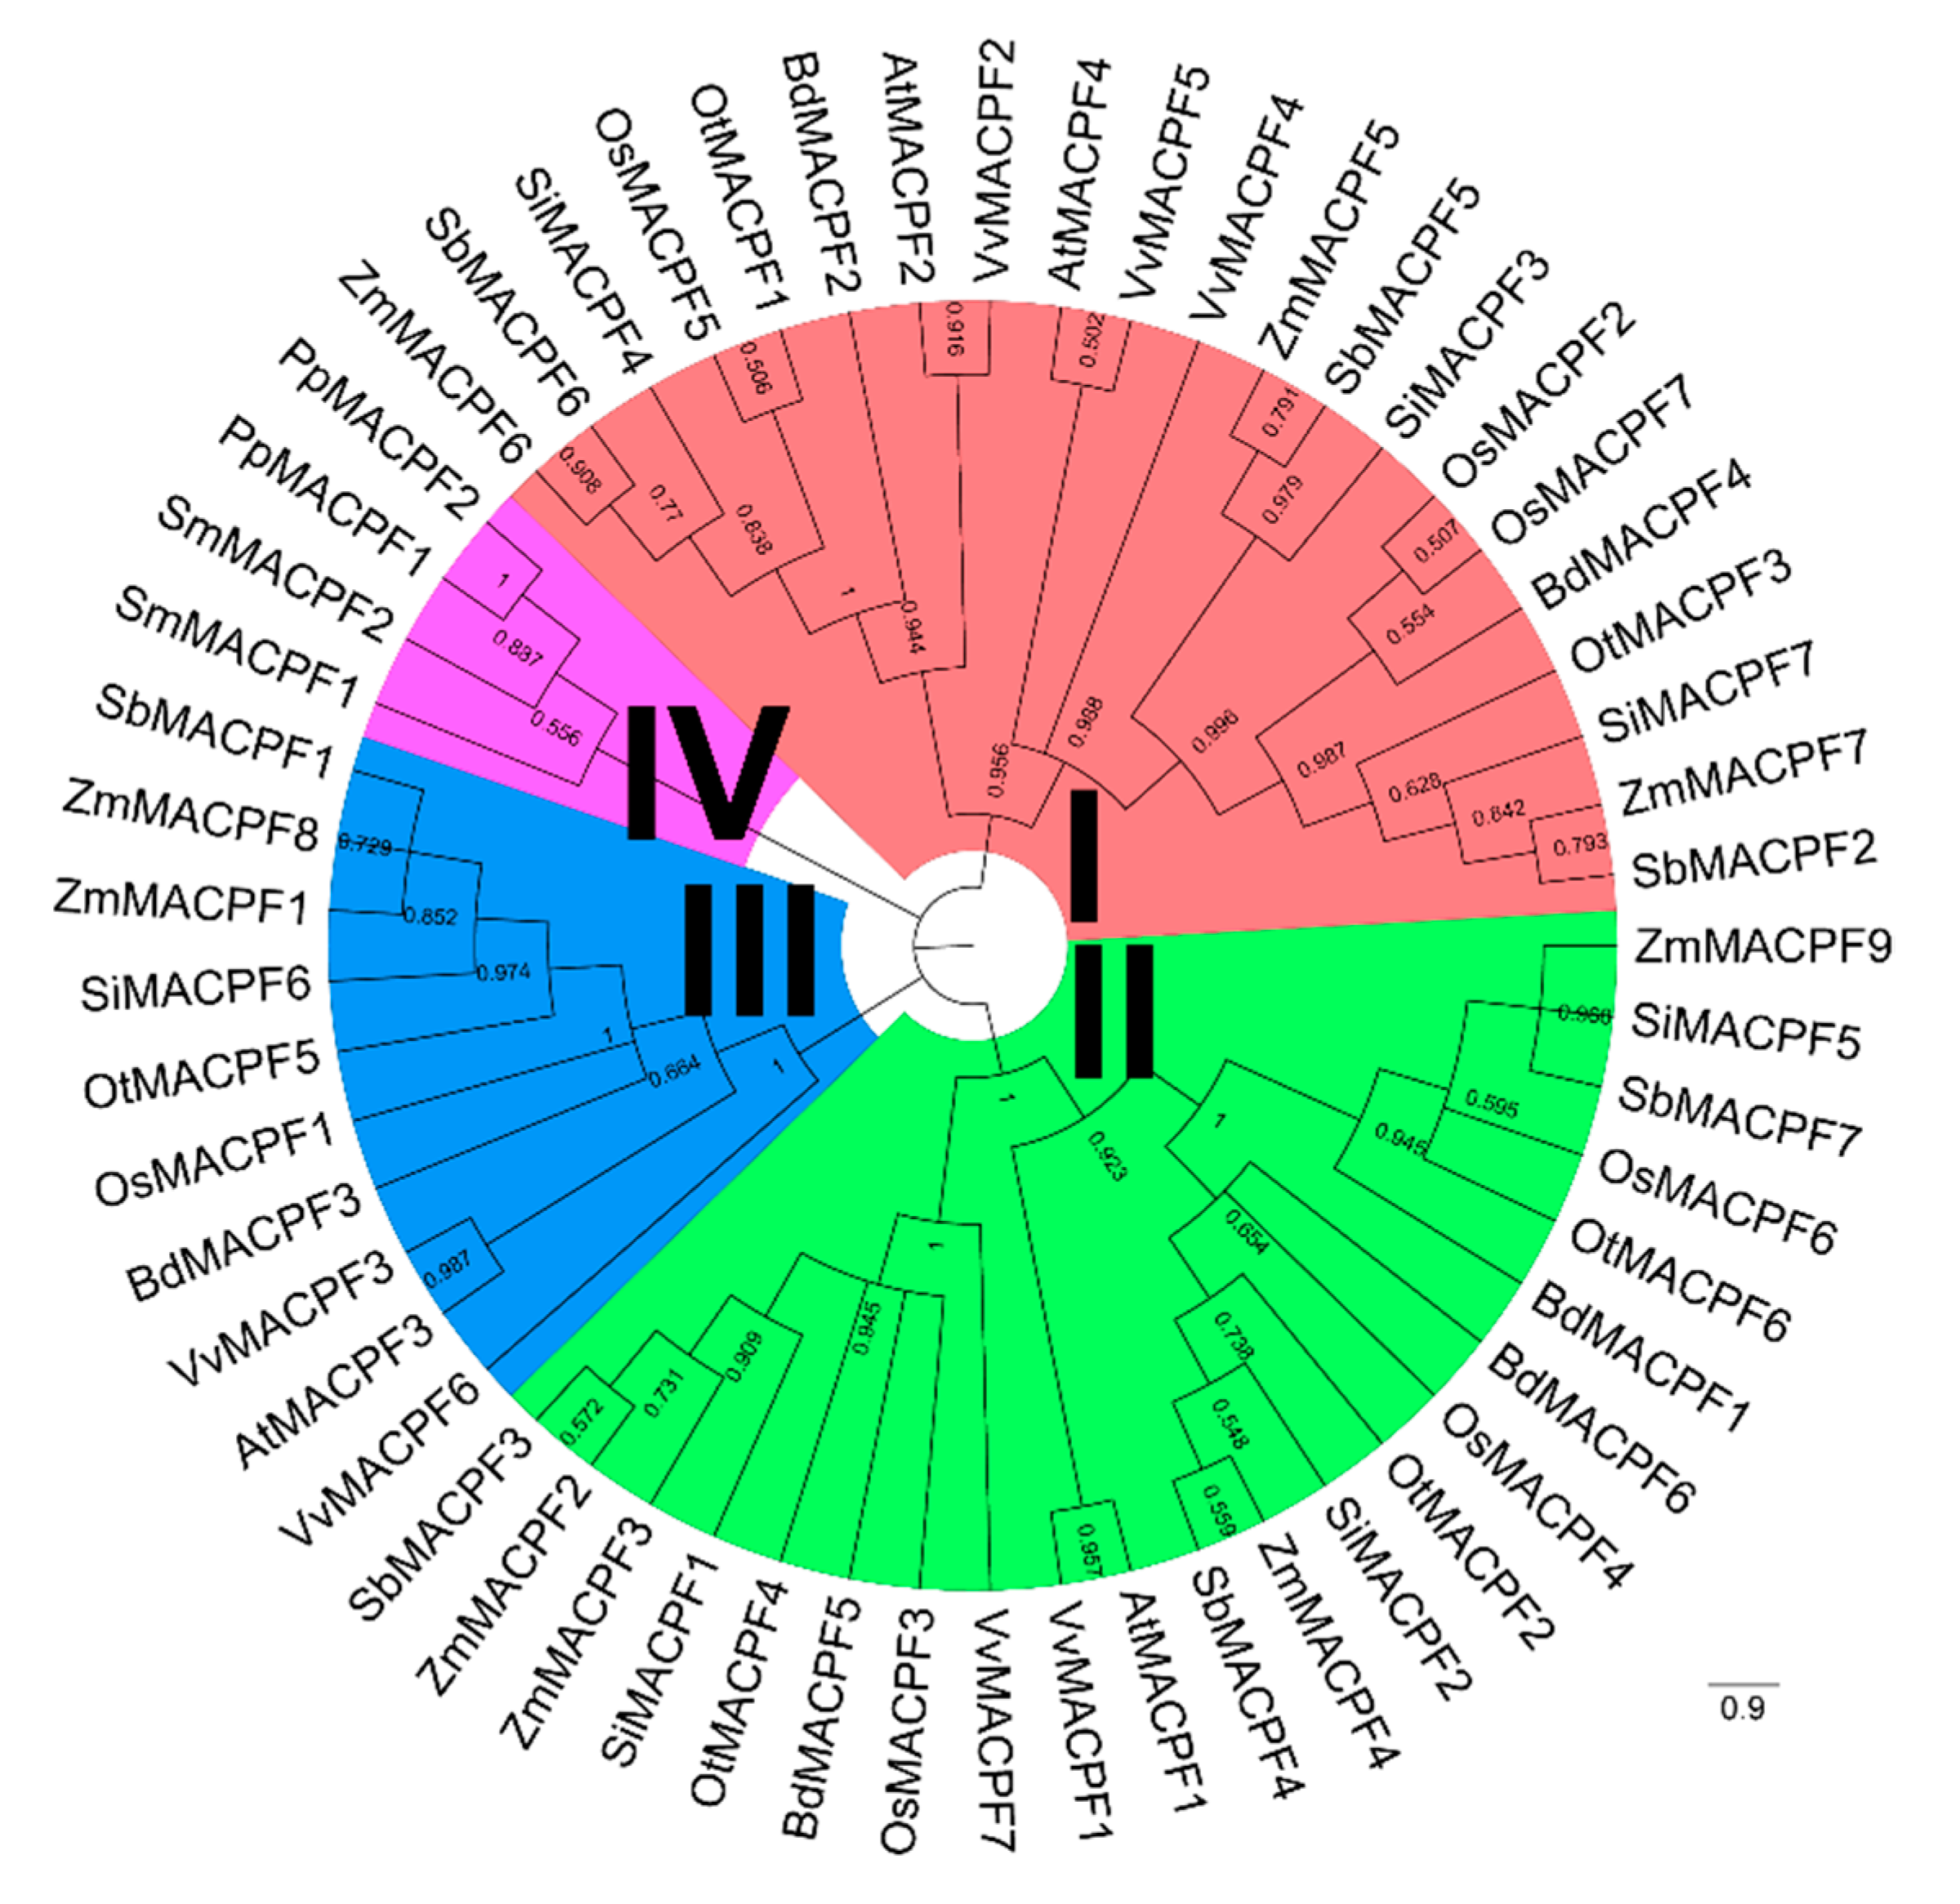
2.2. Phylogenetic and Structure Analysis

To explore the evolution of the plant MACPF family, we constructed a phylogenetic tree with the Maximum Likelihood method and Jones-Taylor-Thornton (JTT) + gamma distribution evolutionary rates (+G)+I model using the sequence of the MACPF domain (Figure 1). Based on the phylogenetic tree and the arrangement of functional domain in individual proteins, we classified the plant MACPF proteins into four groups (Groups I–IV), with bootstrap values of 95, 100, 100, and 55 bootstrap values, respectively (Figure 1). The intra-groups bootstrap values were much higher than the between-group values, supporting this classification. We also used BEAST software to estimate the timing of the divergence in the MAPCF gene family. BEAST predicted that Group I diverged the earliest, at an estimated 399.12 million years ago (MYA), and Group III diverged the latest, at 247.12 MYA (Figure S1).
Group IV consisted of two members from moss and two members from spikemoss, suggesting the existence of a bryophyte and lycophyte-specific lineage. The remaining three groups include MACPF members from all Poaceae species: Group I had 21 members and Group II had 22 members. Groups I and II therefore comprised the highest number of MACPF proteins, possibly arising from repeated gene duplications (Figure 1). Group I contained two to three MACPF members from each Poaceae species, while three to four MACPF members were represented per Poaceae species in Group II (Figure 1), suggesting that Group II may have undergone at least one additional round of MACPF gene expansion relative to Group I. MACPF members belonging to the BOP clade clustered together, as did candidates from the PACMAD clade (Figure 1). Moreover, segmental duplication events were the main cause of the increased number of MACPF members. Group I MACPF members expanded by dispersed duplication. Aside from two PACPF members in maize, Group III only contained one MACPF member from each Poaceae species, suggesting a gene expansion event specific to maize (Figure 1).
The phylogenetic tree largely agreed with the arrangement of 10 protein domains detected in plant MACPF proteins by the multiple EM for motif elicitation (MEME) tool. In addition, these domains shared high E-values, indicating that MACPF proteins were highly conserved across the species considered in this study (Figure 2a and Figure S2). All 57 plant MACPF proteins shared the same nine motifs, which were organized in the same order across all members (Figure 2a and Figure S2), consistent with the high degree of sequence conservation we observed. Interestingly, motif 5 was lost in the Group III Poaceae MACPF proteins, although it was retained in the eudicot Group III proteins (Figure 2a and Figure S2), suggesting a distinct evolutionary trajectory for monocot and eudicot members of Group III.
To better understand the structure of MACPF genes, we analyzed the exon–intron organization of the 57 MACPF genes using the GSDS website. In agreement with their shared protein motif organizations, most MACPF genes exhibited similar exon–intron structures and intron phases, especially within the same group (Figure S3). This analysis also showed that a regulatory untranslated region (5′ or 3′ untranslated region (UTR)) was predicted for 93% (53/57) of the MACPF genes, the exception being spikemoss PpMACPF1 and PpMACPF2, resurrection grass OtMACPF1, and purple false brome SiMACPF1 (Figure S3), highlighting the potential for multiple regulatory mechanisms among MACPF genes.

2.3. MACPF Gene Localization and Gene Duplication

We determined the genomic position of each gene to characterize the pattern of expansion of the MACPF gene family. We were able to anchor all 42 MACPF genes originating from a Poaceae species to a given chromosome, and observed that MACPF genes mapped to three–six chromosomes within each genome (Figure 2b).
Based on criteria for the identification of segmental duplications [23], we documented seven cases of MACPF gene pairs that likely arose from duplicated chromosomal segments in the selected Poaceae (Figure 2b). Of those, six MACPF pairs belonged to Group II (BdMACPF1/BdMACPF6, OsMACPF4/OsMACPF6, OtMACPF2/OtMACPF6, SiMACPF2/SiMACPF5, SbMACPF3/SbMACPF7, and ZmMACPF1/ZmMACPF8) (Figure 2b). The last segmental duplication pair belonged to Group III (ZmMACPF4/ZmMACPF9), (Figure 2b). No MACPF gene duplications fulfilled the tandem duplication criteria in the Poaceae, suggesting that the MACPF gene family expanded by segmental and dispersed duplications, rather than by tandem duplications (Figure 2b).
The Ka (non-synonymous distance), Ks (synonymous distance), and ω (Ka/Ks ratio) values are useful metrics to characterize gene evolution and selective pressure [24,25]. In general, values of ω >1, =1, and <1 indicates positive selection, neutral evolution, and purifying selection (also called negative selection) of the selected genes, respectively, according to the neutral theory [26]. To explore the selective pressure and functional diversification of segmental duplication genes, we evaluated ω values for the seven MACPF segmental duplicated gene pairs. This analysis revealed that all ω values were below 1 for all gene pairs, and were higher in Group II compared to those of Group III (Table S2), suggesting that segmentally duplicated MACPF genes evolved under purifying selection. Indeed, ω values ranged from 0.19 to 0.43 (Table S2) for gene pairs from Group II, compared with 0.15 for the maize gene pair from Group III (Table S2). We also calculated the average ω value of all MACPF genes belonging to each group: the mean ω value was 0.17 (Groups I), 0.24 (Group II), and 0.14 (Group III), all well below 1 (Figure 3a). The average Ka/Ks ratio of MACPF genes in Group II was the largest (Figure 3a), implying that Group II experienced more relaxation of purification than the other two groups. In addition, the Ka/Ks ratio was the smallest in Group III, suggesting a much stronger susceptibility to functional differentiation in Group III. We detected no positive selection among MACPF genes. The above results therefore implied that MACPF genes belonging to different groups faced varying degrees of purifying selection pressure during the expansion of this gene family.
We next determined the average ω values of MACPF paralogous pairs in each Poaceae species: they ranged from 0.27 to 0.31 and were therefore all less than 1 (Figure 3b), implying again that purifying selection may be the most important evolutionary driving force during MACPF gene expansion in the Poaceae. Purple false brome and maize had the smallest Ka/Ks ratios, indicating that maize MACPF genes were much more susceptible to functional differentiation during evolution. Rice showed the largest average Ka/Ks ratio (Figure 3b), suggesting that rice MACPF genes experienced more relaxation of purification than other five Poaceae. These results suggested similar selection forces in play between groups as well as within each Poaceae genome.

2.4. Synteny Analysis of the MACPF Gene Family in Poaceae

To examine the origin and evolutionary history of MACPF genes, we used the MCScanX software to determine the degree of synteny and collinearity relationship of MACPF genes across the Poaceae. Accordingly, we calculated synteny blocks for MACPF genes with MCScanX, setting the parameter of the e-value to <1 × 10⁻¹⁰ [27], followed by graphical representation using the TBtools software package [28].
We identified 40 orthologous MACPF gene pairs in Poaceae genomes, including seven blocks between purple false brome and rice, seven blocks between rice and maize, nine blocks between maize and sorghum, nine blocks between sorghum and foxtail millet, and eight blocks between foxtail millet and resurrection grass (Figure 4). The comparable number of MACPF orthologous gene pairs between Poaceae genomes is indicative of the higher level of evolutionary relationship of MACPF gene family members in the Poaceae. We only detected one orthologous gene pair (ZmMACPF6/SbMACPF4/SiMACPF4) shared across maize, sorghum and foxtail millet (Figure 4), suggesting a special MACPF evolution within the PACMAD clade.

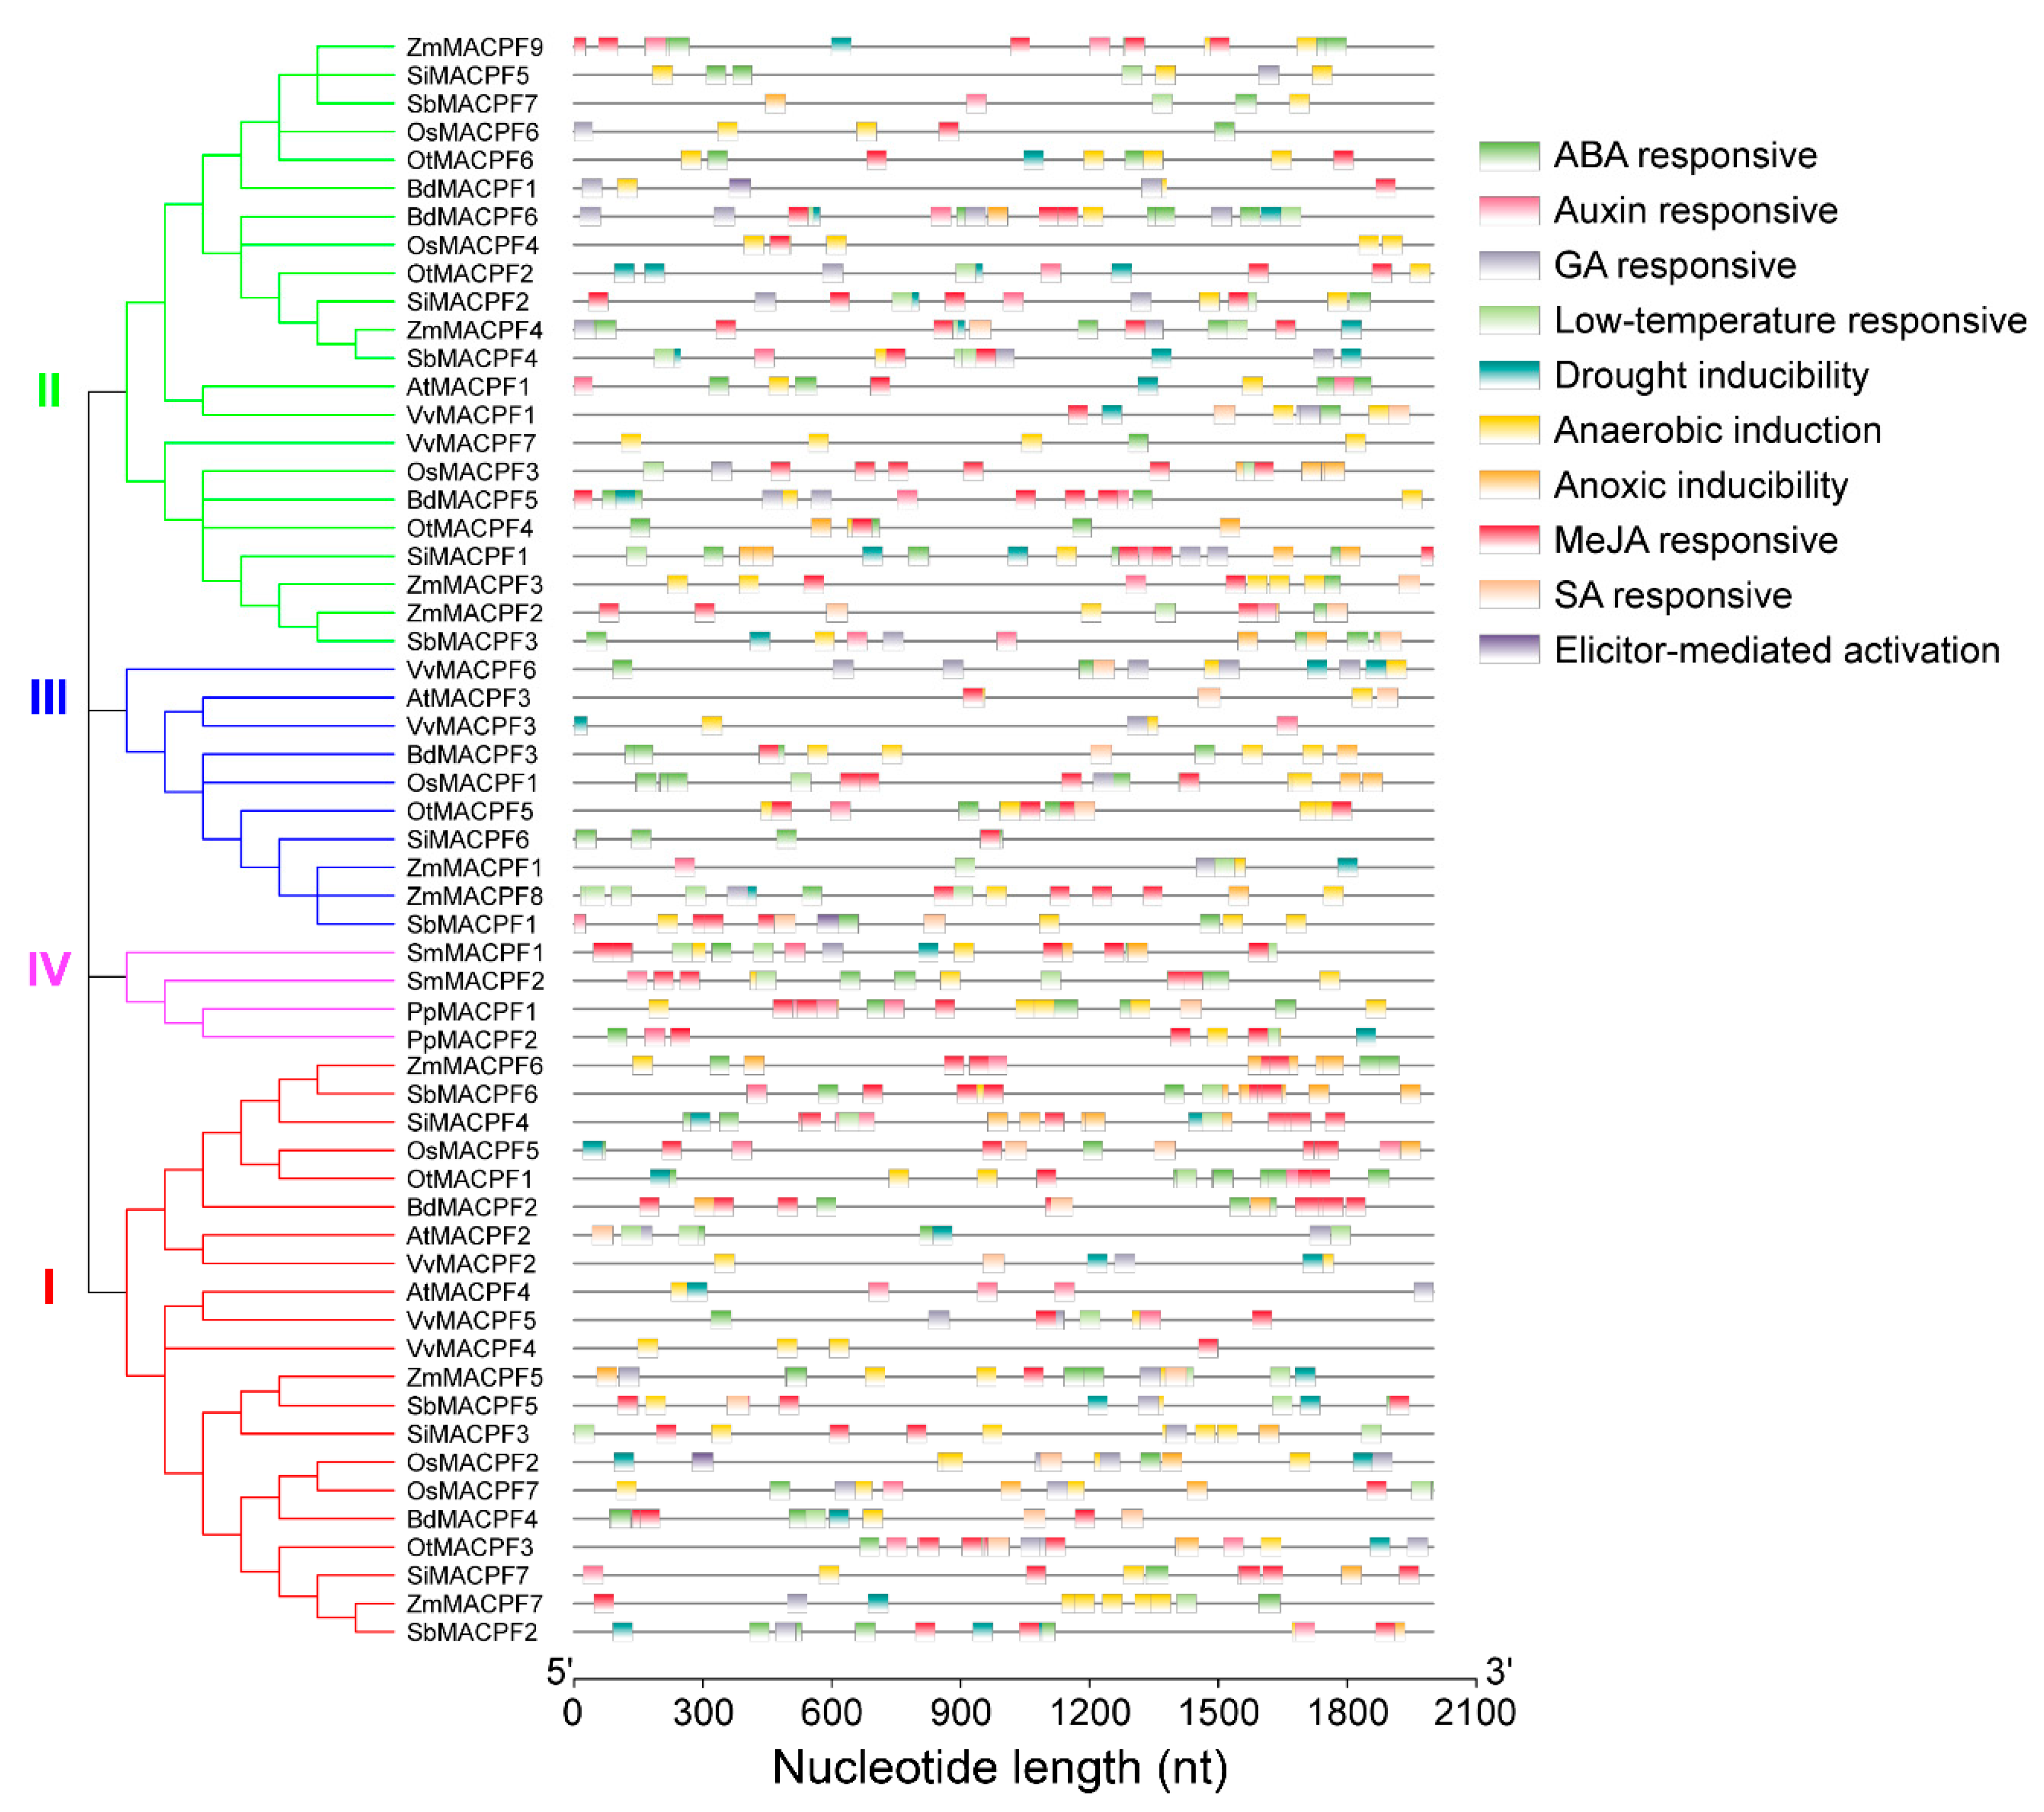
2.5. Analysis of Stress-Responsive cis-Regulatory Elements in MACPF Promoters

MACPF genes play important roles in defense response in plants and animals [2,14]. To discover cis-regulatory elements (CREs) relevant to stress responses such as abiotic and biotic stresses, we subjected 2 kb of sequence upstream of each Poaceae MACPF gene to analysis through the PlantCARE database. We identified 10 distinct cis-elements distributed over the length of each promoter region, classified into phytohormone-responsive (five elements), plant defense response-related, drought- or cold-responsive, related to anaerobic or anoxic stress (Figure 5). Our analysis did not include light-responsive elements in MACPF promoters, which was usually not associated with stress response. We identified 834 potential cis-regulatory elements across the 57 MACPF promoters (Figure 5). These elements included 161 putative ABREs (ABA-responsive elements) in 46 MACPF promoters (Figure 5), where they play a role in responses to salt and osmotic stress [29]. In addition, the promoters of 31 MACPF genes contained 48 putative MBSs (MYB binding sites), mediating drought stress responses, and the promoters of 28 MACPF genes contained 46 putative LTREs (low temperature responsive elements) (Figure 5), involved in responses to cold stress. Other putative motifs included 53 GARE (gibberellin-responsive) motifs in 32 MACPF promoters, and 167 putative anaerobic- or anoxic-related motifs (ARE and GC-motif), associated with anaerobic or low oxygen stress, in the promoters of 55 MACPF genes (Figure 5), suggesting that a subset of MACPF genes might be involved in anoxia responses.
In addition, we identified several biotic stress-related elements, such as AT-rich motif (TAAAATACT) in OsMACPF2, BdMACPF1, and SbMACPF1 (Figure 5), responsible for elicitor-mediated activation of plant defenses. The promoters of 47 MACPF genes contained 282 putative TGACG or CGTCA motifs responsible for methyl jasmonate (MeJA) responses (Figure 5). Finally, we found 26 putative TCA-element or SARE (SA-Responsive Element) motifs involved in SA responses in the promoters of 20 MACPF genes (Figure 5). These results strongly suggested that plant MACPF genes are likely involved in multiple stress responses.

2.6. Expression Profile of MACPF Genes in Poaceae

To explore the expression patterns of Poaceae MACPF genes across diverse developmental tissues and organs, we collected previously published RNA-Seq and microarray datasets available from the Gene Expression Omnibus (GEO) database, followed by analysis as previously described [30]. An examination of MACPF tissue expression patterns showed that genes belonging to Group III displayed higher transcript levels relative to genes from Group I and Group II in the Poaceae species purple false brome, rice, sorghum, foxtail millet, and maize (Figure 6a,b, and Figures S4–S6). In addition, most MACPF genes were highly expressed in vegetative tissues (root, shoot, leaf, stem, or node), when compared to reproductive tissues (inflorescence, flower, or seed) in the same Poaceae species (Figure 6 and Figures S4–S6), suggesting that MACPF genes may play important roles in vegetative organs and tissues. Further investigation indicated that rice OsMACPF2/5/7 in Group I, and OsMACPF3/4/6 in Group II (Figure S4a), as well as the segmental duplication pair BdMACPF1 and BdMACPF6 in purple false brome, were differently expressed in the selected samples (Figure S5), indicating functional differentiation within the OsMACPF groups. The foxtail millet genes SiMACPF4 and SiMACPF7 showed similar expression profiles, which were different from that of SiMACPF3 in Group I (Figure 6a), suggesting potential functional redundancy and differentiation inside the SiMACPF genes.
Sorghum SbMACPF2/5/6 in Group I, and SbMACPF3/4/7 in Group II were all expressed at high levels in the root (Figure 6b), suggestive of their potential functional redundancy. Maize ZmMACPF1 and ZmMACPF8, corresponding to a segmental duplication pair from Group III, similarly showed a similar expression profile, raising the possibility of their functional redundancy (Figure S6), while the maize ZmMACPF4 and ZmMACPF9 segmental duplication pair from Group II (Figure S6) showed distinct expression pattern, indicative of functional differentiation. Collectively, five segmental duplication pairs from MACPF Group II, showed the different expression pattern consistent with functional differentiation.

2.7. Involvement of MACPF Genes in Response to Stresses

Plants are continuously challenged by a multitude of stresses, including abiotic and biotic stimuli. Two Arabidopsis MACPF genes function in plant responses to stresses [10,12,13,15]. To determine whether MACPF genes were involved in stresses, we analyzed the expression pattern of Poaceae MACPF genes upon abiotic or biotic treatments. We explored publicly available data in the Gene Expression Omnibus (GEO) database [31,32,33,34,35], which compiles Poaceae gene expression data across multiple experiments. We observed that all seven OsMACPF genes were up-regulated upon jasmonic acid (JA) treatment in the shoots or roots (Figure 6c,d). In sorghum, SbMACPF7 was induced by abscisic acid in the shoot, (Figure S4b) and by high pH in the root (Figure S4c), respectively. As in sorghum, drought induced the expression of the rice genes OsMACPF1/2/3/4/6, and salt treatment increased transcript levels for the rice genes OsMACPF1/2/3, and the rice gene OsMACPF6 was itself induced by cold stimulus (Figure 6e). In the case of maize, nine ZmMACPF genes were induced by abiotic or biotic stresses (Figure 6f). ZmMACPF1/2/7/8 were up-regulated by cold stress, while ZmMACPF4 and ZmMACPF6 were induced during salt or drought stress, respectively (Figure 6f). Eight ZmMACPF genes were also highly induced at 24 and 48 h following inoculation with the fungus Colletotrichum graminicola (Figure 6f). These results suggest that Poaceae MACPF genes are involved in plant responses to abiotic and biotic stresses. The segmental duplication pairs OsMACPF4/OsMACPF6, SbMACPF3/SbMACPF7, and ZmMACPF4/ZmMACPF9 from Group II (Figure 6c–e and Figure S4b,c) showed distinct expression profiles upon exposure to various stresses, suggesting their functional differentiation. By contrast, the segmental duplication pair ZmMACPF1/ZmMACPF8 from Group III showed similar regulation after exposure to stress (Figure 6f), indicating their potential functional redundancy.

2.8. Expression of Rice MACPF Genes in Response to Jasmonic Acid Treatment

To further investigate the function of rice MACPF genes upon stress, we sprayed wild type Nipponbare rice plants with 100 μM MeJA. We collected leaves at 6, 12, and 24 h after treatment and extracted total RNA, which we then used as starting material for reverse-transcription and quantitative PCR (qRT-PCR) analysis of seven OsMACPF genes. Their transcript levels rose and peaked after 12 h. The marker gene OsMYC2 in the JA signaling pathway was induced over three-fold after the 12 h JA treatment (Figure 7). Similarly, the rice OsMACPF1/2/3/4/6/7 saw an increase in their transcript levels larger than two-fold upon MeJA treatment for 12 h (Figure 7), indicating that most OsMACPF were highly induced by JA treatment, and may therefore participate in plant responses to JA treatment.

3. Discussion

MACPF proteins perform a number of functions over the course of an organism’s development, as well as within multiple signaling pathways and in response to pathogen attacks in fungi and mammals [36,37,38]. To date, only the Arabidopsis MACPF gene family has been characterized in some detail [10]. Similar genomic information on the MACPF gene family is lacking in other plant species, especially in members of the Poaceae. Here, based on phylogenetic analysis, domain organization, and gene structure analysis, we combined evolution and expression profile analysis to explore the evolution and function of the MACPF family, which expands our understanding of MACPF proteins in the Poaceae.

3.1. The MACPF Gene Family is Conserved across Land Plants

Only a subset of Arabidopsis MACPF genes have been described and assigned a biological function [10]. By combining BLASTP searches with HMMER model analysis, we identified a total of 57 MACPF genes in 14 selected plant genomes, among which 42 mapped to Poaceae genomes. We failed to identify MACPF genes in green algae. The first occurrence of a MACPF gene was detected in the moss P. patens (Table 1), suggesting that the MACPF gene family evolved after the colonization of land by plants, making them a land plant-specific gene family.
MACPF genes varied from six to nine among the selected Poaceae, with no correlation between MACPF gene number and genome size (Table 1). For instance, rice and foxtail millet both contained seven MACPF genes, although the foxtail millet genome is roughly one third bigger than that of rice. The maize genome, with its 2.4 Gb size, is thought to have undergone one additional whole genome duplication event compared to other members of the Poaceae [39]. Accordingly, the maize genome contained the highest number of MACPF members, with two segmental duplication pairs (Figure 2b). In addition, there were comparable numbers of genes in Groups I, II, and III, indicating that the MACPF gene family may have followed very similar evolutionary directions in the Poaceae, with the exception of maize, which was also supported by its Ka/Ks ratio (Figure 3). More importantly, the high and consistent conservation of MACPF genes in the Poaceae is strongly supported by their similar gene lengths, their exon–intron structures, the deduced amino acid sequences of the proteins they encode, as well as their physical and chemical properties (pI and MW) and their functional motif organizations (Figure 1, Figure 2a, and Figure S3). These results indicate that MACPF family members are highly evolutionarily conserved. We hypothesize that they are essential for specific roles in development and during disease resistance across Poaceae species. The conserved motifs arrangement of functional domains among the MACPF groups indicates that the protein architecture is highly conserved, although their associated functions largely remain to be elucidated.
Alternative splicing has the potential to increase protein functional diversity for plant development and response to stresses [40,41]. Out of 42 Poaceae MACPF genes, 16 showed more than two gene models caused by alternative splicing, with the potential to diversify protein function in the face of stress conditions. Untranslated regions (UTRs) have been suggested to play important roles during the control of gene expression and mRNA translation, including efficiency and stability [42,43]. Our gene structure analysis showed that 90.4% (38/42) of Poaceae MACPF genes contained a 5′ or 3′ UTR, with the exception of SmMACPF1, SmMACPF2, OtMACPF1, and BdMACPF1 (Figure S3), indicating a wide range of potential mechanisms regulating MACPF genes. The results above suggest that the diversity of transcripts caused by alternative splicing and the presence/absence of 5′ and 3′ UTRs might increase protein diversity of the Poaceae MACPF gene family.

3.2. MACPF Duplications are an Important Feature Across the Poaceae

The 42 MACPF genes from Poaceae species were unevenly distributed across the Poaceae chromosomes, which is consistent with an ancient aneuploidy event in rice [44], in contrast to a whole genome duplication or polyploidization event. The chromosomal locations of MACPF genes indicated that MACPF genes largely do not cluster in Poaceae genomes (Figure 2b). An analysis of synteny and collinearity within and between Poaceae genomes revealed that MACPF genes expanded by segmental duplication, resulting in the scattered occurrence of MACPF genes across the genome [23]. Furthermore, we failed to detect tandem duplications, implying that segmental duplication played vital roles in MACPF gene family expansion. Segmental duplicated MACPF gene pairs belonged to the same group, which is consistent with previously identified duplication events in the Poaceae [45]. Paralogous MACPF genes, originating from segmental duplications, also showed similar exon–intron structures and belonged to the same subfamilies, with high bootstrapping values in the phylogenic analysis (Figure 1, Figure 2a, and Figure S3), indicating that there was no other domain addition or deletion during their evolution. Poaceae MACPF genes in Group I, II, and III, all had ω values below 1, suggesting that purifying selection was the main evolutionary driving force during MACPF gene family expansion in the Poaceae, as also described in other gene families [46].
Duplicated genes may experience sub-functionalization, neo-functionalization, or non-functionalization after gene duplication [47]. The maize segmental duplication pair ZmMACPF1 and ZmMACPF8, within Group III, displayed a similar expression profile (Figure S6), indicating potential functional redundancy. Six Poaceae segmental duplication gene pairs in Group II showed distinct expression patterns between duplicated MACPF genes (Figure 6 and Figures S4–S6), suggesting divergence and sub-functionalization of segmental duplicated genes during MACPF gene family expansion in the Poaceae.

3.3. MACPF Function and Gene Expression

When confronted with environmental stresses, plants initiate numerous physiological, biochemical, molecular, and cellular changes to acclimatize to the stress, including changes in gene expression [48]. Several MACPF genes have been reported to be involved in plant development and stress responses [10,12,15]. A re-analysis of available RNA-seq or microarray data provided support for these claims (Figure 6 and Figures S4–S6). Indeed, MACPF genes were preferentially expressed in vegetative tissues, suggesting that MACPF genes might play an important role at this developmental stage.
In this study, we identified 834 cis-regulatory elements within the promoters of MACPF genes (defined as the 2 kb upstream of the ATG), many representing adaptation-related elements, for example phytohormone- and stress-related motifs, indicating that MACPF genes may play critical roles in plant responses to environmental adaptations or within phytohormone signaling pathways, including abscisic acid, auxin, gibberellin, MeJA, and salicylic acid. Stress and phytohormone responses are strongly connected [43,49], which was reflected by our promoter analysis. Phytohormone or stress-related cis-regulatory elements were predominant across all promoters, indicating that MACPF genes may play important roles in plant response to stress.
Gene expression patterns in developmental stages and stress responses provided useful clues for gene function. Generally, Poaceae MACPF genes displayed different overlapping expression pattern in the selected samples (Figure 6 and Figure S4), suggesting that MACPF genes may play diverse and complex functions during plant development and responses to environmental stress in the Poaceae. Our experiment illustrated the strong induction of six OsMACPF genes upon MeJA treatment, which is consistent with the numerous MeJA-responsive elements identified in their promoters (Figure 5) as well as with the RiceXPro database (Figure 6c), suggesting that OsMACPF genes may take part in plant responses to environmental stimuli.

4. Materials and Methods

4.1. Data Retrieval of MACPF Genes

To uncover the entire MACPF gene family in Poaceae, we used four Arabidopsis MACPF genes [10] as query with the Basic Local Alignment Tool for Protein (BLASTP) method against sequenced representative genomes, with the E-value cutoff of 10−5. We searched the genomes of four chlorophytes (green algae, Ostreococcus tauri, Ostreococcus lucimarinus [50], Chlamydomonas reinhardtii [51], and Volvox carteri [52]), bryophyte moss (Physcomitrium [Physcomitrella] patens) [53], spikemoss (Selaginella moellendorffii) [54], eudicots Arabidopsis thaliana, and Vitis vinifera [55]. We also performed the same search against the genomes of monocots with completely sequenced and well annotated genomes, belonging to the BOP (Bambusoideae, Oryzoideae, Pooideae) clade within the Poaceae, which includes Oryza sativa [17] and Brachypodium distachyon [18], and the PACMAD (Panicoideae, Arundinoideae, Chloridoideae, Micrairoideae, Aristidoideae, Danthonioideae) clade, including Zea mays [19], Sorghum bicolor [20], Setaria italica [21], and Oropetium thomaeum [22]. In addition, we downloaded the corresponding Pfam entry (PF01823) for the MAC/Perforin domain from the Pfam database [56] and used it as a seed to identify MACPF candidates in the selected genomes listed above, as well as in the publicly available Ensembl Plants [57] and Phytozome databases [58], with the aid of the HMMER 3.0 software [59], using the E-value cutoff of 10−5, as described previously [60]. We further examined candidate MACPF proteins thus identified for the presence of a complete MACPF domain by running them through the SMART [61], CDD [62], InterProscan [63], and Pfam [56] databases, which look for conserved functional domains.

4.2. Gene Exon–Intron Structure Predictions

We determined the predicted exon–intron organization (structure) by using the Gene Structure Display Server (GSDS 2.0) [64], and illustrated the results with TBtools [28].

4.3. Analysis of Domain Combinations and Architecture of MACPF Promoters and MACPF Proteins

We employed the protein databases SMART [61], InterProscan [63] and MEME (multiple EM for motif elicitation) [65] to characterize the complement of functional domains detected for all individual MACPF proteins. In addition, we retrieved MACPF promoters, defined as the 2000 bp upstream of the respective coding regions, and submitted them to the PlantCARE database [66] (http://bioinformatics.psb.ugent.be/webtools/plantcare/html) to identify putative cis-regulatory elements.

4.4. Phylogenetic Analysis

We performed an alignment of the catalytic domains of all MACPF proteins with ClustalX 2.0 [67] using the following parameters: BLOSUM 30 for the protein weight matrix, and gap extension penalty set to the default. We then constructed the corresponding phylogenetic tree of MACPF catalytic domains using MEGA X [68] with the maximum likelihood method (ML). The ML method included parameters from the Jones-Taylor-Thornton (JTT) model and Gamma distribution evolutionary rates (+G), which was considered as the most suitable substitution pattern estimated by maximum likelihood evaluation of 56 different amino acid substitution models (Table S3), pairwise deletions and 1000 bootstraps to estimate branch support. We used the FigTree software (http://tree.bio.ed.ac.uk/software/figtree/) to visualize the phylogenic tree. In addition, we used BEAST [69] to date the internal nodes of the plant MACPF phylogenetic tree.

4.5. Duplication Events and Synteny Analysis of MACPF Genes in the Poaceae

We used MCScanX [27] to identify intragenomic (evidence of whole-genome duplications) and intergenomic (between related species) syntenic blocks within the Poaceae, using default parameters. We also conducted a segmental duplication analysis of all MACPF genes, by expanding the analysis to the 10 genes flanking each MACPF gene [23]. We visualized and illustrated the results with the Tbtools software package [28], which connects segmental duplication genes by links.

4.6. Gene Expression Analysis

We explored the tissue- and stress-specific expression pattern of MACPF genes in the Poaceae by re-analyzing previously published deep sequencing of the transcriptome (RNA-seq) or microarray expression datasets for rice (GSE6901) [31], sorghum (GSE50464) [32], foxtail millet (GSE36391) [33], maize (bar.utoronto.ca/efp_maize) [34], and purple false brome (E-MTAB-5491) [35]. We selected differentially expressed genes with an absolute fold-change of at least 2 relative to the control samples and used the R software to cluster gene expression values based on Z scores as previously described [30].

4.7. RNA Extraction and Quantitative RT-PCR

Rice seedlings for the cultivar Nipponbare, grown in a greenhouse under 28/23 °C (day/night), and a photoperiod of 10-h light/14-h darkness, were sprayed at the four-leaf stage with 100 μM MeJA (Sigma-Aldrich, St. Louis, MO, USA) and then the seedlings were collected for RNA extraction after 6, 12, and 24 h. We performed qRT-PCR (quantitative reverse transcription PCR) as described [70,71]. Primers used in this study are listed in Table S4. OsACTIN was selected as the internal control, with OsMYC2 as the MeJA response marker gene.

5. Conclusions

Here, we characterized the full complement of MACPF genes in six representative Poaceae genomes, for a total of 42 MACPF genes showing uneven distribution across the chromosomes. The plant MACPF genes clustered into four groups based on phylogenetic data, domain organization, motif composition, and gene structure. Intra-genome synteny analysis indicated that segmental duplication played important roles during MACPF gene family expansion. Inter-genome collinearity analysis revealed 40 MACPF orthologous gene pairs. ω value calculation indicated that the most important evolutionary driving force of the MACPF gene family expansion was purifying selection in Poaceae. Our comprehensive analysis revealed that several Poaceae MACPF genes may play significant roles during plant vegetative growth and environmental stresses adaptation. These results provide new understanding of MACPF gene evolution, and constitute a useful resource for further functional characterization of Poaceae MACPF genes during development and stress adaptation.

Supplementary Materials

Supplementary materials can be found at https://www.mdpi.com/1422-0067/21/16/5736/s1.

Author Contributions

Conceptualization, L.Y., S.X. and Q.C.; Data curation, L.Y., D.L., S.C., Y.D., W.G., X.Z., L.W., S.M., M.X., and H.Q.; Funding acquisition, L.Y., S.X. and Q.C.; Investigation, L.Y., D.L. and S.C.; Writing—original draft, L.Y.; Writing—review & editing, L.Y., S.X., and Q.C. All authors have read and agree to the published version of the manuscript.

Funding

This research was funded by the National Natural Science Foundation of China (Projects 31870237, 31725004, 31670276, 31800217, and 31800232), and National Key R&D Program of China (Project 2016YFD0400103), and the Natural Science Foundation of Guangdong Province, China (Project 2017A030308008), and the China Postdoctoral Science Foundation (Project 2018M633232).

Conflicts of Interest

The authors declare no conflict of interest.

Abbreviations

ABAAbscisic acid
ABREABA-responsive element
ASAlternative splicing
BdBrachypodium distachyon
CAD1Constitutively activated cell death 1
GAGibberellin
GSDSGene Structure Display Server
HMMHidden Markov model
KaNon-synonymous distance
KsSynonymous distance
LTRELow temperature responsive element
MACMembrane attack complex
MACPFMembrane Attack Complex and Perforin
MBSMYB binding site
MeJAMethyl jasmonate
MEMEMultiple EM for motif elicitation
MW Molecular weight
NSL1Necrotic spotted lesions 1
NSL2Necrotic spotted lesions 2
OsOryza sativa
OtOropetium thomaeum
pIIsoelectric point
PpPhyscomitrium (Physcomitrella) patens
qRT-PCRQuantitative reverse transcription PCR
SASalicylic acid
SbSorghum bicolor
SiSetaria italica
SmSelaginella moellendorffii
ZmZea mays

References

  1. Tschopp, J.; Masson, D.; Stanley, K.K. Structural/functional similarity between proteins involved in complement- and cytotoxic T-lymphocyte-mediated cytolysis. Nature 1986, 322, 831–834. [Google Scholar] [CrossRef] [PubMed]
  2. Rosado, C.J.; Buckle, A.M.; Law, R.H.; Butcher, R.E.; Kan, W.T.; Bird, C.H.; Ung, K.; Browne, K.A.; Baran, K.; Bashtannyk-Puhalovich, T.A.; et al. A common fold mediates vertebrate defense and bacterial attack. Science 2007, 317, 1548–1551. [Google Scholar] [CrossRef] [PubMed] [Green Version]
  3. Moreno-Hagelsieb, G.; Vitug, B.; Medrano-Soto, A.; Saier, M.H., Jr. The Membrane Attack Complex/Perforin Superfamily. J. Mol. Microb. Biotech. 2017, 27, 252–267. [Google Scholar] [CrossRef] [PubMed] [Green Version]
  4. Lukoyanova, N.; Hoogenboom, B.W.; Saibil, H.R. The membrane attack complex, perforin and cholesterol-dependent cytolysin superfamily of pore-forming proteins. J. Cell Sci. 2016, 129, 2125–2133. [Google Scholar] [CrossRef] [PubMed] [Green Version]
  5. Rosado, C.J.; Kondos, S.; Bull, T.E.; Kuiper, M.J.; Law, R.H.; Buckle, A.M.; Voskoboinik, I.; Bird, P.I.; Trapani, J.A.; Whisstock, J.C.; et al. The MACPF/CDC family of pore-forming toxins. Cell. Microbiol. 2008, 10, 1765–1774. [Google Scholar] [CrossRef] [Green Version]
  6. Zaitseva, J.; Vaknin, D.; Krebs, C.; Doroghazi, J.; Milam, S.L.; Balasubramanian, D.; Duck, N.B.; Freigang, J. Structure-function characterization of an insecticidal protein GNIP1Aa, a member of an MACPF and beta-tripod families. Proc. Natl. Acad. Sci. USA 2019, 116, 2897–2906. [Google Scholar] [CrossRef] [Green Version]
  7. Hadders, M.A.; Beringer, D.X.; Gros, P. Structure of C8α-MACPF reveals mechanism of membrane attack in complement immune defense. Science 2007, 317, 1552–1554. [Google Scholar] [CrossRef]
  8. Law, R.H.; Lukoyanova, N.; Voskoboinik, I.; Caradoc-Davies, T.T.; Baran, K.; Dunstone, M.A.; D’Angelo, M.E.; Orlova, E.V.; Coulibaly, F.; Verschoor, S.; et al. The structural basis for membrane binding and pore formation by lymphocyte perforin. Nature 2010, 468, 447–451. [Google Scholar] [CrossRef]
  9. Trapani, J.A.; Smyth, M.J. Functional significance of the perforin/granzyme cell death pathway. Nat. Rev. Immunol. 2002, 2, 735–747. [Google Scholar] [CrossRef]
  10. Morita-Yamamuro, C.; Tsutsui, T.; Sato, M.; Yoshioka, H.; Tamaoki, M.; Ogawa, D.; Matsuura, H.; Yoshihara, T.; Ikeda, A.; Uyeda, I.; et al. The Arabidopsis gene CAD1 controls programmed cell death in the plant immune system and encodes a protein containing a MACPF domain. Plant Cell Physiol. 2005, 46, 902–912. [Google Scholar] [CrossRef] [Green Version]
  11. Esser, A.F. The membrane attack complex of complement. Assembly, structure and cytotoxic activity. Toxicology 1994, 87, 229–247. [Google Scholar] [CrossRef]
  12. Noutoshi, Y.; Kuromori, T.; Wada, T.; Hirayama, T.; Kamiya, A.; Imura, Y.; Yasuda, M.; Nakashita, H.; Shirasu, K.; Shinozaki, K. Loss of Necrotic Spotted Lesions 1 associates with cell death and defense responses in Arabidopsis thaliana. Plant Mol. Biol. 2006, 62, 29–42. [Google Scholar] [CrossRef] [PubMed]
  13. Tsutsui, T.; Morita-Yamamuro, C.; Asada, Y.; Minami, E.; Shibuya, N.; Ikeda, A.; Yamaguchi, J. Salicylic acid and a chitin elicitor both control expression of the CAD1 gene involved in the plant immunity of Arabidopsis. Biosci. Biotech. Biochem. 2006, 70, 2042–2048. [Google Scholar] [CrossRef] [PubMed] [Green Version]
  14. Fukunaga, S.; Sogame, M.; Hata, M.; Singkaravanit-Ogawa, S.; Pislewska-Bednarek, M.; Onozawa-Komori, M.; Nishiuchi, T.; Hiruma, K.; Saitoh, H.; Terauchi, R.; et al. Dysfunction of Arabidopsis MACPF domain protein activates programmed cell death via tryptophan metabolism in MAMP-triggered immunity. Plant J. 2017, 89, 381–393. [Google Scholar] [CrossRef] [PubMed]
  15. Chen, T.; Nomura, K.; Wang, X.; Sohrabi, R.; Xu, J.; Yao, L.; Paasch, B.C.; Ma, L.; Kremer, J.; Cheng, Y.; et al. A plant genetic network for preventing dysbiosis in the phyllosphere. Nature 2020, 580, 653–657. [Google Scholar] [CrossRef]
  16. Asada, Y.; Yamamoto, M.; Tsutsui, T.; Yamaguchi, J. The Arabidopsis NSL2 negatively controls systemic acquired resistance via hypersensitive response. Plant Biotechnol. 2011, 28, 9–15. [Google Scholar] [CrossRef] [Green Version]
  17. Project, International Rice Genome Sequencing. The map-based sequence of the rice genome. Nature 2005, 436, 793–800. [Google Scholar] [CrossRef]
  18. International Brachypodium Initiative. Genome sequencing and analysis of the model grass Brachypodium distachyon. Nature 2010, 463, 763–768. [Google Scholar] [CrossRef]
  19. Schnable, P.S.; Ware, D.; Fulton, R.S.; Stein, J.C.; Wei, F.; Pasternak, S.; Liang, C.; Zhang, J.; Fulton, L.; Graves, T.A.; et al. The B73 maize genome: Complexity, diversity, and dynamics. Science 2009, 326, 1112–1115. [Google Scholar] [CrossRef] [Green Version]
  20. Paterson, A.H.; Bowers, J.E.; Bruggmann, R.; Dubchak, I.; Grimwood, J.; Gundlach, H.; Haberer, G.; Hellsten, U.; Mitros, T.; Poliakov, A.; et al. The Sorghum bicolor genome and the diversification of grasses. Nature 2009, 457, 551–556. [Google Scholar] [CrossRef] [Green Version]
  21. Bennetzen, J.L.; Schmutz, J.; Wang, H.; Percifield, R.; Hawkins, J.; Pontaroli, A.C.; Estep, M.; Feng, L.; Vaughn, J.N.; Grimwood, J.; et al. Reference genome sequence of the model plant Setaria. Nat. Biotechnol. 2012, 30, 555–561. [Google Scholar] [CrossRef] [PubMed] [Green Version]
  22. VanBuren, R.; Bryant, D.; Edger, P.P.; Tang, H.; Burgess, D.; Challabathula, D.; Spittle, K.; Hall, R.; Gu, J.; Lyons, E.; et al. Single-molecule sequencing of the desiccation-tolerant grass Oropetium thomaeum. Nature 2015, 527, 508–511. [Google Scholar] [CrossRef] [PubMed] [Green Version]
  23. Schauser, L.; Wieloch, W.; Stougaard, J. Evolution of NIN-Like proteins in Arabidopsis, rice, and Lotus japonicus. J. Mol. Evol. 2005, 60, 229–237. [Google Scholar] [CrossRef] [PubMed]
  24. Akhunov, E.D.; Sehgal, S.; Liang, H.; Wang, S.; Akhunova, A.R.; Kaur, G.; Li, W.; Forrest, K.L.; See, D.; Simkova, H.; et al. Comparative analysis of syntenic genes in grass genomes reveals accelerated rates of gene structure and coding sequence evolution in polyploid wheat. Plant Physiol. 2013, 161, 252–265. [Google Scholar] [CrossRef] [Green Version]
  25. Hurst, L.D. The Ka/Ks ratio: Diagnosing the form of sequence evolution. TRENDS Genet. 2002, 18, 486–487. [Google Scholar] [CrossRef]
  26. Nei, M. The new mutation theory of phenotypic evolution. Proc. Natl. Acad. Sci. USA 2007, 104, 12235–12242. [Google Scholar] [CrossRef] [Green Version]
  27. Wang, Y.; Tang, H.; Debarry, J.D.; Tan, X.; Li, J.; Wang, X.; Lee, T.H.; Jin, H.; Marler, B.; Guo, H.; et al. MCScanX: A toolkit for detection and evolutionary analysis of gene synteny and collinearity. Nucleic Acids Res. 2012, 40, e49. [Google Scholar] [CrossRef] [Green Version]
  28. Chen, C.; Chen, H.; Zhang, Y.; Thomas, H.R.; Frank, M.H.; He, Y.; Xia, R. TBtools—An integrative toolkit developed for interactive analyses of big biological data. Mol. Plant 2020. [Google Scholar] [CrossRef]
  29. Wang, W.; Chen, Q.; Xu, S.; Liu, W.C.; Zhu, X.; Song, C.P. Trehalose-6-phosphate phosphatase E modulates ABA-controlled root growth and stomatal movement in Arabidopsis. J. Integr. Plant Biol. 2020. [Google Scholar] [CrossRef] [Green Version]
  30. Yu, L.J.; Luo, Y.F.; Liao, B.; Xie, L.J.; Chen, L.; Xiao, S.; Li, J.T.; Hu, S.N.; Shu, W.S. Comparative transcriptome analysis of transporters, phytohormone and lipid metabolism pathways in response to arsenic stress in rice (Oryza sativa). New Phytol. 2012, 195, 97–112. [Google Scholar] [CrossRef]
  31. Jain, M.; Nijhawan, A.; Arora, R.; Agarwal, P.; Ray, S.; Sharma, P.; Kapoor, S.; Tyagi, A.K.; Khurana, J.P. F-box proteins in rice. Genome-wide analysis, classification, temporal and spatial gene expression during panicle and seed development, and regulation by light and abiotic stress. Plant Physiol. 2007, 143, 1467–1483. [Google Scholar] [CrossRef] [PubMed] [Green Version]
  32. Olson, A.; Klein, R.R.; Dugas, D.V.; Lu, Z.Y.; Regulski, M.; Klein, P.E.; Ware, D. Expanding and Vetting Sorghum bicolor Gene Annotations through Transcriptome and Methylome Sequencing. Plant Genome 2014, 7. [Google Scholar] [CrossRef]
  33. Zhang, G.; Liu, X.; Quan, Z.; Cheng, S.; Xu, X.; Pan, S.; Xie, M.; Zeng, P.; Yue, Z.; Wang, W.; et al. Genome sequence of foxtail millet (Setaria italica) provides insights into grass evolution and biofuel potential. Nat. Biotechnol. 2012, 30, 549–554. [Google Scholar] [CrossRef] [PubMed] [Green Version]
  34. Hoopes, G.M.; Hamilton, J.P.; Wood, J.C.; Esteban, E.; Pasha, A.; Vaillancourt, B.; Provart, N.J.; Buell, C.R. An updated gene atlas for maize reveals organ-specific and stress-induced genes. Plant J. 2019, 97, 1154–1167. [Google Scholar] [CrossRef] [Green Version]
  35. Sibout, R.; Proost, S.; Hansen, B.O.; Vaid, N.; Giorgi, F.M.; Ho-Yue-Kuang, S.; Legee, F.; Cezart, L.; Bouchabke-Coussa, O.; Soulhat, C.; et al. Expression atlas and comparative coexpression network analyses reveal important genes involved in the formation of lignified cell wall in Brachypodium distachyon. New Phytol. 2017, 215, 1009–1025. [Google Scholar] [CrossRef] [Green Version]
  36. Ota, K.; Butala, M.; Viero, G.; Dalla Serra, M.; Sepcic, K.; Macek, P. Fungal MACPF-like proteins and aegerolysins: Bi-component pore-forming proteins? Subcell. Biochem. 2014, 80, 271–291. [Google Scholar] [CrossRef]
  37. Kondos, S.C.; Hatfaludi, T.; Voskoboinik, I.; Trapani, J.A.; Law, R.H.; Whisstock, J.C.; Dunstone, M.A. The structure and function of mammalian membrane-attack complex/perforin-like proteins. Tissue Antigens 2010, 76, 341–351. [Google Scholar] [CrossRef]
  38. Wade, K.R.; Tweten, R.K. The Apicomplexan CDC/MACPF-like pore-forming proteins. Curr. Opin. Microbiol. 2015, 26, 48–52. [Google Scholar] [CrossRef] [PubMed] [Green Version]
  39. Swigonova, Z.; Lai, J.; Ma, J.; Ramakrishna, W.; Llaca, V.; Bennetzen, J.L.; Messing, J. Close split of sorghum and maize genome progenitors. Genome Res. 2004, 14, 1916–1923. [Google Scholar] [CrossRef] [Green Version]
  40. Staiger, D.; Brown, J.W.S. Alternative Splicing at the Intersection of Biological Timing, Development, and Stress Responses. Plant Cell 2013, 25, 3640–3656. [Google Scholar] [CrossRef] [Green Version]
  41. Reddy, A.S.N.; Marquez, Y.; Kalyna, M.; Barta, A. Complexity of the Alternative Splicing Landscape in Plants. Plant Cell 2013, 25, 3657–3683. [Google Scholar] [CrossRef] [PubMed] [Green Version]
  42. Bashirullah, A.; Cooperstock, R.L.; Lipshitz, H.D. Spatial and temporal control of RNA stability. Proc. Natl. Acad. Sci. USA 2001, 98, 7025–7028. [Google Scholar] [CrossRef] [PubMed] [Green Version]
  43. Kang, C.; Sun, F.; Yan, L.; Li, R.; Bai, J.; Caetano-Anolles, G. Genome-Wide Identification and Characterization of the Vacuolar H+-ATPase Subunit H Gene Family in Crop Plants. Int. J. Mol. Sci. 2019, 20, 5125. [Google Scholar] [CrossRef] [Green Version]
  44. Vandepoele, K.; Simillion, C.; Van de Peer, Y. Evidence that rice and other cereals are ancient aneuploids. Plant Cell 2003, 15, 2192–2202. [Google Scholar] [CrossRef]
  45. Yu, J.; Wang, J.; Lin, W.; Li, S.; Li, H.; Zhou, J.; Ni, P.; Dong, W.; Hu, S.; Zeng, C.; et al. The Genomes of Oryza sativa: A history of duplications. PLoS Biol. 2005, 3, e38. [Google Scholar] [CrossRef] [PubMed] [Green Version]
  46. Kong, W.; Zhang, Y.; Deng, X.; Li, S.; Zhang, C.; Li, Y. Comparative Genomic and Transcriptomic Analysis Suggests the Evolutionary Dynamic of GH3 Genes in Gramineae Crops. Front. Plant Sci. 2019, 10, 1297. [Google Scholar] [CrossRef] [Green Version]
  47. Taylor, J.S.; Raes, J. Duplication and divergence: The evolution of new genes and old ideas. Annu. Rev. Genet. 2004, 38, 615–643. [Google Scholar] [CrossRef] [Green Version]
  48. Hirayama, T.; Shinozaki, K. Research on plant abiotic stress responses in the post-genome era: Past, present and future. Plant J. 2010, 61, 1041–1052. [Google Scholar] [CrossRef]
  49. Blazquez, M.A.; Nelson, D.C.; Weijers, D. Evolution of Plant Hormone Response Pathways. Annu. Rev. Plant Biol. 2020, 71, 327–353. [Google Scholar] [CrossRef]
  50. Palenik, B.; Grimwood, J.; Aerts, A.; Rouze, P.; Salamov, A.; Putnam, N.; Dupont, C.; Jorgensen, R.; Derelle, E.; Rombauts, S.; et al. The tiny eukaryote Ostreococcus provides genomic insights into the paradox of plankton speciation. Proc. Natl. Acad. Sci. USA 2007, 104, 7705–7710. [Google Scholar] [CrossRef] [Green Version]
  51. Merchant, S.S.; Prochnik, S.E.; Vallon, O.; Harris, E.H.; Karpowicz, S.J.; Witman, G.B.; Terry, A.; Salamov, A.; Fritz-Laylin, L.K.; Marechal-Drouard, L.; et al. The Chlamydomonas genome reveals the evolution of key animal and plant functions. Science 2007, 318, 245–250. [Google Scholar] [CrossRef] [PubMed] [Green Version]
  52. Prochnik, S.E.; Umen, J.; Nedelcu, A.M.; Hallmann, A.; Miller, S.M.; Nishii, I.; Ferris, P.; Kuo, A.; Mitros, T.; Fritz-Laylin, L.K.; et al. Genomic analysis of organismal complexity in the multicellular green alga Volvox carteri. Science 2010, 329, 223–226. [Google Scholar] [CrossRef] [PubMed] [Green Version]
  53. Rensing, S.A.; Lang, D.; Zimmer, A.D.; Terry, A.; Salamov, A.; Shapiro, H.; Nishiyama, T.; Perroud, P.F.; Lindquist, E.A.; Kamisugi, Y.; et al. The Physcomitrella genome reveals evolutionary insights into the conquest of land by plants. Science 2008, 319, 64–69. [Google Scholar] [CrossRef] [PubMed] [Green Version]
  54. Banks, J.A.; Nishiyama, T.; Hasebe, M.; Bowman, J.L.; Gribskov, M.; dePamphilis, C.; Albert, V.A.; Aono, N.; Aoyama, T.; Ambrose, B.A.; et al. The Selaginella genome identifies genetic changes associated with the evolution of vascular plants. Science 2011, 332, 960–963. [Google Scholar] [CrossRef] [PubMed] [Green Version]
  55. Jaillon, O.; Aury, J.M.; Noel, B.; Policriti, A.; Clepet, C.; Casagrande, A.; Choisne, N.; Aubourg, S.; Vitulo, N.; Jubin, C.; et al. The grapevine genome sequence suggests ancestral hexaploidization in major angiosperm phyla. Nature 2007, 449, 463–467. [Google Scholar] [CrossRef]
  56. Finn, R.D.; Mistry, J.; Schuster-Bockler, B.; Griffiths-Jones, S.; Hollich, V.; Lassmann, T.; Moxon, S.; Marshall, M.; Khanna, A.; Durbin, R.; et al. Pfam: Clans, web tools and services. Nucleic Acids Res. 2006, 34, D247–D251. [Google Scholar] [CrossRef] [Green Version]
  57. Kersey, P.J.; Allen, J.E.; Christensen, M.; Davis, P.; Falin, L.J.; Grabmueller, C.; Hughes, D.S.; Humphrey, J.; Kerhornou, A.; Khobova, J.; et al. Ensembl Genomes 2013: Scaling up access to genome-wide data. Nucleic Acids Res. 2014, 42, D546–D552. [Google Scholar] [CrossRef] [Green Version]
  58. Goodstein, D.M.; Shu, S.; Howson, R.; Neupane, R.; Hayes, R.D.; Fazo, J.; Mitros, T.; Dirks, W.; Hellsten, U.; Putnam, N.; et al. Phytozome: A comparative platform for green plant genomics. Nucleic Acids Res. 2012, 40, D1178–D1186. [Google Scholar] [CrossRef]
  59. Mistry, J.; Finn, R.D.; Eddy, S.R.; Bateman, A.; Punta, M. Challenges in homology search: HMMER3 and convergent evolution of coiled-coil regions. Nucleic Acids Res. 2013, 41, e121. [Google Scholar] [CrossRef] [Green Version]
  60. Yu, L.J.; Feng, D.R.; Li, W.Y.; Wang, H.B.; Wang, J.F.; Liu, B. Comprehensive and evolutionary analysis of protein tyrosine phosphatases (PTP) in the green plants. Plant Omics 2013, 6, 215–223. [Google Scholar]
  61. Letunic, I.; Bork, P. 20 years of the SMART protein domain annotation resource. Nucleic Acids Res. 2018, 46, D493–D496. [Google Scholar] [CrossRef] [PubMed]
  62. Lu, S.; Wang, J.; Chitsaz, F.; Derbyshire, M.K.; Geer, R.C.; Gonzales, N.R.; Gwadz, M.; Hurwitz, D.I.; Marchler, G.H.; Song, J.S.; et al. CDD/SPARCLE: The conserved domain database in 2020. Nucleic Acids Res. 2020, 48, D265–D268. [Google Scholar] [CrossRef] [PubMed] [Green Version]
  63. Quevillon, E.; Silventoinen, V.; Pillai, S.; Harte, N.; Mulder, N.; Apweiler, R.; Lopez, R. InterProScan: Protein domains identifier. Nucleic Acids Res. 2005, 33, W116–W120. [Google Scholar] [CrossRef] [PubMed] [Green Version]
  64. Hu, B.; Jin, J.; Guo, A.Y.; Zhang, H.; Luo, J.; Gao, G. GSDS 2.0: An upgraded gene feature visualization server. Bioinformatics 2015, 31, 1296–1297. [Google Scholar] [CrossRef] [PubMed] [Green Version]
  65. Bailey, T.L.; Boden, M.; Buske, F.A.; Frith, M.; Grant, C.E.; Clementi, L.; Ren, J.; Li, W.W.; Noble, W.S. MEME SUITE: Tools for motif discovery and searching. Nucleic Acids Res. 2009, 37, W202–W208. [Google Scholar] [CrossRef]
  66. Lescot, M.; Dehais, P.; Thijs, G.; Marchal, K.; Moreau, Y.; Van de Peer, Y.; Rouze, P.; Rombauts, S. PlantCARE, a database of plant cis-acting regulatory elements and a portal to tools for in silico analysis of promoter sequences. Nucleic Acids Res. 2002, 30, 325–327. [Google Scholar] [CrossRef]
  67. Larkin, M.A.; Blackshields, G.; Brown, N.P.; Chenna, R.; McGettigan, P.A.; McWilliam, H.; Valentin, F.; Wallace, I.M.; Wilm, A.; Lopez, R.; et al. Clustal W and Clustal X version 2.0. Bioinformatics 2007, 23, 2947–2948. [Google Scholar] [CrossRef] [Green Version]
  68. Kumar, S.; Stecher, G.; Li, M.; Knyaz, C.; Tamura, K. MEGA X: Molecular Evolutionary Genetics Analysis across Computing Platforms. Mol. Biol. Evol. 2018, 35, 1547–1549. [Google Scholar] [CrossRef]
  69. Suchard, M.A.; Lemey, P.; Baele, G.; Ayres, D.L.; Drummond, A.J.; Rambaut, A. Bayesian phylogenetic and phylodynamic data integration using BEAST 1.10. Virus Evol. 2018, 4, vey016. [Google Scholar] [CrossRef] [Green Version]
  70. Yu, L.J.; Chen, F.; Peng, Y.J.; Xie, L.J.; Liu, D.; Han, M.Q.; Chen, F.; Xiao, S.; Huang, J.C.; Li, J. Arabidopsis thaliana Plants Engineered to Produce Astaxanthin Show Enhanced Oxidative Stress Tolerance and Bacterial Pathogen Resistance. J. Agric. Food Chem. 2019, 67, 12590–12598. [Google Scholar] [CrossRef]
  71. Zhou, Y.; Tan, W.J.; Xie, L.J.; Qi, H.; Yang, Y.C.; Huang, L.P.; Lai, Y.X.; Tan, Y.F.; Zhou, D.M.; Yu, L.J.; et al. Polyunsaturated linolenoyl-CoA modulates ERF-VII-mediated hypoxia signaling in Arabidopsis. J. Integr. Plant Biol. 2020, 62, 330–348. [Google Scholar] [CrossRef] [PubMed] [Green Version]
Figure 1. Phylogenetic relationships of 57 plant Membrane Attack Complex and Perforin (MACPF) proteins. We constructed a phylogenetic tree of the MACPF family with the MEGA X software package, with Maximum Likelihood method and Jones-Taylor-Thornton (JTT) + gamma distribution evolutionary rates (+G)+I model, using the MACPF catalytic domain encoded by the selected Poaceae genomes. MACPF proteins were classified into four distinct groups, as indicated by the different colors. We visualized the phylogenetic tree with the FigTree software.
Ijms 21 05736 g001
Figure 2. Schematic representation of conserved motifs and segmental duplication analysis. (a) Left: phylogenetic tree of the MACPF family replotted from Figure 1. Right: conserved motif compositions of plant MACPF proteins, predicted by MEME suite. Each of the 10 conserved motifs are represented by color bars. (b) Poaceae MACPF genes were mapped to the chromosomes of Brachypodium distachyon, Oryza sativa, Zea mays, Sorghum bicolor, Setaria italica, and Oropetium thomaeum. MACPF genes were numbered according to their position on the chromosomes. Segmental duplications of MACPF gene pairs are connected by red lines.
Ijms 21 05736 g002
Figure 3. The ω (Ka/Ks ratio) value of MACPF genes in Poaceae genomes. Distribution of Ka/Ks values were obtained from pairwise comparisons within Groups I, II and III (a), and within each Poaceae genome (b). The Y-axis denotes Ka/Ks ratios of MACPF genes for each pair. Boxplots were generated in R.
Ijms 21 05736 g003
Figure 4. Chromosomal synteny and collinearity analysis of MACPF genes across the Poaceae. Putative orthologous genes among Poaceae genomes are connected by lines using the MCScanX software. Red triangles represent MACPF genes in Brachypodium distachyon, Oryza sativa, Zea mays, Sorghum bicolor, Setaria italica, and Oropetium thomaeum. Blue solid lines represent collinearity relationships of orthologous MACPF gene pairs.
Ijms 21 05736 g004
Figure 5. Promoter analysis of MACPF genes in the Poaceae. Left: phylogenetic tree of the MACPF family, replotted from Figure 1. Right: regulatory elements of the MACPF promoters, as predicted by the PlantCARE database. cis-regulatory elements in the promoter regions are indicated as different colored-blocks.
Ijms 21 05736 g005
Figure 6. Expression patterns of MACPF genes in development and response to stress. Tissue-specific expression patterns of MACPF genes in sorghum (a) and foxtail millet (b), were obtained from previously published data. Red and green colors represent higher and lower expression, respectively. Sorghum samples: root, shoot, VM (vegetative meristem) of the vegetative tissues, and FM (floral meristem), flowers, embryos of reproductive tissues. Foxtail millet samples: root, stem, leaf of the vegetative tissues, and spica (tassel) of the reproductive tissues. Expression profile of MACPF genes under abiotic and biotic treatments were obtained from previously published data. Expression profile of OsMACPF genes under methyl jasmonate (MeJA) treatment in rice shoots (c) and roots (d). (e) Expression profile of OsMACPF genes during drought, salt and cold stress. (f) Expression profile of ZmMACPF genes during cold, heat, salt, drought stress, and Colletotrichum graminicola (Cg) infection. Heatmaps were drawn in R. Red and green colors represent higher and lower expression genes in different tissues or exposed to the stresses, respectively.
Ijms 21 05736 g006
Figure 7. Expression profile of OsMACPF genes upon MeJA treatment. Quantitative reverse transcription PCR (qRT-PCR) analysis of OsMACPF1-7 genes after JA treatment for 6, 12, and 24 h. Rice plants at the four-leaf stage were sprayed with 100 μM MeJA. They were placed in a greenhouse 28/23 °C (light/dark), light period 10 h light/14 h darkness. OsMYC2 was the positive control for MeJA treatment. Transcript levels were normalized using OsACTIN as the internal reference. Each data point represents the average of three biological repeats. * p < 0.05; ** p < 0.01 by Student’s t-test.
Ijms 21 05736 g007
Table 1. Numbers of MACPF genes in selected plants.
PlantCladeGenome Size (Mb)Total Group I Group II Group III Group IV
Green alga (Ostreococcus tauri) Chlorophytes12.5600000
Green alga (Ostreococcus lucimarinus) Chlorophytes13.200000
Green alga (Chlamydomonas reinhardtii)Chlorophytes12000000
Green alga (Volvox carteri)Chlorophytes13800000
Moss (Physcomitrium [Physcomitrella] patens) Bryophytes47220002
Spikemoss (Selaginella moellendorffii) Lycophytes10020002
Eudicot (Arabidopsis thaliana) Eudicots13542110
Eudicot (Vitis vinifera) Eudicots50073220
Monocot (Brachypodium distachyon)Monocots35562310
Monocot (Oryza sativa) Monocots37073310
Monocot (Zea mays) Monocots240093420
Monocot (Sorghum bicolor) Monocots73073310
Monocot (Setaria italica) Monocots49073310
Monocot (Oropetium thomaeum)Monocots24562310
Total--572122104

