The Effects of Antipsychotics on the Synaptic Plasticity Gene Homer1a Depend on a Combination of Their Receptor Profile, Dose, Duration of Treatment, and Brain Regions Targeted

 ,
, 
Abstract
:
1. Introduction
2. Results
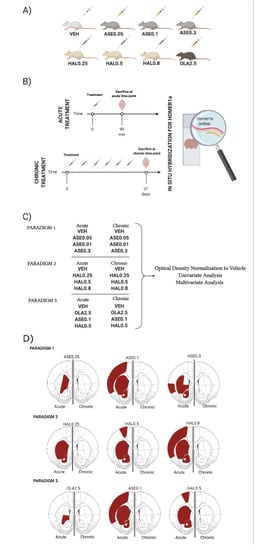
2.1. Paradigm 1
2.1.1. Striatum
2.1.2. Cortex
2.2. Paradigm 2
2.2.1. Striatum
2.2.2. Cortex
2.3. Paradigm 3
2.3.1. Striatum
2.3.2. Cortex
3. Discussion
4. Materials and Methods
4.1. Animals and Drug Treatments
4.2. Study Design and Drug Treatment
4.3. In Situ Hybridization
4.4. Statistical Analysis
Supplementary Materials
Author Contributions
Funding
Acknowledgments
Conflicts of Interest
References
- Lieberman, J.A.; First, M.B. Psychotic Disorders. N. Engl. J. Med. 2018, 379, 270–280. [Google Scholar] [CrossRef]
- Sahlholm, K.; Zeberg, H.; Nilsson, J.; Ogren, S.O.; Fuxe, K.; Arhem, P. The fast-off hypothesis revisited: A functional kinetic study of antipsychotic antagonism of the dopamine D2 receptor. Eur. Neuropsychopharmacol. 2016, 26, 467–476. [Google Scholar] [CrossRef]
- De Bartolomeis, A.; Iasevoli, F.; Marmo, F.; Buonaguro, E.F.; Eramo, A.; Rossi, R.; Avvisati, L.; Latte, G.; Tomasetti, C. Progressive recruitment of cortical and striatal regions by inducible postsynaptic density transcripts after increasing doses of antipsychotics with different receptor profiles: Insights for psychosis treatment. Eur. Neuropsychopharmacol. 2015, 25, 566–582. [Google Scholar] [CrossRef]
- Groos, D.; Zheng, F.; Rauh, M.; Quinger, B.; Kornhuber, J.; Muller, C.P.; Alzheimer, C. Chronic antipsychotic treatment targets GIRK current suppression, loss of long-term synaptic depression and behavioural sensitization in a mouse model of amphetamine psychosis. J. Psychopharmacol. 2018, 33, 74–85. [Google Scholar] [CrossRef] [PubMed]
- De Bartolomeis, A.; Latte, G.; Tomasetti, C.; Iasevoli, F. Glutamatergic postsynaptic density protein dysfunctions in synaptic plasticity and dendritic spines morphology: Relevance to schizophrenia and other behavioral disorders pathophysiology, and implications for novel therapeutic approaches. Mol. Neurobiol. 2014, 49, 484–511. [Google Scholar] [CrossRef] [PubMed]
- Iasevoli, F.; Tomasetti, C.; Buonaguro, E.F.; De Bartolomeis, A. The glutamatergic aspects of schizophrenia molecular pathophysiology: Role of the postsynaptic density, and implications for treatment. Curr. Neuropharmacol. 2014, 12, 219–238. [Google Scholar] [CrossRef] [PubMed] [Green Version]
- Borovac, J.; Bosch, M.; Okamoto, K. Regulation of actin dynamics during structural plasticity of dendritic spines: Signaling messengers and actin-binding proteins. Mol. Cell. Neurosci. 2018, 91, 122–130. [Google Scholar] [CrossRef] [PubMed]
- Kaizuka, T.; Takumi, T. Postsynaptic density proteins and their involvement in neurodevelopmental disorders. J. Biochem. 2018, 163, 447–455. [Google Scholar] [CrossRef] [PubMed]
- De Bartolomeis, A.; Buonaguro, E.F.; Latte, G.; Rossi, R.; Marmo, F.; Iasevoli, F.; Tomasetti, C. Immediate-Early Genes Modulation by Antipsychotics: Translational Implications for a Putative Gateway to Drug-Induced Long-Term Brain Changes. Front. Behav. Neurosci. 2017, 11, 240. [Google Scholar] [CrossRef] [Green Version]
- Iasevoli, F.; Tomasetti, C.; Ambesi-Impiombato, A.; Muscettola, G.; De Bartolomeis, A. Dopamine receptor subtypes contribution to Homer1a induction: Insights into antipsychotic molecular action. Prog. Neuropsychopharmacol. Biol. Psychiatry 2009, 33, 813–821. [Google Scholar] [CrossRef]
- Iasevoli, F.; Buonaguro, E.F.; Sarappa, C.; Marmo, F.; Latte, G.; Rossi, R.; Eramo, A.; Tomasetti, C.; De Bartolomeis, A. Regulation of postsynaptic plasticity genes’ expression and topography by sustained dopamine perturbation and modulation by acute memantine: Relevance to schizophrenia. Prog. Neuropsychopharmacol. Biol. Psychiatry 2014, 54, 299–314. [Google Scholar] [CrossRef] [PubMed]
- Buonaguro, E.F.; Iasevoli, F.; Marmo, F.; Eramo, A.; Latte, G.; Avagliano, C.; Tomasetti, C.; De Bartolomeis, A. Re-arrangements of gene transcripts at glutamatergic synapses after prolonged treatments with antipsychotics: A putative link with synaptic remodeling. Prog. Neuropsychopharmacol. Biol. Psychiatry 2017, 76, 29–41. [Google Scholar] [CrossRef] [PubMed]
- Meyer, D.; Bonhoeffer, T.; Scheuss, V. Balance and stability of synaptic structures during synaptic plasticity. Neuron 2014, 82, 430–443. [Google Scholar] [CrossRef] [PubMed] [Green Version]
- Leber, S.L.; Llenos, I.C.; Miller, C.L.; Dulay, J.R.; Haybaeck, J.; Weis, S. Homer1a protein expression in schizophrenia, bipolar disorder, and major depression. J. Neural Transm. 2017, 124, 1261–1273. [Google Scholar] [CrossRef] [PubMed]
- Spellmann, I.; Rujescu, D.; Musil, R.; Mayr, A.; Giegling, I.; Genius, J.; Zill, P.; Dehning, S.; Opgen-Rhein, M.; Cerovecki, A.; et al. Homer-1 polymorphisms are associated with psychopathology and response to treatment in schizophrenic patients. J. Psychiatr. Res. 2011, 45, 234–241. [Google Scholar] [CrossRef] [PubMed]
- Szumlinski, K.K.; Lominac, K.D.; Kleschen, M.J.; Oleson, E.B.; Dehoff, M.H.; Schwarz, M.K.; Seeburg, P.H.; Worley, P.F.; Kalivas, P.W. Behavioral and neurochemical phenotyping of Homer1 mutant mice: Possible relevance to schizophrenia. Genes Brain Behav. 2005, 4, 273–288. [Google Scholar] [CrossRef]
- Serchov, T.; Clement, H.W.; Schwarz, M.K.; Iasevoli, F.; Tosh, D.K.; Idzko, M.; Jacobson, K.A.; De Bartolomeis, A.; Normann, C.; Biber, K.; et al. Increased Signaling via Adenosine A1 Receptors, Sleep Deprivation, Imipramine, and Ketamine Inhibit Depressive-like Behavior via Induction of Homer1a. Neuron 2015, 87, 549–562. [Google Scholar] [CrossRef] [Green Version]
- Serchov, T.; Schwarz, I.; Theiss, A.; Sun, L.; Holz, A.; Dobrossy, M.D.; Schwarz, M.K.; Normann, C.; Biber, K.; Van Calker, D. Enhanced adenosine A1 receptor and Homer1a expression in hippocampus modulates the resilience to stress-induced depression-like behavior. Neuropharmacology 2020, 162, 107834. [Google Scholar] [CrossRef]
- Mereu, M.; Contarini, G.; Buonaguro, E.F.; Latte, G.; Manago, F.; Iasevoli, F.; De Bartolomeis, A.; Papaleo, F. Dopamine transporter (DAT) genetic hypofunction in mice produces alterations consistent with ADHD but not schizophrenia or bipolar disorder. Neuropharmacology 2017, 121, 179–194. [Google Scholar] [CrossRef]
- Lum, J.S.; Pan, B.; Deng, C.; Huang, X.F.; Ooi, L.; Newell, K.A. Effects of short- and long-term aripiprazole treatment on Group I mGluRs in the nucleus accumbens: Comparison with haloperidol. Psychiatry Res. 2018, 260, 152–157. [Google Scholar] [CrossRef]
- Clifton, N.E.; Cameron, D.; Trent, S.; Sykes, L.H.; Thomas, K.L.; Hall, J. Hippocampal Regulation of Postsynaptic Density Homer1 by Associative Learning. Neural Plast. 2017, 2017, 5959182. [Google Scholar] [CrossRef] [PubMed] [Green Version]
- Datko, M.C.; Hu, J.H.; Williams, M.; Reyes, C.M.; Lominac, K.D.; Von Jonquieres, G.; Klugmann, M.; Worley, P.F.; Szumlinski, K.K. Behavioral and Neurochemical Phenotyping of Mice Incapable of Homer1a Induction. Front. Behav. Neurosci. 2017, 11, 208. [Google Scholar] [CrossRef] [PubMed] [Green Version]
- Buonaguro, E.F.; Morley-Fletcher, S.; Avagliano, C.; Vellucci, L.; Iasevoli, F.; Bouwalerh, H.; Van Camp, G.; Nicoletti, F.; Maccari, S.; De Bartolomeis, A. Glutamatergic postsynaptic density in early life stress programming: Topographic gene expression of mGlu5 receptors and Homer proteins. Prog. Neuropsychopharmacol. Biol. Psychiatry 2020, 96, 109725. [Google Scholar] [CrossRef] [PubMed]
- Iasevoli, F.; Polese, D.; Ambesi-Impiombato, A.; Muscettola, G.; De Bartolomeis, A. Ketamine-related expression of glutamatergic postsynaptic density genes: Possible implications in psychosis. Neurosci. Lett. 2007, 416, 1–5. [Google Scholar] [CrossRef] [PubMed]
- De Bartolomeis, A.; Errico, F.; Aceto, G.; Tomasetti, C.; Usiello, A.; Iasevoli, F. D-aspartate dysregulation in Ddo(−/−) mice modulates phencyclidine-induced gene expression changes of postsynaptic density molecules in cortex and striatum. Prog. Neuropsychopharmacol. Biol. Psychiatry 2015, 62, 35–43. [Google Scholar] [CrossRef] [PubMed]
- Clifton, N.E.; Trent, S.; Thomas, K.L.; Hall, J. Regulation and Function of Activity-Dependent Homer in Synaptic Plasticity. Mol. Neuropsychiatry 2019, 5, 147–161. [Google Scholar] [CrossRef]
- De Bartolomeis, A.; Tomasetti, C. Calcium-dependent networks in dopamine-glutamate interaction: The role of postsynaptic scaffolding proteins. Mol. Neurobiol. 2012, 46, 275–296. [Google Scholar] [CrossRef] [Green Version]
- Kammermeier, P.J. Surface clustering of metabotropic glutamate receptor 1 induced by long Homer proteins. BMC Neurosci. 2006, 7, 1. [Google Scholar] [CrossRef] [Green Version]
- Shiraishi-Yamaguchi, Y.; Furuichi, T. The Homer family proteins. Genome Biol. 2007, 8, 206. [Google Scholar] [CrossRef] [Green Version]
- Ronesi, J.A.; Huber, K.M. Homer interactions are necessary for metabotropic glutamate receptor-induced long-term depression and translational activation. J. Neurosci. 2008, 28, 543–547. [Google Scholar] [CrossRef]
- Duncan, R.S.; Hwang, S.Y.; Koulen, P. Effects of Vesl/Homer proteins on intracellular signaling. Exp. Biol. Med. 2005, 230, 527–535. [Google Scholar] [CrossRef] [PubMed] [Green Version]
- Bertaso, F.; Roussignol, G.; Worley, P.; Bockaert, J.; Fagni, L.; Ango, F. Homer1a-dependent crosstalk between NMDA and metabotropic glutamate receptors in mouse neurons. PLoS ONE 2010, 5, e9755. [Google Scholar] [CrossRef] [PubMed] [Green Version]
- Iasevoli, F.; Ambesi-Impiombato, A.; Fiore, G.; Panariello, F.; Muscettola, G.; De Bartolomeis, A. Pattern of acute induction of Homer1a gene is preserved after chronic treatment with first- and second-generation antipsychotics: Effect of short-term drug discontinuation and comparison with Homer1a-interacting genes. J. Psychopharmacol. 2011, 25, 875–887. [Google Scholar] [CrossRef] [PubMed]
- Iasevoli, F.; Tomasetti, C.; Marmo, F.; Bravi, D.; Arnt, J.; De Bartolomeis, A. Divergent acute and chronic modulation of glutamatergic postsynaptic density genes expression by the antipsychotics haloperidol and sertindole. Psychopharmacology 2010, 212, 329–344. [Google Scholar] [CrossRef] [PubMed] [Green Version]
- Tomasetti, C.; Dell’Aversano, C.; Iasevoli, F.; De Bartolomeis, A. Homer splice variants modulation within cortico-subcortical regions by dopamine D2 antagonists, a partial agonist, and an indirect agonist: Implication for glutamatergic postsynaptic density in antipsychotics action. Neuroscience 2007, 150, 144–158. [Google Scholar] [CrossRef] [PubMed]
- Correll, C.U. From receptor pharmacology to improved outcomes: Individualising the selection, dosing, and switching of antipsychotics. Eur. Psychiatry 2010, 25 (Suppl. 2), S12–S21. [Google Scholar] [CrossRef]
- Citrome, L. Asenapine review, part I: Chemistry, receptor affinity profile, pharmacokinetics and metabolism. Expert Opin. Drug Metab. Toxicol. 2014, 10, 893–903. [Google Scholar] [CrossRef]
- Shahid, M.; Walker, G.B.; Zorn, S.H.; Wong, E.H. Asenapine: A novel psychopharmacologic agent with a unique human receptor signature. J. Psychopharmacol. 2009, 23, 65–73. [Google Scholar] [CrossRef]
- Bymaster, F.P.; Calligaro, D.O.; Falcone, J.F.; Marsh, R.D.; Moore, N.A.; Tye, N.C.; Seeman, P.; Wong, D.T. Radioreceptor binding profile of the atypical antipsychotic olanzapine. Neuropsychopharmacology 1996, 14, 87–96. [Google Scholar] [CrossRef] [Green Version]
- Kusumi, I.; Boku, S.; Takahashi, Y. Psychopharmacology of atypical antipsychotic drugs: From the receptor binding profile to neuroprotection and neurogenesis. Psychiatry Clin. Neurosci. 2015, 69, 243–258. [Google Scholar] [CrossRef]
- Yano, M.; Beverley, J.A.; Steiner, H. Inhibition of methylphenidate-induced gene expression in the striatum by local blockade of D1 dopamine receptors: Interhemispheric effects. Neuroscience 2006, 140, 699–709. [Google Scholar] [CrossRef] [PubMed]
- Kapur, S.; VanderSpek, S.C.; Brownlee, B.A.; Nobrega, J.N. Antipsychotic dosing in preclinical models is often unrepresentative of the clinical condition: A suggested solution based on in vivo occupancy. J. Pharmacol. Exp. Ther. 2003, 305, 625–631. [Google Scholar] [CrossRef] [PubMed]
- McLean, S.L.; Neill, J.C.; Idris, N.F.; Marston, H.M.; Wong, E.H.; Shahid, M. Effects of asenapine, olanzapine, and risperidone on psychotomimetic-induced reversal-learning deficits in the rat. Behav. Brain Res. 2010, 214, 240–247. [Google Scholar] [CrossRef] [PubMed] [Green Version]
- Ohyama, M.; Kondo, M.; Yamauchi, M.; Imanishi, T.; Koyama, T. Asenapine reduces anxiety-related behaviours in rat conditioned fear stress model. Acta Neuropsychiatr. 2016, 28, 327–336. [Google Scholar] [CrossRef]
- Foute Nelong, T.; Manduca, J.D.; Zonneveld, P.M.; Perreault, M.L. Asenapine maleate normalizes low frequency oscillatory deficits in a neurodevelopmental model of schizophrenia. Neurosci. Lett. 2019, 711, 134404. [Google Scholar] [CrossRef]
- Crum, W.R.; Danckaers, F.; Huysmans, T.; Cotel, M.C.; Natesan, S.; Modo, M.M.; Sijbers, J.; Williams, S.C.; Kapur, S.; Vernon, A.C. Chronic exposure to haloperidol and olanzapine leads to common and divergent shape changes in the rat hippocampus in the absence of grey-matter volume loss. Psychol. Med. 2016, 46, 3081–3093. [Google Scholar] [CrossRef] [Green Version]
- Franberg, O.; Marcus, M.M.; Ivanov, V.; Schilstrom, B.; Shahid, M.; Svensson, T.H. Asenapine elevates cortical dopamine, noradrenaline and serotonin release. Evidence for activation of cortical and subcortical dopamine systems by different mechanisms. Psychopharmacology 2009, 204, 251–264. [Google Scholar] [CrossRef]
- Ambesi-Impiombato, A.; Panariello, F.; Dell’Aversano, C.; Tomasetti, C.; Muscettola, G.; De Bartolomeis, A. Differential expression of Homer 1 gene by acute and chronic administration of antipsychotics and dopamine transporter inhibitors in the rat forebrain. Synapse 2007, 61, 429–439. [Google Scholar] [CrossRef]
- Iasevoli, F.; Fiore, G.; Cicale, M.; Muscettola, G.; De Bartolomeis, A. Haloperidol induces higher Homer1a expression than risperidone, olanzapine and sulpiride in striatal sub-regions. Psychiatry Res. 2010, 177, 255–260. [Google Scholar] [CrossRef]
- Fatemi, S.H.; Reutiman, T.J.; Folsom, T.D.; Bell, C.; Nos, L.; Fried, P.; Pearce, D.A.; Singh, S.; Siderovski, D.P.; Willard, F.S.; et al. Chronic olanzapine treatment causes differential expression of genes in frontal cortex of rats as revealed by DNA microarray technique. Neuropsychopharmacology 2006, 31, 1888–1899. [Google Scholar] [CrossRef] [Green Version]
- Sato, M.; Suzuki, K.; Nakanishi, S. NMDA receptor stimulation and brain-derived neurotrophic factor upregulate homer 1a mRNA via the mitogen-activated protein kinase cascade in cultured cerebellar granule cells. J. Neurosci. 2001, 21, 3797–3805. [Google Scholar] [CrossRef] [PubMed] [Green Version]
- Zhang, G.C.; Mao, L.M.; Liu, X.Y.; Parelkar, N.K.; Arora, A.; Yang, L.; Hains, M.; Fibuch, E.E.; Wang, J.Q. In vivo regulation of Homer1a expression in the striatum by cocaine. Mol. Pharmacol. 2007, 71, 1148–1158. [Google Scholar] [CrossRef] [PubMed] [Green Version]
- Nichols, C.D.; Garcia, E.E.; Sanders-Bush, E. Dynamic changes in prefrontal cortex gene expression following lysergic acid diethylamide administration. Brain Res. Mol. Brain Res. 2003, 111, 182–188. [Google Scholar] [CrossRef]
- Moghaddam, B.; Bunney, B.S. Acute effects of typical and atypical antipsychotic drugs on the release of dopamine from prefrontal cortex, nucleus accumbens, and striatum of the rat: An in vivo microdialysis study. J. Neurochem. 1990, 54, 1755–1760. [Google Scholar] [CrossRef]
- Kuroki, T.; Meltzer, H.Y.; Ichikawa, J. Effects of antipsychotic drugs on extracellular dopamine levels in rat medial prefrontal cortex and nucleus accumbens. J. Pharmacol. Exp. Ther. 1999, 288, 774–781. [Google Scholar]
- Cahill, E.; Pascoli, V.; Trifilieff, P.; Savoldi, D.; Kappes, V.; Luscher, C.; Caboche, J.; Vanhoutte, P. D1R/GluN1 complexes in the striatum integrate dopamine and glutamate signalling to control synaptic plasticity and cocaine-induced responses. Mol. Psychiatry 2014, 19, 1295–1304. [Google Scholar] [CrossRef] [Green Version]
- Siddoway, B.; Hou, H.; Xia, H. Molecular mechanisms of homeostatic synaptic downscaling. Neuropharmacology 2014, 78, 38–44. [Google Scholar] [CrossRef]
- Diering, G.H.; Nirujogi, R.S.; Roth, R.H.; Worley, P.F.; Pandey, A.; Huganir, R.L. Homer1a drives homeostatic scaling-down of excitatory synapses during sleep. Science 2017, 355, 511–515. [Google Scholar] [CrossRef] [Green Version]
- Wang, Y.; Rao, W.; Zhang, C.; Zhang, C.; Liu, M.D.; Han, F.; Yao, L.B.; Han, H.; Luo, P.; Su, N.; et al. Scaffolding protein Homer1a protects against NMDA-induced neuronal injury. Cell Death Dis. 2015, 6, e1843. [Google Scholar] [CrossRef] [Green Version]
- Naiker, D.V.; Catts, S.V.; Catts, V.S.; Bedi, K.S.; Bryan-Lluka, L.J. Dose determination of haloperidol, risperidone and olanzapine using an in vivo dopamine D2-receptor occupancy method in the rat. Eur. J. Pharmacol. 2006, 540, 87–90. [Google Scholar] [CrossRef]
- Wadenberg, M.L.; Soliman, A.; VanderSpek, S.C.; Kapur, S. Dopamine D(2) receptor occupancy is a common mechanism underlying animal models of antipsychotics and their clinical effects. Neuropsychopharmacology 2001, 25, 633–641. [Google Scholar] [CrossRef]
- Bymaster, F.; Perry, K.W.; Nelson, D.L.; Wong, D.T.; Rasmussen, K.; Moore, N.A.; Calligaro, D.O. Olanzapine: A basic science update. Br. J. Psychiatry Suppl. 1999, 174, 36–40. [Google Scholar] [CrossRef]
- Turrone, P.; Remington, G.; Kapur, S.; Nobrega, J.N. Differential effects of within-day continuous vs. transient dopamine D2 receptor occupancy in the development of vacuous chewing movements (VCMs) in rats. Neuropsychopharmacology 2003, 28, 1433–1439. [Google Scholar] [CrossRef] [PubMed] [Green Version]
- Valenti, O.; Cifelli, P.; Gill, K.M.; Grace, A.A. Antipsychotic drugs rapidly induce dopamine neuron depolarization block in a developmental rat model of schizophrenia. J. Neurosci. 2011, 31, 12330–12338. [Google Scholar] [CrossRef] [PubMed] [Green Version]
- Li, M. Antipsychotic-induced sensitization and tolerance: Behavioral characteristics, developmental impacts, and neurobiological mechanisms. J. Psychopharmacol. 2016, 30, 749–770. [Google Scholar] [CrossRef] [PubMed] [Green Version]
- Seeman, P. All roads to schizophrenia lead to dopamine supersensitivity and elevated dopamine D2(high) receptors. CNS Neurosci. Ther. 2011, 17, 118–132. [Google Scholar] [CrossRef]
- Gao, J.; Li, M. Time-dependence of risperidone and asenapine sensitization and associated D2 receptor mechanism. Behav. Brain Res. 2013, 257, 286–294. [Google Scholar] [CrossRef] [Green Version]
- Gardoni, F.; Bellone, C. Modulation of the glutamatergic transmission by Dopamine: A focus on Parkinson, Huntington and Addiction diseases. Front. Cell. Neurosci. 2015, 9, 25. [Google Scholar] [CrossRef] [Green Version]
- Li, M.; Fletcher, P.J.; Kapur, S. Time course of the antipsychotic effect and the underlying behavioral mechanisms. Neuropsychopharmacology 2007, 32, 263–272. [Google Scholar] [CrossRef]
- Tappe, A.; Kuner, R. Regulation of motor performance and striatal function by synaptic scaffolding proteins of the Homer1 family. Proc. Natl. Acad. Sci. USA 2006, 103, 774–779. [Google Scholar] [CrossRef] [Green Version]
- Errico, F.; Bonito-Oliva, A.; Bagetta, V.; Vitucci, D.; Romano, R.; Zianni, E.; Napolitano, F.; Marinucci, S.; Di Luca, M.; Calabresi, P.; et al. Higher free D-aspartate and N-methyl-D-aspartate levels prevent striatal depotentiation and anticipate L-DOPA-induced dyskinesia. Exp. Neurol. 2011, 232, 240–250. [Google Scholar] [CrossRef] [PubMed]
- Zhang, Z.R.; Zhang, X.R.; Luan, X.Q.; Wang, X.S.; Wang, W.W.; Wang, X.Y.; Shao, B.; Xie, C.L. Striatal overexpression of beta-arrestin2 counteracts L-dopa-induced dyskinesia in 6-hydroxydopamine lesioned Parkinson’s disease rats. Neurochem. Int. 2019, 131, 104543. [Google Scholar] [CrossRef] [PubMed]
- Blandini, F.; Porter, R.H.; Greenamyre, J.T. Glutamate and Parkinson’s disease. Mol. Neurobiol. 1996, 12, 73–94. [Google Scholar] [CrossRef] [PubMed]
- Kapur, S. Psychosis as a state of aberrant salience: A framework linking biology, phenomenology, and pharmacology in schizophrenia. Am. J. Psychiatry 2003, 160, 13–23. [Google Scholar] [CrossRef] [PubMed] [Green Version]
- Limongi, R.; Jeon, P.; Mackinley, M.; Das, T.; Dempster, K.; Theberge, J.; Bartha, R.; Wong, D.; Palaniyappan, L. Glutamate and Dysconnection in the Salience Network: Neurochemical, Effective Connectivity, and Computational Evidence in Schizophrenia. Biol. Psychiatry 2020, 88, 273–281. [Google Scholar] [CrossRef] [PubMed]
- Liddle, E.B.; Price, D.; Palaniyappan, L.; Brookes, M.J.; Robson, S.E.; Hall, E.L.; Morris, P.G.; Liddle, P.F. Abnormal salience signaling in schizophrenia: The role of integrative beta oscillations. Hum. Brain Mapp. 2016, 37, 1361–1374. [Google Scholar] [CrossRef] [Green Version]
- Yassa, M.A.; Stark, C.E. Multiple signals of recognition memory in the medial temporal lobe. Hippocampus 2008, 18, 945–954. [Google Scholar] [CrossRef]
- Duan, X.; Hu, M.; Huang, X.; Su, C.; Zong, X.; Dong, X.; He, C.; Xiao, J.; Li, H.; Tang, J.; et al. Effect of Risperidone Monotherapy on Dynamic Functional Connectivity of Insular Subdivisions in Treatment-Naive, First-Episode Schizophrenia. Schizophr. Bull. 2020, 46, 650–660. [Google Scholar] [CrossRef]
- Huang, M.; Li, Z.; Dai, J.; Shahid, M.; Wong, E.H.; Meltzer, H.Y. Asenapine increases dopamine, norepinephrine, and acetylcholine efflux in the rat medial prefrontal cortex and hippocampus. Neuropsychopharmacology 2008, 33, 2934–2945. [Google Scholar] [CrossRef]
- Marston, H.M.; Young, J.W.; Martin, F.D.; Serpa, K.A.; Moore, C.L.; Wong, E.H.; Gold, L.; Meltzer, L.T.; Azar, M.R.; Geyer, M.A.; et al. Asenapine effects in animal models of psychosis and cognitive function. Psychopharmacology 2009, 206, 699–714. [Google Scholar] [CrossRef] [Green Version]
- Tarazi, F.I.; Moran-Gates, T.; Wong, E.H.; Henry, B.; Shahid, M. Differential regional and dose-related effects of asenapine on dopamine receptor subtypes. Psychopharmacology 2008, 198, 103–111. [Google Scholar] [CrossRef] [PubMed]
- Choi, Y.K.; Wong, E.H.; Henry, B.; Shahid, M.; Tarazi, F.I. Repeated effects of asenapine on adrenergic and cholinergic muscarinic receptors. Int. J. Neuropsychopharmacol. 2010, 13, 405–410. [Google Scholar] [CrossRef] [PubMed] [Green Version]
- Banasikowski, T.J.; Beninger, R.J. Haloperidol conditioned catalepsy in rats: A possible role for D1-like receptors. Int. J. Neuropsychopharmacol. 2012, 15, 1525–1534. [Google Scholar] [CrossRef] [Green Version]
- Ene, H.M.; Kara, N.Z.; Barak, N.; Ben-Mordechai, T.R.; Einat, H. Effects of repeated asenapine in a battery of tests for anxiety-like behaviours in mice. Acta Neuropsychiatr. 2016, 28, 85–91. [Google Scholar] [CrossRef] [PubMed]
- Paxinos, G.; Watson, C. The Rat Brain in Stereotaxic Coordinates, 6th ed.; Academic Press Inc.: Sidney, Australia, 2007. [Google Scholar]


| Dose Effect | Time Effect | ||||||||||
|---|---|---|---|---|---|---|---|---|---|---|---|
| Acute ASE0.05 vs. Acute ASE0.1 vs. Acute ASE0.3 | Chronic ASE0.05 vs. Chronic ASE0.1 vs. Chronic ASE0.3 | Acute ASE0.05 vs. Chronic ASE0.05 | Acute ASE0.1 vs. Chronic ASE0.1 | Acute ASE0.3 vs. Chronic ASE0.3 | |||||||
| Fdf | p | Fdf | p | Fdf | p | Fdf | p | Fdf | p | ||
| Striatum | DM | 0.202,17 | ns | 0.502,17 | ns | 6.861,17 | 0.018 | 12.141,17 | 0.003 | 2.851,17 | ns |
| DL | 0.92,17 | ns | 0.902,17 | ns | 5.831,17 | 0.027 | 21.071,17 | 0.0005 | 13.791,17 | 0.002 | |
| VM | 0.222,17 | ns | 1.732,17 | ns | 11.481,17 | 0.003 | 15.811,17 | 0.001 | 6.551,17 | 0.022 | |
| VL | 069.2,17 | ns | 0.492,17 | ns | 1.881,17 | ns | 10.171,17 | 0.005 | 6.361,17 | 0.022 | |
| CAb | 1.882,17 | ns | 0.032,17 | ns | 2.361,17 | ns | 11.321,17 | 0.004 | 5.421,17 | 0.033 | |
| SAb | 0.262,17 | ns | 0.092,17 | ns | 0.801,17 | ns | 2.841,17 | ns | 1.041,17 | ns | |
| Cortex | ACC | 0.252,17 | ns | 0.492,17 | ns | 1.151,17 | ns | 1.201,17 | ns | 0.061,17 | ns |
| MAC | 0.532,17 | ns | 0.612,17 | ns | 0.001,17 | ns | 3.861,17 | ns | 0.051,17 | ns | |
| MC | 0.222,17 | ns | 1.022,17 | ns | 1.321,17 | ns | 8.561,17 | 0.009 | 1.001,17 | ns | |
| SS | 0.242,17 | ns | 0.752,17 | ns | 1.551,17 | ns | 7.631,17 | 0.013 | 0.861,17 | ns | |
| IC | 0.292,17 | ns | 0.522,17 | ns | 1.101,17 | ns | 4.461,17 | 0.007 | 6.321,17 | 0.022 | |
| Dose Effect | Time Effect | ||||||||||
|---|---|---|---|---|---|---|---|---|---|---|---|
| Acute HAL0.25 vs. Acute HAL0.5 vs. Acute HAL0.8 | Chronic HAL0.25 vs. Chronic HAL0.5 vs. Chronic HAL0.8 | Acute HAL0.25 vs. Chronic HAL0.25 | Acute HAL0.5 vs. Chronic HAL0.5 | Acute HAL0.8 vs. Chronic HAL0.8 | |||||||
| Fdf | p | Fdf | p | Fdf | p | Fdf | p | Fdf | p | ||
| Striatum | DM | 4.042,16 | 0.038 | 0.432, 16 | ns | 11.401,16 | 0.004 | 28.331,16 | 0.0005 | 14.601,16 | 0.002 |
| DL | 1.172, 16 | ns | 0.072, 16 | ns | 16.181,16 | 0.001 | 24.501,16 | 0.0005 | 17.021,16 | 0.001 | |
| VM | 3.372, 16 | ns | 0.882, 16 | ns | 19.901,16 | 0.0005 | 39.801,16 | 0.0005 | 26.741,16 | 0.0005 | |
| VL | 1.442, 16 | ns | 0.592, 16 | ns | 13.351,16 | 0.002 | 16.471,16 | 0.001 | 12.911,16 | 0.002 | |
| CAb | 3.342, 16 | ns | 0.312, 16 | ns | 14.301,16 | 0.002 | 33.841,16 | 0.0005 | 22.261,16 | 0.0005 | |
| SAb | 4.202, 16 | 0.034 | 0.402, 16 | ns | 2.041, 16 | ns | 19.331,16 | 0.0005 | 11.891,16 | 0.003 | |
| Cortex | ACC | 4.42,16 | 0.03 | 3.082,16 | ns | 0.481,16 | ns | 0.041,16 | ns | 0.321,16 | ns |
| MAC | 1.62,16 | ns | 0.872,16 | ns | 1.541,16 | ns | 3.111,16 | ns | 2.191,16 | ns | |
| MC | 3.172,16 | ns | 0.742,16 | ns | 1.761,16 | ns | 7.591,16 | 0.014 | 10.391,16 | 0.005 | |
| SS | 2.132,16 | ns | 0.702,16 | ns | 0.701,16 | ns | 0.691,16 | ns | 8.031,16 | 0.021 | |
| IC | 1.392,16 | ns | 0.822,16 | ns | 3.371,16 | ns | 3.481,16 | ns | 13.671,16 | 0.002 | |
| Treatment Effect | Time Effect | ||||||||||
|---|---|---|---|---|---|---|---|---|---|---|---|
| Acute OLA2.5 vs. Acute ASE0.1 vs. Acute HAL0.5 | Chronic OLA2.5 vs. Chronic ASE0.1 vs. Chronic HAL0.5 | Acute OLA2.5 vs. Chronic OLA2.5 | Acute ASE0.1 vs. Chronic ASE0.1 | Acute HAL0.5 vs. Chronic HAL0.5 | |||||||
| Fdf | p | Fdf | p | Fdf | p | Fdf | p | Fdf | p | ||
| Striatum | DM | 5.452,15 | 0.017 | 0.762,15 | ns | 1.961,15 | ns | 12.141,17 | 0.003 | 28.331,16 | 0.0005 |
| DL | 3.002,15 | ns | 0.502,15 | ns | 3.861,15 | ns | 21.071,17 | 0.0005 | 24.501,16 | 0.0005 | |
| VM | 5.752,15 | 0.014 | 0.202,15 | ns | 4.471,15 | 0.05 | 15.811,17 | 0.001 | 39.801,16 | 0.0005 | |
| VL | 4.912,15 | 0.023 | 1.152,15 | ns | 1.681,15 | ns | 10.171,17 | 0.005 | 16.471,16 | 0.001 | |
| CAb | 5.652,15 | 0.015 | 0.252,15 | ns | 2.861,15 | ns | 11.321,17 | 0.004 | 33.841,16 | 0.0005 | |
| SAb | 2.232,15 | ns | 0.182,15 | ns | 0.051,15 | ns | 2.841,17 | ns | 19.331,16 | 0.0005 | |
| Cortex | ACC | 0.992,15 | ns | 1.572,15 | ns | 0.001,15 | ns | 1.201,17 | ns | 0.041,16 | ns |
| MAC | 1.552,15 | ns | 0.362,15 | ns | 0.021,15 | ns | 3.861,17 | ns | 3.111,16 | ns | |
| MC | 0.902,15 | ns | 0.692,15 | ns | 0.421,15 | ns | 8.561,17 | 0.009 | 7.591,16 | 0.014 | |
| SS | 0.842,15 | ns | 1.202,15 | ns | 0.051,15 | ns | 7.631,17 | 0.013 | 0.691,16 | ns | |
| IC | 0.152,15 | ns | 1.252,15 | ns | 2.681,15 | ns | 4.461,17 | 0.007 | 3.481,16 | ns | |
| Three-Way Interaction | Two-Way Within-Subject (ROI*Dose/Treatment) | Two-Way Within-Subject (ROI*Time) | Two-Way Between-Subject (Dose/Treatment*Time) | |
|---|---|---|---|---|
| ASE Striatum | F10,85 = 1.99 | F10,85 = 2.46 | F5,85 = 11.66 | F2,17 = 0.53 |
| P = 0.04 | P = 0.012 | P < 0.0005 | P > 0.05 | |
| ASE Cortex | F8,68 = 1.31 | F8,68 = 0.29 | F4,68 = 12.42 | F2,17 = 0.81 |
| P > 0.05 | P > 0.05 | P < 0.0005 | P > 0.05 | |
| HAL Striatum | F10,80 = 0.51 | F10,80 = 0.57 | F5,80 = 12.74 | F2,16 = 0.81 |
| P > 0.05 | P > 0.05 | P < 0.0005 | P > 0.05 | |
| HAL Cortex | F8,64 = 1.23 | F8,64 = 1.52 | F4,64 = 13.02 | F2,16 = 0.57 |
| P > 0.05 | P > 0.05 | P < 0.0005 | P > 0.05 | |
| DRPA Striatum | F10,75 = 0.19 | F10,75 = 1.44 | F5,75 = 8.64 | F2,15 = 1.83 |
| P > 0.05 | P > 0.05 | P < 0.0005 | P >0.05 | |
| DRPA Cortex | F8,60 = 1.31 | F8,60 = 1.19 | F4,60 = 9.17 | F2,15 = 0.48 |
| P > 0.05 | P > 0.05 | P < 0.0005 | P > 0.05 |
© 2020 by the authors. Licensee MDPI, Basel, Switzerland. This article is an open access article distributed under the terms and conditions of the Creative Commons Attribution (CC BY) license (http://creativecommons.org/licenses/by/4.0/).
Share and Cite
Iasevoli, F.; Buonaguro, E.F.; Avagliano, C.; Barone, A.; Eramo, A.; Vellucci, L.; de Bartolomeis, A. The Effects of Antipsychotics on the Synaptic Plasticity Gene Homer1a Depend on a Combination of Their Receptor Profile, Dose, Duration of Treatment, and Brain Regions Targeted. Int. J. Mol. Sci. 2020, 21, 5555. https://doi.org/10.3390/ijms21155555
Iasevoli F, Buonaguro EF, Avagliano C, Barone A, Eramo A, Vellucci L, de Bartolomeis A. The Effects of Antipsychotics on the Synaptic Plasticity Gene Homer1a Depend on a Combination of Their Receptor Profile, Dose, Duration of Treatment, and Brain Regions Targeted. International Journal of Molecular Sciences. 2020; 21(15):5555. https://doi.org/10.3390/ijms21155555
Chicago/Turabian StyleIasevoli, Felice, Elisabetta Filomena Buonaguro, Camilla Avagliano, Annarita Barone, Anna Eramo, Licia Vellucci, and Andrea de Bartolomeis. 2020. "The Effects of Antipsychotics on the Synaptic Plasticity Gene Homer1a Depend on a Combination of Their Receptor Profile, Dose, Duration of Treatment, and Brain Regions Targeted" International Journal of Molecular Sciences 21, no. 15: 5555. https://doi.org/10.3390/ijms21155555