Article

Adaptive Traits to Improve Durum Wheat Yield in Drought and Crown Rot Environments

1
Centre for Crop Science, The University of Queensland, Queensland Alliance for Agriculture and Food Innovation, Brisbane, QLD 4072, Australia
2
Council for Agricultural Research and Economics (CREA)—Research Centre for Genomics and Bioinformatics, 29017 Fiorenzuola d’Arda (PC), Italy
3
School of Agriculture, Food and Wine, Waite Research Institute, The University of Adelaide, Urrbrae, SA 5064, Australia
4
Centre for Crop Science, The University of Queensland, Queensland Alliance for Agriculture and Food Innovation, Leslie Research Facility, Toowoomba, QLD 4350, Australia
5
International Center for the Agricultural Research in the Dry Areas, Rabat 10000, Morocco
*
Authors to whom correspondence should be addressed.
Int. J. Mol. Sci. 2020, 21(15), 5260; https://doi.org/10.3390/ijms21155260
Submission received: 26 June 2020 / Revised: 22 July 2020 / Accepted: 22 July 2020 / Published: 24 July 2020
(This article belongs to the Special Issue Wheat Breeding through Genetic and Physical Mapping)

Abstract

:
Durum wheat (Triticum turgidum L. ssp. durum) production can experience significant yield losses due to crown rot (CR) disease. Losses are usually exacerbated when disease infection coincides with terminal drought. Durum wheat is very susceptible to CR, and resistant germplasm is not currently available in elite breeding pools. We hypothesize that deploying physiological traits for drought adaptation, such as optimal root system architecture to reduce water stress, might minimize losses due to CR infection. This study evaluated a subset of lines from a nested association mapping population for stay-green traits, CR incidence and yield in field experiments as well as root traits under controlled conditions. Weekly measurements of normalized difference vegetative index (NDVI) in the field were used to model canopy senescence and to determine stay-green traits for each genotype. Genome-wide association studies using DArTseq molecular markers identified quantitative trait loci (QTLs) on chromosome 6B (qCR-6B) associated with CR tolerance and stay-green. We explored the value of qCR-6B and a major QTL for root angle QTL qSRA-6A using yield datasets from six rainfed environments, including two environments with high CR disease pressure. In the absence of CR, the favorable allele for qSRA-6A provided an average yield advantage of 0.57 t·ha−1, whereas in the presence of CR, the combination of favorable alleles for both qSRA-6A and qCR-6B resulted in a yield advantage of 0.90 t·ha−1. Results of this study highlight the value of combining above- and belowground physiological traits to enhance yield potential. We anticipate that these insights will assist breeders to design improved durum varieties that mitigate production losses due to water deficit and CR.

Graphical Abstract

1. Introduction

Durum is typically grown under rainfed conditions in the semiarid regions of the world [1]. Therefore, yield is strongly influenced by the quantity and timing of rainfall throughout the growing season. Increased variability in rainfall is predicted for most durum growing regions worldwide, particularly the Mediterranean region, suggesting that drought will continue to have an impact on production into the future [2]. Durum wheat is also very susceptible to crown rot (CR), a stubble-borne disease, especially when high inoculum levels coincide with terminal drought (Figure 1B). CR continues to be a destructive disease globally and has been particularly damaging due to dramatic changes in cropping systems, including intensive cropping, the introduction of minimum tillage practices and a rapidly changing climate [3,4]. Among the small grain temperate cereals, durum wheat is the most susceptible and, therefore, can experience greater yield losses due to CR infection compared to bread wheat and barley [5]. In Australia, several Fusarium species associated with CR have been detected in cereal hosts [6], including Fusarium pseudograminearum, which is common throughout eastern Australia, and Fusarium culmorum, which is less common but frequent in high-rainfall regions in Victoria and South Australia. The pathogen is also prevalent in other growing regions of the world affecting production of winter cereals in the Pacific Northwest of the USA [7,8], Italy, North Africa, and The Middle East [9,10] and recently in China [11].
Symptoms of CR include whiteheads, where spikes prematurely die in response to infection. This is due to mycelium colonization of the roots and base of the plant, including stems, which restricts translocation of water [12]. The symptoms are exacerbated under water-deficit conditions during flowering time and the grain-filling period [13]. This can result in highly shriveled grain and reduced seed quality [5,14,15,16,17,18]. The downgrade in quality due to decreased test weight leads to a significant reduction of the farmers’ potential income [19]. While the mechanisms underlying the variation in CR severity displayed in drought-affected environments remain unclear, water stress has also been reported to enhance CR proliferation and to spread under glasshouse conditions [20].
Although CR is a chronic problem throughout the Australian wheatbelt, losses could be minimized if crops have sufficient water availability (Figure 1A) or have access to water that is stored deep in the soil profile (Figure 1C). CR has been one of the factors limiting the expansion of durum production in Australia despite the high demand for Australian durum grain from European markets. Currently, all durum varieties are very susceptible to CR; for this reason, the genetic improvement of CR tolerance in durum wheat germplasm is still in its infancy. To date, the main focus for decreasing the impact of CR on yield has been on inoculum reduction through management practices [21,22,23,24,25,26]. An alternative or complementary strategy could involve breeding durum varieties equipped with physiological traits that improve the balance between water supply and demand to ultimately increase yield stability under CR conditions [13].
A number of physiological traits could be exploited to reduce water stress and to maximize the length of the grain-filling period. For instance, early flowering as an avoidance mechanism can reduce the impact of terminal drought and heat stress during grain filling [27,28], which may also limit the impact of CR. In part, this phenomenon of earlier maturity explains the smaller yield loss typically displayed by barley crops compared to common wheat [8]. Moreover, crop varieties with “stay-green” exhibit delayed canopy senescence and can result in higher yield under water-deficit conditions, as reported for bread wheat [29,30], barley [31], sorghum [32,33], and maize [34]. Stay-green can be achieved by modulating either canopy development or root architecture. For instance, key loci underpinning stay-green in sorghum influence root architecture and serve to increase water extraction and to improve drought adaptation [35]. Therefore, conserving water during vegetative growth and improving access to stored soil moisture through optimized root systems [36] could maximize the grain-filling period for durum crops under drought and CR conditions.
A number of quantitative trait loci (QTLs) for root traits have been reported in durum wheat [37,38], including the major QTL for seminal root angle (SRA) qSRA-6A [39]. The study of qSRA-6A identified two main haplotypes: hap1 (associated with narrow SRA) and hap2 (associated with wide SRA), which were found to be independent of root biomass. This highlights the opportunity to manipulate SRA without modifying root biomass and to develop varieties with a range of different root systems [40]. However, the value of qSRA-6A to improve yield performance under water-deficit conditions is yet to be determined.
In this study, a subset of durum wheat nested association mapping population (NAM) was evaluated for yield in six rainfed environments, including two environments with high CR disease pressure. Field-based phenotyping and genome-wide association studies (GWAS) were performed to identify QTL associated with CR tolerance and adaptive aboveground traits, including flowering time and stay-green. Here, we investigate the value of these QTL regions in combination with the major QTL for root angle qSRA-6A to improve durum yield under drought and CR conditions.

2. Results

2.1. Variation in CR Severity

In the 2017 yield trial conducted in the CR screening nursery, the panel displayed a wide range of disease responses. The percentage of whiteheads ranged from 1.1–65.2% for the first reading (WH1) and 1.9–77.2% for the second reading (WH2) (Table 1). The mean whitehead rating was higher for the second reading (21.3% versus 37.1%) because plants expressed more symptoms as the disease developed throughout the season. A higher degree of variation in whitehead ratings was evident for the first reading (CV = 65.4%) compared to the second reading (CV = 48.0%). This might suggest that the panel was segregating for a larger number of adaptation traits or mechanisms contributing to CR tolerance early in the season. In the nursery, disease developed evenly across the experiment, and this resulted in moderate broad-sense heritability measures for both WH1 (H2 = 0.45) and WH2 (H2 = 0.67). The stem browning discoloration scores ranged from 2.3–8.8, and measures between plots were more variable, reflected by a low broad-sense heritability (H2 = 0.24). Overall, less phenotypic variation for stem browning was observed in the panel (CV = 19.2%) compared to whitehead ratings (Table 1).

2.2. Yield and Component Traits in the Presence and Absence of CR

In 2017, yield trials were conducted in the presence and absence of CR at Warwick, Queensland. In both experiments, variation was observed for yield and component traits including plant height (PH), days to flowering (DTF), thousand kernel weight (TKW) and stay-green traits (Table 1).
Overall, the CV for time to flowering was low in the presence and absence of CR (CV = 2.0%, 2.2%; respectively). In general, variation in stay-green traits and yield was higher in the presence of CR (CV = 11.0–27.0%) compared to the absence of CR (CV = 8.3–13.4%). The additional trait variation observed under CR conditions might be due to additional adaptive mechanisms and/or loci that contribute to trait expression in environments with combined stresses (i.e., water stress and disease pressure). Generally, moderate to high broad-sense heritabilities were observed, except for PH and DTF which were considerably lower in the presence of CR (H2 = 0.45 and 0.18, respectively).
Yield in the presence of CR ranged from 0.58–3.94 t·ha−1 with a mean value of 2.30 t·ha−1, which was less than half of the yield in the absence of CR at Warwick (4.9 t·ha−1, Table 1). Furthermore, the CR disease pressure likely inhibited grain-filling and reduced thousand kernel weight (TKW) with a mean value of 37.70 g in the presence of CR in comparison to 41.90 g in the absence of CR. Plant height mean values showed little difference between experiments (i.e., 63.40 cm in the presence and 66.70 cm in the absence of CR). In the presence of CR, the panel of lines displayed a wider range for most stay-green traits (Table 1). Overall, the coincidence of high disease pressure and water stress in the CR screening nursery resulted in faster senescence. For instance, the average number of days from flowering until 50% senescence (MidS) was 16.8 d in the CR screening nursery compared to 25.3 d in the absence of CR. Similar results were observed for the number of days from flowering time to 90% senescence (EndS), with 30.0 d in the presence of CR and 36.3 d in the absence of CR (Table 1).
Stay-green traits (MidS, EndS and SGint) phenotyped in the presence of CR were highly correlated with yield (Figure 2A). In comparison, these traits were only moderately correlated with yield in the absence of CR (Figure 2B). Importantly, a longer grain-filling period supported higher yield performance as the stay-green traits showed positive correlations with TKW, both in the presence and absence of CR. As expected, a strong negative correlation between CR severity scores (CR, WH1 and WH2) and yield was observed in the CR screening nursery.

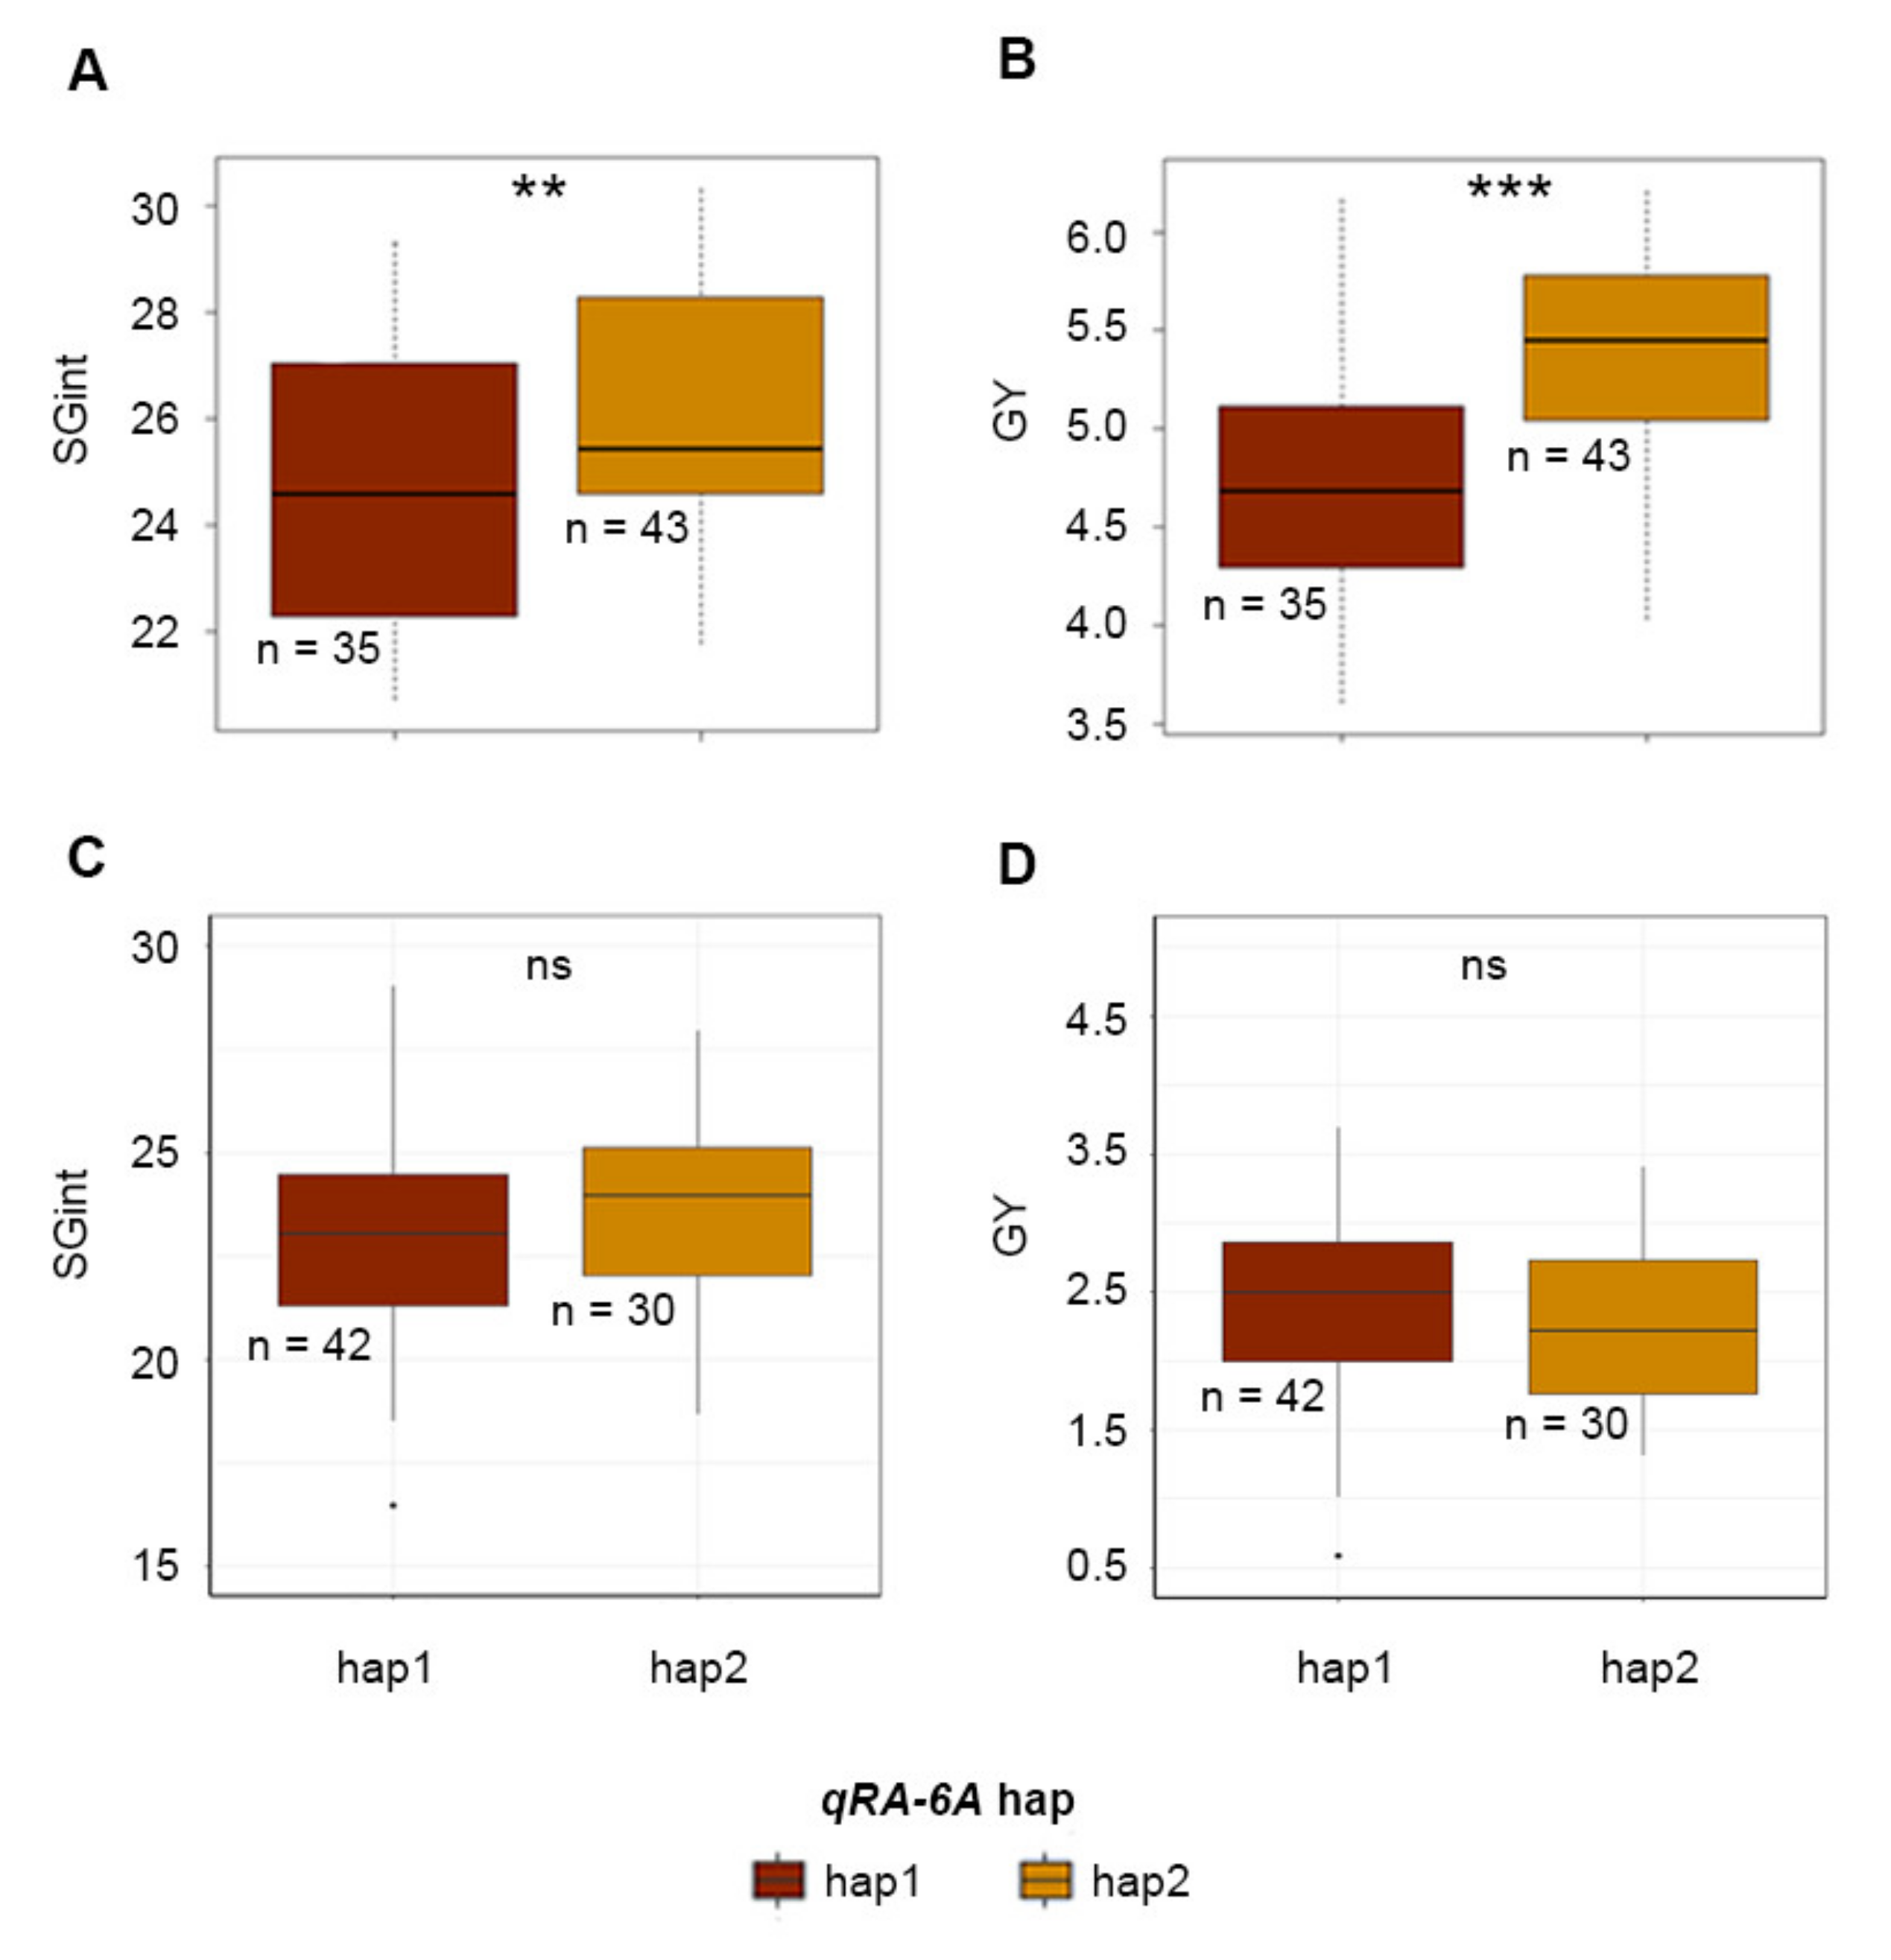
2.3. Association between qSRA-6A and Field Performance

The most frequent haplotype groups of the previously reported root angle QTL qSRA-6A (hap1 and hap2; Alahmad et al. [39]) were investigated for their effect on field performance in the presence and absence of CR using datasets from Warwick 2017. In the absence of CR, lines carrying qSRA-6A-hap1 showed significantly reduced stay-green (SGint) compared to those carrying qSRA-6A-hap2 (p < 0.01) and significantly higher yield (p < 0.001; Figure 3A). Lines carrying the favorable allele displayed a yield advantage of 0.57 t·ha−1 (Figure 3B). However, in the presence of CR, no significant differences were observed (Figure 3C,D).

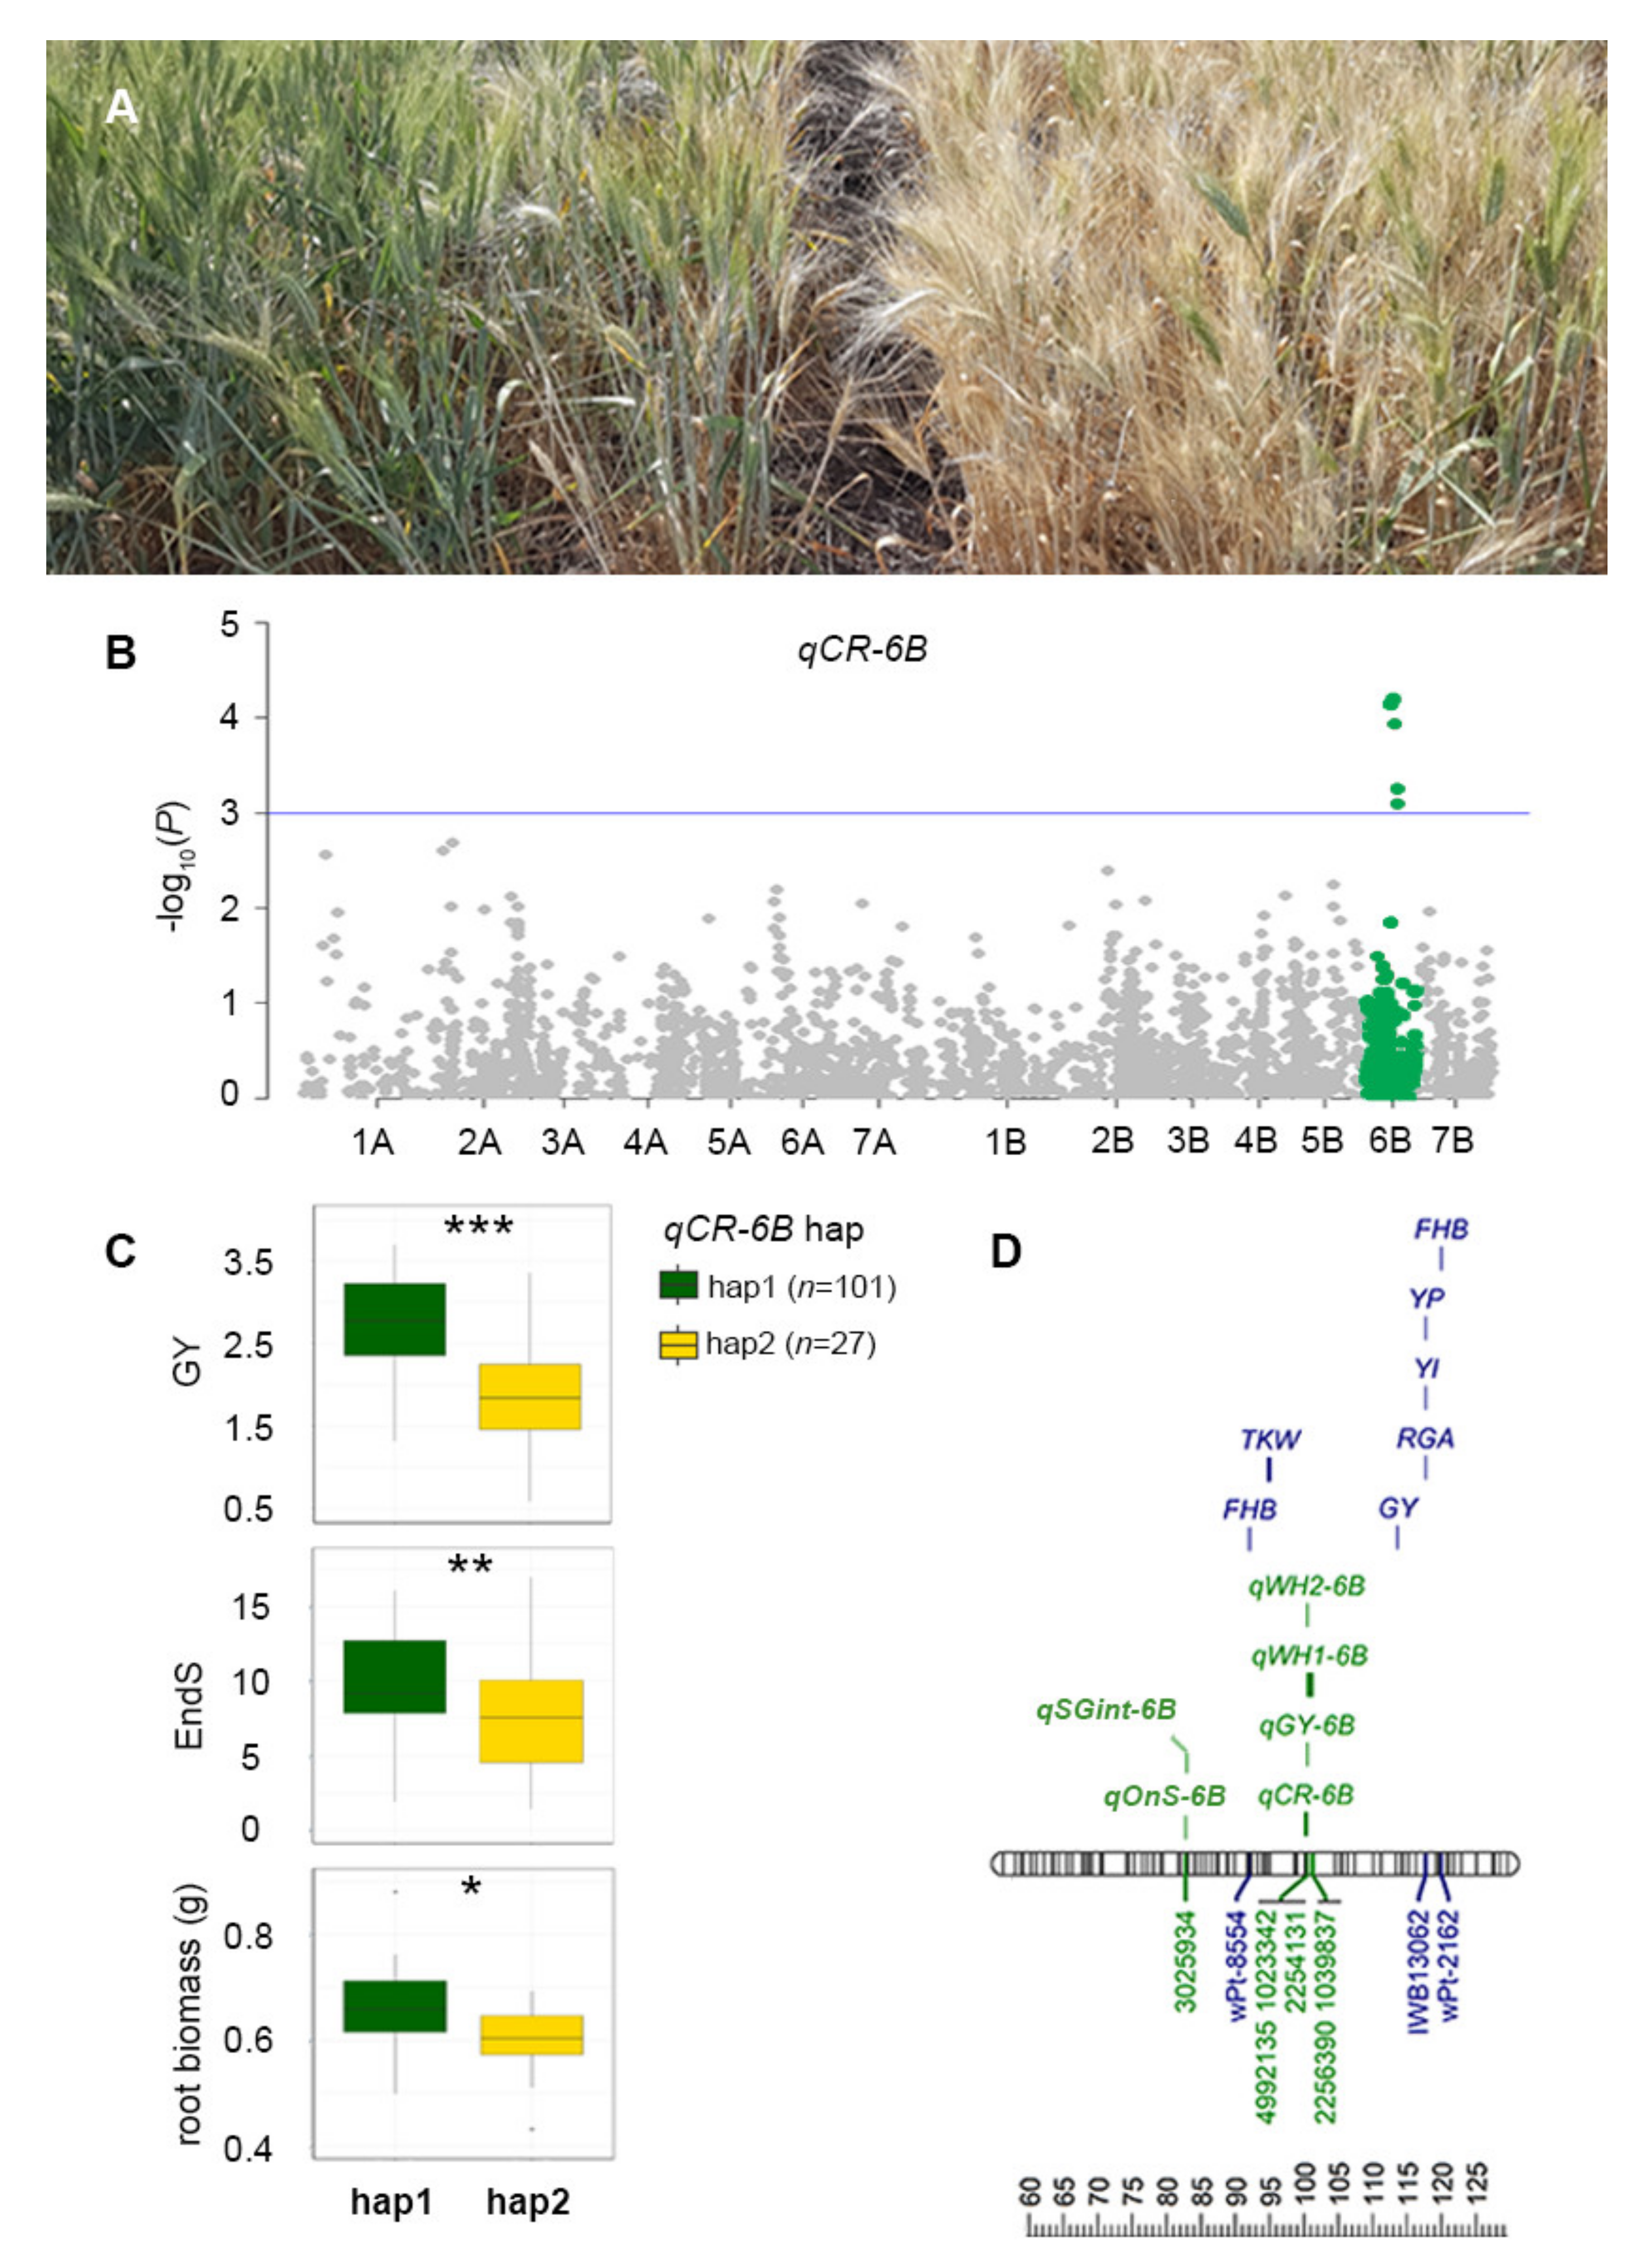
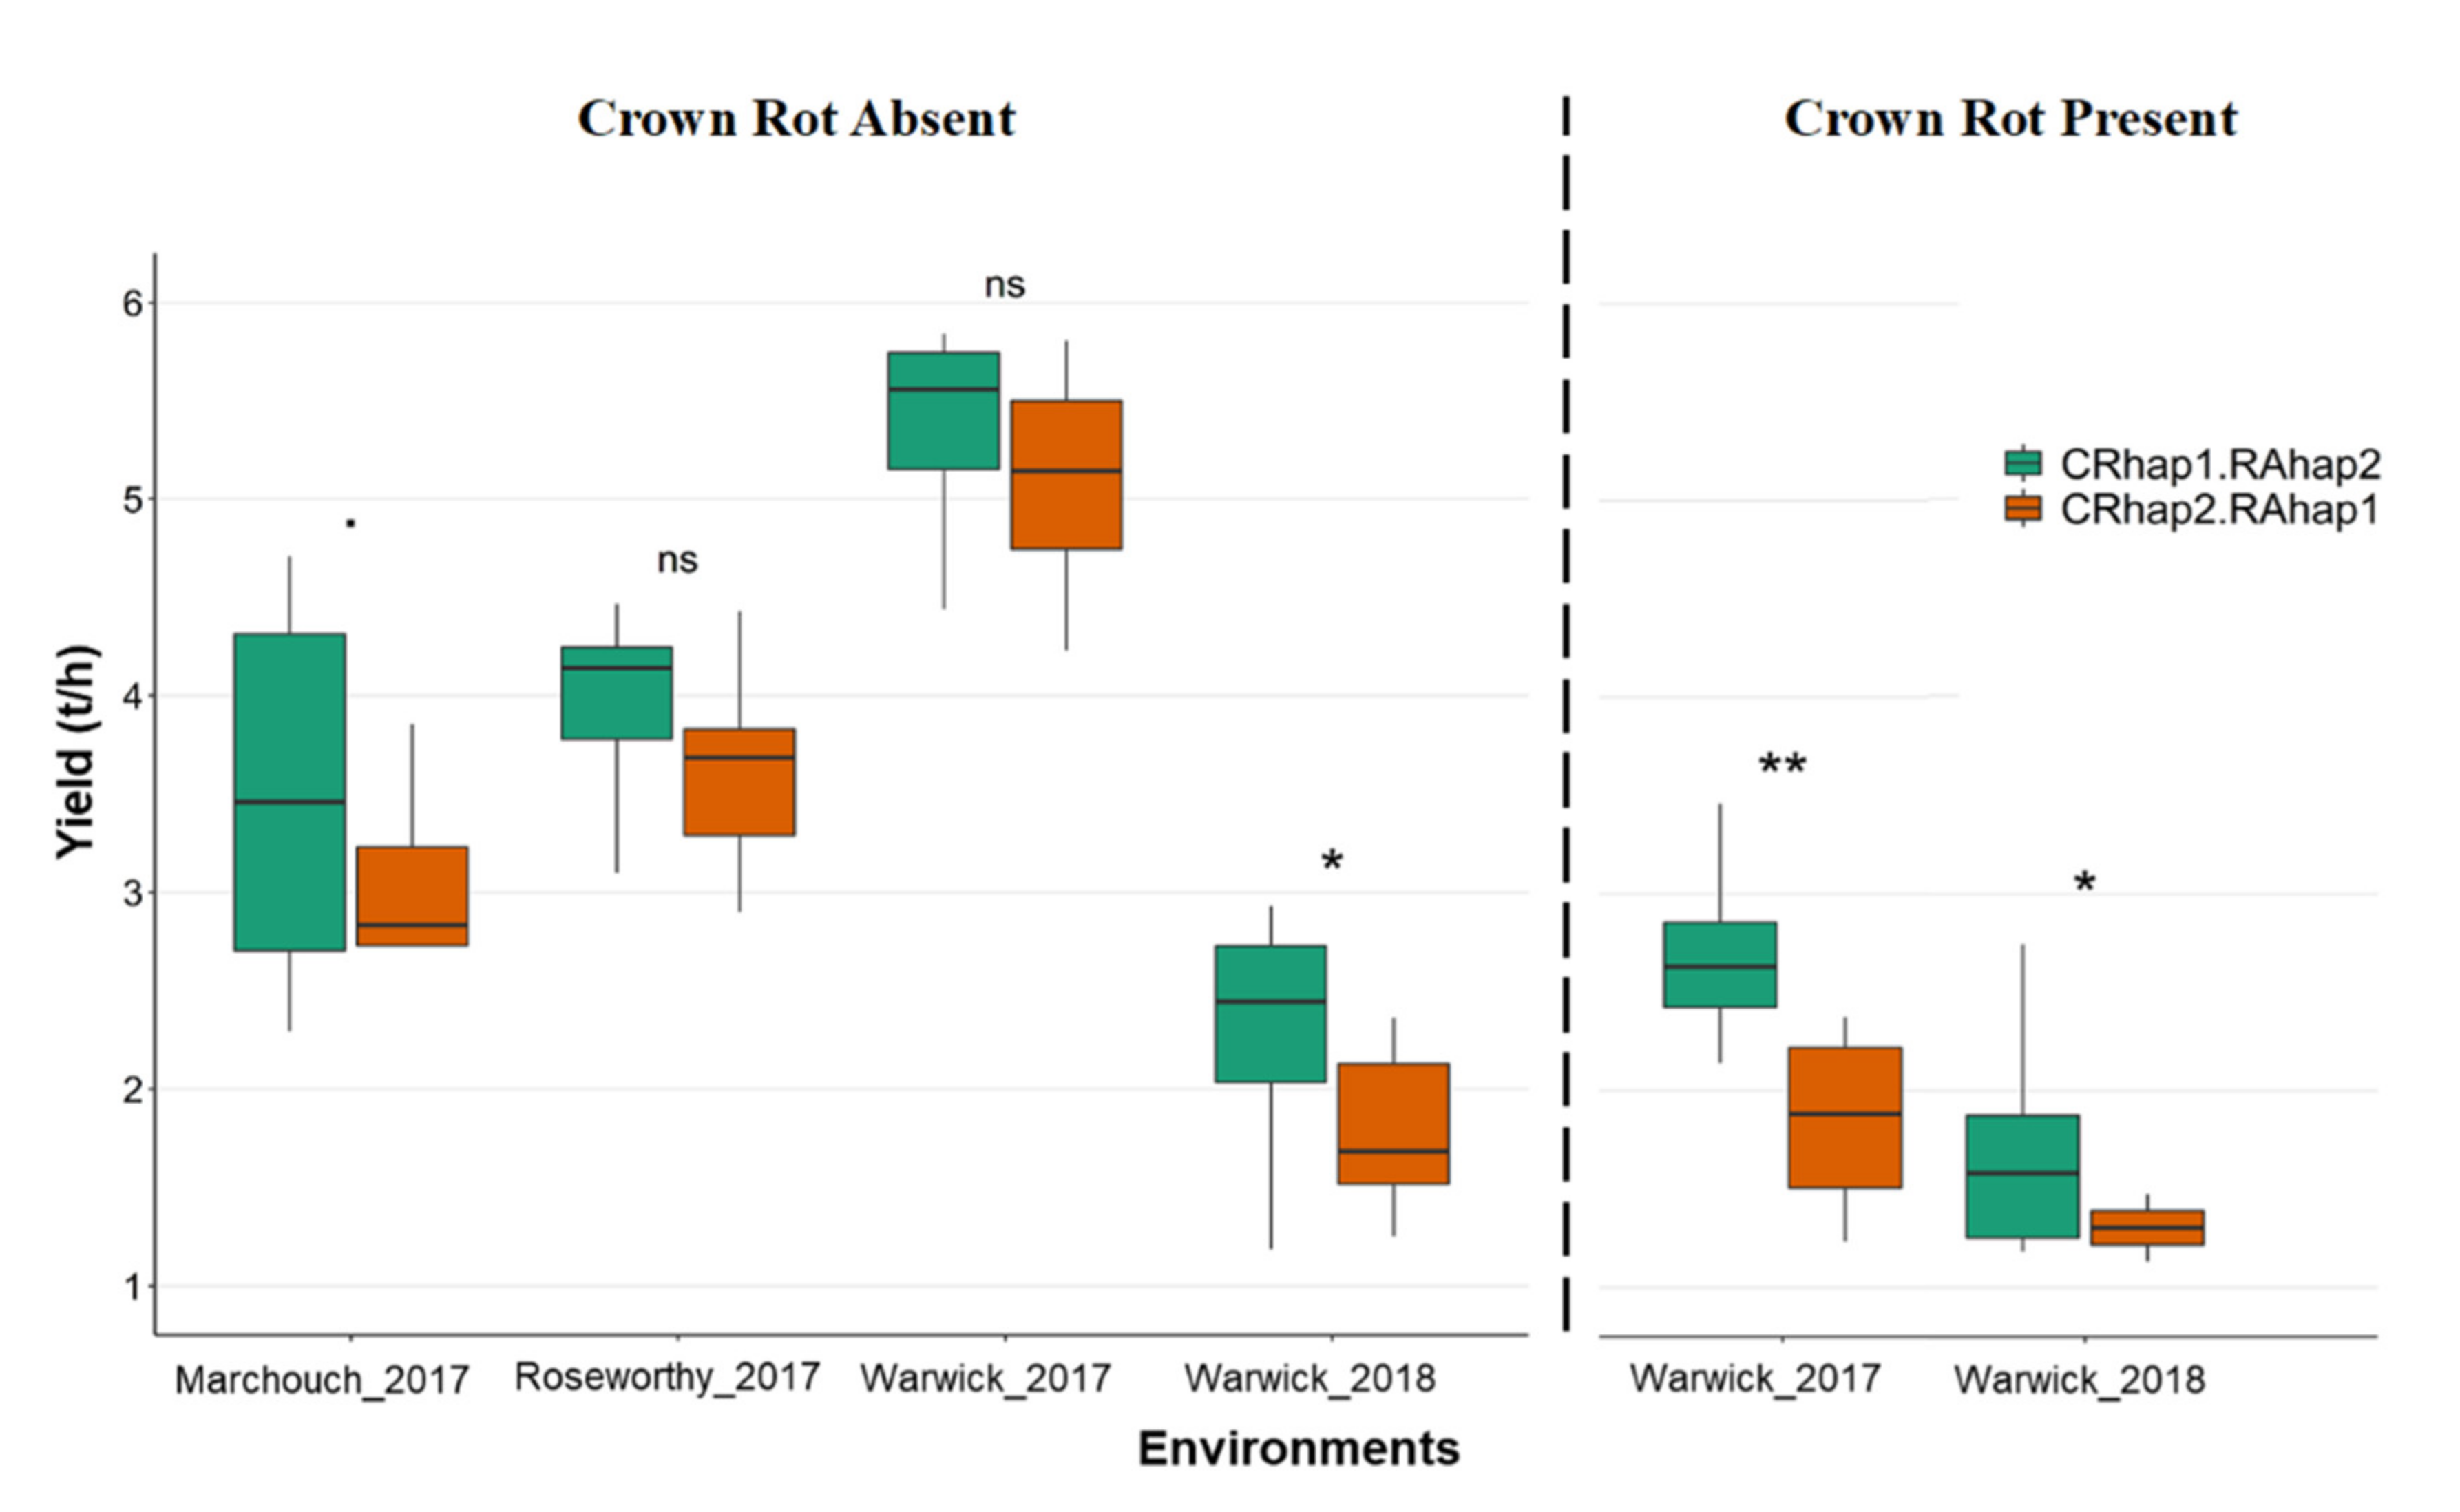
2.4. Association between qCR-6B and Field Performance

CR severity index phenotypes for the panel of 168 lines were used for GWAS (Figure 4A). A Manhattan plot describing the association between highly significant markers and CR severity response under CR conditions is presented in Figure 4B. A total of five significant markers were detected on chromosome 6B based on the arbitrary threshold: −log10(P) ≥ 3. A single QTL (qCR-6B) was assigned based on a high level of linkage disequilibrium (LD, r2 = 0.71) between the markers 1023342 (42.43 cm DArTseq V4 consensus map) and 1039837 (53.61 cm DArTseq V4 consensus map) (Figure 4B). Using the five significant markers and their allelic variation in the panel of 168 genotypes, 26 haplotype groups were identified. The most frequent variants were hap1 and hap2 (101 individuals versus 27 individuals; frequency = 60.12% and 16.07%, respectively). Lines carrying hap1 displayed a higher CR severity index compared to those carrying hap2 (6.60 and 5.10, respectively; p ≤ 0.001).
The haplotype effect of the qCR-6B QTL was investigated for yield performance and stay-green in the presence of CR. Lines carrying hap1 for qCR-6B QTL outperformed lines carrying hap2 (2.70 t·ha−1 versus 1.91 t·ha−1), representing an average yield benefit of 0.79 t·ha−1 (p ≤ 0.001). In addition, the number of days from flowering until 90% senescence (EndS) was also significantly different between hap1 and hap2 for the qCR-6B QTL, with lines grouped to hap1 displaying a longer grain-filling period by an extra 4.24 d compared to those carrying hap2 (p ≤ 0.05). Interestingly, while exploring trait relationships, we discovered that lines carrying different haplotypes for qCR-6B also showed significant differences in root biomass measured under controlled conditions. Lines with hap1 displayed significantly higher root biomass (0.66 g versus 0.59 g, p ≤ 0.05; Figure 4C).

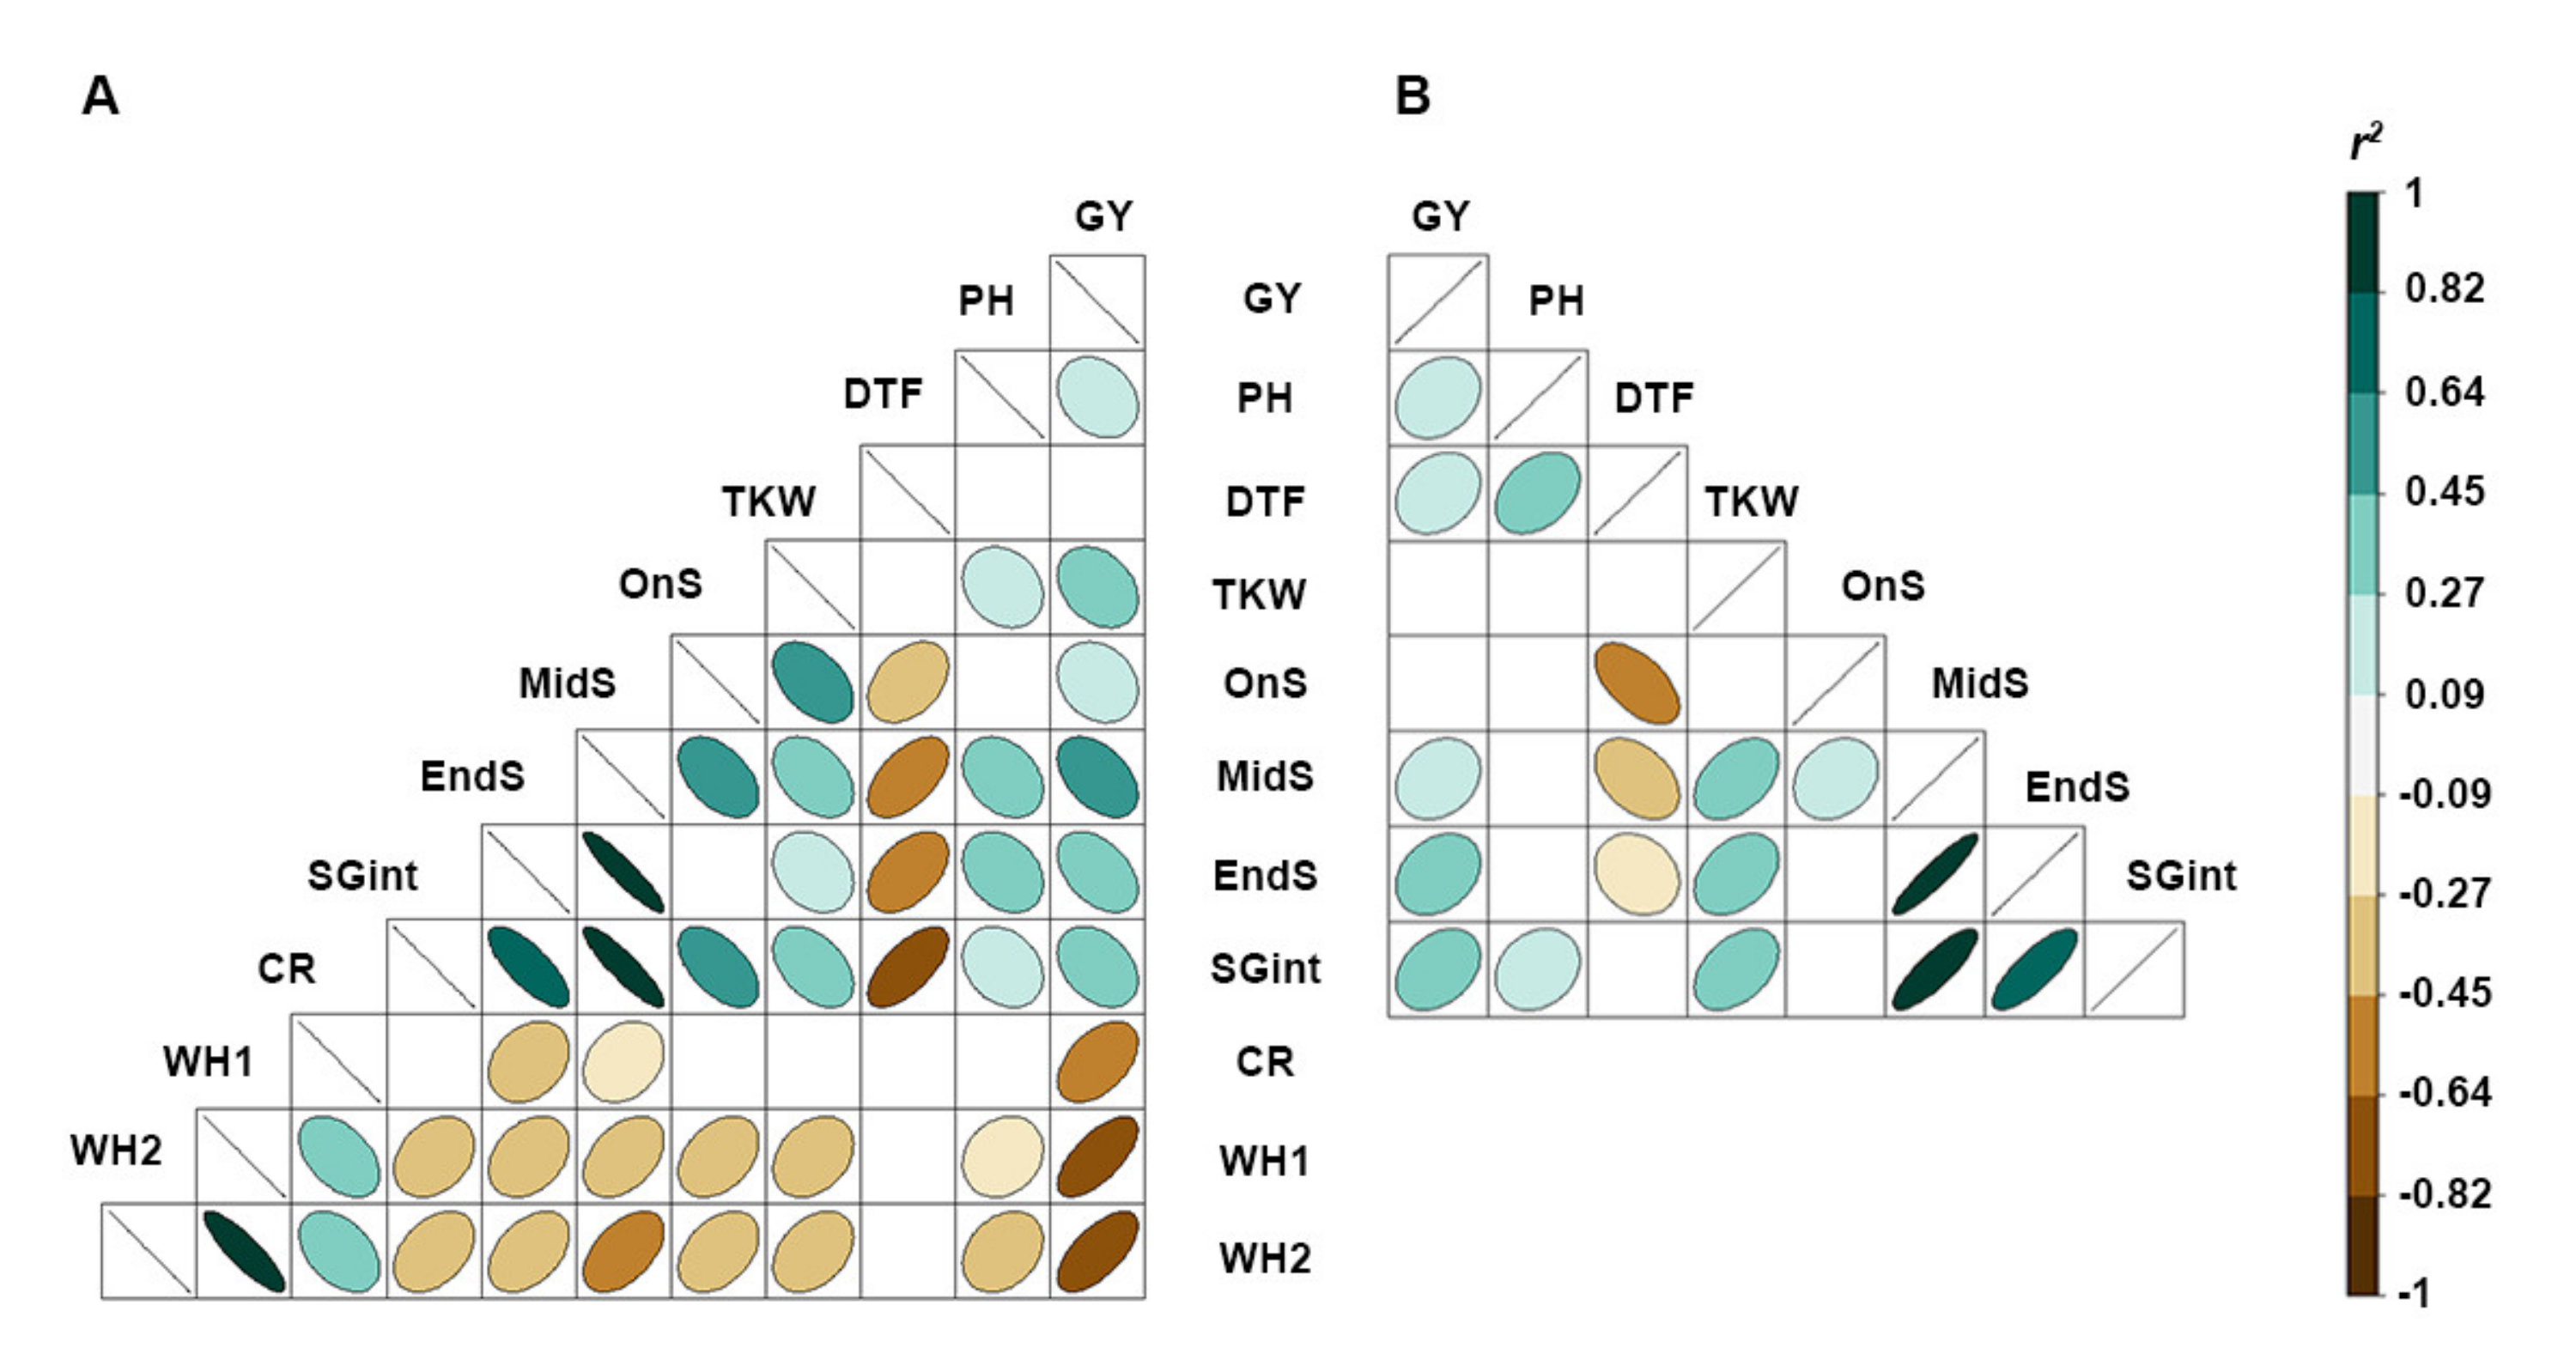
2.5. Alignment of QTL Regions Influencing Crown Rot Severity, Water-Use Traits, and Yield

GWAS identified a genomic “hot-spot” on chromosome 6B harboring several key QTLs associated with stay-green traits, CR tolerance and yield. Therefore, results in this study focus on describing trait associations in this region. This included qPH-6B for plant height, qSG-0.1-6B and qSG-integral-6B for stay-green traits, and qGY-6B for yield. Interestingly, GWAS using scores for the percentage of whiteheads (WH1 and WH2) in the CR nursery identified QTLs (qWH1-6B and qWH2-6B) that represented the same region as qGY-6B for yield (i.e., 100.50 cm on chromosome 6B). When the CR severity index was used for GWAS (instead of WH1 and WH2 alone), the same markers were identified but they showed a stronger association. A summary of the GWAS results including the QTL name, markers and their positions, marker-trait associations and their effects are presented in Table 2.
The QTLs discovered in this study were positioned on durum reference (Svevo) genome [41] along with QTLs reported in the literature (Figure 4D). The QTL regions on chromosome 6B reported in this study were positioned in close proximity to many previously reported QTLs [37,42,43,44,45,46,47,48] for root growth angle (RGA), Fusarium head blight (FHB), grain quality (yellow pigmentation, YP; yellow index, YI), thousand kernel weight (TKW) and yield (GY; Figure 4D).

2.6. The Combined Effect of qCR-6B and qSRA-6A on Yield

Using the 2,541 high-quality DArTseq markers, we identified a set of genotypes that were closely related and segregated for both QTLs qCR-6B and qSRA-6A. This set was evaluated for their performance for yield under six different environmental conditions (Figure 5). In the presence of CR, lines that carried both favorable alleles for qCR-6B and qSRA-6A (referred to as CRhap1.RAhap2) significantly outperformed lines lacking both alleles (referred to as CRhap2.RAhap1). On average, the yield advantage was 0.90 t·ha−1 (p ≤ 0.01). In the absence of CR, lines carrying both favorable haplotypes (CRhap1.RAhap2) showed a trend for higher yield across the four environments (Figure 5). While within-environment differences were deemed statistically insignificant, the mean yield difference for lines carrying the favorable alleles was 0.57 t·ha−1 across all environments.
Overall, very large differences between average yield among trials in the absence of CR were noted, mainly driven by in-season rainfall as displayed in (Warwick_2017, Warwick_2018). The impact of CR was highlighted in Warwick_2018 when the yield losses were greater due to the combined effect of CR and low in-season rainfall. However, genotypes carrying CRhap1.RAhap2 were consistently superior to genotypes carrying CRhap2.RAhap1, maintaining higher yield in environments that varied for in-season rainfall (Table S1) and CR disease pressure.

3. Discussion

For the first time, we validated the value of root growth angle QTL qSRA-6A to support yield performance under rainfed conditions in Australia. In the absence of CR disease, lines carrying hap2 significantly out-yielded lines carrying hap1 by 0.57 t·ha−1. The results from wheat simulation studies report a yield increase of 50–60 kg·ha−1 for each additional millimeter of water accessed during the gain-filling period [49]. This could suggest that the yield advantage of 0.57 t·ha−1 observed in the current study likely arose due to improved access to approximately 10 mm of water in the soil profile. A recent study on durum wheat also reported a strong link between root architecture and yield in Moroccan drought environments, where deep root growth was associated with yield in dry environments [50]. However, in the current study, the qSRA-6A-hap2 variant associated with wide root angle provided a yield advantage. This is not surprising because the value of different root systems is likely context dependent. For instance, in elite barley breeding lines, Robinson et al. [51] found that narrow root angle was advantageous in some environments but that, in others, a wide root angle was preferred. To add to the complexity, key genes in the flowering pathway, such as Vernalization1, are also known to influence root development [52]. Therefore, this could present challenges to breed varieties with a range of root configurations for all maturity classes required for different production systems.
In the presence of CR, qSRA-6A was not associated with yield (Figure 3D); however, lines carrying favorable alleles for both qSRA-6A and qCR-6B displayed significantly higher yield, where the average yield benefit was 0.9 t·h −1 across the 2017 and 2018 yield trials (Figure 5). The inability to detect a yield effect associated with qSRA-6A alone was likely a result of the increased plot variability due to disease, as reflected by lower broad-sense heritabilities for most traits measured in the CR nursery. The qCR-6B QTL on chromosome 6B was mapped using the CR severity index (qCR-6B). The same interval was also mapped using individual readings for percentage of whiteheads (qWH1-6B and qWH2-6B) and yield in the presence of CR (qGY-6B). Interestingly, qCR-6B was also positioned in close proximity to previously reported QTLs for FHB resistance [44,46], which suggests that this could be a key genomic region for wheat responses to Fusarium in general.
In cereals, the stay-green phenotype can result from either conserving water early in the season or improving access to stored soil moisture late in the season [53,54]. This results in optimized water use to meet the demand during grain filling stage and maximized yield [35]. The QTL associated with stay-green traits were detected on chromosome 6B (qSG-0.1-6B and qSG-integral-6B), which were positioned 17.71 cm away from qCR-6B. Therefore, these loci appear to be independent. A moderate likelihood of recombining the two loci (i.e., 17.7% per generation) presents an opportunity for breeders to identify lines with various combinations of CR tolerance and stay-green traits. However, lines differing for the main haplotypes of qCR-6B also showed significantly different stay-green and root biomass phenotypes. Notably, this is not the first report of a link between root biomass and CR tolerance. A recent study in bread wheat found that genotypes with a higher total root biomass were more resistant to fungal infection [4]. This could be due to higher lignin/fiber content at the cellular level presenting a physical barrier for fungal growth and therefore providing enhanced resistance. Considering its association with stay-green and root biomass, qCR-6B could be involved in modulating canopy development early in the season and possibly root development to provide improved water-use strategies and access to water. These are likely the key mechanisms exploited by higher yielding durum lines, particularly in the presence of CR, because they lack genetic resistance per se.

4. Materials and Methods

4.1. Plant Material

A panel comprising 168 genotypes was evaluated in this study. The panel included 151 durum lines from the NAM population developed at the University of Queensland [39]. The NAM population was generated by crossing eight lines from ICARDA’s durum breeding program in Morocco with two Australian cultivars. The elite lines from ICARDA (Fastoz2, Fastoz3, Fastoz6, Fastoz7, Fastoz8, Fastoz10, Outrob4 and Fadda98) were used as founders and Australian cultivars (DBA Aurora, Jandaroi) were used as reference parents. The founder lines were selected due to their superior drought adaptation and have been used as parents in durum breeding programs targeting marginal rainfall regions of West Asia and North Africa. The reference parents are preferred by Australian growers for their high yield and quality parameters required by the pasta industry. The panel also comprised seven commercially released Australian durum varieties (Caparoi, Hyperno, Kalka, Saintly, Tjilkuri, WID 802, and Yawa).

4.2. Establishing a Crown Rot Field Screening Nursery

A CR field screening nursery was established at the Department of Agriculture and Fisheries Queensland (DAFQ), Hermitage Research Facility (28o12′40″ S; 152o06′06″ E), Warwick, Queensland. This nursery was prepared for over three years (2014–2016) and was made available for CR screening in 2017. A pure culture of F. pseudograminearum isolates was isolated from infected wheat stubble collected from grower fields in Brookstead, Queensland, as described by Alahmad et al. [40]. The pure culture was used to inoculate freshly ground millet, mixed with distilled water and placed inside sealed plastic bags. The bags were placed at 25 °C for 6 weeks to accommodate mycelium growth. The colonized ground millet was then air-dried, mixed with the bulk seed of a very susceptible Australian durum wheat variety (Jandaroi) and planted in the nursery for initiating disease infection during germination. Throughout the late grain-filling stage, CR symptoms were evident on the base of the plants and the stems, resulting in the formation of whiteheads. At maturity, Jandaroi was ploughed into the soil and stubble was retained to build up inoculum levels in the soil. This process was repeated six times during the period spanning 2014–2016 to achieve high levels of inoculum and significant CR disease pressure in the screening nursery.

4.3. Field Experiments

4.3.1. Yield Trials in the Presence of CR

The panel of durum lines was evaluated for yield under high disease pressure in the CR screening nursery in 2017 and 2018. In both years, mini yield plots were sown using a partial replication (p-rep) design where 50% of genotypes were replicated in a row-column grid to maximize the number of tested genotypes, as described by Cullis et al. [55]. Plots contained 4 rows and were 4 meters in length (i.e., 4 m2).
In 2017, the panel was subjected to extensive phenotyping for a number of traits, including days to flowering (Zadock 65), plant height (PH; cm), weekly measures of normalized difference vegetation index (NDVI) recorded from flowering time until physiological maturity (Zadock 93) and CR symptoms (scores 0–9 and % of whitehead). NDVI was captured using a handheld GreenSeeker™ (NTech Industries Inc., Ukiah, CA, USA) following procedures described by Lopes and Reynolds [56]. Raw NDVI measures recorded over time for each plot were used to model stay-green traits [31], including onset of leaf senescence (OnS), mid-point of leaf senescence (MidS), near completion of leaf senescence (EndS) and stay-green integral (SGint), as displayed in Table 3. To phenotype CR severity, all plots were scored for the percentage of whiteheads due to CR infection at four (WH1 %) and two weeks (WH2; %) before physiological maturity. Further, to quantify CR symptoms displayed as stem browning, 10 plants per plot were manually extracted from the inner two rows and scored for stem browning discoloration using a 0–9 scale, where 0 is fully resistant and 9 is the most susceptible [40]. A weighted index for CR severity was calculated by combining the datasets derived from the percentage of whiteheads and the stem browning discoloration scores, where equal weighting was applied to each of the three measures (WH1, WH2 and stem browning scores). At crop maturity, plots were harvested using a mechanical plot harvester and yield was recorded.
To validate associations between trait QTL and yield under CR disease pressure, the panel was evaluated for yield in the CR screening nursery in 2018.

4.3.2. Yield Trials in the Absence of CR

Yield trials were performed in the absence of CR under rainfed conditions at Warwick (Queensland, Australia) in 2017 and 2018. Importantly, the trials were conducted on a block of land that had very low levels of CR inoculum that was insufficient to cause visible disease symptoms for very susceptible durum varieties. The block was also located in close proximity to the CR nursery block (only 200 m away). The yield trials were also sown on the same day as the respective CR experiments and, therefore, were exposed to similar water stress throughout the season. The trials also used the same mini-plot and p-rep design, as described above.
In 2017, the panel was subjected to extensive phenotyping for a number of traits, including flowering date, PH and weekly NDVI measurements from flowering time until physiological maturity (to calculate stay-green traits, as detailed above).
To further investigate trait QTL associations with yield across a broader range of environments, the panel was subjected to yield trials at three additional sites. In 2017, the panel was evaluated at Roseworthy (34°30′08.5″ S; 138°41′30.2″ E), South Australia and Marchouch (33°36′48.0″ N; 6°43′04.8″ W), Morocco, and in 2018, the panel was yield tested at Warwick, Queensland. All three trials were conducted in the absence of disease, and no visible CR symptoms were observed. Site management for all trials, including chemical control for weeds and fertilizer for maximizing crop productivity, was conducted on a needs basis and by using the industry standard best practice. Additional site information is provided in Table S1.

4.4. Phenotyping Root Biomass under Controlled Conditions

To investigate the relationship between root biomass and yield under CR conditions, a subset of the panel (40 genotypes) was selected according to the haplotype at the major QTL for root angle qSRA-6A (i.e., hap1 = narrow, n = 20; and hap2 = wide, n = 20) [39]. The 40 genotypes were evaluated for root biomass using the method reported by Voss-Fels et al. [57] with slight modifications. Here, ANOVApot® pots (137 mm diameter and 140 mm height) were filled with 1700 g of sand (with particle size ranging from 0.075–4.75 mm) to facilitate efficient cleaning of roots. A randomized complete block design (RCBD) was adopted, with four plants per genotype in each 1.40 L pot and three replicates. Fifteen pots were placed in a container fitted with capillary matting to enable water and nutrient flow through the bottom of the pots. Hydroponic solution was added to each container (1.50 mL of Cultiplex per litre of de-ionised water) with the solution reaching the base of the pots and the solution level maintained throughout the experiment. The concentration of the solution was optimized according to the plant growth stage as follows: 1–10 d: 1.50 mL/L, 11–17 d: 2 mL/L, 18–22 d: 2.50 mL/L and 23–28 d: 3 mL/L.
The seeds were imbibed and subjected to cold treatment (5 °C) for three days to synchronize germination across genotypes, and the germinated seeds were sown under diurnal glasshouse conditions with 22 °C day/17 °C night temperature. At the early tillering stage (Zadock 22), plants were extracted with minimal disruption to the roots by placing the pot in a bucket of water and by washing off the sand in clean water. The roots and shoots of the four plants were separated, and the roots were placed in a dehydrator at 65 °C for 72 h. After drying, root biomass was weighed using a balance with 0.0001 g accuracy (AND, HR–200, A&D Company Limited, Tokyo, Japan). The measurements of root biomass for the four plants were considered as a single experimental unit in the analysis.

4.5. Analysis of Phenotype Data

The panel of 168 genotypes tested in the six field trials (two in the presence of CR and four in the absence of CR) were phenotyped for yield and other traits, which were analyzed using the ASReml–R package [58] in R software V3.4.3 [59]. To account for spatial variation in the field sites, a mixed linear model was fitted in ASReml–R. In this model, genotype was fitted as a fixed effect while replicates and the field grid of row and column were fitted as random terms. Best linear unbiased estimates (BLUEs) were calculated and used as adjusted mean values for each trait for each genotype evaluated in each environment. The broad-sense heritability (H2) and coefficient of variation (CV) was also calculated for all traits.
To investigate the relationship between yield and traits (stay-green traits, PH and days to flowering), the Pearson’s correlation coefficient (r) was calculated using the mean values (BLUEs) for each genotype.

4.6. Genome-Wide Association Mapping

The 168 durum lines were previously genotyped, as reported by Alahmad et al. [40]. Briefly, a total of 2541 high-quality genome-wide markers were used to investigate genomic regions associated with CR severity traits, stay-green traits and yield. The mean marker interval was 81.8 Mbp, which varied across the 14 chromosomes: 218.2 for 1A, 131.7 for 1B, 62.3 for 2A, 37.1 for 2B, 82.8 for 3A, 71.9 for 3B, 101.7 for 4A, 70.5 for 4B, 121 for 5A, 63.7 for 5B, 75.6 for 6A, 46.6 for 6B, 78.4 for 7A and 72.9 for 7B. The BLUEs for each trait were used in a mixed model implemented in the R package GenABEL [60]. The marker-trait associations were calculated using a two-step mixed linear model approach that increases detection power without increasing the empirical type I error [61]. The model was adjusted for population stratification by including identity-by-state estimates for genotype pairs (as a kinship matrix) and a principal component adjustment that uses the first four principal components as fixed covariates to account for variation due to population structure. For the identification of significant marker-trait associations and to control the probability of false positives, an arbitrary threshold of −log10(P) ≥ 3 was applied.
To determine the main haplotypes associated with the key QTL for CR tolerance, the local LD was calculated for the significant markers in the region. Markers with pairwise r2 values ≥ 0.7 were subjected to haplotype analysis, resulting in two major haplotype variants (n ≥ 27). Furthermore, the allelic effect of the CR and SRA (qSRA-6A) QTLs on stay-green and yield was investigated by comparing the performance of genotypes that were segregated for the QTL. Genotypes that carried both favorable alleles for SRA and CR QTL were compared to genotypes that lacked both alleles using Tukey’s HSD (honestly significant difference) test with a family-wise error rate of 5%.

4.7. Alignment of QTL for Aboveground Traits Across Studies
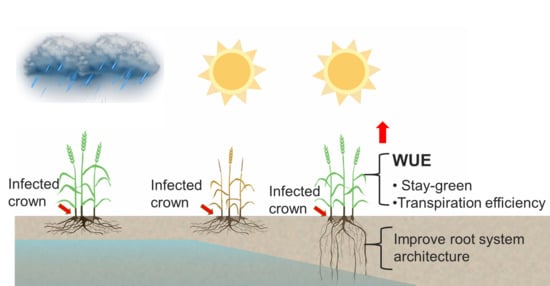
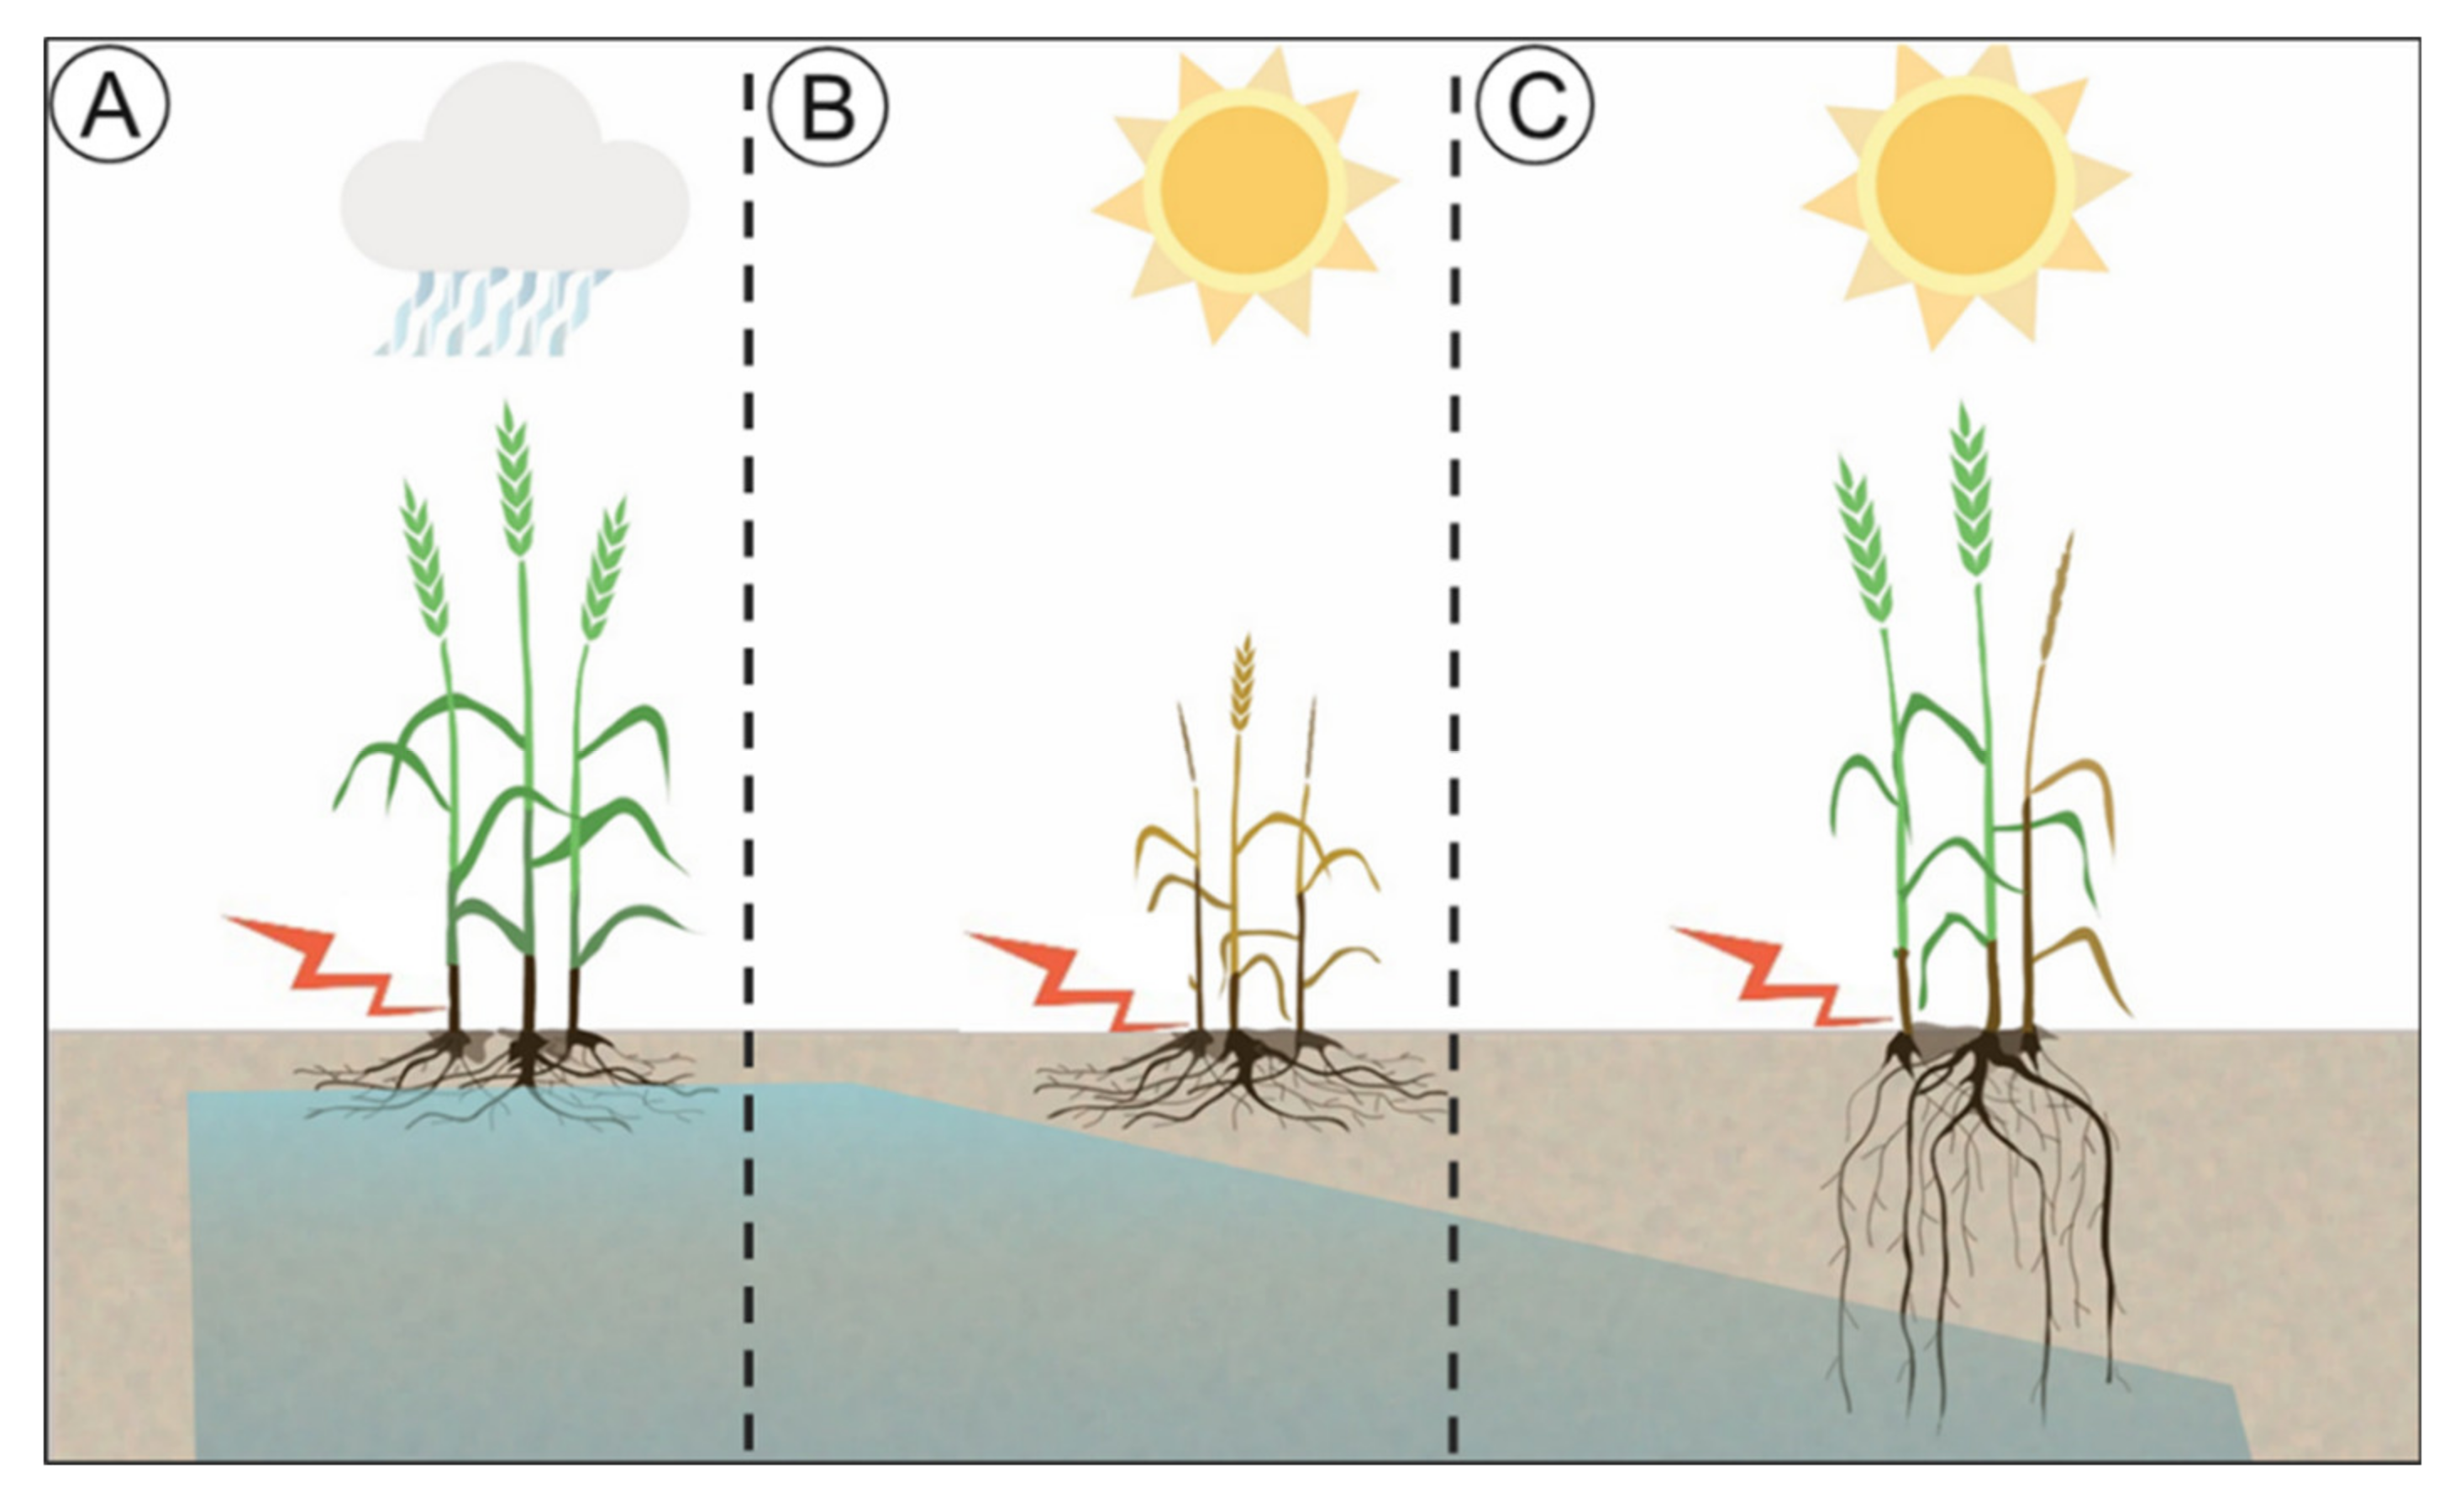
The QTLs identified in this study were aligned with genomic regions previously reported in the literature for key drought-related traits; pathogen susceptibility, yield as well as grain quality [42,43,44,45,46] were positioned on the Svevo durum physical map [41] using MapChart V2.3 [62].

5. Conclusions

This research investigated the value of above- and belowground adaptive traits to improve durum yield in rainfed production systems with and without CR disease. This study demonstrated that traits related to water-use efficiency and access to water, such as stay-green and root system architecture, can improve crop performance and can reduce losses due to drought and CR stress. Interestingly, the 6B QTL region (100.50–101.26 cm) initially mapped for tolerance to CR and yield was also associated with stay-green in the presence of CR and increased root biomass under controlled conditions. This suggests that genes underlying the QTL could modulate the size of the canopy and/or root system size to improve water-use efficiency and could reduce the impact of CR disease. The 6B locus appears to be independent to the major root angle locus qSRA-6A [39], which highlights the opportunity to combine traits that optimize canopy and root system architecture to enhance the performance of durum crops under abiotic and biotic constraints.

Supplementary Materials

Supplementary materials can be found at https://www.mdpi.com/1422-0067/21/15/5260/s1.

Author Contributions

Conceptualization and design of experiments, S.A. and L.T.H.; data analysis, S.A., E.D. and E.M.; data curation, S.A.; funding acquisition, S.A., J.A.A., F.M.B. and L.T.H.; investigation, S.A. and L.T.H.; methodology, S.A. and L.T.H.; resources, J.A.A., F.M.B. and L.T.H.; supervision, K.P.V.-F., J.A.A., J.C., F.M.B. and L.T.H.; visualization S.A. and E.D.; writing—original draft S.A.; writing—review and editing S.A., Y.K., E.D., E.M., K.P.V.-F., J.A.A., F.M.B., J.C. and L.T.H. All authors have read and agreed to the published version of the manuscript.

Funding

S.A. was supported by Monsanto’s Beachell-Borlaug International Scholars Program (MBBISP) Iowa, the USA and by a Ph.D. scholarship from The University of Queensland, Australia (UQRS). LH was supported through an Early Career Discovery Research Award (DE170101296) from the Australian Research Council. S.A. is currently funded by a Postdoctoral Research Fellowship through the Grain Research and Development Corporation (GRDC; 9177334 UOQ1903-007RTX).

Acknowledgments

The authors wish to acknowledge the field staff and glasshouse services staff who supported the experiments conducted in this study.

Conflicts of Interest

The authors declare no conflict of interest. The funders had no role in the design of the study; in the collection, analyses or interpretation of data; in the writing of the manuscript; or in the decision to publish the results.

References

  1. Araus, J.L.; Slafer, G.A.; Reynolds, M.P.; Royo, C. Plant breeding and drought in C3 cereals: What should we breed for? Ann. Bot. 2002, 89, 925–940. [Google Scholar] [CrossRef] [PubMed]
  2. Christensen, J.H.; Hewitson, B.; Busuioc, A.; Chen, A.; Gao, X.; Held, R.; Jones, R.K.; Kolli, W.-T.; Kwon, R.; Laprise, V.; et al. Regional Climate Projections. In Climate Change 2007: The Physical Science Basis. Contribution of Working Group I to the Fourth Assessment Report of the Intergovernmental Panel on Climate Change; Solomon, S., Qin, D., Manning, M., Chen, Z., Marquis, M., Averyt, K.B., Tignor, M., Miller, H.S., Eds.; Cambridge University Press: Cambridge, UK; New York, NY, USA, 2007. [Google Scholar]
  3. Verrell, A.G.; Simpfendorfer, S.; Moore, K.J. Effect of row placement, stubble management and ground engaging tool on crown rot and grain yield in a no-till continuous wheat sequence. Soil Tillage Res. 2017, 165, 16–22. [Google Scholar] [CrossRef]
  4. Voss-Fels, K.P.; Qian, L.; Gabur, I.; Obermeier, C.; Hickey, L.T.; Werner, C.R.; Kontowski, S.; Frisch, M.; Friedt, W.; Snowdon, R.J.; et al. Genetic insights into underground responses to Fusarium graminearum infection in wheat. Sci. Rep. 2018, 8, 13153. [Google Scholar] [CrossRef] [PubMed]
  5. Hollaway, G.J.; Evans, M.L.; Wallwork, H.; Dyson, C.B.; Mckay, A.C. Yield loss in cereals, caused by Fusarium culmorum and f. Pseudograminearum, is related to fungal DNA in soil prior to planting, rainfall, and cereal type. Plant. Dis. 2013, 97, 977–982. [Google Scholar] [CrossRef] [PubMed] [Green Version]
  6. Backhouse, D.; Abubakar, A.A.; Burgess, L.W.; Dennis, J.I.; Hollaway, G.J.; Wildermuth, G.B.; Wallwork, H.; Henry, F.J. Survey of fusarium species associated with crown rot of wheat and barley in eastern Australia. Australas. Plant. Pathol. 2004, 332, 255–261. [Google Scholar] [CrossRef] [Green Version]
  7. Smiley, R.W.; Patterson, L.M. Pathogenic fungi associated with Fusarium foot rot of winter wheat in the semi-arid Pacific Northwest. Plant. Dis. 1996, 80, 944–949. [Google Scholar] [CrossRef]
  8. Smiley, R.W.; Gourlie, J.A.; Easley, S.A.; Patterson, L.M.; Whittaker, R.G. Crop damage estimates for crown rot of wheat and barley in the pacific northwest. Plant. Dis. 2005, 89, 595–604. [Google Scholar] [CrossRef] [Green Version]
  9. Burgess, L.W.; Backhouse, D.; Summerell, B.A. Crown Rot of Wheat. In Fusarium: Paul, E. Nelson Memorial Symposium; Summerell, B.A., Leslie, J.F., Backhouse, D., Bryden, W.L., Burgess, L.W., Eds.; APS Press: St Paul, MN, USA, 2001; pp. 271–294. [Google Scholar]
  10. Tunali, B.; Nicol, J.; Hodson, D.; Uckun, Z.; Büyük, O.; Erdurmus, D.; Hekimhan, H.; Aktaş, H.; Akbudak, M.; Bağci, A. Root and Crown Rot Fungi Associated with Spring, Facultative, and Winter Wheat in Turkey. Plant. Dis. 2008, 929, 1299–1306. [Google Scholar] [CrossRef]
  11. Zheng, Z.; Ma, J.; Stiller, J.; Zhao, Q.; Feng, Q.; Choulet, F.; Feuillet, C.; Zheng, Y.; Wei, Y.; Han, B.; et al. Fine mapping of a large-effect QTL conferring Fusarium crown rot resistance on the long arm of chromosome 3B in hexaploid wheat. BMC Genomics 2015, 161, 850. [Google Scholar] [CrossRef] [Green Version]
  12. Knight, N.L.; Sutherland, M.W. Histopathological assessment of Fusarium pseudograminearum colonization of cereal culms during crown rot infections. Plant. Dis. 2016, 100, 252–259. [Google Scholar] [CrossRef] [Green Version]
  13. Alahmad, S.; Simpfendorfer, S.; Bentley, A.R.; Hickey, L.T. Crown rot of wheat in Australia: Fusarium pseudograminearum taxonomy, population biology and disease management. Australas. Plant. Pathol. 2018, 47, 285–299. [Google Scholar] [CrossRef]
  14. Klien, T.A.; Burgeess, L.W.; Ellison, E.W. The incidence and spatial patterns of wheat plants infected by Fusarium graminearum Group 1 and the effect of crown rot on yield. Aust. J. Agric. Res. 1991, 42, 399–407. [Google Scholar] [CrossRef]
  15. Kazan, K.; Gardiner, D.M. Fusarium crown rot caused by Fusarium pseudograminearum in cereal crops: Recent progress and future prospects. Mol. Plant. Path. 2018, 19, 1547–1562. [Google Scholar] [CrossRef] [PubMed] [Green Version]
  16. Hollaway, G.J.; Exell, G.K. Survey of wheat crops for whiteheads caused by crown rot in victoria, 1997–2009. Australas. Plant. Pathol. 2010, 39, 363–367. [Google Scholar] [CrossRef]
  17. Chekali, S.; Gargouri, S.; Paulitz, T.; Nicol, J.M.; Rezgui, M.; Nasraoui, B. Effects of fusarium culmorum and water stress on durum wheat in Tunisia. Crop Prot. 2011, 30, 718–725. [Google Scholar] [CrossRef]
  18. Graham, R. Fusarium crown rot of wheat-impact on plant available soil water usage. In Proceedings of the 17th Australian Agronomy Conference, Hobart, Australia, 20–24 September 2015; pp. 103–105. [Google Scholar]
  19. Liu, C.J.; Ogbonnaya, F.C. Resistance to fusarium crown rot in wheat and barley: A review. Plant. Breed. 2015, 134, 365–372. [Google Scholar] [CrossRef]
  20. Liu, X.; Liu, C. Effects of drought-stress on Fusarium crown rot development in Barley. PLoS ONE 2016, 11, e0167304. [Google Scholar] [CrossRef] [Green Version]
  21. Felton, W.L.; Marcellos, H.; Alston, C.; Martin, R.J.; Backhouse, D.; Burgess, L.W.; Herridge, D.F. Chickpea in wheat-based cropping systems of northern new south wales—II. Influence on biomass, grain yield, and crown rot in the following wheat crop. Aust. J. Agric. Res. 1998, 49, 401–407. [Google Scholar] [CrossRef]
  22. Wildermuth, G.B.; Mcnamara, R.B.; Quick, J.S. Crown depth and susceptibility to crown rot in wheat. Euphytica 2001, 122, 397–405. [Google Scholar] [CrossRef]
  23. Simpfendorfer, S.; Kirkegaard, J.A.; Holland, J.; Verrell, A.; Bambach, R.; Moore, K.J. Managing soil and stubble-borne cereal pathogens in the northern grains belt. In Proceedings of the Soil Biology in Agriculture Workshop, Tamworth, Australia, 11–12 August 2004; pp. 112–119. [Google Scholar]
  24. Verrell, A.; Simpfendorfer, S.; Nash, P.; Moore, K. Can inter-row sowing be used in continuous wheat systems to control crown rot and increase yield? In Proceedings of the 13th Annual Symposium on precision Agriculture in Australasia, Armidale, Australia, 10–11 September 2009. [Google Scholar]
  25. Simpfendorfer, S.; Brettell, R.; Nicol, J. Inter-row sowing reduces crown rot in winter cereals. In Proceedings of the First International Crown Rot Workshop for wheat improvement (Organising Committee of the 1st International Crown Rot Workshop), Narrabri, Australia, 22–23 October 2012. [Google Scholar]
  26. Simpfendorfer, S.; Gardner, M. Crown Rot: Be Aware of the Balancing Act or the Fall May Be Harder. GRDC Update Papers 25 Feb. 2013. Available online: http://www.grdc.com.au/Research-and-Development/GRDC-Update-Papers/2013/02/Crown-rot-be-aware-of-the-balancing-act-or-the-fall-may-be-harder (accessed on 22 July 2020).
  27. Krishnamurthy, L.; Kashiwagi, J.; Upadhyaya, H.D.; Gowda, C.L.L.; Gaur, P.M.; Singh, S.; Purushothaman, R.; Varshney, R.K. Partitioning coefficient—A trait that contributes to drought tolerance in chickpea. Field Crops Res. 2013, 149, 354–365. [Google Scholar] [CrossRef] [Green Version]
  28. Krishnamurthy, L.; Gaur, P.M.; Basu, P.S.; Chaturvedi, S.K.; Tripathi, S.; Vadez, V.; Rathore, A.; Varshney, R.K.; Gowda, C.L.L. Large genetic variation for heat in the reference collection of chickpea (Cicer arietinum L.) germplasm. Plant. Genet. Resour. 2011, 9, 59–69. [Google Scholar] [CrossRef] [Green Version]
  29. Christopher, J.; Richard, C.; Chenu, K.; Christopher, M.; Borrell, A.; Hickey, L. Integrating rapid phenotyping and speed breeding to improve stay green and root adaptation of wheat in changing, water-limited, Australian environments. Procedia Environ. Sci. 2015, 29, 175–176. [Google Scholar] [CrossRef] [Green Version]
  30. Christopher, J.T.; Christopher, M.J.; Borrell, A.K.; Fletcher, S.; Chenu, K. Stay-green traits to improve wheat adaptation in well-watered and water-limited environments. J. Exp. 2016, 67, 5159–5172. [Google Scholar] [CrossRef] [PubMed] [Green Version]
  31. Gous, P.W.; Hasjim, J.; Franckowiak, J.; Fox, G.P.; Gilbert, R.G. Barley genotype expressing “stay-green”-like characteristics maintains starch quality of the grain during water stress condition. J. Cereal Sci. 2013, 58, 414–419. [Google Scholar] [CrossRef]
  32. Jordan, D.R.; Hunt, C.H.; Cruickshank, A.W.; Borrell, A.K.; Henzell, R.G. The relationship between the stay-green trait and grain yield in elite sorghum hybrids grown in a range of environments. Crop Sci. 2012, 52, 1153–1161. [Google Scholar] [CrossRef]
  33. Borrell, A.K.; Van Oosterom, E.J.; Mullet, J.E.; George-Jaeggli, B.; Jordan, D.R.; Klein, P.E.; Hammer, G.L. Stay-green alleles individually enhance grain yield in sorghum under drought by modifying canopy development and water uptake patterns. New Phytol. 2014, 203, 817–830. [Google Scholar] [CrossRef] [PubMed]
  34. Hammer, G.L.; Dong, Z.; Mclean, G.; Doherty, A.; Messina, C.; Schussler, J.; Zinselmeier, C.; Paszkiewicz, S.; Cooper, M. Can changes in canopy and/or root system architecture explain historical maize yield trends in the US corn belt? Crop Sci. 2009, 49, 299–312. [Google Scholar] [CrossRef]
  35. Borrell, A.K.; Mullet, J.E.; George-Jaeggli, B.; Van Oosterom, E.J.; Hammer, G.L.; Klein, P.E.; Jordan, D.R. Drought adaptation of stay-green sorghum is associated with canopy development, leaf anatomy, root growth, and water uptake. J. Exp. Bot. 2014, 65, 6251–6263. [Google Scholar] [CrossRef]
  36. Tuberosa, R.; Giuliani, S.; Parry, M.A.J.; Araus, J.L. Improving water use efficiency in Mediterranean agriculture: What limits the adoption of new technologies? Ann. Appl. Biol. 2007, 150, 157–162. [Google Scholar] [CrossRef]
  37. Maccaferri, M.; El-Feki, W.; Nazemi, G.; Salvi, S.; Cane, M.A.; Colalongo, M.C.; Stefanelli, S.; Tuberosa, R. Prioritizing quantitative trait loci for root system architecture in tetraploid wheat. J. Exp. 2016, 67, 1161–1178. [Google Scholar] [CrossRef]
  38. Roselló, M.; Royo, C.; Sanchez-Garcia, M.; Soriano, J.M.J.A. Genetic dissection of the seminal root system architecture in Mediterranean durum wheat landraces by genome-wide association study. Agronomy 2019, 9, 364. [Google Scholar] [CrossRef] [Green Version]
  39. Alahmad, S.; El Hassouni, K.; Bassi, F.M.; Dinglasan, E.; Youssef, C.; Quarry, G.; Aksoy, A.; Mazzucotelli, E.; Juhasz, A.; Able, J.A.; et al. A major root architecture qtl responding to water limitation in durum wheat. Front. Plant. Sci. 2019, 10, 436. [Google Scholar] [CrossRef] [PubMed] [Green Version]
  40. Alahmad, S.; Dinglasan, E.; Leung, K.M.; Riaz, A.; Derbal, N.; Voss-Fels, K.P.; Able, J.A.; Bassi, F.M.; Christopher, J.; Hickey, L.T. Speed breeding for multiple quantitative traits in durum wheat. Plant. Methods 2018, 14, 36. [Google Scholar] [CrossRef] [PubMed]
  41. Maccaferri, M.; Harris, N.S.; Twardziok, S.O.; Pasam, R.K.; Gundlach, H.; Spannagl, M.; Ormanbekova, D.; Lux, T.; Prade, V.M.; Milner, S.G.; et al. Durum wheat genome highlights past domestication signatures and future improvement targets. Nat. Genet. 2019, 51, 885–895. [Google Scholar] [CrossRef] [Green Version]
  42. Maccaferri, M.; Sanguineti, M.C.; Corneti, S.; Ortega, J.L.; Salem, M.B.; Bort, J.; Deambrogio, E.; Del Moral, L.F.; Demontis, A.; El-Ahmed, A.; et al. Quantitative trait loci for grain yield and adaptation of durum wheat (Triticum durum desf.) across a wide range of water availability. Genetics 2008, 178, 489–511. [Google Scholar] [CrossRef] [Green Version]
  43. Ghavami, F.; Elias, E.M.; Mamidi, S.; Ansari, O.; Sargolzaei, M.; Adhikari, T.; Mergoum, M.; Kianian, S.F. Mixed model association mapping for fusarium head blight resistance in Tunisian-derived durum wheat populations. G3-Genes Genom Genet. 2011, 1, 209–218. [Google Scholar] [CrossRef]
  44. Peleg, Z.; Fahima, T.; Korol, A.B.; Abbo, S.; Saranga, Y. Genetic analysis of wheat domestication and evolution under domestication. J. Exp. 2011, 62, 5051–5061. [Google Scholar] [CrossRef] [Green Version]
  45. Blanco, A.; Mangini, G.; Giancaspro, A.; Giove, S.; Colasuonno, P.; Simeone, R.; Signorile, A.; De Vita, P.; Mastrangelo, A.M.; Cattivelli, L.; et al. Relationships between grain protein content and grain yield components through quantitative trait locus analyses in a recombinant inbred line population derived from two elite durum wheat cultivars. Mol. Breed. 2012, 30, 79–92. [Google Scholar] [CrossRef]
  46. Prat, N.; Buerstmayr, M.; Steiner, B.; Robert, O.; Buerstmayr, H. Current knowledge on resistance to fusarium head blight in tetraploid wheat. Mol. Breed. 2014, 34, 1689–1699. [Google Scholar] [CrossRef]
  47. Mengistu, D.K.; Kidane, Y.G.; Catellani, M.; Frascaroli, E.; Fadda, C.; Pè, M.E.; Dell’acqua, M. High-density molecular characterization and association mapping in Ethiopian durum wheat landraces reveal high diversity and potential for wheat breeding. Plant. Biotechnol. J. 2016, 14, 1800–1812. [Google Scholar] [CrossRef] [Green Version]
  48. Colasuonno, P.; Lozito, M.L.; Marcotuli, I.; Nigro, D.; Giancaspro, A.; Mangini, G.; De Vita, P.; Mastrangelo, A.M.; Pecchioni, N.; Houston, K. The carotenoid biosynthetic and catabolic genes in wheat and their association with yellow pigments. BMC Genomics 2017, 18, 122. [Google Scholar] [CrossRef] [PubMed] [Green Version]
  49. Manschadi, A.M.; Christopher, J.; Devoil, P.; Hammer, G.L. The role of root architectural traits in adaptation of wheat to water-limited environments. Funct. Plant. Biol. 2006, 33, 823–837. [Google Scholar] [CrossRef] [PubMed] [Green Version]
  50. El Hassouni, K.; Alahmad, S.; Belkadi, B.; Filali-Maltouf, A.; Hickey, L.; Bassi, F. Root system architecture and its association with yield under different water regimes in durum wheat. Crop Sci. 2018, 58, 2331–2346. [Google Scholar] [CrossRef] [Green Version]
  51. Robinson, H.; Kelly, A.; Fox, G.; Franckowiak, J.; Borrell, A.; Hickey, L. Root architectural traits and yield: Exploring the relationship in barley breeding trials. Euphytica 2018, 214, 151. [Google Scholar] [CrossRef]
  52. Voss-Fels, K.P.; Robinson, H.; Mudge, S.R.; Richard, C.; Newman, S.; Wittkop, B.; Stahl, A.; Friedt, W.; Frisch, M.; Gabur, I.; et al. VERNALIZATION1 modulates root system architecture in wheat and barley. Mol. Plant. 2018, 11, 226–229. [Google Scholar] [CrossRef] [PubMed] [Green Version]
  53. Mace, E.S.; Singh, V.; Van Oosterom, E.J.; Hammer, G.L.; Hunt, C.H.; Jordan, D.R. Qtl for nodal root angle in sorghum (Sorghum bicolor l. Moench) co-locate with qtl for traits associated with drought adaptation. Theor. Appl. Genet. 2012, 124, 97–109. [Google Scholar] [CrossRef] [Green Version]
  54. Borrell, A.K.; Hammer, G.L.; Henzell, R.G. Does maintaining green leaf area in sorghum improve yield under drought? II. Dry matter production and yield. Crop Sci. 2000, 40, 1037–1048. [Google Scholar] [CrossRef]
  55. Cullis, B.R.; Smith, A.B.; Coombes, N.E. On the design of early generation variety trials with correlated data. J. Agric. Biol. Environ. Stat. 2006, 11, 381. [Google Scholar] [CrossRef]
  56. Lopes, M.S.; Reynolds, M.P. Stay-green in spring wheat can be determined by spectral reflectance measurements (normalized difference vegetation index) independently from phenology. J. Exp. Bot. 2012, 63, 3789–3798. [Google Scholar] [CrossRef] [Green Version]
  57. Voss-Fels, K.P.; Qian, L.; Parra-Londono, S.; Uptmoor, R.; Frisch, M.; Keeble-Gagnere, G.; Appels, R.; Snowdon, R.J. Linkage drag constrains the roots of modern wheat. Plant. Cell Environ. 2017, 40, 717–725. [Google Scholar] [CrossRef]
  58. Butler, D.; Cullis, B.R.; Gilmour, A.; Gogel, B. Asreml-R Reference Manual; The State of Queensland, Department of Primary Industries and Fisheries: Brisbane, Australia, 2009. [Google Scholar]
  59. R Core Team. R Language Definition; R Foundation for Statistical Computing: Vienna, Austria, 2000. [Google Scholar]
  60. Aulchenko, Y.S.; Ripke, S.; Isaacs, A.; Van Duijn, C.M. Genabel: An r library for genome-wide association analysis. Bioinformatics 2007, 23, 1294–1296. [Google Scholar] [CrossRef] [PubMed] [Green Version]
  61. Stich, B.; Mohring, J.; Piepho, H.P.; Heckenberger, M.; Buckler, E.S.; Melchinger, A.E. Comparison of mixed-model approaches for association mapping. Genetics 2008, 178, 1745–1754. [Google Scholar] [CrossRef] [PubMed] [Green Version]
  62. Voorrips, R.E. Mapchart: Software for the graphical presentation of linkage maps and QTLs. J. Hered. 2002, 93, 77–78. [Google Scholar] [CrossRef] [PubMed] [Green Version]
Figure 1. Illustration displaying the effect of crown rot infection on yield under different scenarios: (A) Minimum yield losses when water is available through the growing season, i.e., intermittent rainfall events. (B) Maximum yield losses when water is limited, and the root system architecture is not designed to reach moisture at depth. (C) Less severe yield losses achieved under water-limited conditions when there are optimised below and aboveground trait combinations (i.e., root system architecture and stay-green).
Ijms 21 05260 g001
Figure 2. The Pearson’s correlation matrix displays (A) stay-green trait correlations with yield in the presence of and (B) absence of crown rot in 2017 Warwick, Queensland. The colour gradient of ellipses indicates positive correlations (green) and negative correlations (brown) while the absence of an ellipse indicates that the correlation was not significant (p ≥ 0.05). Traits include yield (GY) in tonnes per hectare; PH, plant height; DTF, number of days to flowering; TKW, thousand kernel weight; OnS, number of days from flowering until 10% senescence; MidS, number of days from flowering time until 50% senescence; EndS, number of days from flowering time until 90% senescence; and SGint, area under the curve modelled senescence curve from flowering time to complete senescence.
Ijms 21 05260 g002
Figure 3. Haplotype effects of seminal root angle quantitative trait loci (QTL) qSRA-6A on (A) stay-green (SGint) and (B) yield (GY) in the absence of crown rot (CR): Haplotype effects of qSRA-6A on (C) SGint and (D) GY in the presence of CR. Significance levels for comparisons of two major haplotypes are indicated at the levels p ≤ 0.001 (***) and p ≤ 0.01 (**). No significant difference between qSRA-6A-hap1 and qSRA-6A-hap2 was noted for SGint as well as GY in the presence of CR. In the boxplots, the line is the median, the box are the bounds for the lower and upper quartile values Q1 = 25% and Q3 = 75 respectively, while the lines below and above indicate the extreme values; values outside the lines are outliers.
Ijms 21 05260 g003
Figure 4. The panel illustrates (A) crown rot (CR) severity during the grain filling stage with 5% (left) and 95% whiteheads (right). (B) The Manhattan plot shows significant marker-trait association (green) at an arbitrary threshold: −log10(P) ≥ 3 (blue horizontal line). The x-axis displays the DArTseq markers on 14 chromosomes; the y-axis is −log10(P). The local linkage disequilibrium (LD) block for 5 significant markers representing the CR QTL “qCR-6AB” was used for constructing the haplotype network. A total of 26 haplotype variants of the qCR-6B for 168 genotypes was observed, and the two major haplotype groups were used for investigating root biomass, stay-green and yield performance under different environments. (C) The significant differences between the hap1 variant (favorable allele in green) and hap2 variant (unfavorable allele in yellow) of qCR-6B is presented in boxplots. For haplotype trait comparisons, the significance level is indicated as *** (p < 0.001), ** (p < 0.01) and * (p < 0.05). (D) A section of chromosome 6B (60–125 cm) displaying the location of QTL was identified in this study along with a previously reported QTL positioned on the Svevo durum physical map. Genomic regions controlling CR severity and symptoms (whiteheads), stay-green and yield from this study (green) were aligned with previously reported QTL associated with traits such as root growth angle, Fusarium head blight (FHB), grain quality and yield (blue).
Ijms 21 05260 g004
Figure 5. Comparison of genotypes that are segregating for root angle QTL (qSRA-6A) and CR QTL (qCR-6B): The genotypes were evaluated in the field across six environments (four in the absence of CR and two in the presence of CR). Green indicates the performance of genotypes that carry the resistant allele CRhap1 and wide root angle RAhap2. Orange indicates the performance of genotypes that carry the susceptible allele CRhap2 and narrow root angle allele RAhap1. Statistical tests were performed for haplotype groups within each environment, where the significance level is indicated as ** (p < 0.01) and * (p < 0.05). The mean yield benefit in the presence of CR was 1.1 t·h1, whereas the mean yield benefit in the absence of CR across the four environments was 0.57 t·h1.
Ijms 21 05260 g005
Table 1. Trait minimum (Min), maximum (Max), adjusted mean response, broad sense heritability (H2) and coefficient of variation (CV%) for 168 genotypes evaluated in the presence and absence of crown rot in 2017 Warwick, Queensland.
TraitsCrown Rot PresentCrown Rot Absent
MinMaxAdjusted MeanH2CV %MinMaxAdjusted MeanH2CV %
Yield (GY; t·h−1)0.583.942.300.6727.03.56.44.90.6813.4
Plant height (PH; cm)52.995.866.70.458.748.085.563.40.798.9
Time to flowering (DTF; d)99.7112.4106.80.182.096.6106.4101.10.312.2
Thousand kernel weight (TKW; g)28.348.737.70.7711.232.553.841.90.7211.0
Onset of leaf senescence (OnS; d)7.019.06.50.4113.44.726.916.70.5411.3
Mid-point of leaf senescence (MidS; d)5.326.916.80.4826.915.631.825.30.4513.4
Near completion of leaf senescence (EndS; d)19.247.730.00.2516.529.243.336.30.268.3
Stay-green integral (SGint)16.429.823.00.511.020.430.824.90.479.9
CR severity (CR)2.38.85.90.2419.2NANANANANA
1st reading whiteheads (% WH1)1.165.221.30.4565.4NANANANANA
2nd reading whiteheads (% WH2)1.977.237.10.5748.0NANANANANA
Table 2. Summary of QTLs detected in the panel of 168 genotypes evaluated in the presence and absence of crown rot (CR) at Warwick in 2017.
Trait aQTL NameMarkerChromosomecm b−log10(P) cMarker Effect d
Plant heightqPH-6B9956146B2.193.425.339
10083686B2.193.375.305
EndSqSG-0.1-6B30259346B82.793.131.611
SGintqSG-integral-6B30259346B82.793.010.750
Yield (t·h−1)qGY-6B10233426B100.503.26−0.215
22541316B100.503.12−0.203
49921356B100.503.15−0.203
WH1qWH1-6B10233426B100.503.887.350
22541316B100.503.446.744
49921356B100.503.657.025
10398376B101.263.416.800
22563906B101.263.606.998
WH2qWH2-6B10233426B100.503.408.582
22541316B100.503.368.386
49921356B100.503.588.777
CR severityqCR-6B49921356B100.134.14−0.590
10233426B100.504.20−0.598
22541316B100.503.93−0.568
22563906B101.263.25−0.524
10398376B101.263.10−0.508
a Plant height measured in centimeters (cm); EndS is the number of days from flowering time to 90% senescence; SGint is the area under the curve of the stay-green model from flowering time to full senescence; t·h−1 is tons per hectare; WH1 and WH2 are the percentages of whiteheads due to CR infection within each plot collected at 4 and 2 weeks before physiological maturity, respectively; and CR severity is the crown rot severity index calculated using the two readings for percentage of whiteheads and stem browning. b Chromosomal positions based on the Svevo durum wheat map. c −log10(P), where a threshold of p < 0.001 was applied for significant marker-trait associations. d Positive or negative associations between different traits based on DArTseq alleles at each locus.
Table 3. Stay-green traits adopted from Christopher et al. [30] based on a fitted curve to the periodic normalized difference vegetation index (NDVI) measurement (number of days) collected from flowering time until full canopy senescence.
AbbreviationStay-Green TraitDescription
OnSOnset of leaf senescenceNumber of days from flowering to 90% of greenness
MidSMid-point of leaf senescenceNumber of days from flowering to 50% of greenness
EndSNear completion of leaf senescenceNumber of days from flowering to 10% of greenness
SGintStay-green integral (senescence integral)Total stay-green parameter referring to the green leaf area duration from flowering to full senescence

