Towards A Molecular Understanding of The Cannabinoid Related Orphan Receptor GPR18: A Focus on Its Constitutive Activity


Abstract
:1. Introduction
2. Results and Discussion
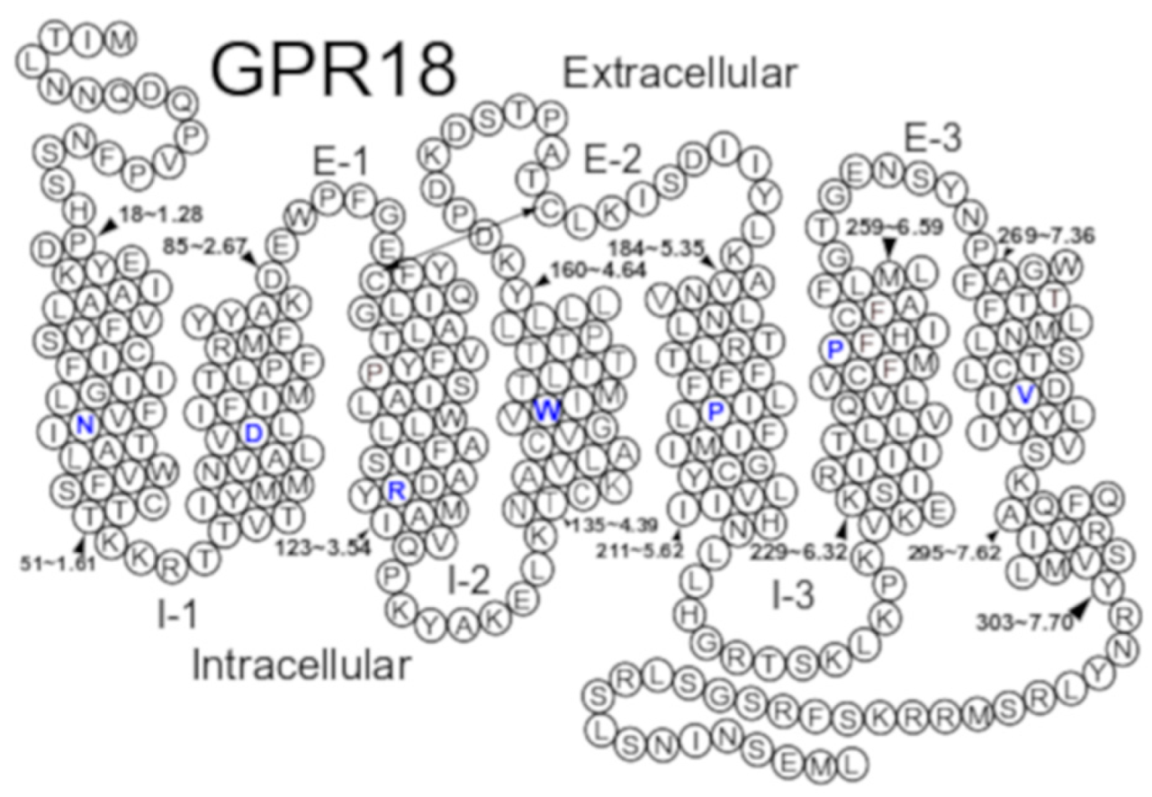
2.1. GPR18 Model Development
2.1.1. TMH3
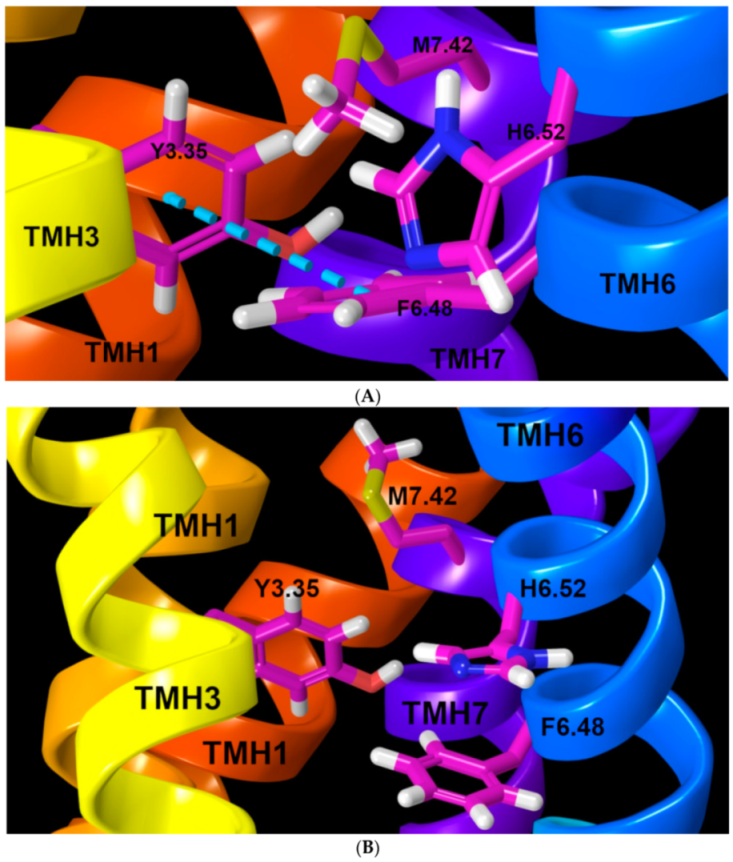
2.1.2. TMH7
2.1.3. GPR18 Activation
2.1.4. Ionic Lock and Toggle Switch
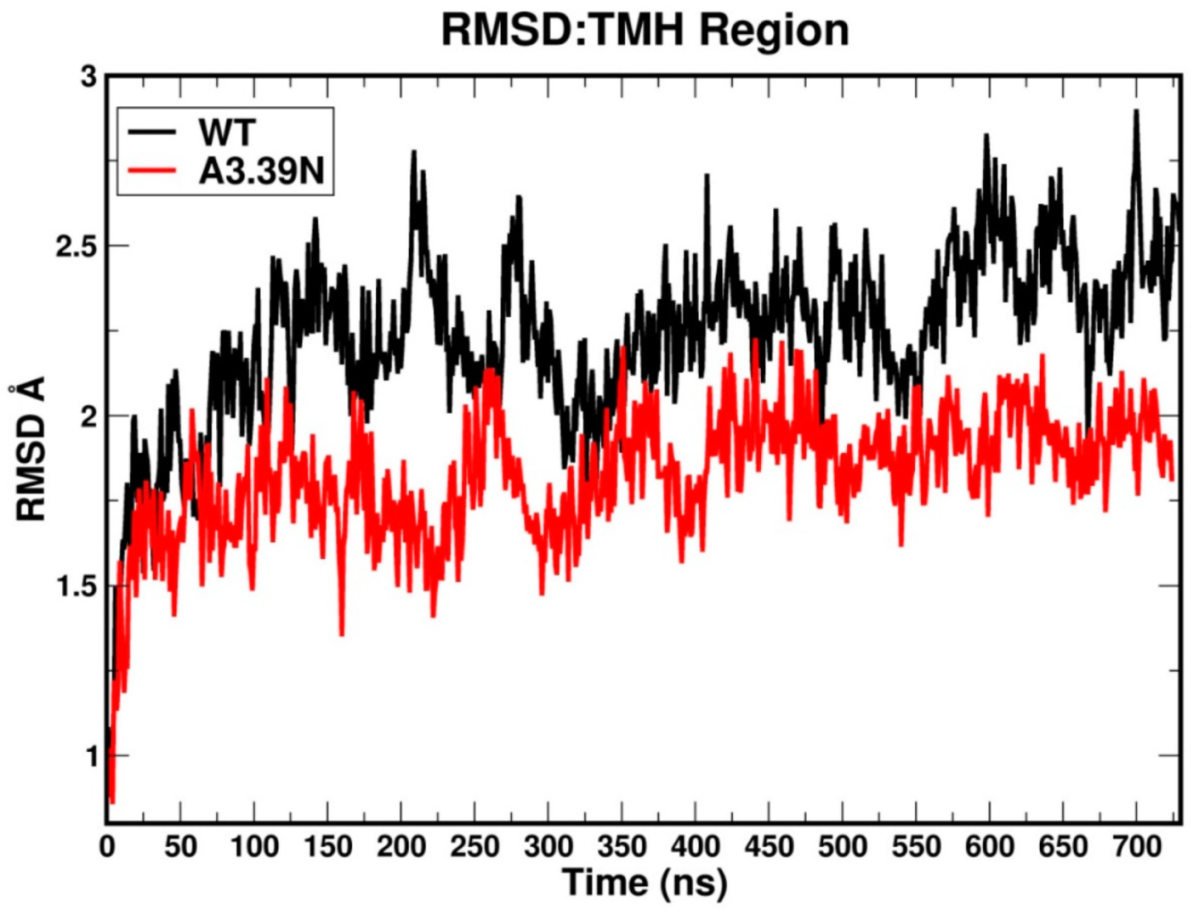
2.2. Molecular Dynamics: Structural Insights into Its Constitutive Activation
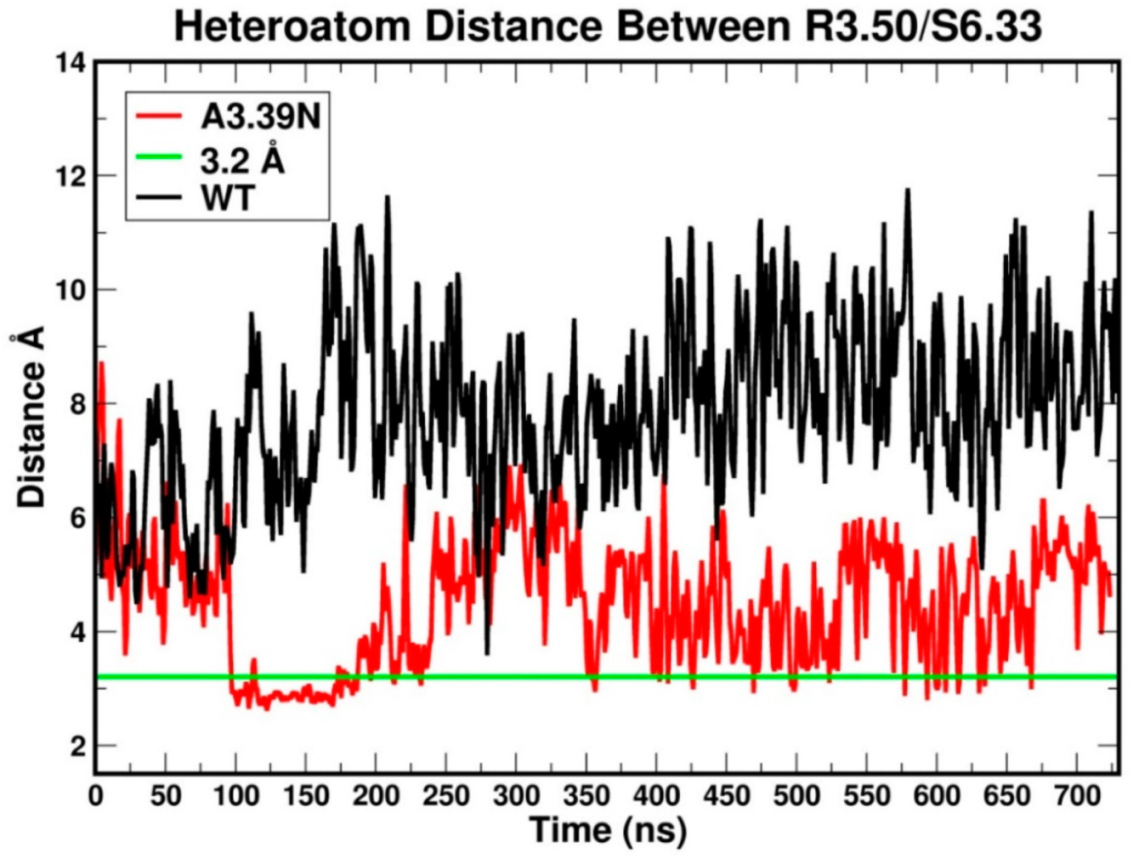
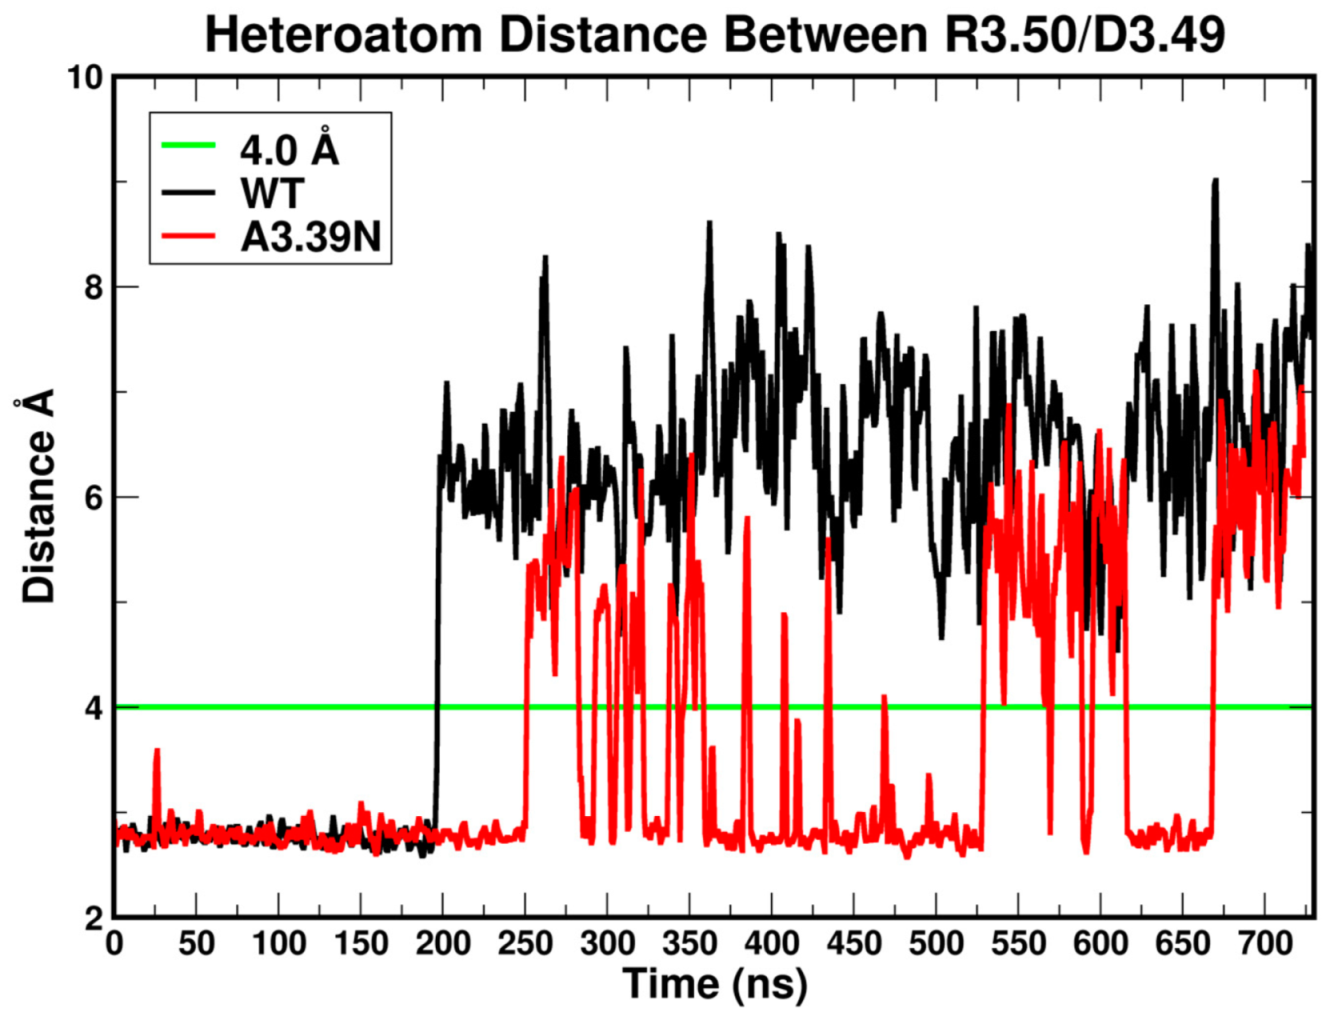
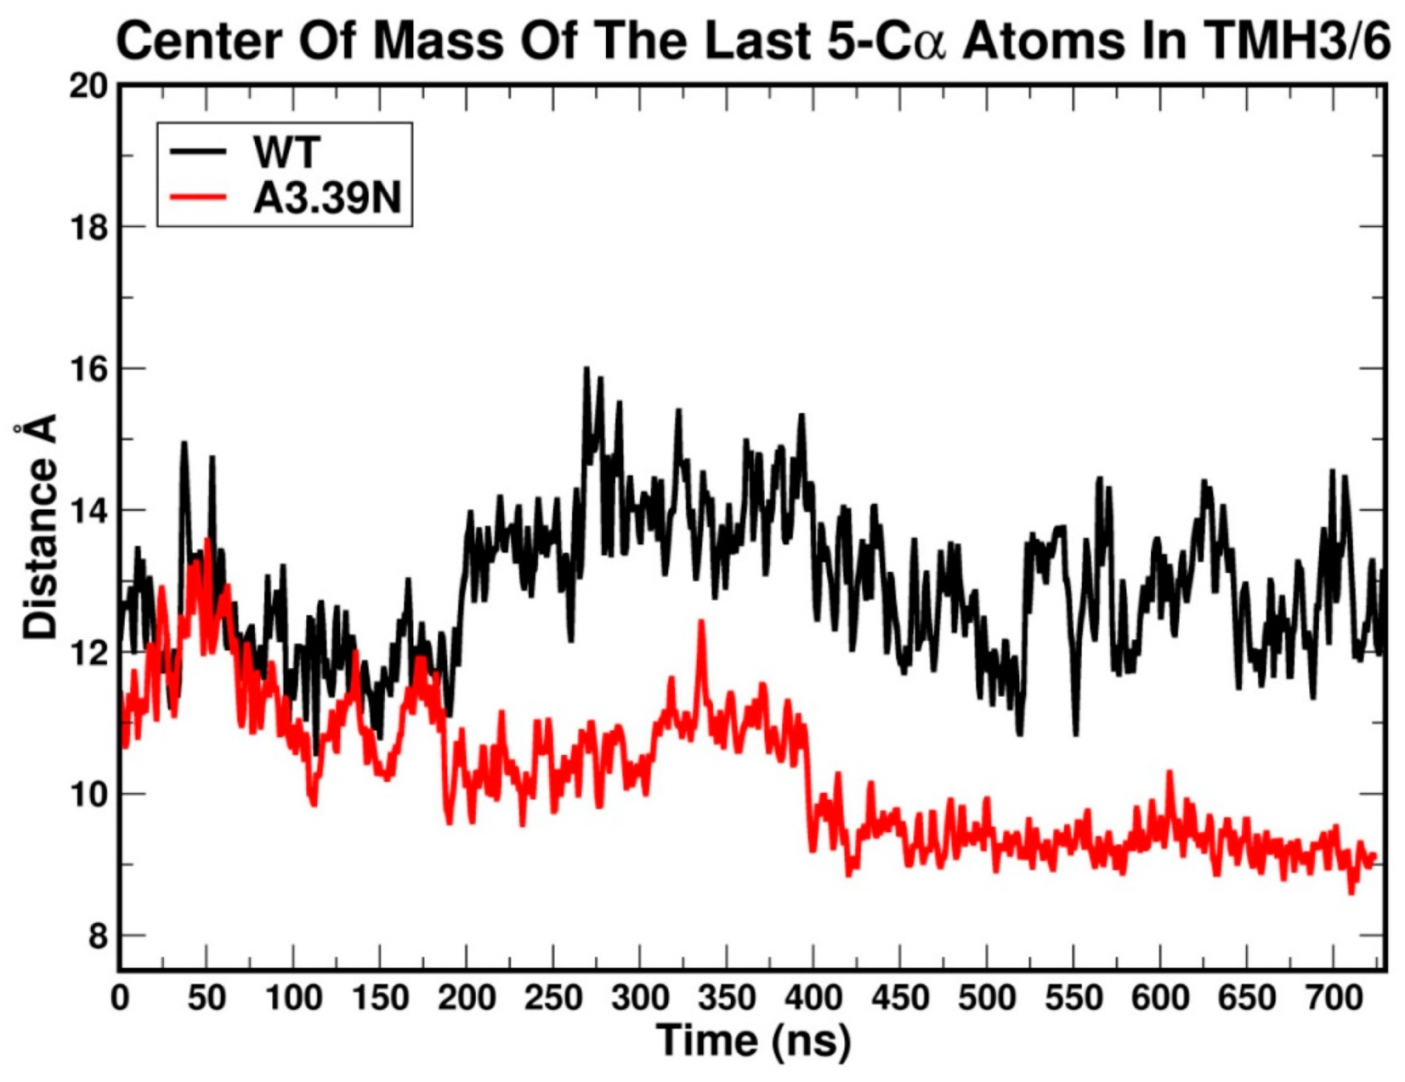
2.2.1. Ability to Maintain “Ionic Lock” and Arginine Cage
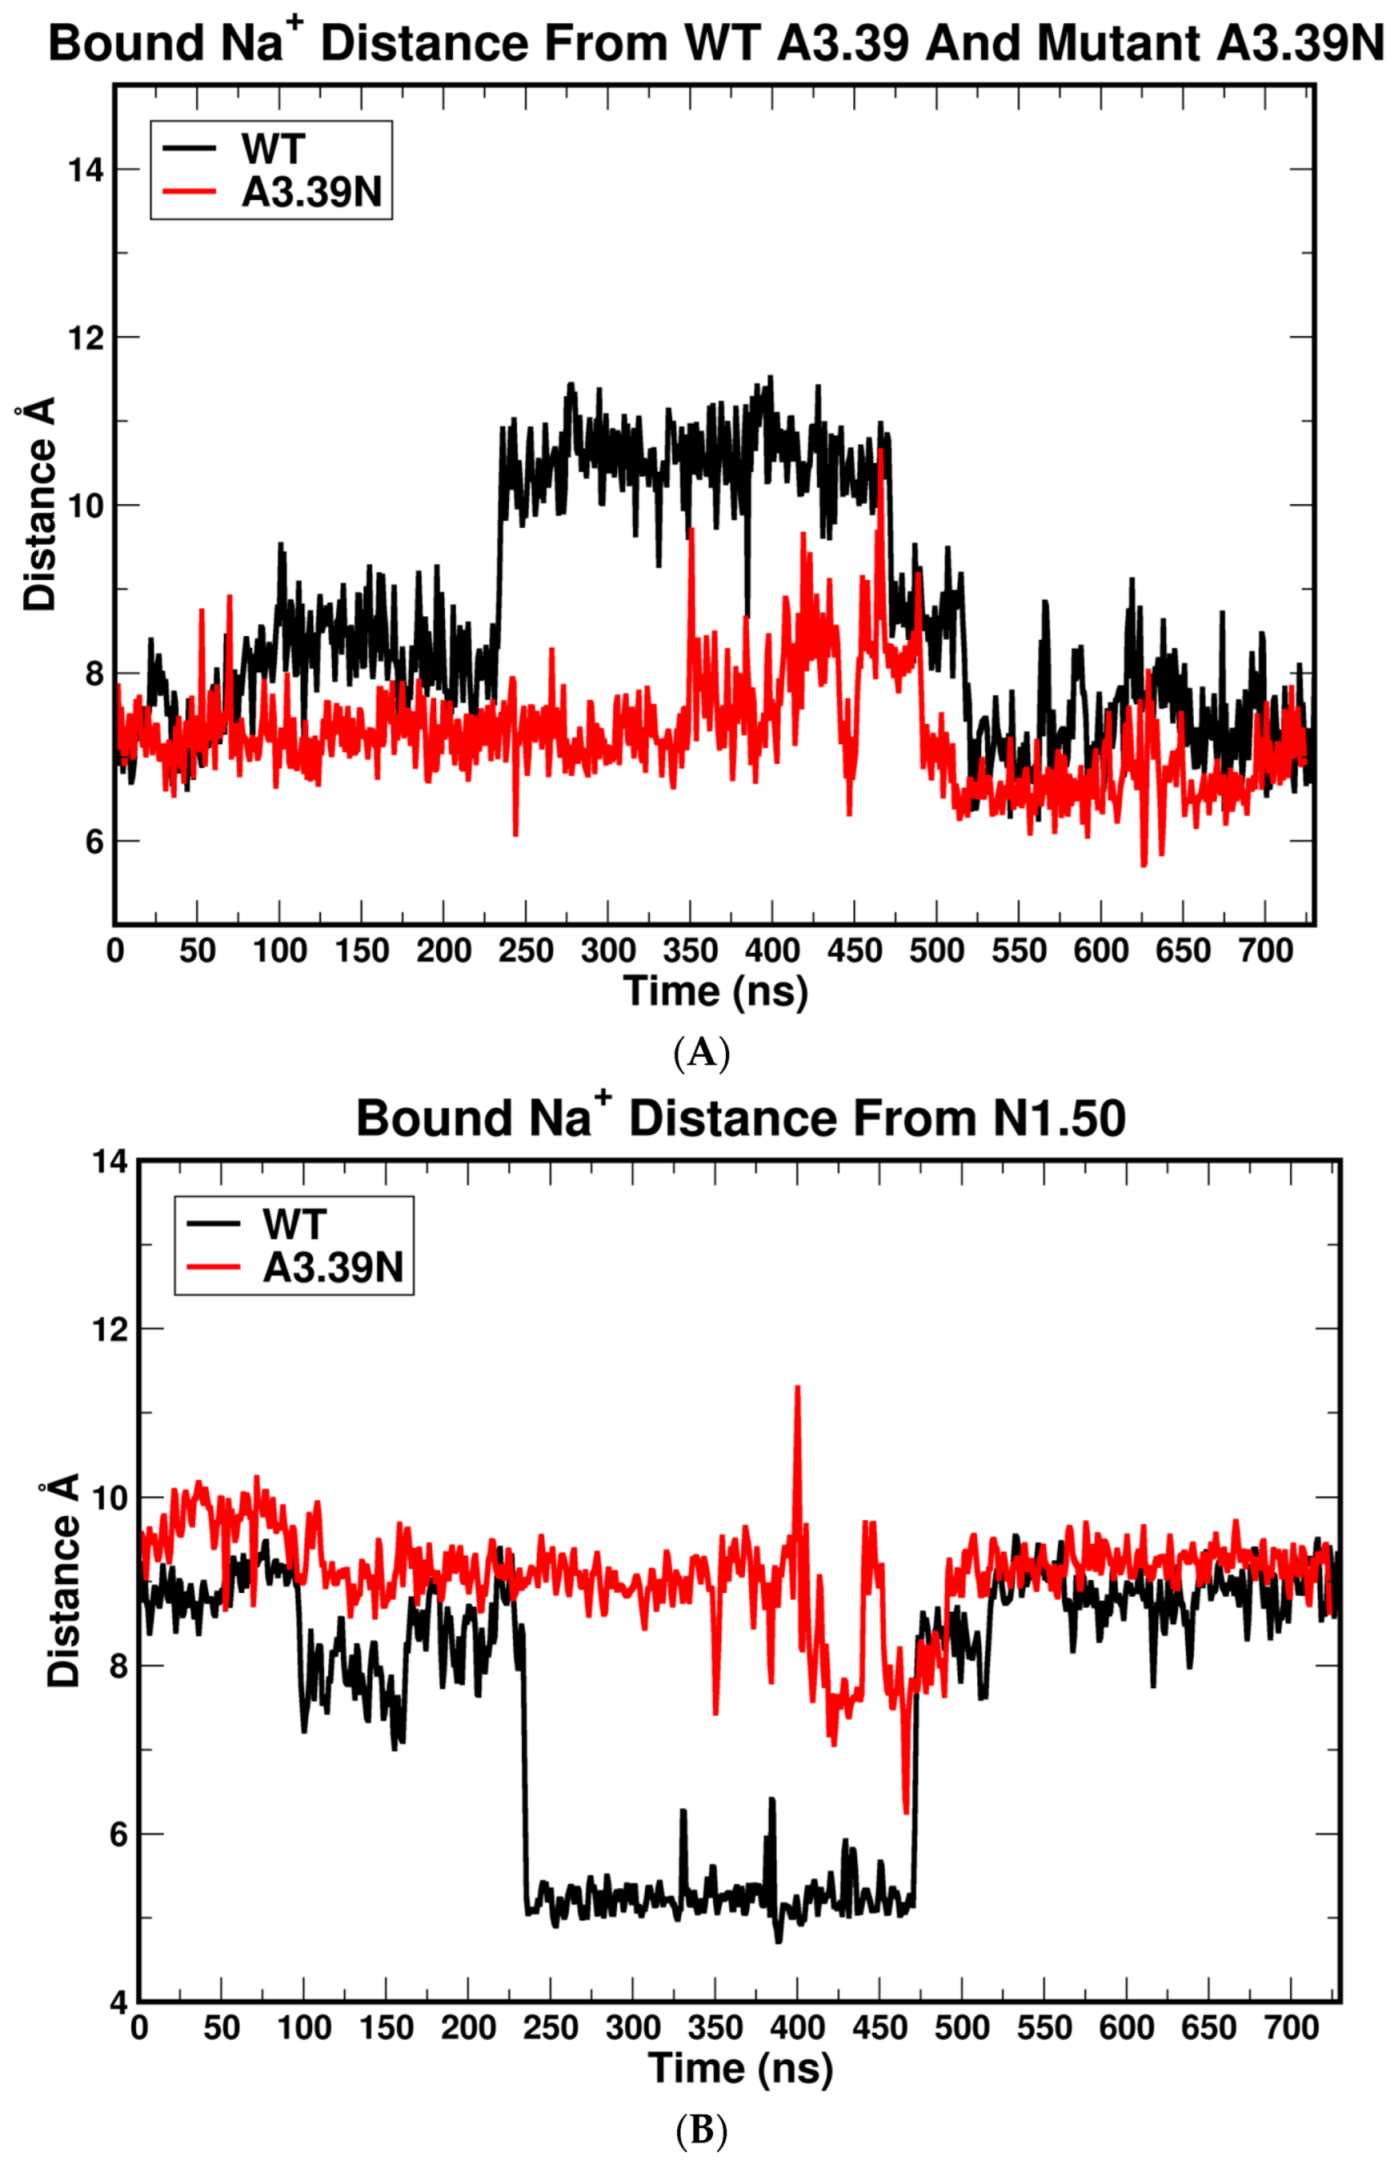
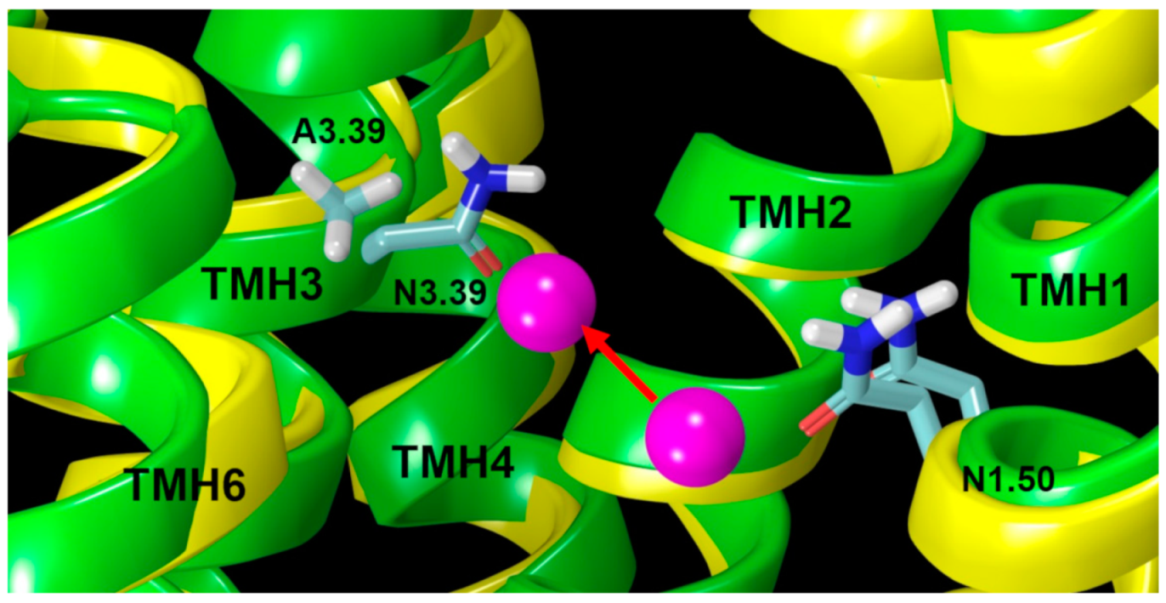
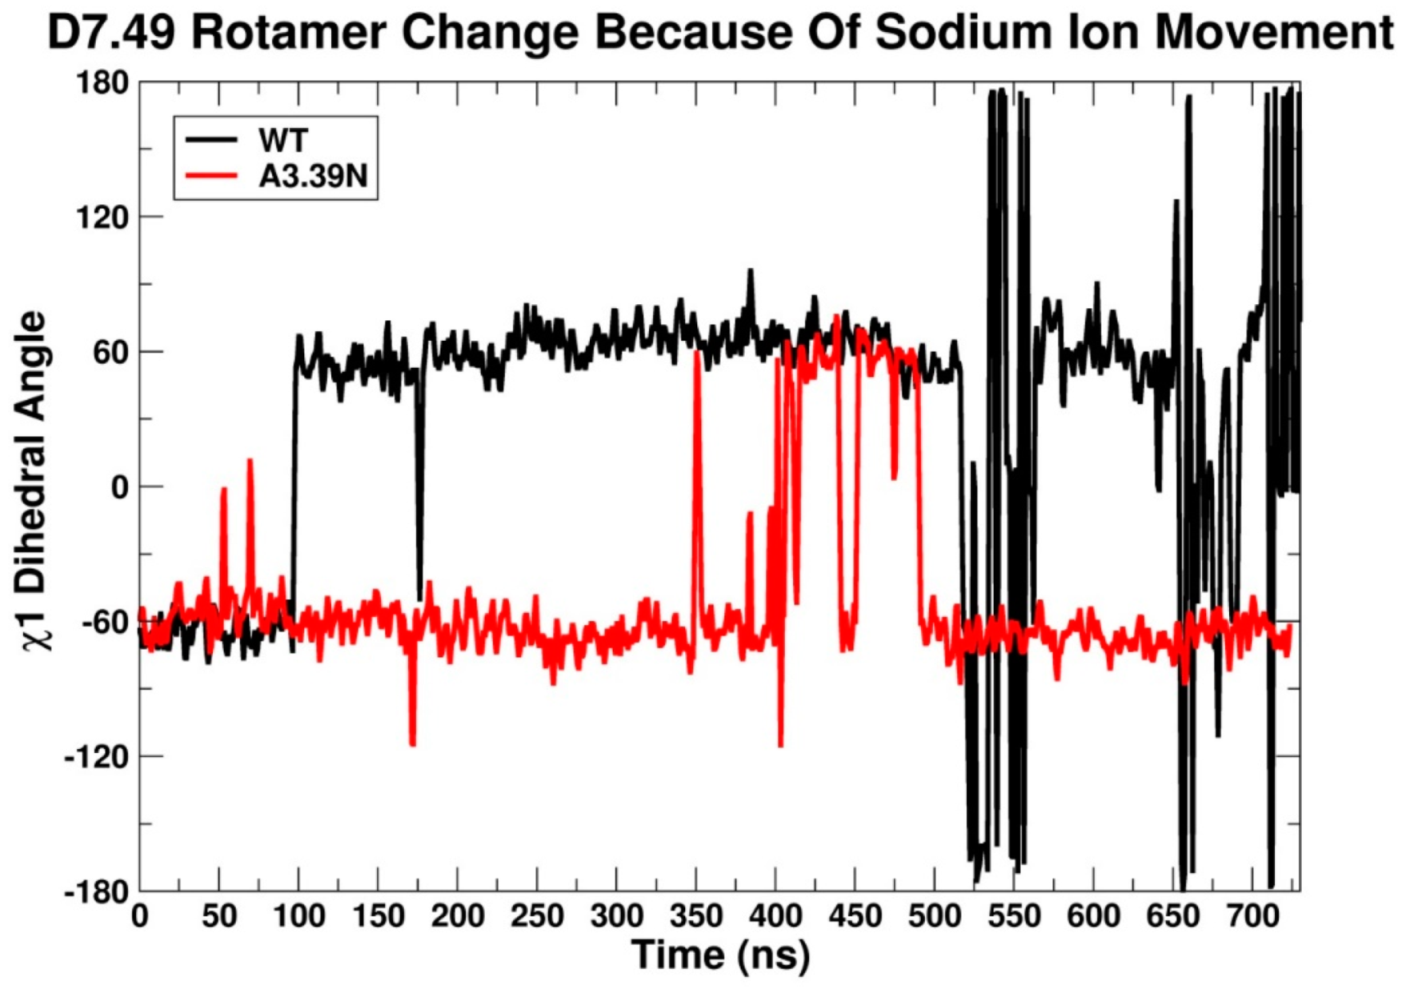
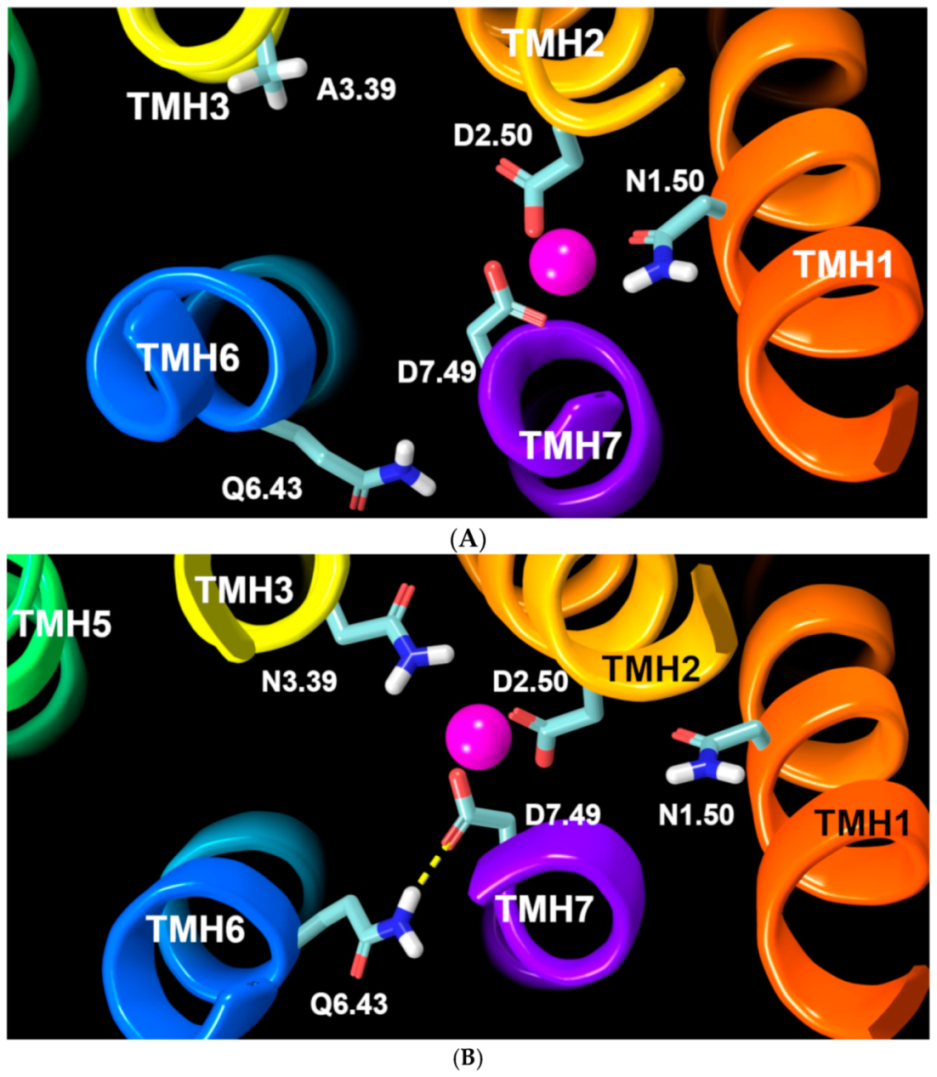
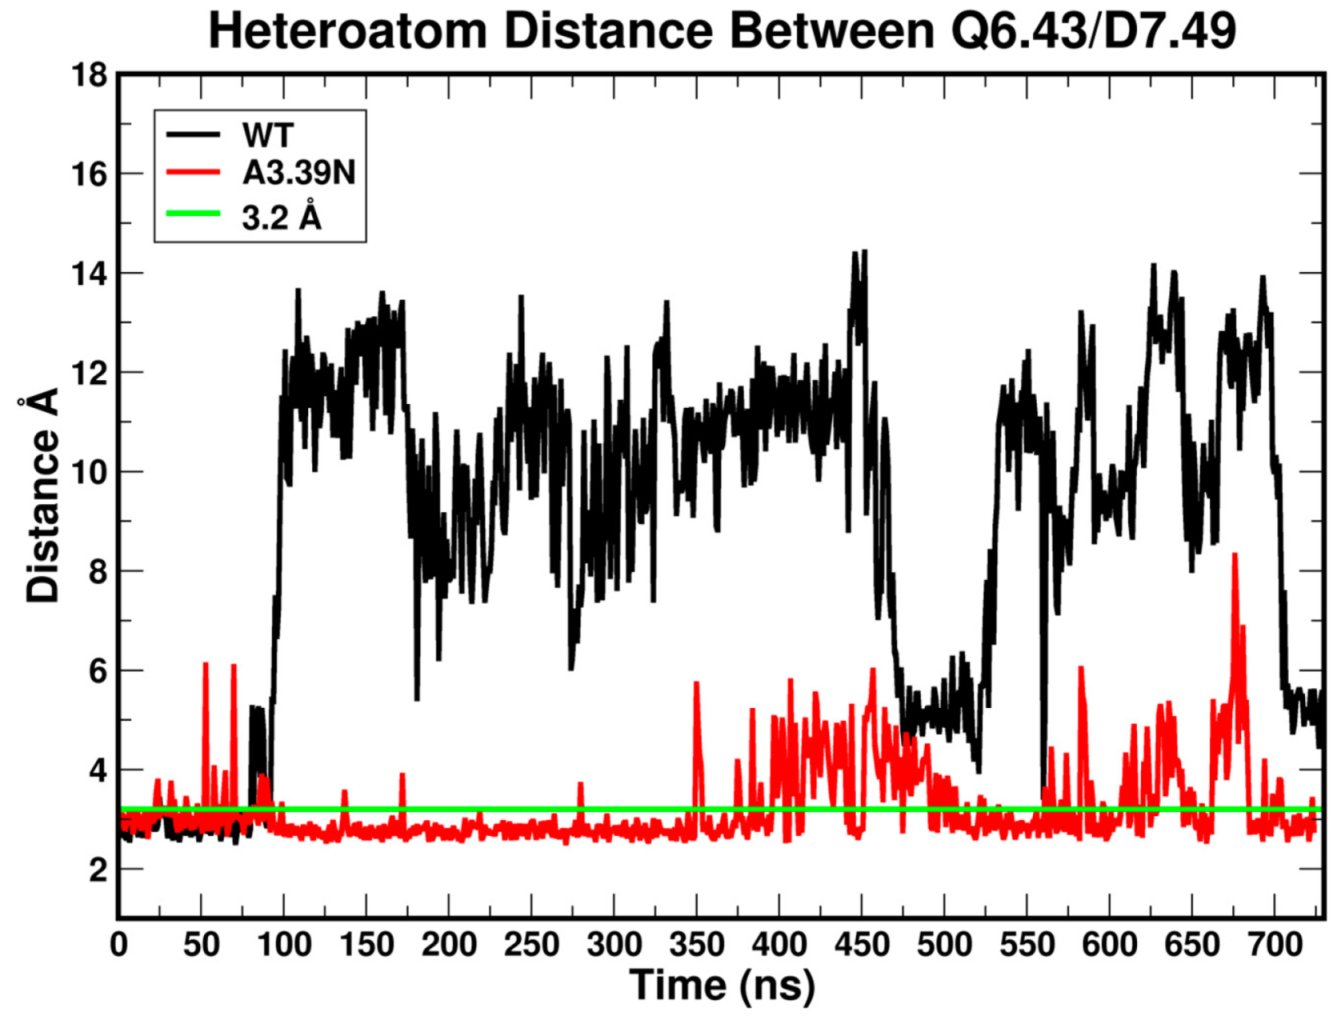
2.2.2. The Sodium Binding Pocket
2.2.3. Other Structural Features That May Contribute to High Constitutive Activity of WT GPR18
3. Materials and Methods
3.1. Amino Acid Numbering System
3.2. Receptor Model Development
3.3. Conformational Memories Technique for Calculating TMH Conformations
3.4. Modeling of the EC and IC Loop Conformations of the Receptor and the N- and C-Termini
3.5. Receptor Minimization
3.6. Molecular Dynamics (MD)
4. Conclusions
Supplementary Materials
Author Contributions
Funding
Acknowledgments
Conflicts of Interest
Abbreviations
| GPCR | G-Protein Coupled Receptor |
| NAGly | N-arachidonoyl glycine |
| POPC | Palmitoyloleoylphosphatidylcholine |
| CM | Conformational Memories |
| SA | Simulated Annealing |
| TMH | Transmembrane helix |
| DOR | delta opioid receptor |
| MD | Molecular dynamics |
| RMSD | root-mean-square deviation |
| EC | Extracellular |
| IC | Intracellular |
| WT | Wild type |
| AMBER | Assisted Model Building with Energy Refinement |
References
- Miller, S.; Leishman, E.; Oehler, O.; Daily, L.; Murataeva, N.; Wager-Miller, J.; Bradshaw, H.; Straiker, A. Evidence for a GPR18 role in diurnal regulation of intraocular pressure. Investig. Ophthalmol. Vis. Sci. 2016, 57, 6419–6426. [Google Scholar] [CrossRef]
- Nourbakhsh, F.; Atabaki, R.; Roohbakhsh, A. The role of orphan G protein-coupled receptors in the modulation of pain: A review. Life Sci. 2018, 212, 59–69. [Google Scholar] [CrossRef] [PubMed]
- Qin, Y.; Verdegaal, E.M.E.; Siderius, M.; Bebelman, J.P.; Smit, M.J.; Leurs, R.; Willemze, R.; Tensen, C.P.; Osanto, S. Quantitative expression profiling of G-protein-coupled receptors (GPCRs) in metastatic melanoma: The constitutively active orphan GPCR GPR18 as novel drug target. Pigment Cell Melanoma Res. 2011, 24, 207–218. [Google Scholar] [CrossRef] [PubMed]
- Rajaraman, G.; Simcocks, A.; Hryciw, D.H.; Hutchinson, D.S.; McAinch, A.J. G protein coupled receptor 18: A potential role for endocannabinoid signaling in metabolic dysfunction. Mol. Nutr. Food Res. 2016, 60, 92–102. [Google Scholar] [CrossRef] [PubMed]
- Takenouchi, R.; Inoue, K.; Kambe, Y.; Miyata, A. N-arachidonoyl glycine induces macrophage apoptosis via GPR18. Biochem. Biophys. Res. Commun. 2012, 418, 366–371. [Google Scholar] [CrossRef]
- Kohno, M.; Hasegawa, H.; Inoue, A.; Muraoka, M.; Miyazaki, T.; Oka, K.; Yasukawa, M. Identification of N-arachidonylglycine as the endogenous ligand for orphan G-protein-coupled receptor GPR18. Biochem. Biophys. Res. Commun. 2006, 347, 827–832. [Google Scholar] [CrossRef]
- McHugh, D.; Hu, S.S.J.; Rimmerman, N.; Juknat, A.; Vogel, Z.; Walker, J.M.; Bradshaw, H.B. N-arachidonoyl glycine, an abundant endogenous lipid, potently drives directed cellular migration through GPR18, the putative abnormal cannabidiol receptor. BMC Neurosci. 2010, 11, 44. [Google Scholar] [CrossRef] [PubMed]
- McHugh, D.; Page, J.; Dunn, E.; Bradshaw, H.B. Δ9-Tetrahydrocannabinol and N-arachidonyl glycine are full agonists at GPR18 receptors and induce migration in human endometrial HEC-1B cells. Br. J. Pharmacol. 2012, 165, 2414–2424. [Google Scholar] [CrossRef] [PubMed] [Green Version]
- Chiang, N.; Dalli, J.; Colas, R.A.; Serhan, C.N. Identification of resolvin D2 receptor mediating resolution of infections and organ protection. J. Exp. Med. 2015, 212, 1203–1217. [Google Scholar] [CrossRef] [Green Version]
- Lu, V.B.; Puhl, H.L.; Ikeda, S.R. N-Arachidonyl Glycine Does Not Activate G Protein-Coupled Receptor 18 Signaling via Canonical Pathways. Mol. Pharmacol. 2013, 83, 267–282. [Google Scholar] [CrossRef]
- Yin, H.; Chu, A.; Li, W.; Wang, B.; Shelton, F.; Otero, F.; Nguyen, D.G.; Caldwell, J.S.; Chen, Y.A. Lipid G protein-coupled receptor ligand identification using beta-arrestin PathHunter assay. J. Biol. Chem. 2009, 284, 12328–12338. [Google Scholar] [CrossRef] [PubMed]
- Laschet, C.; Dupuis, N.; Hanson, J. The G Protein-Coupled Receptors deorphanization landscape. Biochem. Pharmacol. 2018, 153, 62–74. [Google Scholar] [CrossRef] [PubMed]
- Alexander, S.P.H.; Christopoulos, A.; Davenport, A.P.; Kelly, E.; Marrion, N.V.; Peters, J.A.; Faccenda, E.; Harding, S.D.; Pawson, A.J.; Sharman, J.L.; et al. The concise guide of pharmacology 2017/18: G protein-coupled receptors. Br. J. Pharmacol. 2017, 174, S17–S129. [Google Scholar] [CrossRef] [PubMed]
- Pertwee, R.G.; Howlett, A.C.; Abood, M.E.; Alexander, S.P.H.; Marzo, V.D.; Elphick, M.R.; Greasley, P.J.; Hansen, H.S.; Kunos, G. International Union of Basic and Clinical Pharmacology. LXXIX. Cannabinoid Receptors and Their Ligands: Beyond CB1 and CB2. Pharmacol. Rev. 2010, 62, 588–631. [Google Scholar] [CrossRef] [PubMed] [Green Version]
- Finlay, D.B.; Joseph, W.R.; Grimsey, N.L.; Glass, M. GPR18 undergoes a high degree of constitutive trafficking but is unresponsive to N-Arachidonoyl Glycine. PeerJ 2016, 4, e1835. [Google Scholar] [CrossRef]
- Console-Bram, L.; Brailoiu, E.; Brailoiu, G.C.; Sharir, H.; Abood, M.E. Activation of GPR18 by cannabinoid compounds: A tale of biased agonism. Br. J. Pharmacol. 2014, 171, 3908–3917. [Google Scholar] [CrossRef]
- Taddese, B.; Deniaud, M.; Garnier, A.; Tiss, A.; Guissouma, H.; Abdi, H.; Henrion, D.; Chabbert, M. Evolution of chemokine receptors is driven by mutations in the sodium binding site. PLoS Comput. Biol. 2018, 14, 1–25. [Google Scholar] [CrossRef]
- Montaner, S.; Kufareva, I.; Abagyan, R.; Gutkind, J.S. Molecular Mechanisms Deployed by Virally Encoded G Protein–Coupled Receptors in Human Diseases. Annu. Rev. Pharmacol. Toxicol. 2013, 53, 331–354. [Google Scholar] [CrossRef]
- Katritch, V.; Fenalti, G.; Abola, E.E.; Roth, B.L.; Cherezov, V.; Stevens, R.C. Allosteric sodium in class A GPCR signaling. Trends Biochem. Sci. 2014, 39, 233–244. [Google Scholar] [CrossRef] [Green Version]
- Ballesteros, J.A.; Weinstein, H. Analysis and refinement of criteria for predicting the structure and relative orientations of transmembranal helical domains. Biophys. J. 1992, 62, 107–109. [Google Scholar] [CrossRef]
- Rose, P.W.; Beran, B.; Bi, C.; Bluhm, W.F.; Dimitropoulos, D.; Goodsell, D.S.; Prlic, A.; Quesada, M.; Quinn, G.B.; Westbrook, J.D.; et al. The RCSB Protein Data Bank: Redesigned web site and web services. Nucleic Acids Res. 2011, 39, D392–D401. [Google Scholar] [CrossRef]
- Visiers, I.; Braunheim, B.B.; Weinstein, H. Prokink: A protocol for numerical evaluation of helix distortions by proline. Protein Eng. 2000, 13, 603–606. [Google Scholar] [CrossRef] [PubMed]
- Ballesteros, J.A.; Deupi, X.; Olivella, M.; Haaksma, E.E.; Pardo, L. Serine and threonine residues bend alpha-helices in the chi(1) = g(-) conformation. Biophys. J. 2000, 79, 2754–2760. [Google Scholar] [CrossRef]
- Shang, Y.; Lerouzic, V.; Schneider, S.; Bisignano, P.; Pasternak, G.W.; Filizola, M. Mechanistic insights into the allosteric modulation of opioid receptors by sodium ions. Biochemistry 2014, 53, 5140–5149. [Google Scholar] [CrossRef] [PubMed]
- McAllister, S.D.; Hurst, D.P.; Barnett-Norris, J.; Lynch, D.; Reggio, P.H.; Abood, M.E. Structural Mimicry in Class AG Protein-coupled Receptor Rotamer Toggle Switches THE IMPORTANCE OF THE F3. 36 (201)/W6. 48 (357) INTERACTION IN CANNABINOID CB1 RECEPTOR ACTIVATION. J. Biol. Chem. 2004, 279, 48024–48037. [Google Scholar] [CrossRef] [PubMed]
- Miao, Y.; Caliman, A.D.; McCammon, J.A. Allosteric Effects of Sodium Ion Binding on Activation of the M3 Muscarinic G-Protein-Coupled Receptor. Biophys. J. 2015, 108, 1796–1806. [Google Scholar] [CrossRef] [PubMed] [Green Version]
- Gutiérrez-de-Terán, H.; Massink, A.; Rodríguez, D.; Liu, W.; Han, G.W.; Joseph, J.S.; Katritch, I.; Heitman, L.H.; Xia, L.; Ijzerman, A.P.; et al. The Role of a Sodium Ion Binding Site in the Allosteric Modulation of the A2A Adenosine G Protein-Coupled Receptor. Structure 2013, 21, 2175–2185. [Google Scholar] [CrossRef]
- Klaudia, J.B.; Venable, R.M.; Freites, J.A.; O’Connor, J.W.; Tobias, D.J.; Mondragon-Ramirez, C.; Vorobyov, I.; Alexander, D.; MacKerell, J.; Pastor, R.W. Update of the CHARMM All-Atom Additive Force Field for Lipids: Validation on Six Lipid Types. J. Phys. Chem. B 2010, 114, 7830–7843. [Google Scholar] [CrossRef] [PubMed]
- Ballesteros, J.; Kitanovic, S.; Guarnieri, F.; Davies, P.; Fromme, B.J.; Konvicka, K.; Chi, L.; Millar, R.P.; Davidson, J.S.; Weinstein, H.; et al. Functional microdomains in G-protein-coupled receptors: The conserved arginine-cage motif in the gonadotropin-releasing hormone receptor. J. Biol. Chem. 1998, 273, 10445–10453. [Google Scholar] [CrossRef]
- Venkatakrishnan, A.J.; Deupi, X.; Lebon, G.; Heydenreich, F.M.; Flock, T.; Miljus, T.; Balaji, S.; Bouvier, M.; Veprintsev, D.B.; Tate, C.G.; et al. Diverse activation pathways in class A GPCRs converge near the G-protein-coupling region. Nature 2016, 40, 383–388. [Google Scholar] [CrossRef]
- Ballesteros, J.; Weinstein, H. Integrated methods for the construction of three-dimensional models and computational probing of structure-function relations in G protein-coupled receptors. Methods Neurosci. 1995, 25, 366–428. [Google Scholar]
- Guarnieri, F. Conformational Memories and a Simulated Annealing Program That Learns: Application to LTB4. J. Comput. Chem. 1995, 16, 648–653. [Google Scholar] [CrossRef]
- Guarnieri, F.; Weinstein, H. Conformational Memories and the Exploration of Biologically Relevant Peptide Conformations: An Illustration for the Gonadotropin-Releasing Hormone. J. Am. Chem. Soc. 1996, 118, 5580–5589. [Google Scholar] [CrossRef]
- Reggio, P.H. Computational methods in drug design: Modeling G protein-coupled receptor monomers, dimers, and oligomers. AAPS J. 2006, 8, E322–E336. [Google Scholar] [CrossRef]
- MacKerell, A.D.; Bashford, D.; Bellott, M.; Dunbrack, R.L.; Evanseck, J.D.; Field, M.J.; Fischer, S.; Gao, J.; Guo, H.; Ha, S.; et al. All-atom empirical potential for molecular modeling and dynamics studies of proteins. J. Phys. Chem. B 1998, 102, 3586–3616. [Google Scholar] [CrossRef] [PubMed]
- Salomon-Ferrer, R.; Gotz, A.W.; Poole, D.; Le Grand, S.; Walker, R.C. Routine Microsecond Molecular Dynamics Simulations with AMBER on GPUs. 2. Explicit Solvent Particle Mesh Ewald. J. Chem. Theory Comput. 2013, 9, 3878–3888. [Google Scholar] [CrossRef]
- Buck, M.; Bouguet-Bonnet, S.; Pastor, R.W.; MacKerell, A.D., Jr. Importance of the CMAP correction to the CHARMM22 protein force field: Dynamics of hen lysozyme. Biophys. J. 2006, 90, L36–L38. [Google Scholar] [CrossRef]
- Hurst, D.P.; Grossfield, A.; Lynch, D.L.; Feller, S.; Romo, T.D.; Gawrisch, K.; Pitman, M.C.; Reggio, P.H. A lipid pathway for ligand binding is necessary for a cannabinoid G protein-coupled receptor. J. Biol. Chem. 2010, 285, 17954–17964. [Google Scholar] [CrossRef]
- Eswar, N.; Webb, B.; Marti-Renom, M.A.; Madhusudhan, M.S.; Eramian, D.; Shen, M.-y.; Pieper, U.; Sali, A. Comparative Protein Structure Modeling Using Modeller. Curr. Protoc. Bioinform. 2006, 15, 1–46. [Google Scholar] [CrossRef] [PubMed]
- Fiser, A.; Kinh Gian Do, R.; Sali, A. Modeling Loops in Protein Structures. Protein Sci. 2000, 9, 1753–1773. [Google Scholar] [CrossRef]
- Šali, A.; Blundell, T.L. Comparative Protein Modelling by Satisfaction of Spatial Restraints. J. Mol. Biol. 1993, 234, 779–815. [Google Scholar] [CrossRef]
- Harder, E.; Damm, W.; Maple, J.; Wu, C.; Reboul, M.; Xiang, J.Y.; Wang, L.; Lupyan, D.; Dahlgren, M.K.; Knight, J.L.; et al. OPLS3: A Force Field Providing Broad Coverage of Drug-like Small Molecules and Proteins. J. Chem. Theory Comput. 2016, 12, 281–296. [Google Scholar] [CrossRef]
- Shivakumar, D.; Williams, J.; Wu, Y.; Damm, W.; Shelley, J.; Sherman, W. Prediction of Absolute Solvation Free Energies using Molecular Dynamics Free Energy Perturbation and the OPLS Force Field. J. Chem. Theory Comput. 2010, 6, 1509–1519. [Google Scholar] [CrossRef] [PubMed]
- Jorgensen, W.L.; Tirado-Rives, J. The OPLS [optimized potentials for liquid simulations] potential functions for proteins, energy minimizations for crystals of cyclic peptides and crambin. J. Am. Chem. Soc. 1988, 110, 1657–1666. [Google Scholar] [CrossRef]
- Morales, P.; Hurst, D.P.; Reggio, P.H. Methods for the Development of In Silico GPCR Models. In Methods in Enzymology; Reggio, P.H., Ed.; Elsevier: Amsterdam, The Netherlands, 2017; pp. 405–448. [Google Scholar]
- Lomize, M.A.; Pogozheva, I.D.; Joo, H.; Mosberg, H.I.; Lomize, A.L. OPM database and PPM web server: Resources for positioning of proteins in membranes. Nucleic Acids Res. 2011, 40, D370–D376. [Google Scholar] [CrossRef]
- Jo, S.; Kim, T.; Im, W. Automated builder and database of protein/membrane complexes for molecular dynamics simulations. PLoS ONE 2007, 2, e880. [Google Scholar] [CrossRef]
- Lee, J.; Cheng, X.; Swails, J.M.; Yeom, M.S.; Eastman, P.K.; Lemkul, J.A.; Wei, S.; Buckner, J.; Jeong, J.C.; Qi, Y. CHARMM-GUI input generator for NAMD, GROMACS, AMBER, OpenMM, and CHARMM/OpenMM simulations using the CHARMM36 additive force field. J. Chem. Theory Comput. 2015, 12, 405–413. [Google Scholar] [CrossRef] [PubMed]
- Huang, J.; Rauscher, S.; Nawrocki, G.; Ran, T.; Feig, M.; de Groot, B.L.; Grubmüller, H.; MacKerell, A.D. CHARMM36: An Improved Force Field for Folded and Intrinsically Disordered Proteins. Biophys. J. 2017, 112, 175a–176a. [Google Scholar] [CrossRef]
- Available online: http://ambermd.org/index.php (accessed on 9 May 2019).
- Case, D.A.; Cheatham III, T.E.; Darden, T.; Gohlke, H.; Luo, R.; Merz Jr, K.M.; Onufriev, A.; Simmerling, C.; Wang, B.; Woods, R.J. The Amber biomolecular simulation programs. J. Comput. Chem. 2005, 26, 1668–1688. [Google Scholar] [CrossRef]


© 2019 by the authors. Licensee MDPI, Basel, Switzerland. This article is an open access article distributed under the terms and conditions of the Creative Commons Attribution (CC BY) license (http://creativecommons.org/licenses/by/4.0/).
Share and Cite
Sotudeh, N.; Morales, P.; Hurst, D.P.; Lynch, D.L.; Reggio, P.H. Towards A Molecular Understanding of The Cannabinoid Related Orphan Receptor GPR18: A Focus on Its Constitutive Activity. Int. J. Mol. Sci. 2019, 20, 2300. https://doi.org/10.3390/ijms20092300
Sotudeh N, Morales P, Hurst DP, Lynch DL, Reggio PH. Towards A Molecular Understanding of The Cannabinoid Related Orphan Receptor GPR18: A Focus on Its Constitutive Activity. International Journal of Molecular Sciences. 2019; 20(9):2300. https://doi.org/10.3390/ijms20092300
Chicago/Turabian StyleSotudeh, Noori, Paula Morales, Dow P. Hurst, Diane L. Lynch, and Patricia H. Reggio. 2019. "Towards A Molecular Understanding of The Cannabinoid Related Orphan Receptor GPR18: A Focus on Its Constitutive Activity" International Journal of Molecular Sciences 20, no. 9: 2300. https://doi.org/10.3390/ijms20092300