
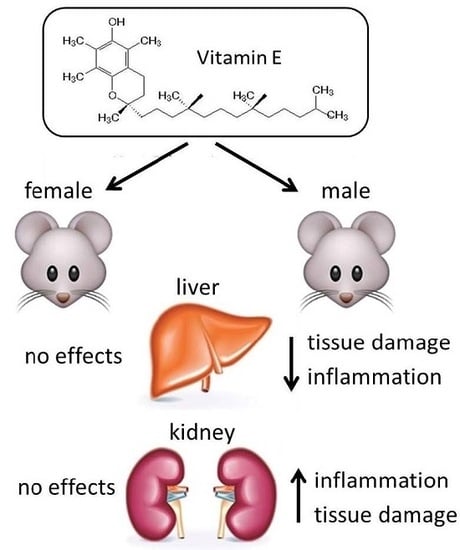
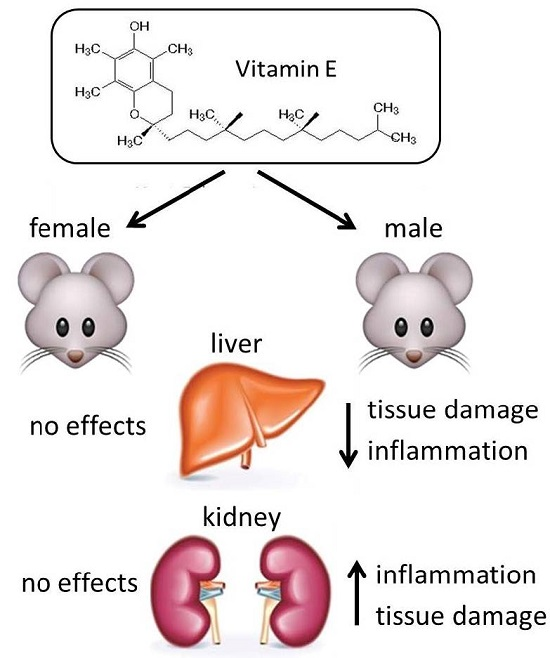
Tissue-Specific Effects of Vitamin E Supplementation

Abstract
:
1. Introduction
2. Results
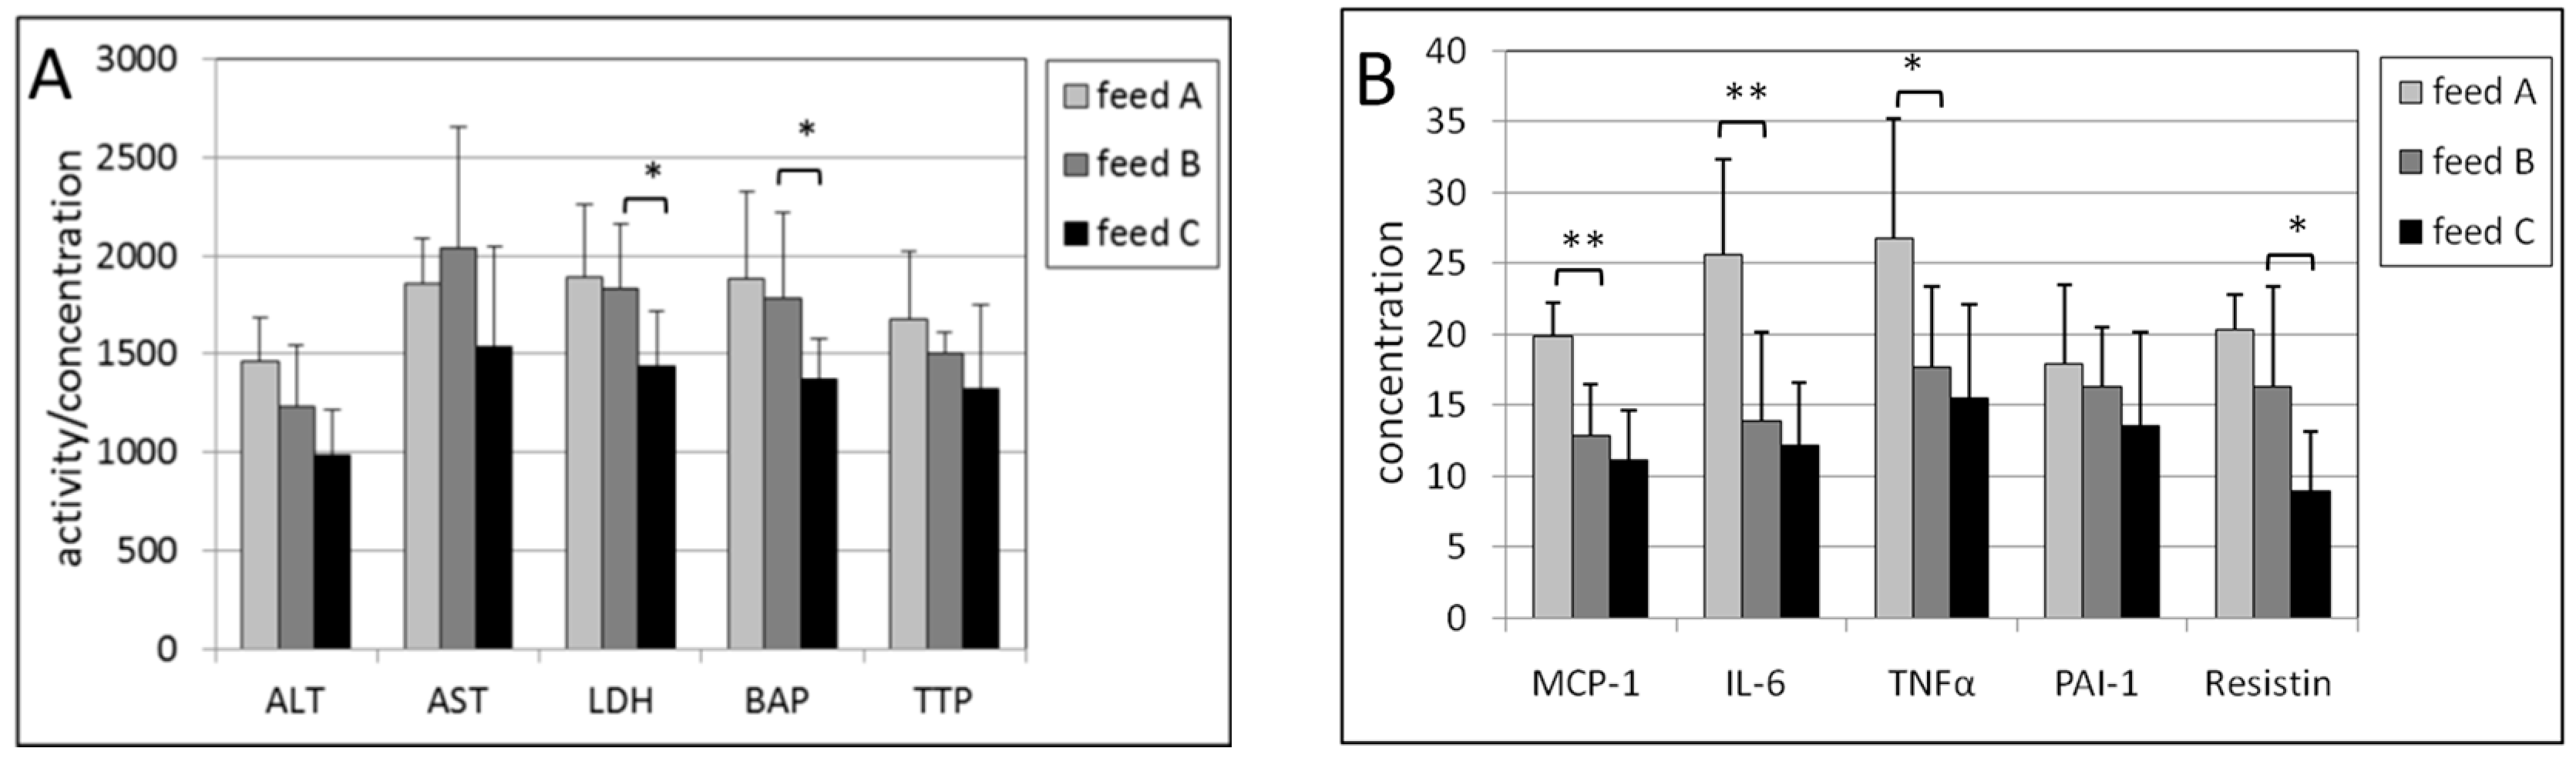
2.1. Plasma
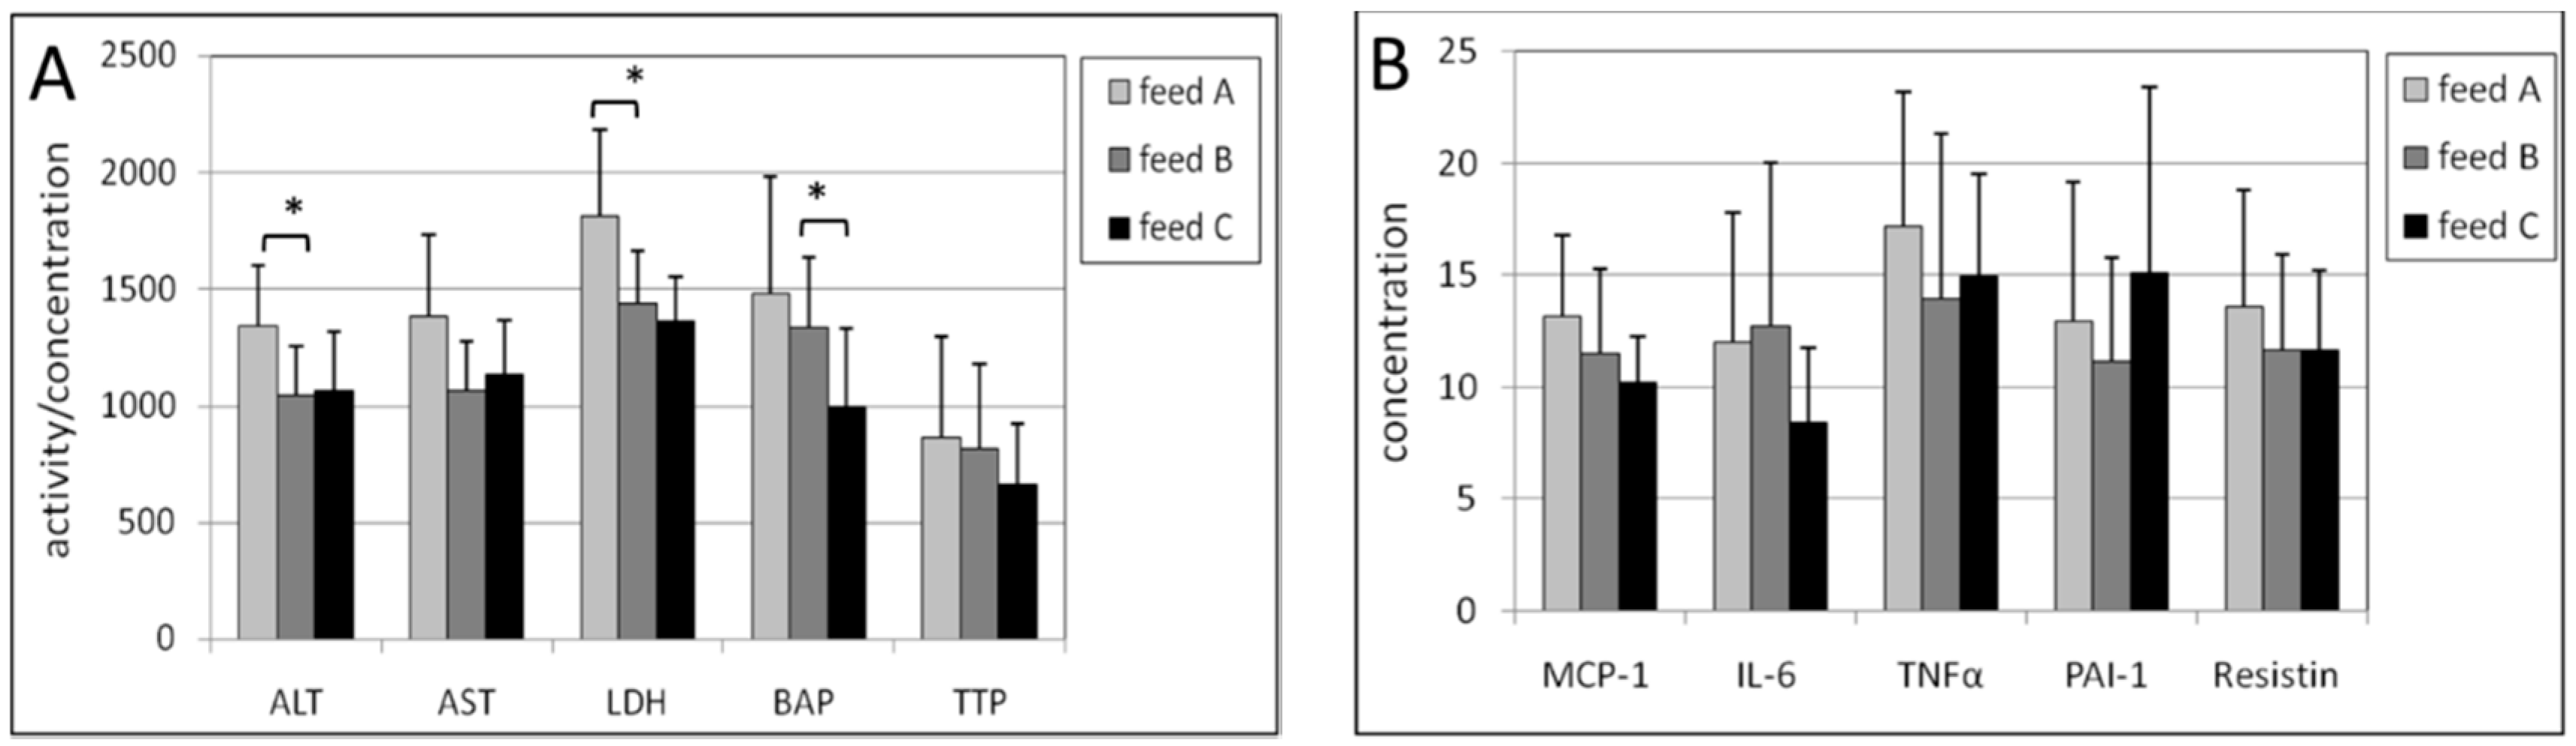
2.2. Erythrocytes
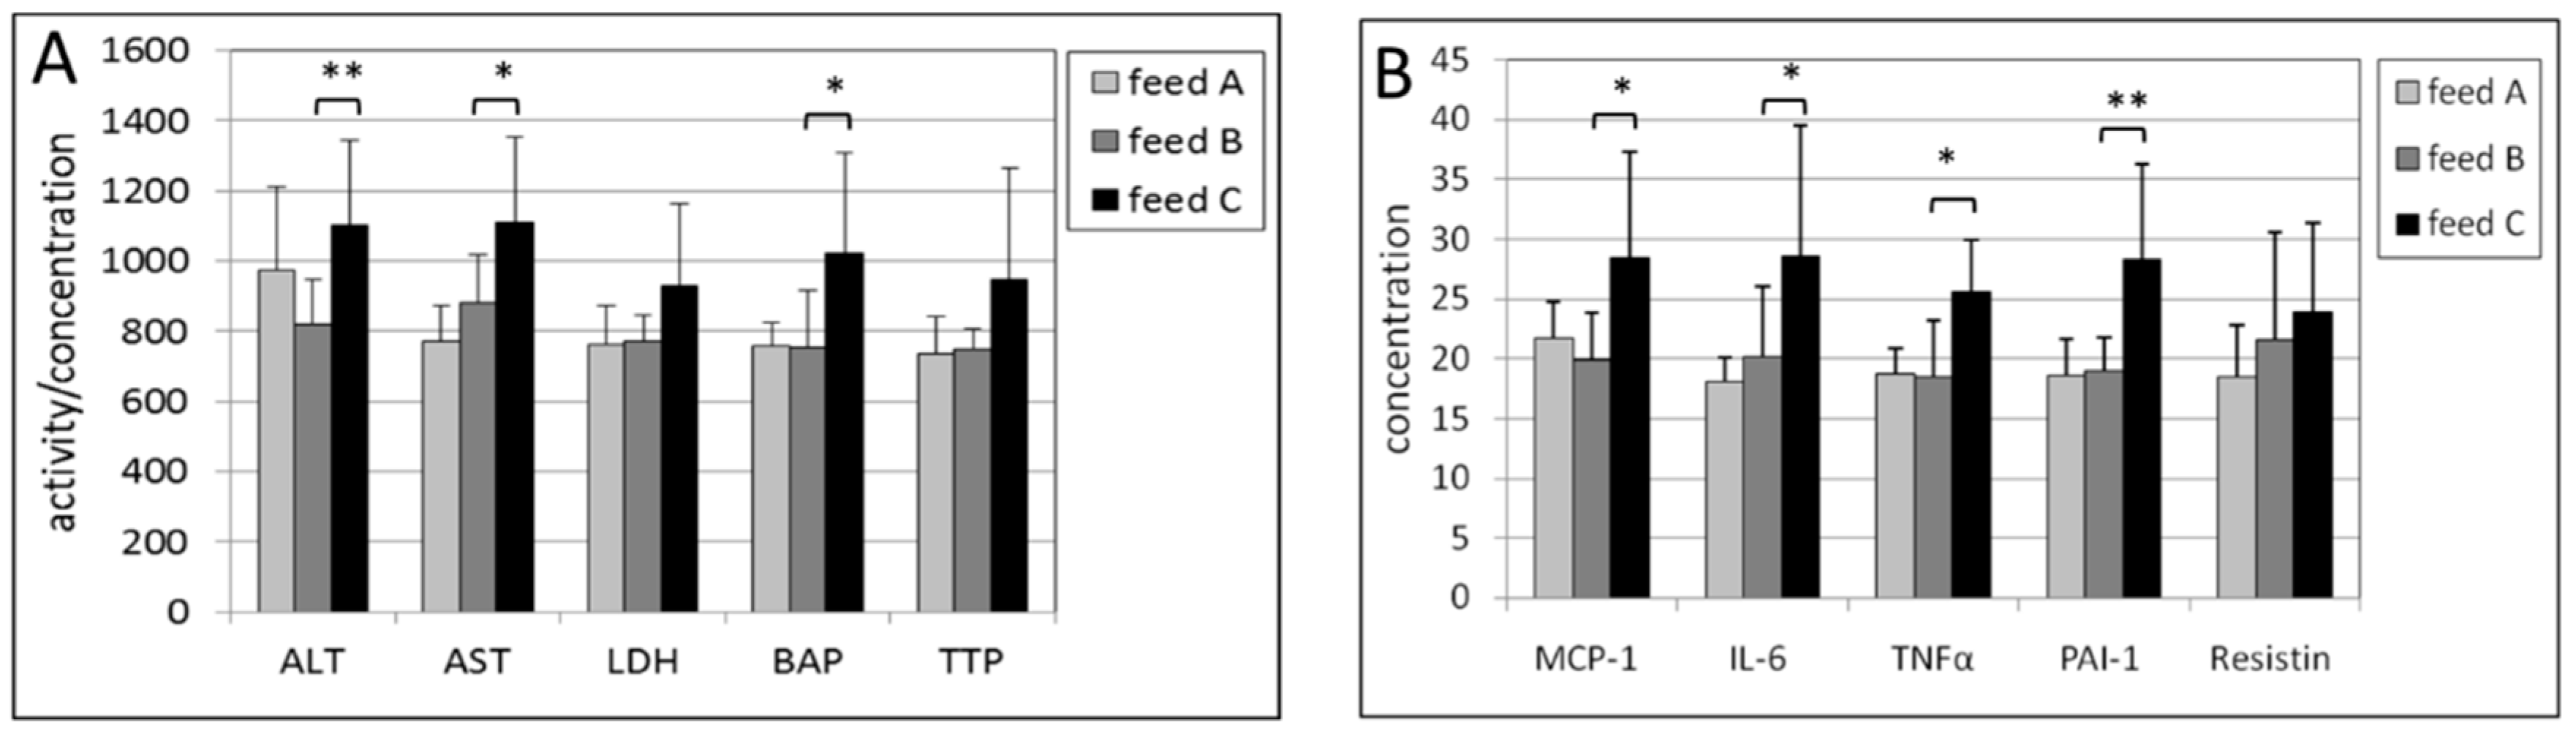
2.3. Liver
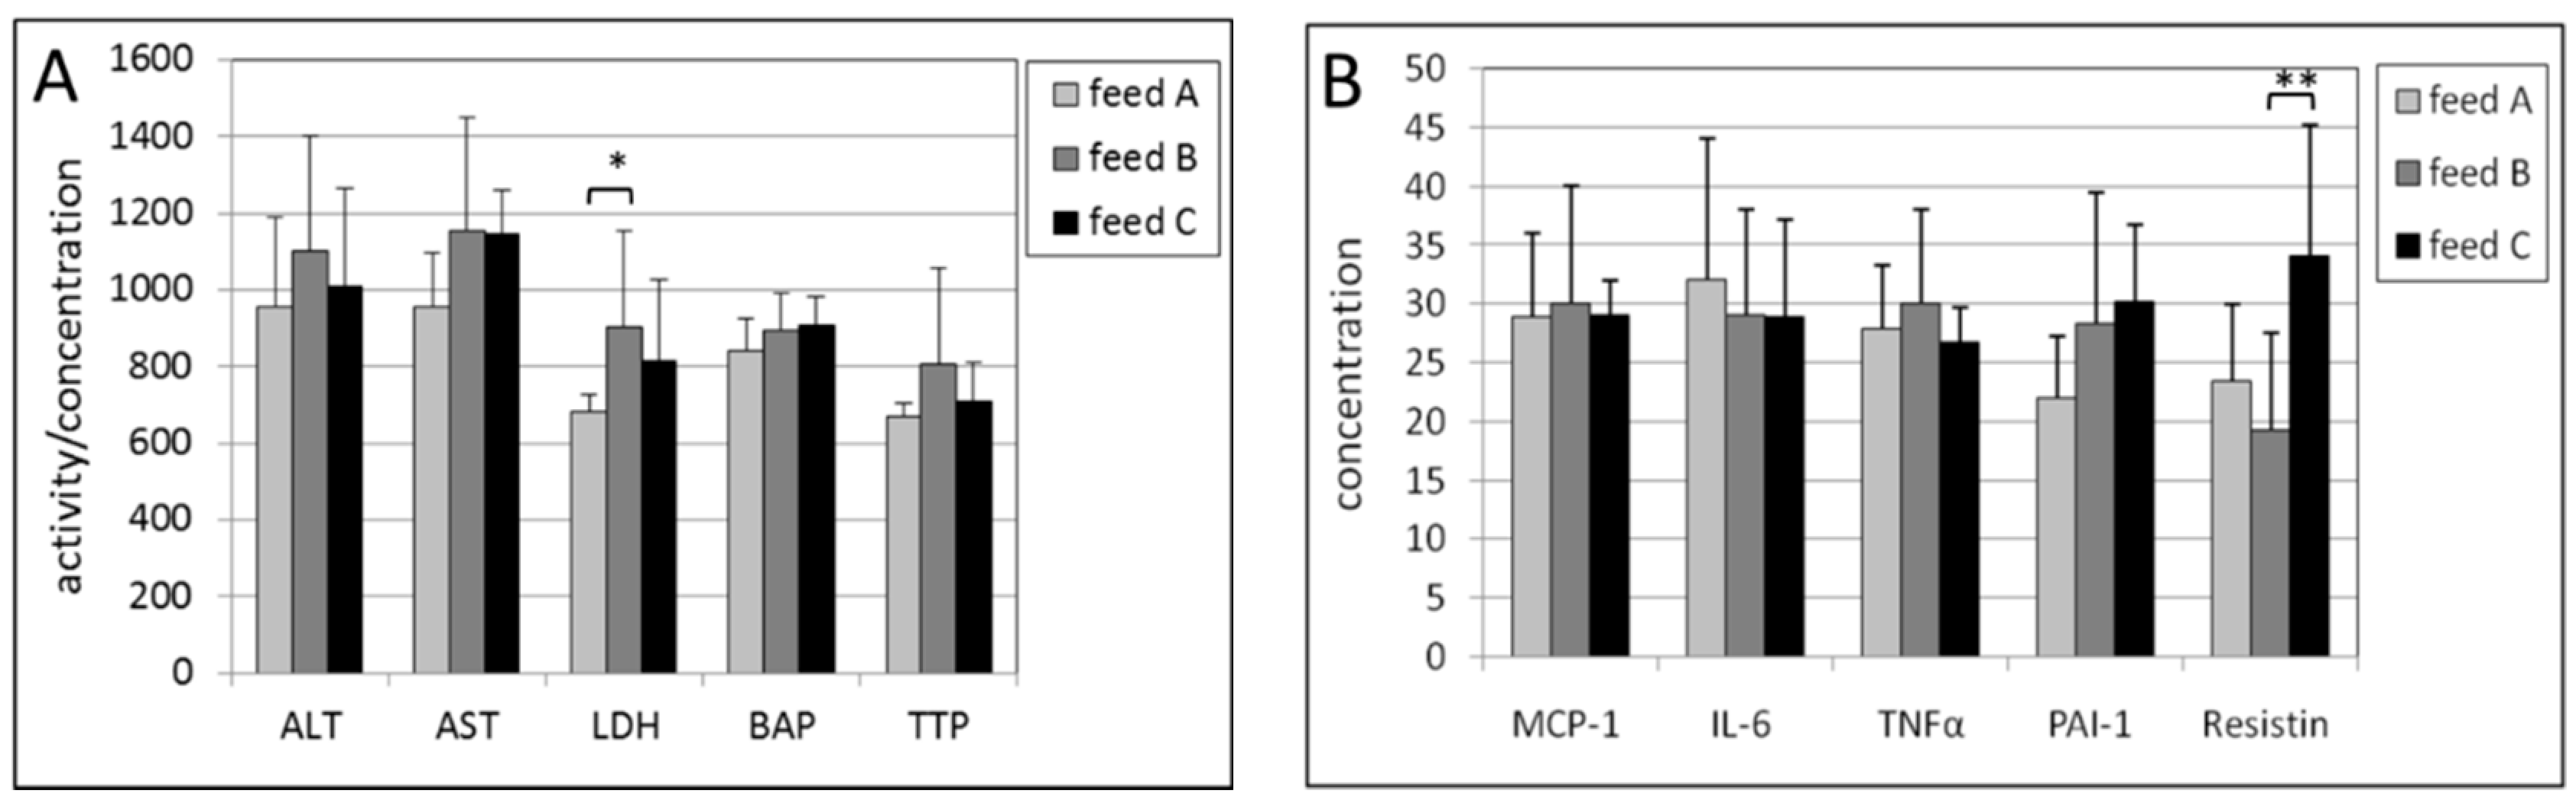
2.4. Kidney
3. Discussion
4. Materials and Methods
4.1. Experimental Animals and Exposure Protocol
4.2. Preparation of Blood Samples
4.3. Biochemical Analysis in Blood Samples
4.4. Preparation of Tissue Samples
4.5. Biochemical Analysis in Tissue Samples
4.6. Statistical Analysis
Acknowledgements
Author Contributions
Conflicts of Interest
Abbreviations
| BAP | (biological antioxidant potential) |
| IL-6 | (interleukin-6) |
| MCP-1 | (monocyte chemoattractant protein-1) |
| tPAI-1 | (total plasminogen activator inhibitor) |
| PMS | (post-mitochondrial supernatant) |
| RDI | (recommended daily intake) |
| ROM | (reactive oxygen metabolites) |
| TNF-alpha | (tumor necrosis factor-alpha) |
| TTL | (total thiol levels) |
References
- Traber, M.G. Vitamin E regulatory mechanisms. Annu. Rev. Nutr. 2007, 27, 347–362. [Google Scholar] [CrossRef] [PubMed]
- Fabian, E.; Bogner, M.; Kickinger, A.; Wagner, K.H.; Elmadfa, I. Vitamin status in elderly people in relation to the use of nutritional supplements. J. Nutr. Health Aging 2012, 16, 206–212. [Google Scholar] [CrossRef] [PubMed]
- Stampfer, M.J.; Hennekens, C.H.; Manson, J.E.; Colditz, G.A.; Rosner, B.; Willett, W.C. Vitamin E consumption and the risk of coronary disease in women. N. Engl. J. Med. 1993, 328, 1444–1449. [Google Scholar] [CrossRef] [PubMed]
- Knekt, P.; Reunanen, A.; Jarvinen, R.; Seppanen, R.; Heliovaara, M.; Aromaa, A. Antioxidant vitamin intake and coronary mortality in a longitudinal population study. Am. J. Epidemiol. 1994, 139, 1180–1189. [Google Scholar] [PubMed]
- Gahche, J.; Bailey, R.; Burt, V.; Hughes, J.; Yetley, E.; Dwyer, J.; Picciano, M.F.; McDowell, M.; Sempos, C. Dietary supplement use among U.S. adults has increased since NHANES III (1988–1994). NCHS Data Brief 2011, 61, 1–8. [Google Scholar] [PubMed]
- Verhagen, H.; Buijsse, B.; Jansen, E.; Bueno-de-Mesquita, B. The state of antioxidant affairs. Nutr. Today 2006, 41, 244–250. [Google Scholar] [CrossRef]
- Vrolijk, M.F.; Opperhuizen, A.; Jansen, E.H.J.M.; Godschalk, R.W.; Van Schooten, F.J.; Bast, A.; Haenen, G.R.M.M. The shifting perception on antioxidants: The case of vitamin E and β-carotene. Redox Biol. 2015, 4, 272–278. [Google Scholar] [CrossRef] [PubMed]
- Moyer, V.A. On behalf of the U.S. Preventive Services Task Force. Vitamin, mineral, and multivitamin supplements for the primary prevention of cardiovascular disease and cancer: U.S. preventive services task force recommendation statement. Ann. Intern. Med. 2014, 160, 558–564. [Google Scholar] [CrossRef] [PubMed]
- Ochi, H.; Takeda, S. The Two Sides of Vitamin E Supplementation. Gerontology 2015, 61, 319–326. [Google Scholar] [CrossRef] [PubMed]
- Miller, E.R.; Pastor-Barriuso, R.; Dalal, D.; Riemersma, R.A.; Appel, L.J.; Guallar, E. Meta-analysis: High-dosage vitamin E supplementation may increase all-cause mortality. Ann. Intern. Med. 2005, 142, 37–46. [Google Scholar] [CrossRef] [PubMed]
- Bjelakovic, G.; Nikolova, D.; Gluud, L.L.; Simonetti, R.G.; Gluud, C. Antioxidant supplements for prevention of mortality in healthy participants and patients with various diseases. Cochrane Database Syst. Rev. 2012, 3, CD007176. [Google Scholar] [PubMed]
- Bjelakovic, G.; Nikolova, D.; Gluud, C. Antioxidant supplements to prevent mortality. JAMA 2013, 310, 1178–1179. [Google Scholar] [CrossRef] [PubMed]
- Rietjens, I.M.C.M.; Boersma, M.G.; de Haan, L.; Spenkelink, B.; Awad, H.M.; Cnubben, N.H.P.; van Zanden, J.J.; van der Woude, H.; Alink, G.M.; Koeman, J. The pro-oxidant chemistry of the natural antioxidants vitamin C, vitamin E, carotenoids and flavonoids. Environ. Toxicol. Pharmacol. 2002, 11, 321–333. [Google Scholar] [CrossRef]
- European Food Safety Authority. Tolerable Upper Intake Levels for Vitamins and Minerals. February 2006. Available online: http://www.efsa.europa.eu/en/ndatopics/docs/ndatolerableuil.pdf (accessed on 14 July 2016).
- Leufkens, A.M.; van Duijnhoven, F.J.B.; Woudt, S.H.S.; Siersema, P.D.; Jenab, M.; Jansen, E.H.J.M.; Pischon, T.; Tjønneland, A.; Olsen, A.; Overvad, K.; et al. Biomarkers of oxidative stress and risk of developing colorectal cancer: A cohort-nested case-control study in the EPIC study. Am. J. Epidemiol. 2012, 175, 653–663. [Google Scholar] [CrossRef] [PubMed]
- Aleksandrova, K.; Jenab, M.; Bueno-de-Mesquita, H.B.; Fedirko, V.; Kaaks, R.; Lukanova, A.; van Duijnhoven, F.J.B.; Jansen, E.; Rinaldi, S.; et al. Biomarker patterns of inflammatory and metabolic pathways are associated with risk of colorectal cancer: Results from the European Prospective Investigation into Cancer and Nutrition (EPIC). Eur. J. Epidemiol. 2014, 29, 261–275. [Google Scholar] [CrossRef] [PubMed]
- Schöttker, B.; Saum, K.U.; Jansen, E.H.J.M.; Boffetta, P.; Trichopoulou, A.; Holleczeck, B.; Dieffenbach, K.; Brenner, H. Oxidative Stress Markers and All-Cause Mortality at Older Age: A Population-Based Cohort Study. J. Gerontol. A Biol. Sci. Med. Sci. 2015, 70, 518–524. [Google Scholar] [CrossRef] [PubMed]
- Saum, K.U.; Dieffenbach, A.K.; Jansen, E.H.J.M.; Holleczek, B.; Hauer, K.; Brenner, H. Association between oxidative stress and frailty in an elderly German population: Results from the ESTHER cohort study. Gerontology 2015, 61, 407–415. [Google Scholar] [CrossRef] [PubMed]
- Jansen, E.; Beekhof, P.; Tamosiunas, A.; Luksiene, D.; Baceviciene, M. Biomarkers of oxidative stress and redox status in a short-term low-dosed multivitamin and mineral supplementation study in two human age groups. Biogerontology 2015, 16, 645–653. [Google Scholar] [CrossRef] [PubMed]
- Meydani, S.N.; Meydani, M.; Bluymberg, J.B.; Leka, L.S.; Pedrosa, M.; Diamond, R.; Schaefer, E.J. Assessment of the safety of supplementation with different amounts of vitamin E in healthy older adults. Am. J. Clin. Nutr. 1998, 68, 311–318. [Google Scholar] [PubMed]
- Singh, U.; Devaraj, S.; Jialal, I. Vitamin E, oxidative stress, and inflammation. Annu. Rev. Nutr. 2005, 25, 151–174. [Google Scholar] [CrossRef] [PubMed]
- Murer, S.B.; Aeberli, I.; Braegger, C.P.; Gittermann, M.; Hersberger, M.; Leonard, S.W.; Taylor, A.W.; Traber, M.G.; Zimmermann, M.B. Antioxidant supplements reduced oxidative stress and stabilized liver function tests but did not reduce inflammation in a randomized controlled trial in obese children and adolescents. J. Nutr. 2014, 144, 193–201. [Google Scholar] [CrossRef] [PubMed]
- Jansen, E.H.J.M.; Beekhof, P.K.; Cremers, J.W.J.M.; Viezeliene, D.; Muzakova, V.; Skalicky, J. Short-term stability of biomarkers of oxidative stress and antioxidant status in human serum. ISRN Biomark. 2013, 2013, 316528. [Google Scholar] [CrossRef]
- Jansen, E.H.J.M.; Beekhof, P.K.; Viezeliene, D.; Muzakova, V.; Skalicky, J. Long term stability of cancer biomarkers of oxidative stress, redox status, homocystein, CRP and liver enzymes in human serum. Biomark. Med. 2015, 9, 425–432. [Google Scholar] [CrossRef] [PubMed]
- Jansen, E.H.J.M.; Beekhof, P.K.; Cremers, J.W.J.M.; Viezeliene, D.; Muzakova, V.; Skalicky, J. Long term stability of parameters of antioxidant status in human serum. Free Radic. Res. 2013, 47, 535–540. [Google Scholar] [CrossRef] [PubMed]


| Compound | Feed A | Feed B | Feed C |
|---|---|---|---|
| mg/kg Diet | mg/kg Diet | mg/kg Diet | |
| Vitamin A | 0.72 | 2.16 | 2.16 |
| Vitamin B1 | 5 | 15 | 15 |
| Vitamin B2 | 7 | 21 | 21 |
| Vitamin B3 | 15 | 45 | 45 |
| Vitamin B5 | 16 | 48 | 48 |
| Vitamin B6 | 6 | 18 | 18 |
| Biotin | 0.2 | 0.6 | 0.6 |
| Folic acid | 0.5 | 1.5 | 1.5 |
| Vitamin B12 | 0.01 | 0.03 | 0.03 |
| Vitamin C | 50 | 150 | 150 |
| Vitamin D3 | 0.025 | 0.075 | 0.075 |
| Vitamin E | 22 | 66 | 550 |
| Vitamin K | 0.3 | 0.9 | 0.9 |
| Choline | 1250 | 3750 | 3750 |
| Calcium | 5000 | 15,000 | 15,000 |
| Potassium | 3000 | 9000 | 9000 |
| Phosphorus | 2000 | 6000 | 6000 |
| Iron | 35 | 105 | 105 |
| Magnesium | 500 | 1500 | 1500 |
| Copper | 6 | 18 | 18 |
| Selenium | 0.15 | 0.45 | 0.45 |
| Zinc | 10 | 30 | 30 |
| Chromium | 1 | 3 | 3 |
| Iodine | 0.15 | 0.45 | 0.45 |
| Manganese | 10 | 30 | 30 |
| Molybdenum | 0.15 | 0.45 | 0.45 |
| Fluorine | 1 | 1 | 1 |
| Sodium | 500 | 500 | 500 |
| Chlorine | 500 | 500 | 500 |
| Silicon | 5 | 5 | 5 |
| Nickel | 0.5 | 0.5 | 0.5 |
| Boron | 0.5 | 0.5 | 0.5 |
| Lithium | 0.1 | 0.1 | 0.1 |
| Vanadium | 0.1 | 0.1 | 0.1 |
© 2016 by the authors; licensee MDPI, Basel, Switzerland. This article is an open access article distributed under the terms and conditions of the Creative Commons Attribution (CC-BY) license (http://creativecommons.org/licenses/by/4.0/).
Share and Cite
Jansen, E.; Viezeliene, D.; Beekhof, P.; Gremmer, E.; Ivanov, L. Tissue-Specific Effects of Vitamin E Supplementation. Int. J. Mol. Sci. 2016, 17, 1166. https://doi.org/10.3390/ijms17071166
Jansen E, Viezeliene D, Beekhof P, Gremmer E, Ivanov L. Tissue-Specific Effects of Vitamin E Supplementation. International Journal of Molecular Sciences. 2016; 17(7):1166. https://doi.org/10.3390/ijms17071166
Chicago/Turabian StyleJansen, Eugene, Dale Viezeliene, Piet Beekhof, Eric Gremmer, and Leonid Ivanov. 2016. "Tissue-Specific Effects of Vitamin E Supplementation" International Journal of Molecular Sciences 17, no. 7: 1166. https://doi.org/10.3390/ijms17071166