
Computational Analysis of Single Nucleotide Polymorphisms Associated with Altered Drug Responsiveness in Type 2 Diabetes

 ,
,  ,
, 
Abstract
: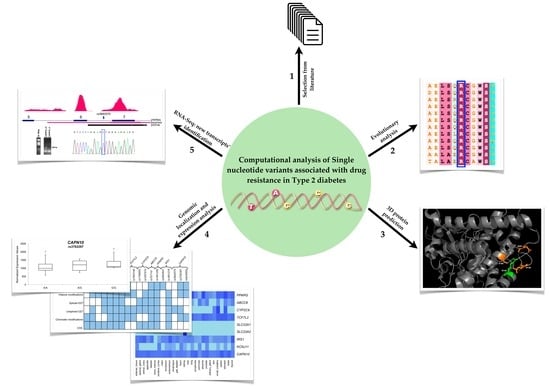
1. Introduction
2. Results
2.1. Computational Predictions for Coding SNPs
2.2. SNPs Map to Regulatory Regions and Motifs of Transcription Factors
2.3. RNA-Seq Identifies New Transcripts of the CAPN10 Gene
3. Discussion
4. Materials and Methods
4.1. Computational Predictions of Amino Acid Changes
4.2. In Silico Analysis of Epimarks and Regulatory Motifs
4.3. RNA-Sequencing: Library Preparation and Data Analysis
4.4. In Vitro Validations
Supplementary Materials
Acknowledgments
Author Contributions
Conflicts of Interest
References
- Shaw, J.E.; Sicree, R.A.; Zimmet, P.Z. Global estimates of the prevalence of diabetes for 2010 and 2030. Diabetes Res. Clin. Pract. 2010, 87, 4–14. [Google Scholar] [CrossRef] [PubMed]
- World Health Organization (WHO). Diabetes; World Health Organization: Geneva, Switzerland, 2016. [Google Scholar]
- Hattersley, A.; Bruining, J.; Shield, J.; Njolstad, P.; Donaghue, K.C. The diagnosis and management of monogenic diabetes in children and adolescents. Pediatr. Diabetes 2009, 10 (Suppl. 12), 33–42. [Google Scholar] [CrossRef] [PubMed]
- Mannino, G.C.; Sesti, G. Individualized therapy for type 2 diabetes: Clinical implications of pharmacogenetic data. Mol. Diagn. Ther. 2012, 16, 285–302. [Google Scholar] [CrossRef] [PubMed]
- Rendell, M. The role of sulphonylureas in the management of type 2 diabetes mellitus. Drugs 2004, 64, 1339–1358. [Google Scholar] [CrossRef] [PubMed]
- Kirpichnikov, D.; McFarlane, S.I.; Sowers, J.R. Metformin: An update. Ann. Intern. Med. 2002, 137, 25–33. [Google Scholar] [CrossRef] [PubMed]
- Hauner, H. The mode of action of thiazolidinediones. Diabetes Metab. Res. Rev. 2002, 18 (Suppl. 2), S10–S15. [Google Scholar] [CrossRef] [PubMed]
- Becker, M.L.; Pearson, E.R.; Tkáč, I. Pharmacogenetics of oral antidiabetic drugs. J. Endocrinol. Diabetes 2013, 2013, 686315. [Google Scholar] [CrossRef] [PubMed]
- Javorsky, M.; Klimcakova, L.; Schroner, Z.; Zidzik, J.; Babjakova, E.; Fabianova, M.; Kozarova, M.; Tkacova, R.; Salagovic, J.; Tkac, I. KCNJ11 gene E23K variant and therapeutic response to sulphonylureas. Eur. J. Intern. Med. 2012, 23, 245–249. [Google Scholar] [CrossRef] [PubMed]
- He, Y.Y.; Zhang, R.; Shao, X.Y.; Hu, C.; Wang, C.R.; Lu, J.X.; Bao, Y.Q.; Jia, W.P.; Xiang, K.S. Association of KCNJ11 and ABCC8 genetic polymorphisms with response to repaglinide in Chinese diabetic patients. Acta Pharmacol. Sin. 2008, 29, 983–989. [Google Scholar] [CrossRef] [PubMed]
- Montgomery, S.B.; Sammeth, M.; Gutierrez-Arcelus, M.; Lach, R.P.; Ingle, C.; Nisbett, J.; Guigo, R.; Dermitzakis, E.T. Transcriptome genetics using second generation sequencing in a Caucasian population. Nature 2010, 464, 773–777. [Google Scholar] [CrossRef] [PubMed]
- Emilien, G.; Ponchon, M.; Caldas, C.; Isacson, O.; Maloteaux, J.M. Impact of genomics on drug discovery and clinical medicine. QJM 2000, 93, 391–423. [Google Scholar] [CrossRef] [PubMed]
- Di Stefano, J.K.; Watanabe, R.M. Pharmacogenetics of Anti-Diabetes Drugs. Pharmaceuticals 2010, 3, 2610–2646. [Google Scholar] [CrossRef] [PubMed]
- Pruitt, K.D.; Brown, G.R.; Hiatt, S.M.; Thibaud-Nissen, F.; Astashyn, A.; Ermolaeva, O.; Farrell, C.M.; Hart, J.; Landrum, M.J.; McGarvey, K.M.; et al. RefSeq: An update on mammalian reference sequences. Nucleic Acids Res. 2014, 42, D756–D763. [Google Scholar] [CrossRef] [PubMed]
- Petryszak, R.; Burdett, T.; Fiorelli, B.; Fonseca, N.A.; Gonzalez-Porta, M.; Hastings, E.; Huber, W.; Jupp, S.; Keays, M.; Kryvych, N.; et al. Expression Atlas update—A database of gene and transcript expression from microarray- and sequencing-based functional genomics experiments. Nucleic Acids Res. 2014, 42, D926–D932. [Google Scholar] [CrossRef] [PubMed]
- Aquilante, C.L. Sulfonylurea pharmacogenomics in Type 2 diabetes: The influence of drug target and diabetes risk polymorphisms. Expert Rev. Cardiovasc. Ther. 2010, 8, 359–372. [Google Scholar] [CrossRef] [PubMed]
- Kirchheiner, J.; Brockmöller, J. Clinical consequences of cytochrome P450 2C9 polymorphisms. Clin. Pharmacol. Ther. 2005, 77, 1–16. [Google Scholar] [CrossRef] [PubMed]
- Wen, X.; Wang, J.S.; Backman, J.T.; Laitila, J.; Neuvonen, P.J. Trimethoprim and sulfamethoxazole are selective inhibitors of CYP2C8 and CYP2C9, respectively. Drug Metab. Dispos. 2002, 30, 631–635. [Google Scholar] [CrossRef] [PubMed]
- Florez, J.C.; Jablonski, K.A.; Sun, M.W.; Bayley, N.; Kahn, S.E.; Shamoon, H.; Hamman, R.F.; Knowler, W.C.; Nathan, D.M.; Altshuler, D.; et al. Effects of the type 2 diabetes-associated PPARG P12A polymorphism on progression to diabetes and response to troglitazone. J. Clin. Endocrinol. Metab. 2007, 92, 1502–1509. [Google Scholar] [CrossRef] [PubMed]
- Thierry-Mieg, D.; Thierry-Mieg, J. AceView: A comprehensive cDNA-supported gene and transcripts annotation. Genome Biol. 2006, 7 (Suppl. 1), S12. [Google Scholar] [CrossRef] [PubMed]
- Costa, V.; Esposito, R.; Pallante, P.; Ciccodicola, A.; Fusco, A. The “next-generation” knowledge of papillary thyroid carcinoma. Cell Cycle 2015, 14, 2018–2021. [Google Scholar] [CrossRef] [PubMed] [Green Version]
- Aversa, R.; Sorrentino, A.; Esposito, R.; Ambrosio, M.R.; Amato, A.; Zambelli, A.; Ciccodicola, A.; D’Apice, L.; Costa, V. Alternative Splicing in Adhesion- and Motility-Related Genes in Breast Cancer. Int. J. Mol. Sci. 2016, 17, 121. [Google Scholar] [CrossRef] [PubMed]
- Shikata, E.; Yamamoto, R.; Takane, H.; Shigemasa, C.; Ikeda, T.; Otsubo, K.; Ieiri, I. Human organic cation transporter (OCT1 and OCT2) gene polymorphisms and therapeutic effects of metformin. J. Hum. Genet. 2007, 52, 117–122. [Google Scholar] [CrossRef] [PubMed]
- Ekeruo, I.A.; Solhpour, A.; Taegtmeyer, H. Metformin in Diabetic Patients with Heart Failure: Safe and Effective? Curr. Cardiovasc. Risk Rep. 2013, 7, 417–422. [Google Scholar] [CrossRef] [PubMed]
- Klen, J.; Dolžan, V.; Janež, A. CYP2C9, KCNJ11 and ABCC8 polymorphisms and the response to sulphonylurea treatment in type 2 diabetes patients. Eur. J. Clin. Pharmacol. 2014, 70, 421–428. [Google Scholar]
- Wei, L.; Locuson, C.W.; Tracy, T.S. Polymorphic variants of CYP2C9: Mechanisms involved in reduced catalytic activity. Mol. Pharmacol. 2007, 72, 1280–1288. [Google Scholar] [CrossRef] [PubMed]
- Crespi, C.L.; Miller, V.P. The R144C change in the CYP2C9*2 allele alters interaction of the cytochrome P450 with NADPH: Cytochrome P450 oxidoreductase. Pharmacogenetics 1997, 7, 203–210. [Google Scholar] [CrossRef] [PubMed]
- Becker, M.L.; Visser, L.E.; Trienekens, P.H.; Hofman, A.; van Schaik, R.H.; Stricker, B.H. Cytochrome P450 2C9 *2 and *3 polymorphisms and the dose and effect of sulfonylurea in type II diabetes mellitus. Clin. Pharmacol. Ther. 2008, 83, 288–292. [Google Scholar] [CrossRef] [PubMed]
- Ragia, G.; Tavridou, A.; Petridis, I.; Manolopoulos, V.G. Association of KCNJ11 E23K gene polymorphism with hypoglycemia in sulfonylurea-treated type 2 diabetic patients. Diabetes Res. Clin. Pract. 2012, 98, 119–124. [Google Scholar] [CrossRef] [PubMed]
- Raciti, G.A.; Nigro, C.; Longo, M.; Parrillo, L.; Miele, C.; Formisano, P.; Béguinot, F. Personalized medicine and type 2 diabetes: Lesson from epigenetics. Epigenomics 2014, 6, 229–238. [Google Scholar] [CrossRef] [PubMed]
- Pollastro, C.; Ziviello, C.; Costa, V.; Ciccodicola, A. Pharmacogenomics of Drug Response in Type 2 Diabetes: Toward the Definition of Tailored Therapies? PPAR Res. 2015, 2015, 415149. [Google Scholar] [CrossRef] [PubMed]
- Sakamoto, Y.; Inoue, H.; Keshavarz, P.; Miyawaki, K.; Yamaguchi, Y.; Moritani, M.; Kunika, K.; Nakamura, N.; Yoshikawa, T.; Yasui, N.; et al. SNPs in the KCNJ11-ABCC8 gene locus are associated with type 2 diabetes and blood pressure levels in the Japanese population. J. Hum. Genet. 2007, 52, 781–793. [Google Scholar] [CrossRef] [PubMed]
- Song, Y.; Niu, T.; Manson, J.E.; Kwiatkowski, D.J.; Liu, S. Are variants in the CAPN10 gene related to risk of type 2 diabetes? A quantitative assessment of population and family-based association studies. Am. J. Hum. Genet. 2004, 74, 208–222. [Google Scholar] [CrossRef] [PubMed]
- The UniProt Database. Available online: http://www.uniprot.org (accessed on 7 December 2015).
- McLaren, W.; Pritchard, B.; Rios, D.; Chen, Y.; Flicek, P.; Cunningham, F. Deriving the consequences of genomic variants with the Ensembl API and SNP Effect Predictor. Bioinformatics 2010, 26, 2069–2070. [Google Scholar] [CrossRef] [PubMed]
- Venselaar, H.; Te Beek, T.A.; Kuipers, R.K.; Hekkelman, M.L.; Vriend, G. Protein structure analysis of mutations causing inheritable diseases. An e-Science approach with life scientist friendly interfaces. BMC Bioinform. 2010, 11, 548. [Google Scholar] [CrossRef] [PubMed]
- Zhang, Y. I-TASSER server for protein 3D structure prediction. BMC Bioinform. 2008, 9, 40. [Google Scholar] [CrossRef] [PubMed]
- The PyMOL Molecular Graphics System, Version 1.8 Schrödinger, LLC. Available online: http://www.pymol.org (accessed on 18 January 2016).
- Celniker, G.; Nimrod, G.; Ashkenazy, H.; Glaser, F.; Martz, E.; Mayrose, I.; Pupko, T.; Ben-Tal, N. ConSurf: Using Evolutionary Data to Raise Testable Hypotheses about Protein Function. Isr. J. Chem. 2013, 53, 199–206. [Google Scholar] [CrossRef]
- Sherry, S.T.; Ward, M.; Sirotkin, K. dbSNP-database for single nucleotide polymorphisms and other classes of minor genetic variation. Genome Res. 1999, 9, 677–679. [Google Scholar] [PubMed]
- Kent, W.J.; Sugnet, C.W.; Furey, T.S.; Roskin, K.M.; Pringle, T.H.; Zahler, A.M.; Haussler, D. The human genome browser at UCSC. Genome Res. 2002, 12, 996–1006. [Google Scholar]
- Chang, T.H.; Huang, H.Y.; Hsu, J.B.; Weng, S.L.; Horng, J.T.; Huang, H.D. An enhanced computational platform for investigating the roles of regulatory RNA and for identifying functional RNA motifs. BMC Bioinform. 2013, 14 (Suppl. 2), S4. [Google Scholar] [CrossRef]
- Scarpato, M.; Esposito, R.; Evangelista, D.; Aprile, M.; Ambrosio, M.R.; Angelini, C.; Ciccodicola, A.; Costa, V. AnaLysis of Expression on human chromosome 21, ALE-HSA21: A pilot integrated web resource. Database 2014, 2014, bau009. [Google Scholar] [CrossRef] [PubMed]
- Thorvaldsdóttir, H.; Robinson, J.T.; Mesirov, J.P. Integrative Genomics Viewer (IGV): High-performance genomics data visualization and exploration. Brief Bioinform. 2013, 14, 178–192. [Google Scholar] [CrossRef] [PubMed]
- Kapushesky, M.; Emam, I.; Holloway, E.; Kurnosov, P.; Zorin, A.; Malone, J.; Rustici, G.; Williams, E.; Parkinson, H.; Brazma, A. Gene expression atlas at the European bioinformatics institute. Nucleic Acids Res. 2010, 38, D690–D698. [Google Scholar] [CrossRef] [PubMed]
- Costa, V.; Casamassimi, A.; Roberto, R.; Gianfrancesco, F.; Matarazzo, M.R.; D’Urso, M.; D’Esposito, M.; Rocchi, M.; Ciccodicola, A. DDX11L: A novel transcript family emerging from human subtelomeric regions. BMC Genom. 2009, 10, 250. [Google Scholar] [CrossRef] [PubMed]
- Trapnell, C.; Pachter, L.; Salzberg, S.L. TopHat: Discovering splice junctions with RNA-Seq. Bioinformatics 2009, 25, 1105–1111. [Google Scholar] [CrossRef] [PubMed]
- Quinlan, A.R.; Hall, I.M. BEDTools: A flexible suite of utilities for comparing genomic features. Bioinformatics 2010, 26, 841–842. [Google Scholar] [CrossRef] [PubMed]
- Costa, V.; Esposito, R.; Ziviello, C.; Sepe, R.; Bim, L.V.; Cacciola, N.A.; Decaussin-Petrucci, M.; Pallante, P.; Fusco, A.; Ciccodicola, A. New somatic mutations and WNK1-B4GALNT3 gene fusion in papillary thyroid carcinoma. Oncotarget 2015, 6, 11242–11251. [Google Scholar] [CrossRef] [PubMed]
- Russo, F.; Angelini, C. RNASeqGUI: A GUI for analysing RNA-Seq data. Bioinformatics 2014, 30, 2514–2516. [Google Scholar] [CrossRef] [PubMed]
- Dedman, A.M.; Majeed, Y.; Tumova, S.; Zeng, F.; Kumar, B.; Munsch, C.; Bateson, A.N.; Wittmann, J.; Jäck, H.M.; Porter, K.E.; et al. TRPC1 transcript variants, inefficient nonsense-mediated decay and low up-frameshift-1 in vascular smooth muscle cells. BMC Mol. Biol. 2011, 12, 30. [Google Scholar] [CrossRef] [PubMed]


| Chromosome | Position | Localization | Gene | Alleles | SNP ID | Amino Acid Change |
|---|---|---|---|---|---|---|
| 6 | 160543148 | Exon | SLC22A1 | C/T | rs12208357 | R61C |
| 160560824 | Exon | A/G | rs34130495 | G401S | ||
| 160560881 | Exon | -/A | rs35167514 | 420del | ||
| 160575837 | Exon | A/C/G | rs34059508 | G465R | ||
| 6 | 160670282 | Exon | SLC22A2 | G/T | rs316019 | S270A |
| 11 | 17409572 | Exon | KCNJ11 | T/C | rs5219 | K23E |
| 17408630 | Exon | G/A | rs5215 | V337I | ||
| 10 | 114808902 | Intron | TCF7L2 | G/T | rs12255372 | - |
| 114758349 | Intron | C/T | rs7903146 | - | ||
| 10 | 96702047 | Exon | CYP2C9 | C/T | rs1799853 | R144C |
| 96741053 | Exon | A/C | rs1057910 | I359L | ||
| 11 | 17418477 | Exon | ABCC8 | G/T | rs757110 | A1369S |
| 3 | 12393125 | Exon | PPARG | C/G | rs1801282 | P12A |
| 2 | 227093745 | Intergenic | IRS1 | C/T | rs2943641 | - |
| 227660544 | Exon | G/A | rs1801278 | G971R | ||
| 2 | 241534293 | Intron | CAPN10 | Indel | rs3842570 | - |
| 241531174 | Intron | A/G | rs3792267 | - | ||
| 241542703 | Intron | C/T | rs5030952 | - |
| Gene | SNP | Codon | Amino Acid | Score | Prediction | ||
|---|---|---|---|---|---|---|---|
| SIFT | PolyPhen | SIFT | PolyPhen | ||||
| SLC22A1 | rs12208357 | CGC/TGC | R61C | 0.01 | 0.954 | D | PD |
| rs34130495 | GGC/AGC | G401S | 0 | 0.999 | D | PD | |
| rs35167514 | ATG/TG | M420del | - | - | - | - | |
| rs34059508 | GGA/AGA | G465R | 0 | 0.984 | D | PD | |
| SLC22A2 | rs316019 | TCT/GCT | S270A | 0.01 | 0.524 | D | PD |
| KCNJ11 | rs5215 | GTC/ATC | V337I | 0.08 | 0.015 | T | B |
| rs5219 | AAG/GAG | K23E | 0.17 | 0 | T | B | |
| CYP2C9 | rs1799853 | CGT/TGT | R144C | 0.03 | 0.978 | D | PD |
| rs1057910 | ATT/CTT | I359L | 0.09 | 0.45 | T | PD | |
| ABCC8 | rs757110 | GCC/TCC | A1369S | 0.73 | 0 | T | B |
| PPARG | rs1801282 | CCA/GCA | P12A | 0 | 0 | D | B |
| IRS1 | rs1801278 | GGG/AGG | G971R | 0.51 | 0.986 | T | PD |
© 2016 by the authors; licensee MDPI, Basel, Switzerland. This article is an open access article distributed under the terms and conditions of the Creative Commons Attribution (CC-BY) license (http://creativecommons.org/licenses/by/4.0/).
Share and Cite
Costa, V.; Federico, A.; Pollastro, C.; Ziviello, C.; Cataldi, S.; Formisano, P.; Ciccodicola, A. Computational Analysis of Single Nucleotide Polymorphisms Associated with Altered Drug Responsiveness in Type 2 Diabetes. Int. J. Mol. Sci. 2016, 17, 1008. https://doi.org/10.3390/ijms17071008
Costa V, Federico A, Pollastro C, Ziviello C, Cataldi S, Formisano P, Ciccodicola A. Computational Analysis of Single Nucleotide Polymorphisms Associated with Altered Drug Responsiveness in Type 2 Diabetes. International Journal of Molecular Sciences. 2016; 17(7):1008. https://doi.org/10.3390/ijms17071008
Chicago/Turabian StyleCosta, Valerio, Antonio Federico, Carla Pollastro, Carmela Ziviello, Simona Cataldi, Pietro Formisano, and Alfredo Ciccodicola. 2016. "Computational Analysis of Single Nucleotide Polymorphisms Associated with Altered Drug Responsiveness in Type 2 Diabetes" International Journal of Molecular Sciences 17, no. 7: 1008. https://doi.org/10.3390/ijms17071008