
Maternal Chromium Restriction Leads to Glucose Metabolism Imbalance in Mice Offspring through Insulin Signaling and Wnt Signaling Pathways

Abstract
:
1. Introduction
2. Results
2.1. Dams
2.2. Pups
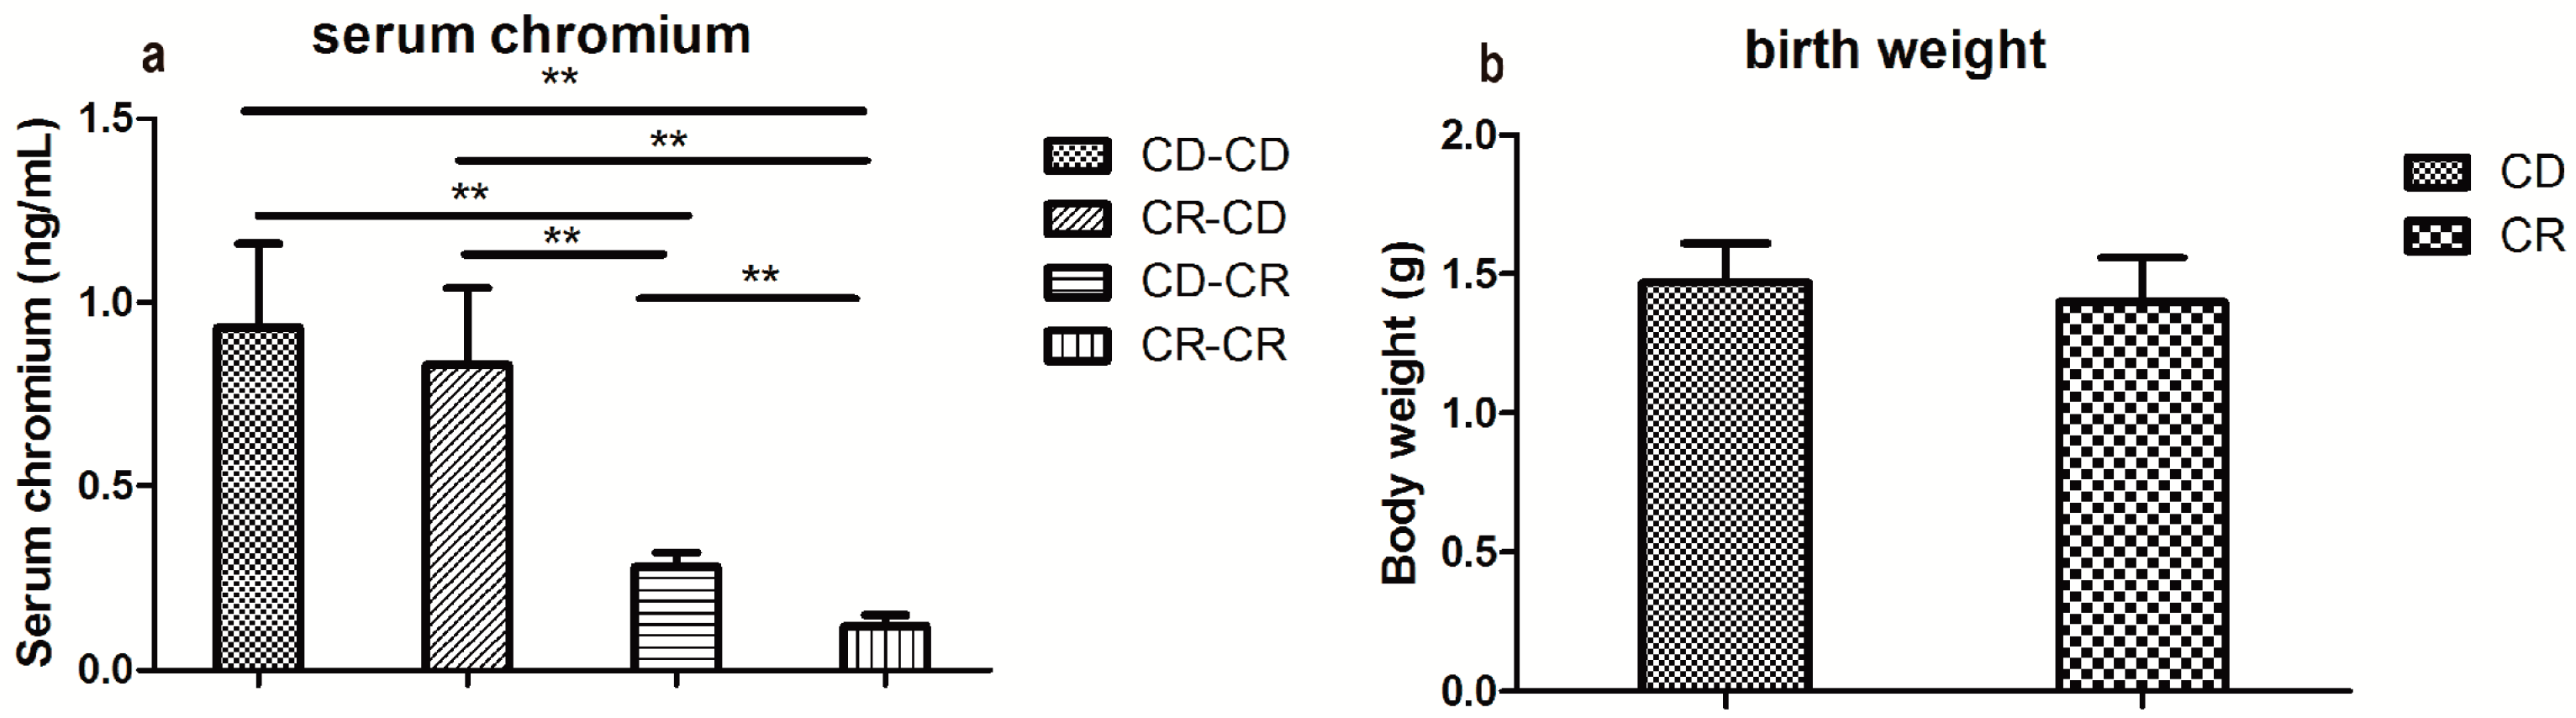
2.2.1. Serum Chromium Concentration
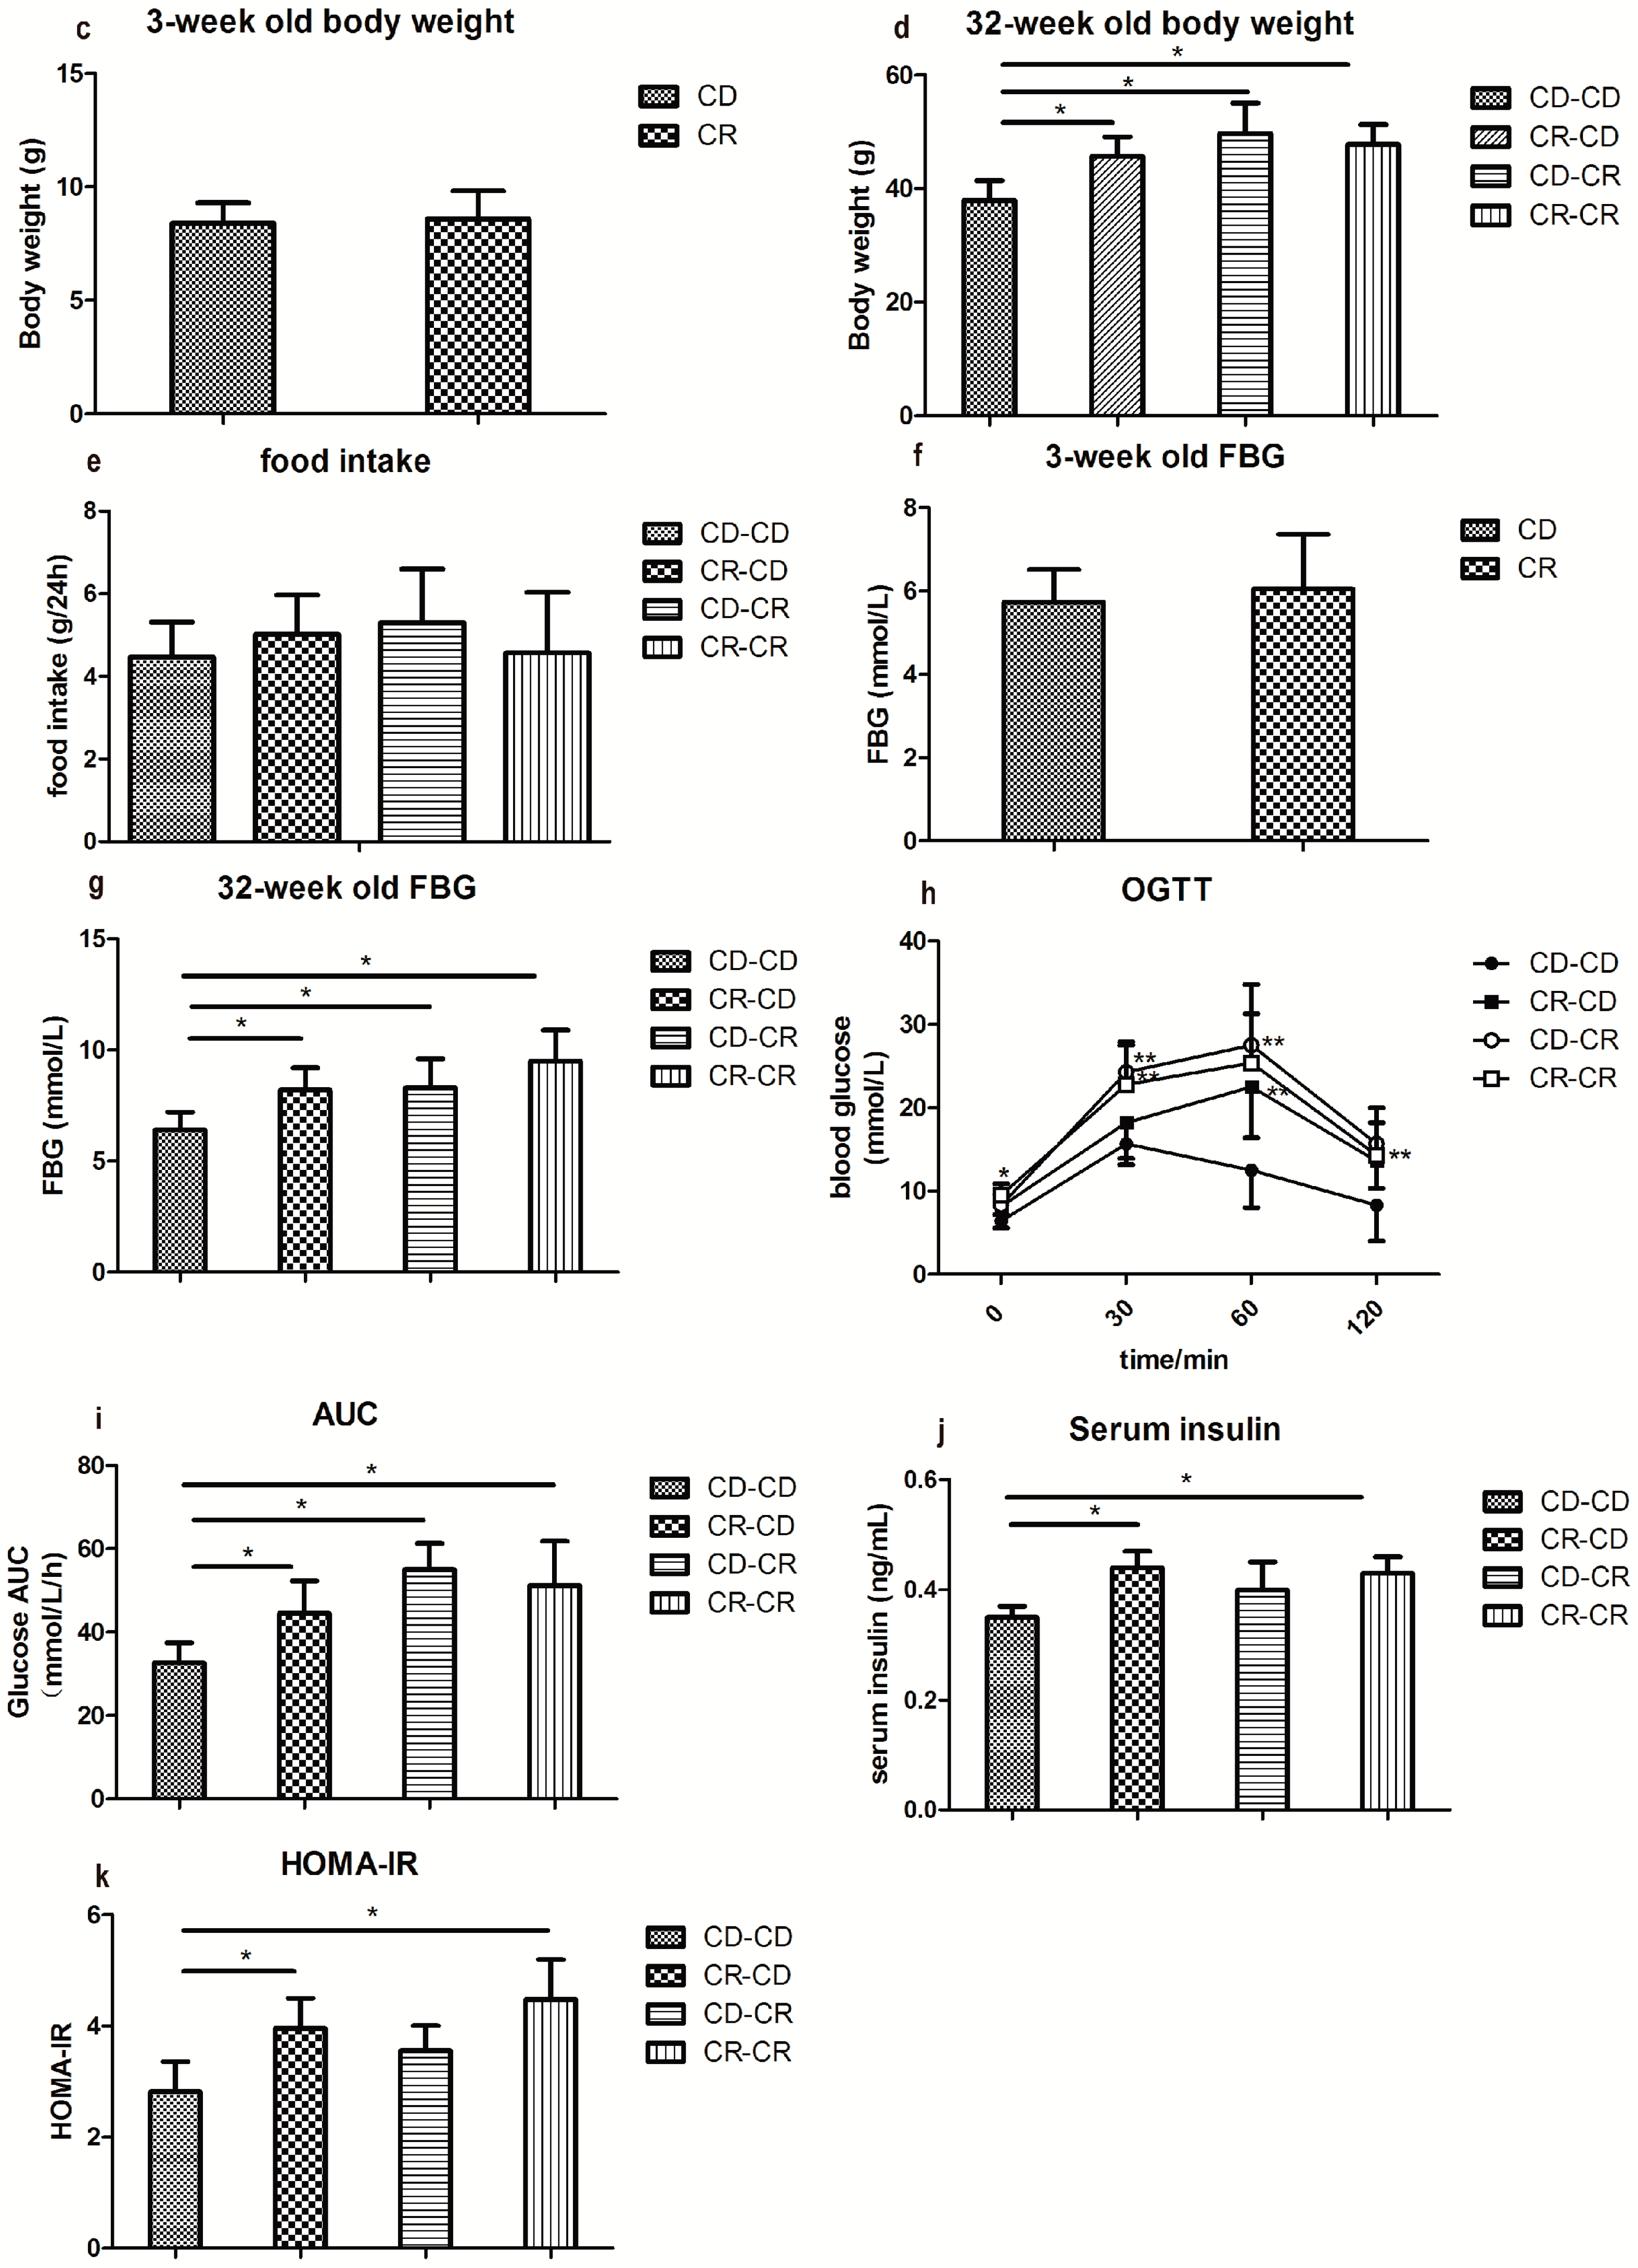
2.2.2. Body Weight and Food Intake
2.2.3. Fasting Blood Glucose and Glucose Tolerance
2.2.4. Fasting Insulin and Homeostasis Model Assessment of Insulin Resistance (HOMA-IR)
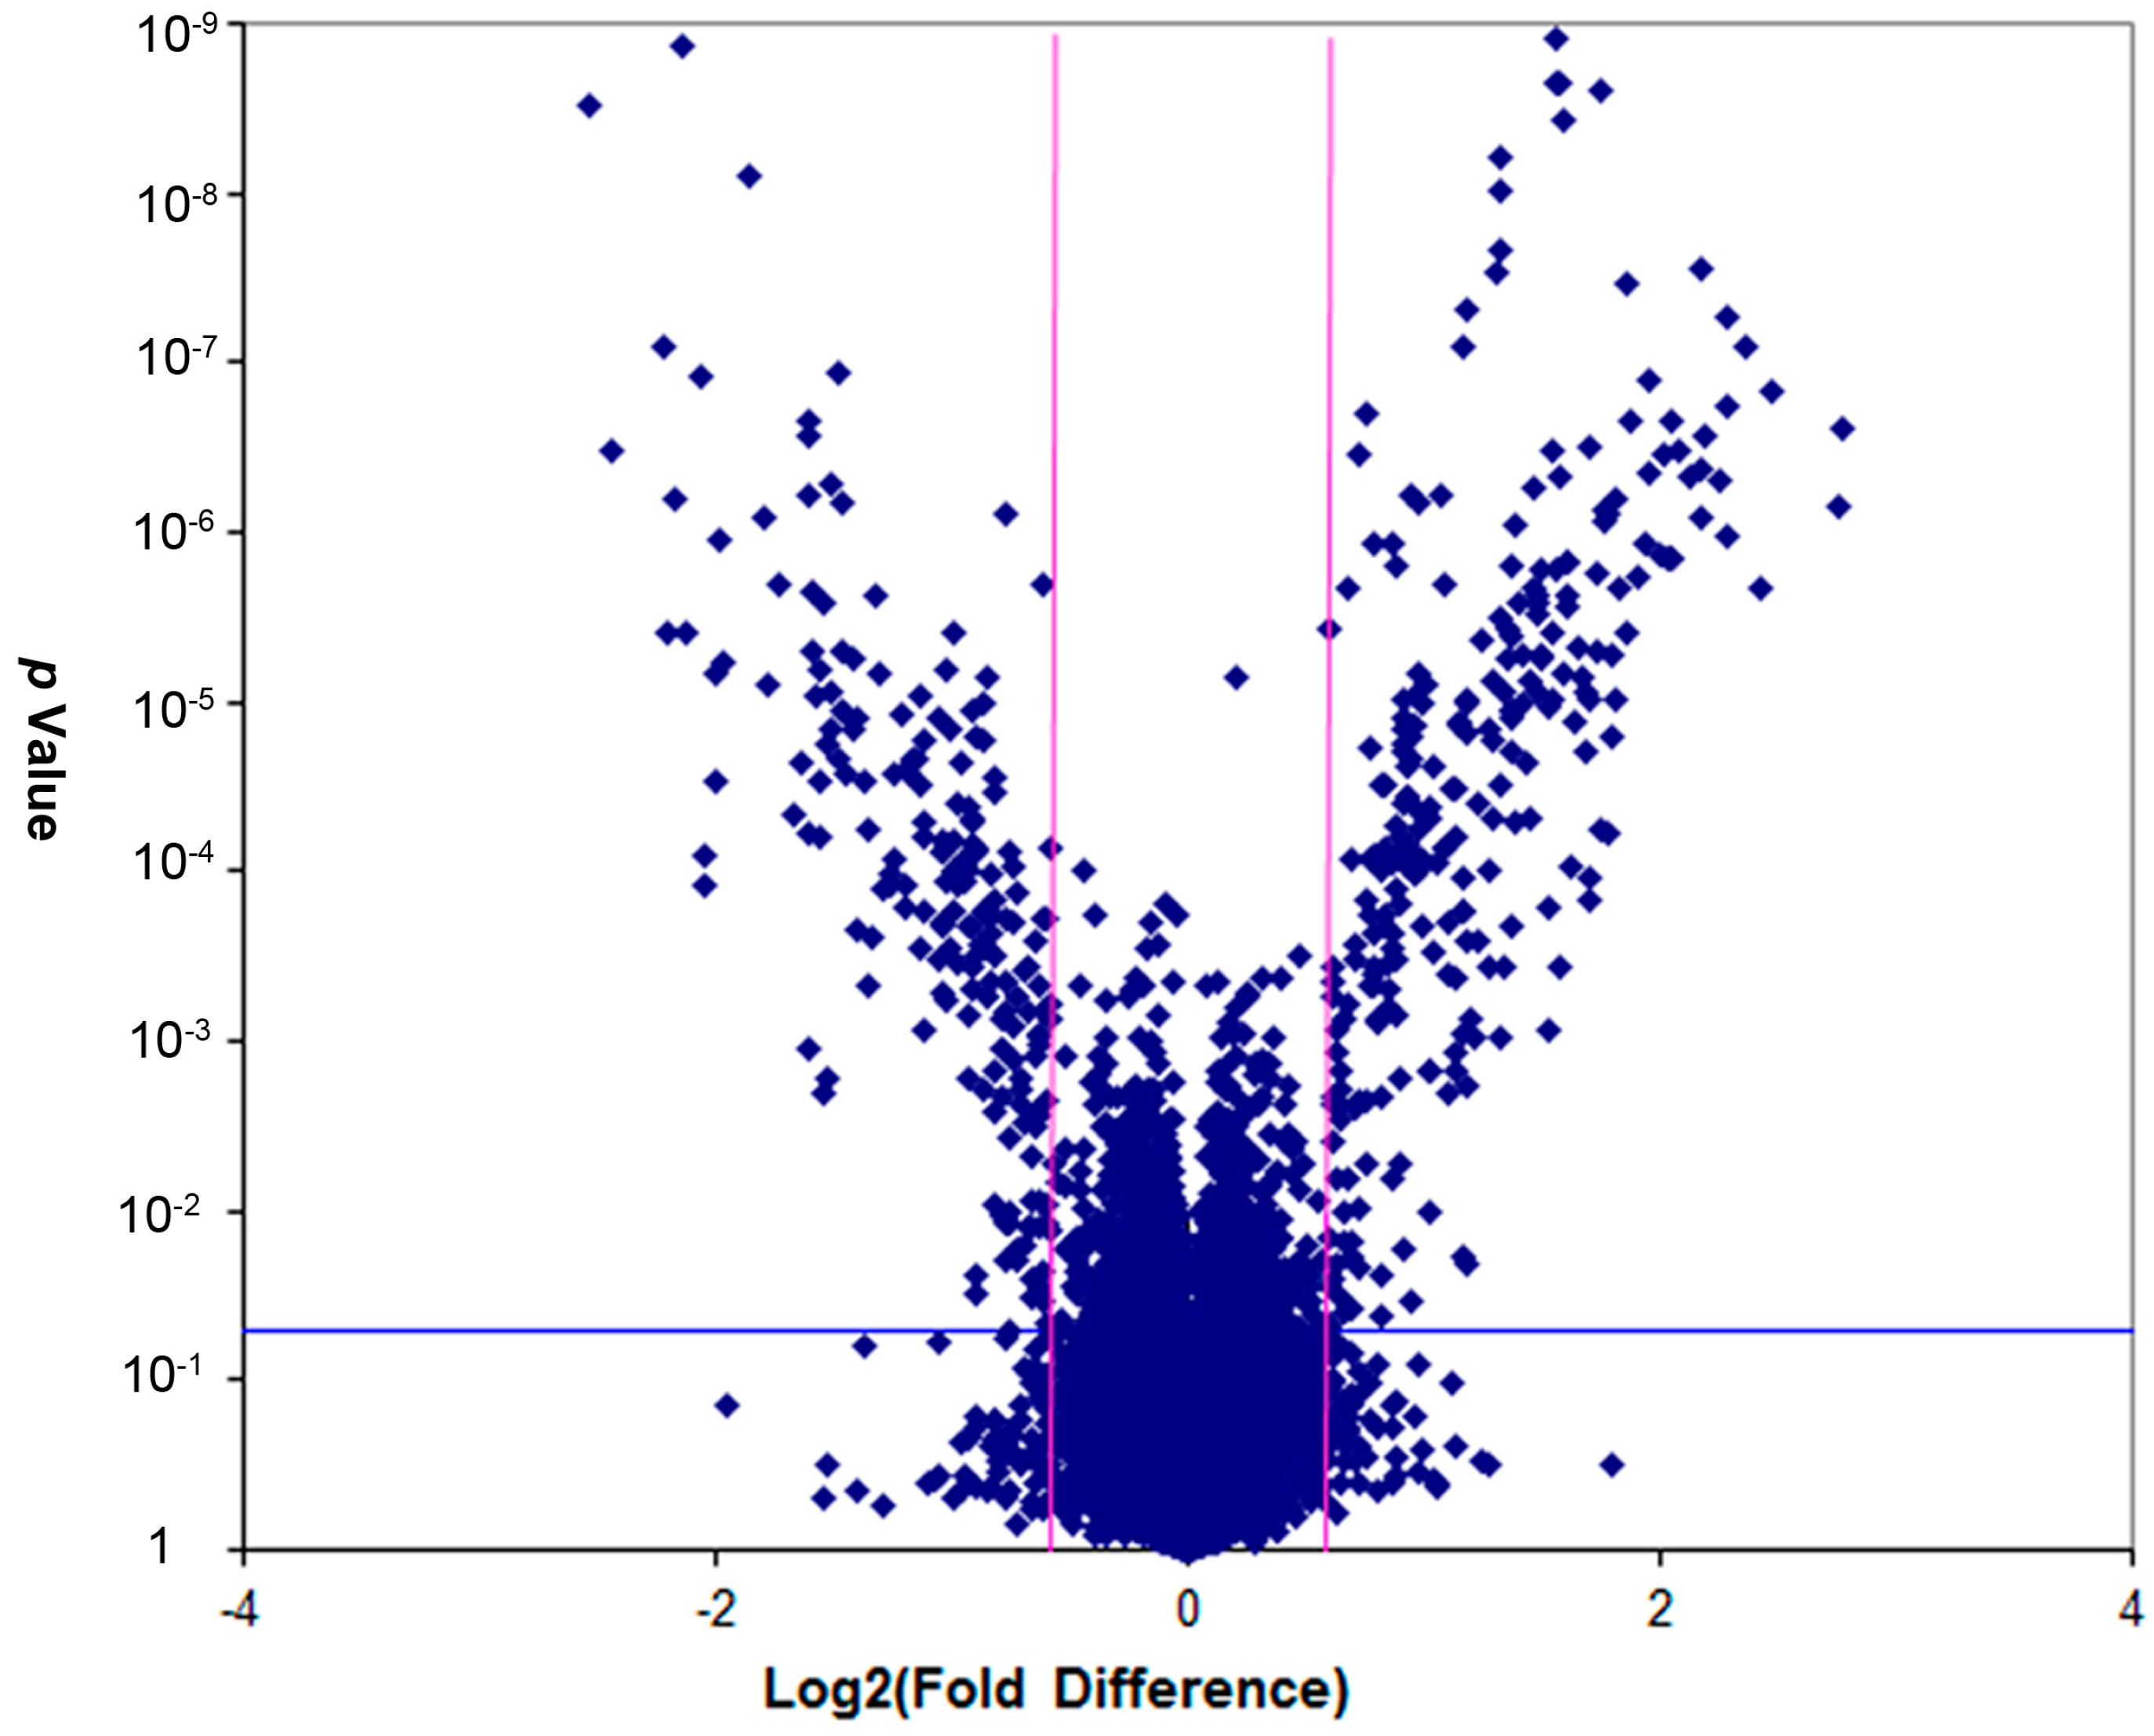
2.2.5. Screening of Differentially-Expressed Genes
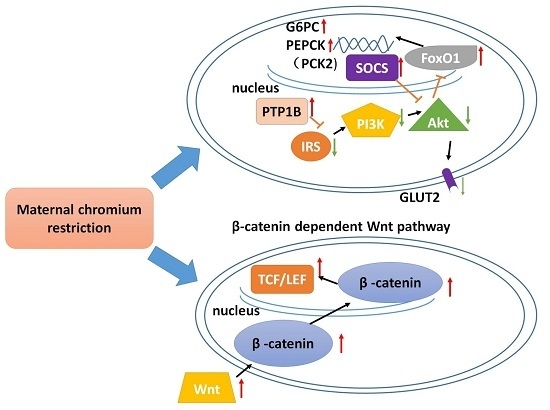
2.2.6. Pathway and Gene Ontologies (GO) Analysis
2.2.7. Networks Analysis
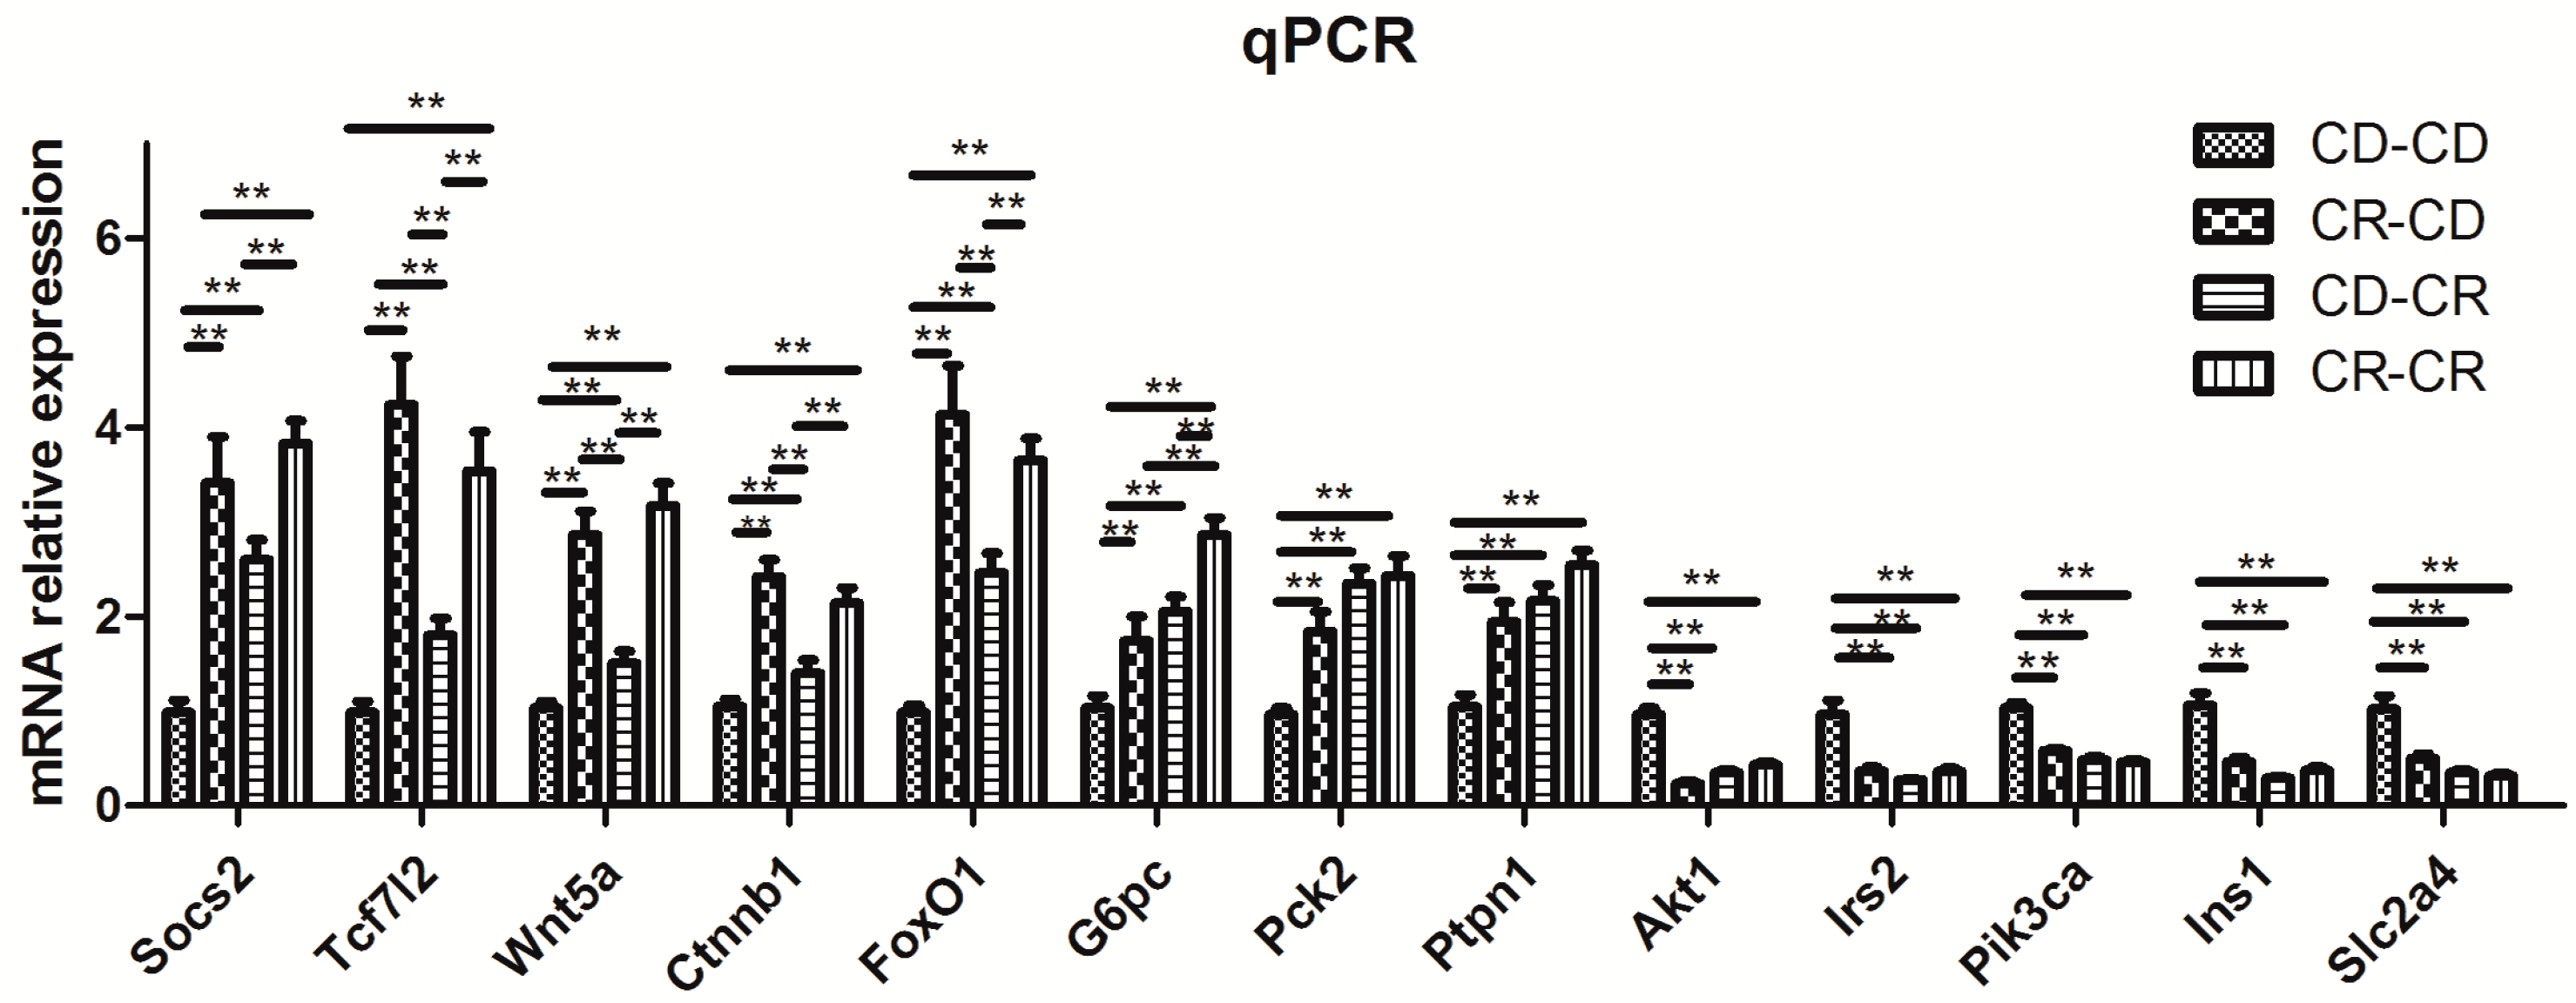
2.2.8. Results of Real-Time PCR Verification
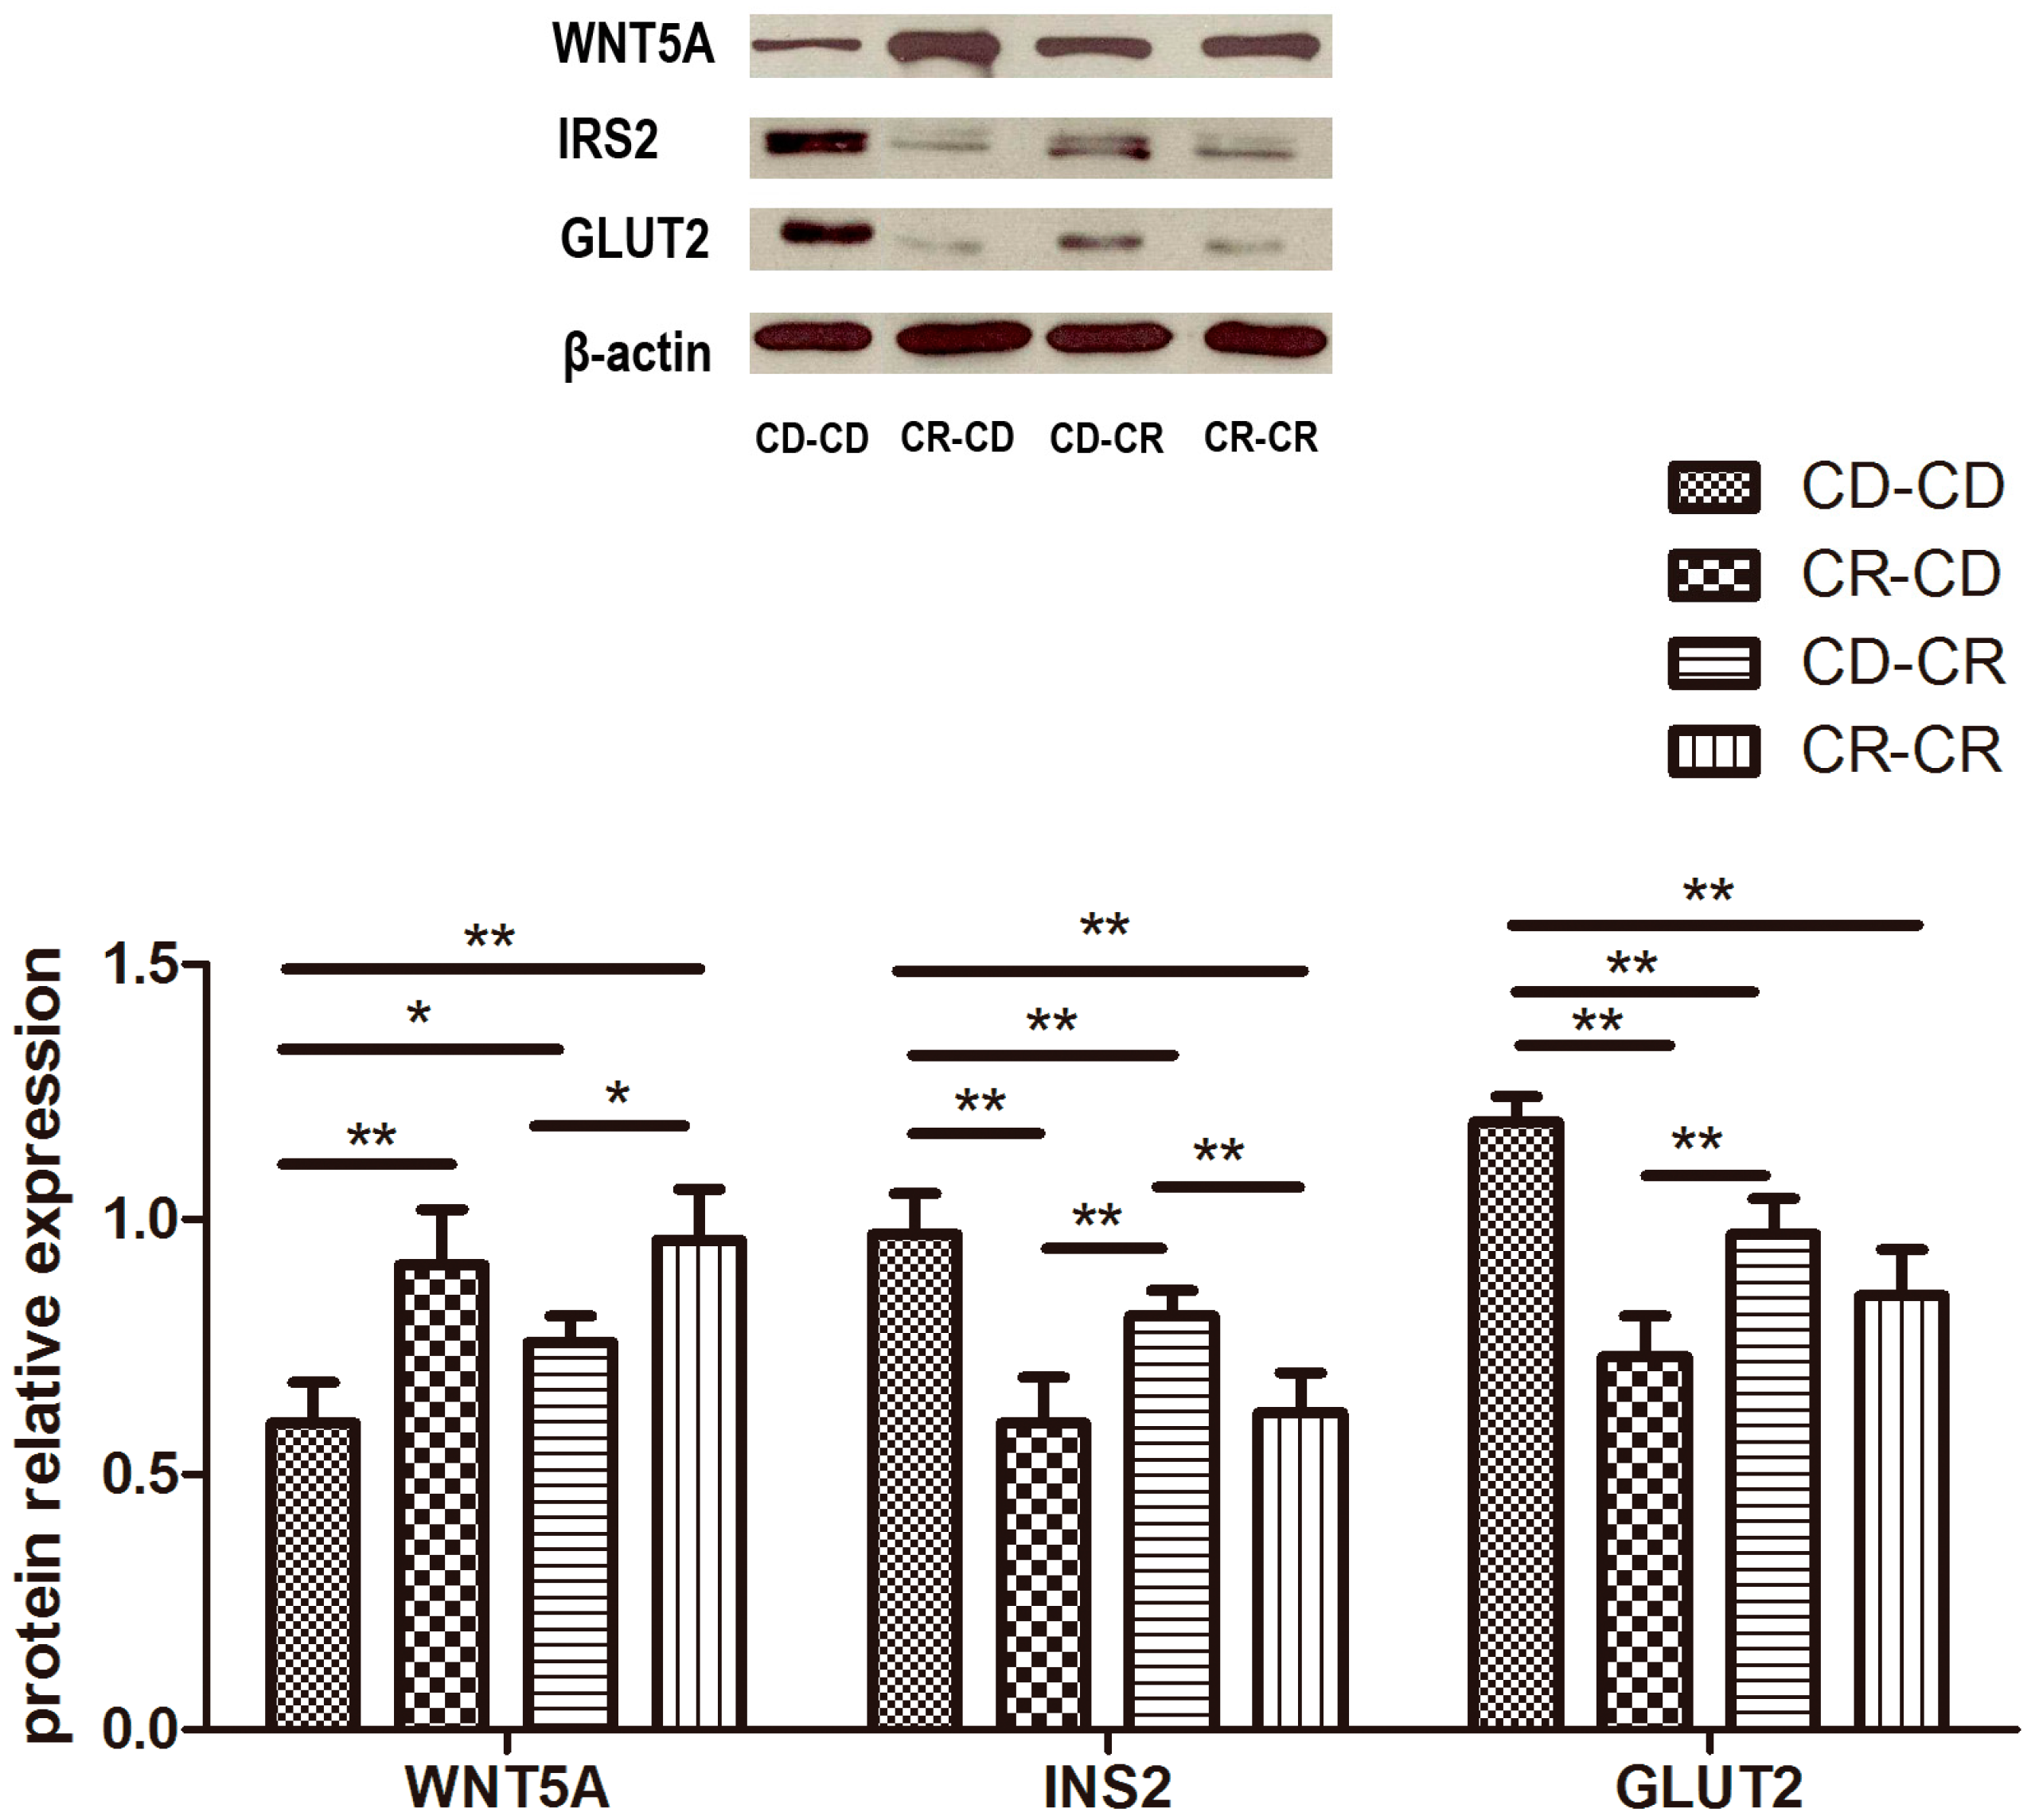
2.2.9. Western Blot
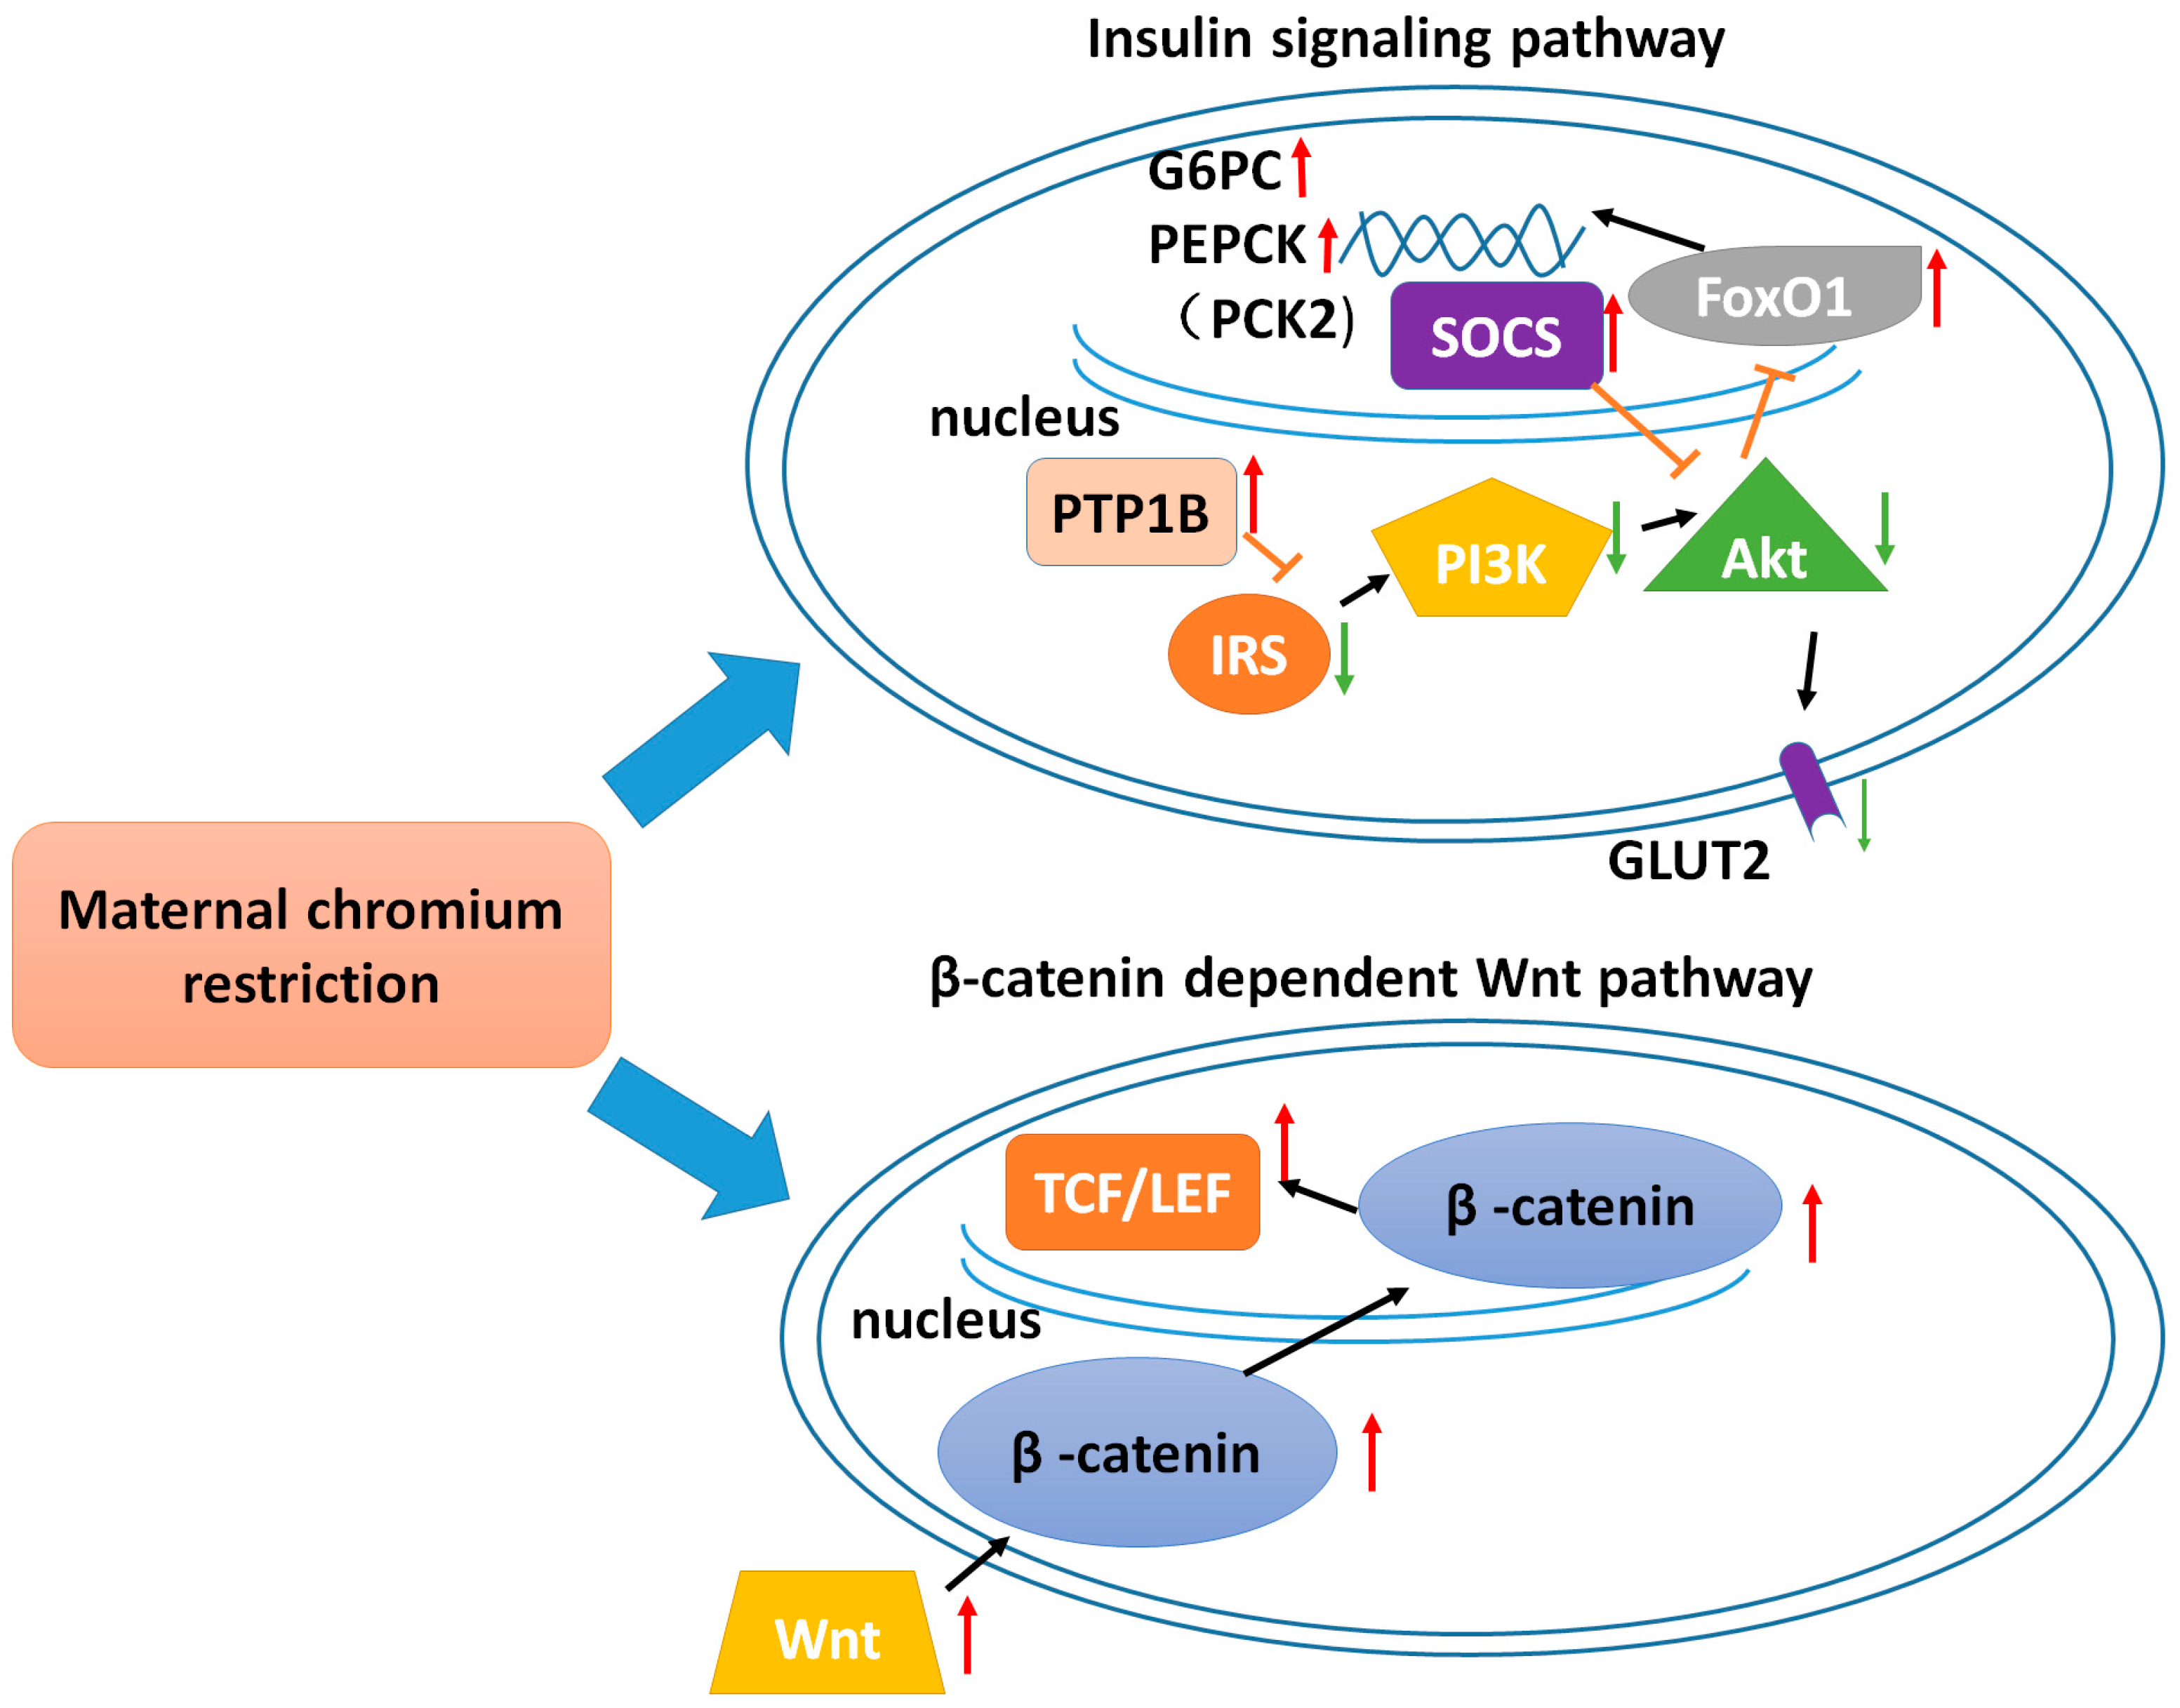
3. Discussion
4. Materials and Methods
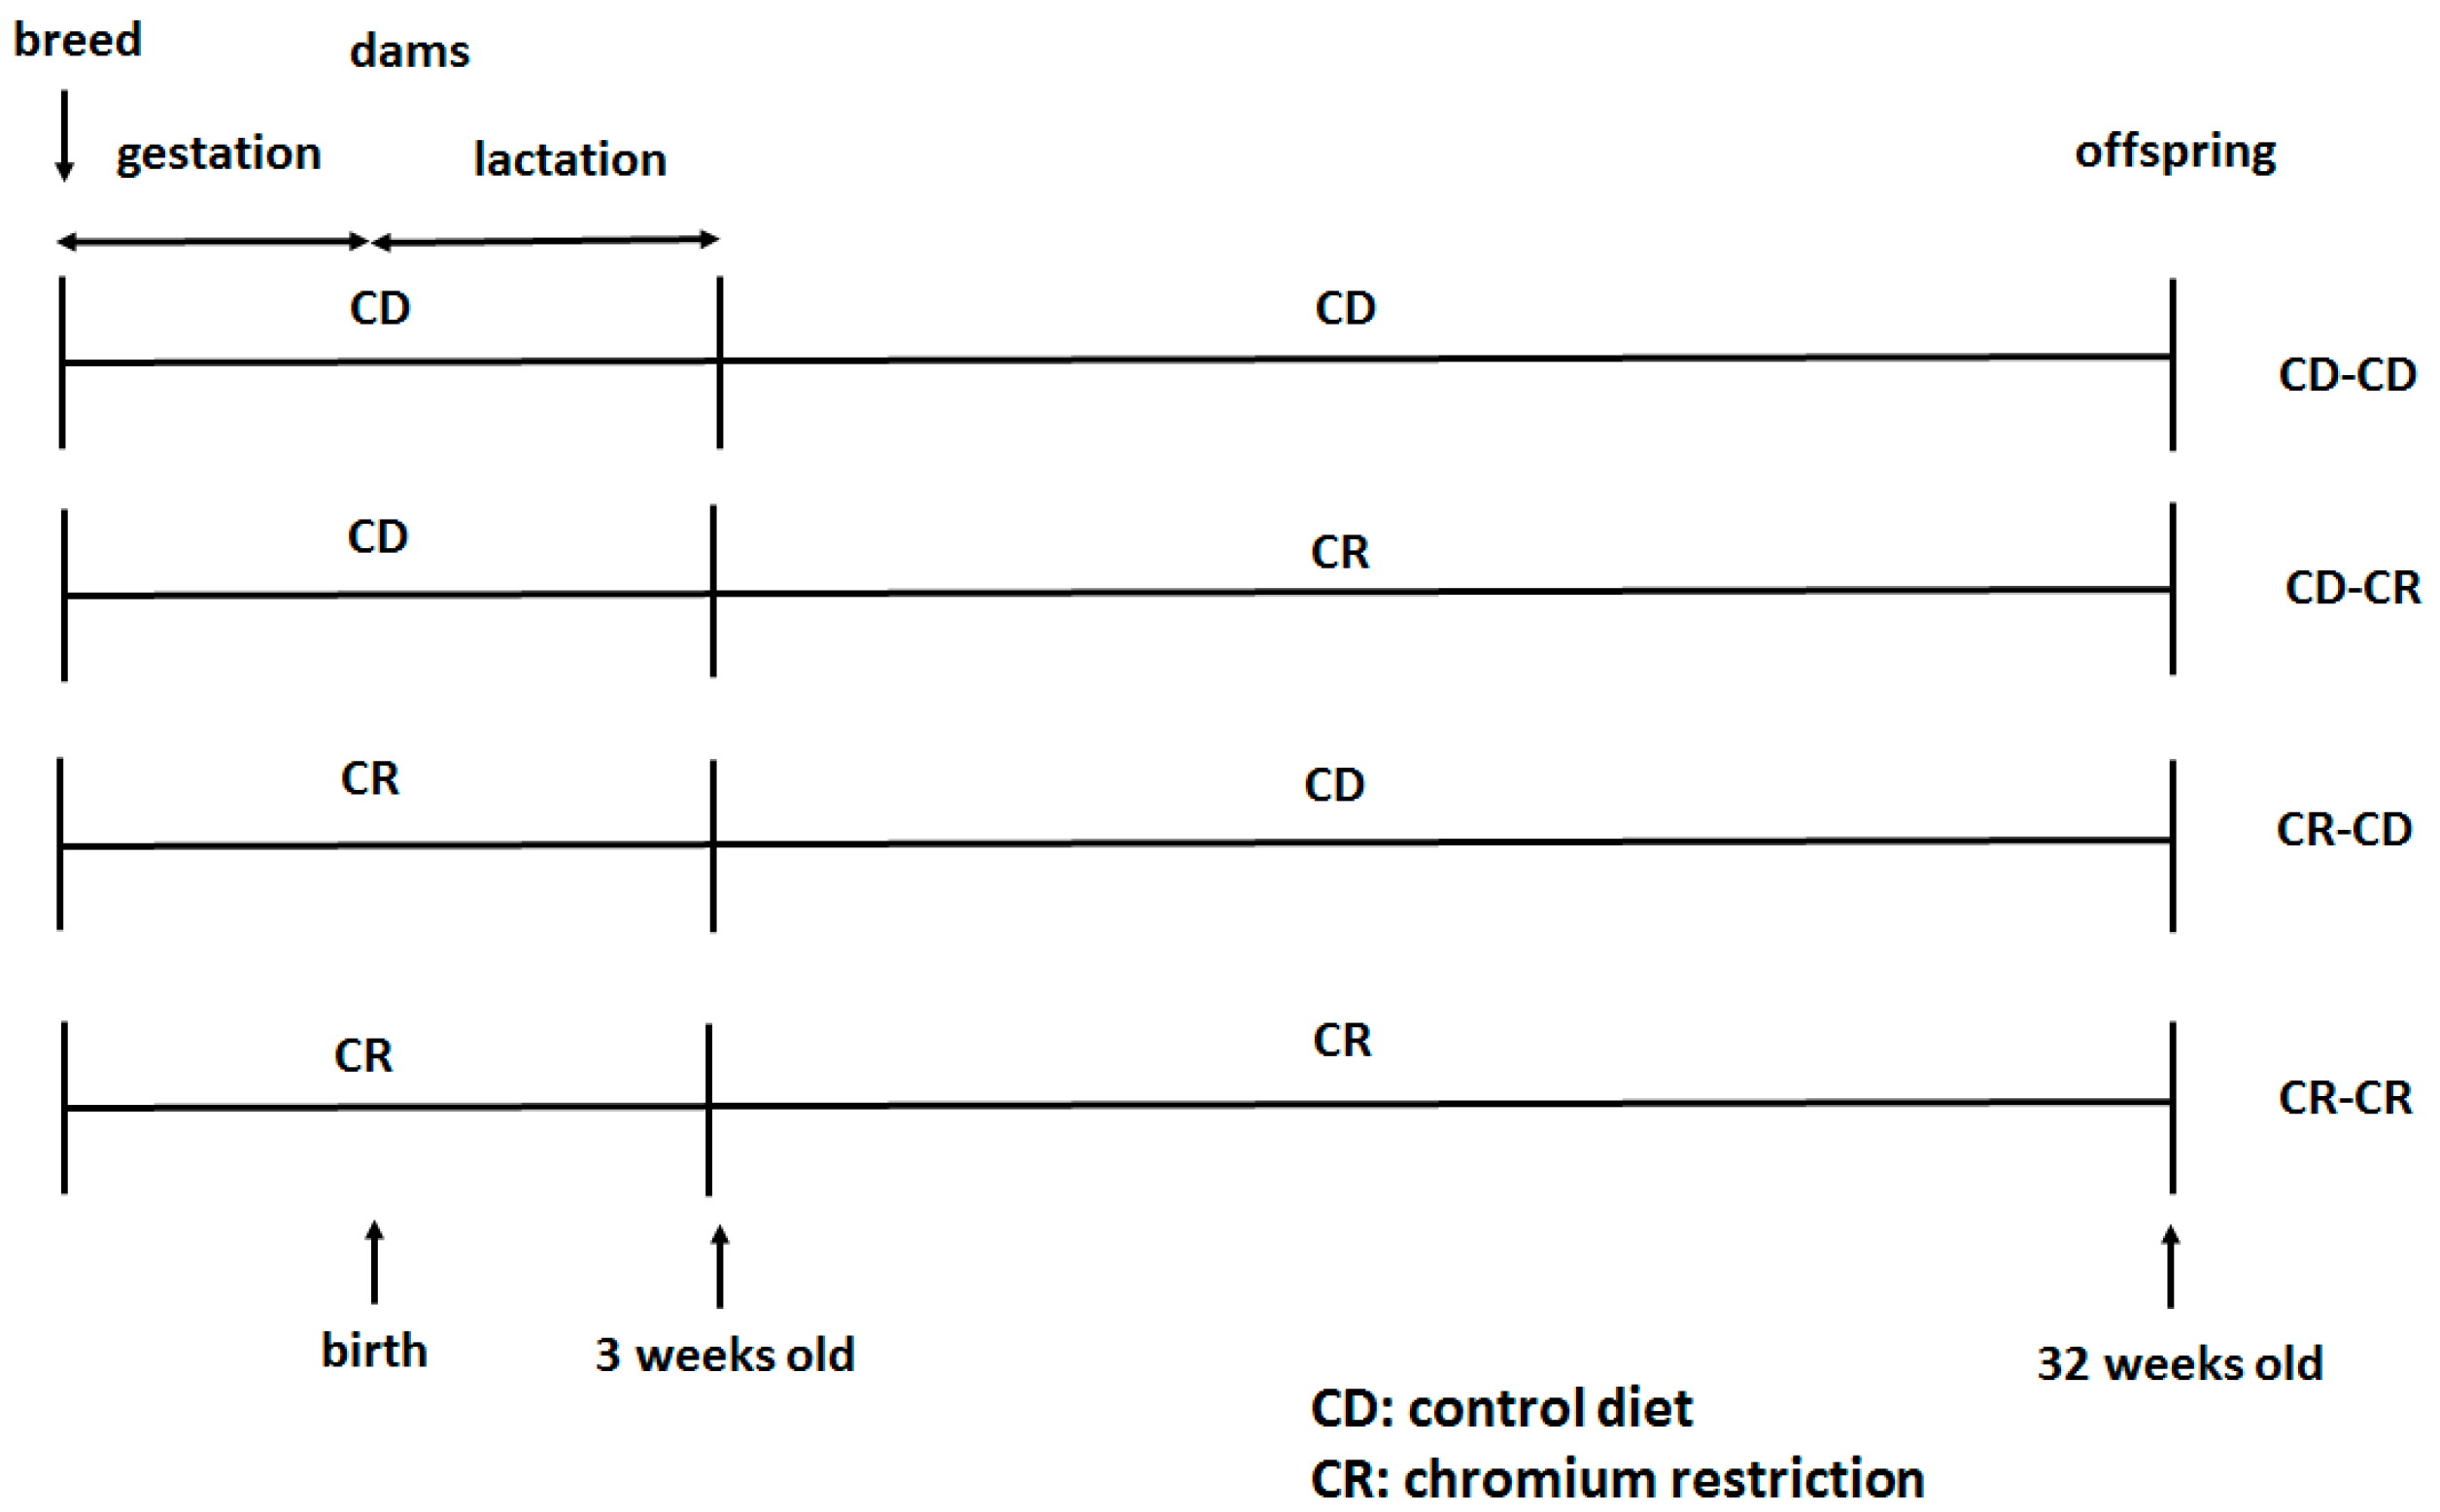
4.1. Study Design and Animals
4.2. Measurement of the Serum Chromium Level
4.3. Measurements of Body Weight and Food Intake
4.4. Fasting Blood Glucose, Oral Glucose Tolerance Test (OGTT)
4.5. Measurement of Serum Insulin and HOMA-IR
4.6. RNA Extraction from Liver and Whole Liver Genome Expression Profiling
4.7. Pathway and Network Analysis
4.8. Real-Time PCR Validation
4.9. Western Blot
4.10. Data Analysis
5. Conclusions
Supplementary Materials
Acknowledgments
Author Contributions
Conflicts of Interest
Abbreviations
| AUC | the area under the curve |
| GO | gene ontologies |
| HOMA-IR | homeostasis model assessment of insulin resistance |
| KEGG | Kyoto Encyclopedia of Genes and Genomes |
| OGTT | oral glucose tolerance test |
| RIN | RNA integrity number |
References
- Whincup, P.H.; Kaye, S.J.; Owen, C.G.; Huxley, R.; Cook, D.G.; Anazawa, S.; Barrett-Connor, E.; Bhargava, S.K.; Birgisdottir, B.E.; Carlsson, S.; et al. Birth weight and risk of type 2 diabetes: A systematic review. JAMA 2008, 300, 2886–2897. [Google Scholar] [PubMed]
- Vaag, A.A.; Grunnet, L.G.; Arora, G.P.; Brons, C. The thrifty phenotype hypothesis revisited. Diabetologia 2012, 55, 2085–2088. [Google Scholar] [CrossRef] [PubMed]
- Hales, C.N.; Barker, D.J.; Clark, P.M.; Cox, L.J.; Fall, C.; Osmond, C.; Winter, P.D. Fetal and infant growth and impaired glucose tolerance at age 64. BMJ 1991, 303, 1019–1022. [Google Scholar] [CrossRef] [PubMed]
- Molendi-Coste, O.; Laborie, C.; Scarpa, M.C.; Montel, V.; Vieau, D.; Breton, C. Maternal perinatal undernutrition alters postnatal development of chromaffin cells in the male rat adrenal medulla. Neuroendocrinology 2009, 90, 54–66. [Google Scholar] [CrossRef] [PubMed]
- Kimani-Murage, E.W.; Kahn, K.; Pettifor, J.M.; Tollman, S.M.; Dunger, D.B.; Gomez-Olive, X.F.; Norris, S.A. The prevalence of stunting, overweight and obesity, and metabolic disease risk in rural south african children. BMC Public Health 2010, 10, 158. [Google Scholar] [CrossRef] [PubMed]
- Sawaya, A.L.; Roberts, S. Stunting and future risk of obesity: Principal physiological mechanisms. Cadernos de Saúde Pública 2003, 19, S21–S28. [Google Scholar] [CrossRef] [PubMed]
- Lesage, J.; Sebaai, N.; Leonhardt, M.; Dutriez-Casteloot, I.; Breton, C.; Deloof, S.; Vieau, D. Perinatal maternal undernutrition programs the offspring hypothalamo-pituitary-adrenal (HPA) axis. Stress 2006, 9, 183–198. [Google Scholar] [CrossRef] [PubMed]
- Moura, A.S.; Carpinelli, A.R.; Barbosa, F.B.; Gravena, C.; Mathias, P.C. Undernutrition during early lactation as an alternative model to study the onset of diabetes mellitus type II. Res. Commun. Mol. Pathol. Pharmacol. 1996, 92, 73–84. [Google Scholar] [PubMed]
- De Oliveira, J.C.; Scomparin, D.X.; Andreazzi, A.E.; Branco, R.C.; Martins, A.G.; Gravena, C.; Grassiolli, S.; Rinaldi, W.; Barbosa, F.B.; Mathias, P.C. Metabolic imprinting by maternal protein malnourishment impairs vagal activity in adult rats. J. Neuroendocrinol. 2011, 23, 148–157. [Google Scholar] [CrossRef] [PubMed]
- Candilish, D.J. Minerals. J. Am. Coll. Nutr. 2000, 17, 286–310. [Google Scholar]
- Feng, W.; Mao, G.; Li, Q.; Wang, W.; Chen, Y.; Zhao, T.; Li, F.; Zou, Y.; Wu, H.; Yang, L.; et al. Effects of chromium malate on glycometabolism, glycometabolism-related enzyme levels and lipid metabolism in type 2 diabetic rats: A dose-response and curative effects study. J. Diabetes Investig. 2015, 6, 396–407. [Google Scholar] [CrossRef] [PubMed]
- Rhodes, N.R.; McAdory, D.; Love, S.; Di Bona, K.R.; Chen, Y.; Ansorge, K.; Hira, J.; Kern, N.; Kent, J.; Lara, P.; et al. Urinary chromium loss associated with diabetes is offset by increases in absorption. J. Inorg. Biochem. 2010, 104, 790–797. [Google Scholar] [CrossRef] [PubMed]
- Morris, B.W.; Kemp, G.J.; Hardisty, C.A. Plasma chromium and chromium excretion in diabetes. Clin. Chem. 1985, 31, 334–335. [Google Scholar] [PubMed]
- Morris, B.W.; MacNeil, S.; Hardisty, C.A.; Heller, S.; Burgin, C.; Gray, T.A. Chromium homeostasis in patients with type II (NIDDM) diabetes. J. Trace Elem. Med. Biol. 1999, 13, 57–61. [Google Scholar] [CrossRef]
- Rajendran, K.; Manikandan, S.; Nair, L.D.; Karuthodiyil, R.; Vijayarajan, N.; Gnanasekar, R.; Kapil, V.V.; Mohamed, A.S. Serum chromium levels in type 2 diabetic patients and its association with glycaemic control. J. Clin. Diagn. Res. 2015, 9, OC05–OC08. [Google Scholar] [CrossRef] [PubMed]
- Padmavathi, I.J.; Rao, K.R.; Raghunath, M. Impact of maternal chromium restriction on glucose tolerance, plasma insulin and oxidative stress in wnin rat offspring. J. Mol. Endocrinol. 2011, 47, 261–271. [Google Scholar] [CrossRef] [PubMed]
- Krol, E.; Krejpcio, Z. Chromium(III) propionate complex supplementation improves carbohydrate metabolism in insulin-resistance rat model. Food Chem. Toxicol. 2010, 48, 2791–2796. [Google Scholar] [CrossRef] [PubMed]
- Hao, C.; Hao, J.; Wang, W.; Han, Z.; Li, G.; Zhang, L.; Zhao, X.; Yu, G. Insulin sensitizing effects of oligomannuronate-chromium (III) complexes in C2C12 skeletal muscle cells. PLoS ONE 2011, 6, e24598. [Google Scholar] [CrossRef] [PubMed]
- Feng, W.; Zhao, T.; Mao, G.; Wang, W.; Feng, Y.; Li, F.; Zheng, D.; Wu, H.; Jin, D.; Yang, L.; et al. Type 2 diabetic rats on diet supplemented with chromium malate show improved glycometabolism, glycometabolism-related enzyme levels and lipid metabolism. PLoS ONE 2015, 10, e0125952. [Google Scholar] [CrossRef] [PubMed]
- Racek, J.; Sindberg, C.D.; Moesgaard, S.; Mainz, J.; Fabry, J.; Muller, L.; Racova, K. Effect of chromium-enriched yeast on fasting plasma glucose, glycated haemoglobin and serum lipid levels in patients with type 2 diabetes mellitus treated with insulin. Biol. Trace Elem. Res. 2013, 155, 1–4. [Google Scholar] [CrossRef] [PubMed]
- Onakpoya, I.; Posadzki, P.; Ernst, E. Chromium supplementation in overweight and obesity: A systematic review and meta-analysis of randomized clinical trials. Obes. Rev. 2013, 14, 496–507. [Google Scholar] [CrossRef] [PubMed]
- Kumar, K.A.; Lalitha, A.; Pavithra, D.; Padmavathi, I.J.; Ganeshan, M.; Rao, K.R.; Venu, L.; Balakrishna, N.; Shanker, N.H.; Reddy, S.U.; et al. Maternal dietary folate and/or vitamin B12 restrictions alter body composition (adiposity) and lipid metabolism in wistar rat offspring. J. Nutr. Biochem. 2013, 24, 25–31. [Google Scholar] [CrossRef] [PubMed]
- Vo, T.X.; Revesz, A.; Sohi, G.; Ma, N.; Hardy, D.B. Maternal protein restriction leads to enhanced hepatic gluconeogenic gene expression in adult male rat offspring due to impaired expression of the liver X receptor. J. Endocrinol. 2013, 218, 85–97. [Google Scholar] [CrossRef] [PubMed]
- Venu, L.; Kishore, Y.D.; Raghunath, M. Maternal and perinatal magnesium restriction predisposes rat pups to insulin resistance and glucose intolerance. J. Nutr. 2005, 135, 1353–1358. [Google Scholar] [PubMed]
- Taniguchi, C.M.; Emanuelli, B.; Kahn, C.R. Critical nodes in signalling pathways: Insights into insulin action. Nat. Rev. Mol. Cell Biol. 2006, 7, 85–96. [Google Scholar] [CrossRef] [PubMed]
- Ye, J.; Zheng, R.; Wang, Q.; Liao, L.; Ying, Y.; Lu, H.; Cianflone, K.; Ning, Q.; Luo, X. Downregulating SOCS3 with sirna ameliorates insulin signaling and glucose metabolism in hepatocytes of iugr rats with catch-up growth. Pediatr. Res. 2012, 72, 550–559. [Google Scholar] [CrossRef] [PubMed]
- Wang, Z.Q.; Zhang, X.H.; Russell, J.C.; Hulver, M.; Cefalu, W.T. Chromium picolinate enhances skeletal muscle cellular insulin signaling in vivo in obese, insulin-resistant JCR:LA-cp rats. J. Nutr. 2006, 136, 415–420. [Google Scholar] [PubMed]
- Yang, X.; Li, S.Y.; Dong, F.; Ren, J.; Sreejayan, N. Insulin-sensitizing and cholesterol-lowering effects of chromium (d-phenylalanine)3. J. Inorg. Biochem. 2006, 100, 1187–1193. [Google Scholar] [CrossRef] [PubMed]
- Zhang, Q.; Xiao, X.H.; Li, M.; Li, W.H.; Yu, M.; Zhang, H.B.; Ping, F.; Wang, Z.X.; Zheng, J. Chromium-containing traditional Chinese medicine, Tianmai Xiaoke tablet improves blood glucose through activating insulin-signaling pathway and inhibiting PTP1B and PCK2 in diabetic rats. J. Integr. Med. 2014, 12, 162–170. [Google Scholar] [CrossRef]
- Krebs, M.; Roden, M. Molecular mechanisms of lipid-induced insulin resistance in muscle, liver and vasculature. Diabetes Obes. Metab. 2005, 7, 621–632. [Google Scholar] [CrossRef] [PubMed]
- Bringhenti, I.; Ornellas, F.; Mandarim-de-Lacerda, C.A.; Aguila, M.B. The insulin-signaling pathway of the pancreatic islet is impaired in adult mice offspring of mothers fed a high-fat diet. Nutrition 2016, 32, 1138–1143. [Google Scholar] [CrossRef] [PubMed]
- Maia-Ceciliano, T.C.; Barreto-Vianna, A.R.; Barbosa-da-Silva, S.; Aguila, M.B.; Faria, T.S.; Mandarim-de-Lacerda, C.A. Maternal vitamin D-restricted diet has consequences in the formation of pancreatic islet/insulin-signaling in the adult offspring of mice. Endocrine 2016. [Google Scholar] [CrossRef] [PubMed]
- Krebs, D.L.; Hilton, D.J. SOCS: Physiological suppressors of cytokine signaling. J. Cell Sci. 2000, 113, 2813–2819. [Google Scholar] [PubMed]
- Emanuelli, B.; Peraldi, P.; Filloux, C.; Chavey, C.; Freidinger, K.; Hilton, D.J.; Hotamisligil, G.S.; van Obberghen, E. SOCS-3 inhibits insulin signaling and is up-regulated in response to tumor necrosis factor-alpha in the adipose tissue of obese mice. J. Biol. Chem. 2001, 276, 47944–47949. [Google Scholar] [PubMed]
- Ueki, K.; Kondo, T.; Kahn, C.R. Suppressor of cytokine signaling 1 (SOCS-1) and SOCS-3 cause insulin resistance through inhibition of tyrosine phosphorylation of insulin receptor substrate proteins by discrete mechanisms. Mol. Cell. Biol. 2004, 24, 5434–5446. [Google Scholar] [CrossRef] [PubMed]
- Lebrun, P.; van Obberghen, E. SOCS proteins causing trouble in insulin action. Acta Physiol. 2008, 192, 29–36. [Google Scholar] [CrossRef] [PubMed]
- Clevers, H. Wnt/β-catenin signaling in development and disease. Cell 2006, 127, 469–480. [Google Scholar] [CrossRef] [PubMed]
- Kanazawa, A.; Tsukada, S.; Sekine, A.; Tsunoda, T.; Takahashi, A.; Kashiwagi, A.; Tanaka, Y.; Babazono, T.; Matsuda, M.; Kaku, K.; et al. Association of the gene encoding wingless-type mammary tumor virus integration-site family member 5B (WNT5B) with type 2 diabetes. Am. J. Hum. Genet. 2004, 75, 832–843. [Google Scholar] [CrossRef] [PubMed]
- Neve, B.; Le Bacquer, O.; Caron, S.; Huyvaert, M.; Leloire, A.; Poulain-Godefroy, O.; Lecoeur, C.; Pattou, F.; Staels, B.; Froguel, P. Alternative human liver transcripts of TCF7L2 bind to the gluconeogenesis regulator HNF4α at the protein level. Diabetologia 2014, 57, 785–796. [Google Scholar] [CrossRef] [PubMed]
- Abiola, M.; Favier, M.; Christodoulou-Vafeiadou, E.; Pichard, A.L.; Martelly, I.; Guillet-Deniau, I. Activation of wnt/beta-catenin signaling increases insulin sensitivity through a reciprocal regulation of wnt10b and srebp-1c in skeletal muscle cells. PLoS ONE 2009, 4, e8509. [Google Scholar] [CrossRef] [PubMed]
- Liu, H.; Fergusson, M.M.; Wu, J.J.; Rovira, I.I.; Liu, J.; Gavrilova, O.; Lu, T.; Bao, J.; Han, D.; Sack, M.N.; et al. Wnt signaling regulates hepatic metabolism. Sci. Signal. 2011. [Google Scholar] [CrossRef]
- Yokomizo, H.; Inoguchi, T.; Sonoda, N.; Sakaki, Y.; Maeda, Y.; Inoue, T.; Hirata, E.; Takei, R.; Ikeda, N.; Fujii, M.; et al. Maternal high-fat diet induces insulin resistance and deterioration of pancreatic β-cell function in adult offspring with sex differences in mice. Am. J. Physiol. Endocrinol. Metab. 2014, 306, E1163–E1175. [Google Scholar] [CrossRef] [PubMed] [Green Version]
- Dennis, G., Jr.; Sherman, B.T.; Hosack, D.A.; Yang, J.; Gao, W.; Lane, H.C.; Lempicki, R.A. David: Database for annotation, visualization, and integrated discovery. Genome Biol. 2003. [Google Scholar] [CrossRef]
- Ashburner, M.; Ball, C.A.; Blake, J.A.; Botstein, D.; Butler, H.; Cherry, J.M.; Davis, A.P.; Dolinski, K.; Dwight, S.S.; Eppig, J.T.; et al. Gene ontology: Tool for the unification of biology. The gene ontology consortium. Nat. Genet. 2000, 25, 25–29. [Google Scholar] [CrossRef] [PubMed]
- Kanehisa, M.; Araki, M.; Goto, S.; Hattori, M.; Hirakawa, M.; Itoh, M.; Katayama, T.; Kawashima, S.; Okuda, S.; Tokimatsu, T.; et al. Kegg for linking genomes to life and the environment. Nucleic Acids Res. 2008, 36, D480–D484. [Google Scholar] [CrossRef] [PubMed]
- Szklarczyk, D.; Franceschini, A.; Wyder, S.; Forslund, K.; Heller, D.; Huerta-Cepas, J.; Simonovic, M.; Roth, A.; Santos, A.; Tsafou, K.P.; et al. STRING v10: Protein-protein interaction networks, integrated over the tree of life. Nucleic Acids Res. 2015, 43, D447–D452. [Google Scholar] [CrossRef] [PubMed]


© 2016 by the authors; licensee MDPI, Basel, Switzerland. This article is an open access article distributed under the terms and conditions of the Creative Commons Attribution (CC-BY) license (http://creativecommons.org/licenses/by/4.0/).
Share and Cite
Zhang, Q.; Sun, X.; Xiao, X.; Zheng, J.; Li, M.; Yu, M.; Ping, F.; Wang, Z.; Qi, C.; Wang, T.; et al. Maternal Chromium Restriction Leads to Glucose Metabolism Imbalance in Mice Offspring through Insulin Signaling and Wnt Signaling Pathways. Int. J. Mol. Sci. 2016, 17, 1767. https://doi.org/10.3390/ijms17101767
Zhang Q, Sun X, Xiao X, Zheng J, Li M, Yu M, Ping F, Wang Z, Qi C, Wang T, et al. Maternal Chromium Restriction Leads to Glucose Metabolism Imbalance in Mice Offspring through Insulin Signaling and Wnt Signaling Pathways. International Journal of Molecular Sciences. 2016; 17(10):1767. https://doi.org/10.3390/ijms17101767
Chicago/Turabian StyleZhang, Qian, Xiaofang Sun, Xinhua Xiao, Jia Zheng, Ming Li, Miao Yu, Fan Ping, Zhixin Wang, Cuijuan Qi, Tong Wang, and et al. 2016. "Maternal Chromium Restriction Leads to Glucose Metabolism Imbalance in Mice Offspring through Insulin Signaling and Wnt Signaling Pathways" International Journal of Molecular Sciences 17, no. 10: 1767. https://doi.org/10.3390/ijms17101767