
Investigations of Major α-Dicarbonyl Content in U.S. Honey of Different Geographical Origins


Abstract
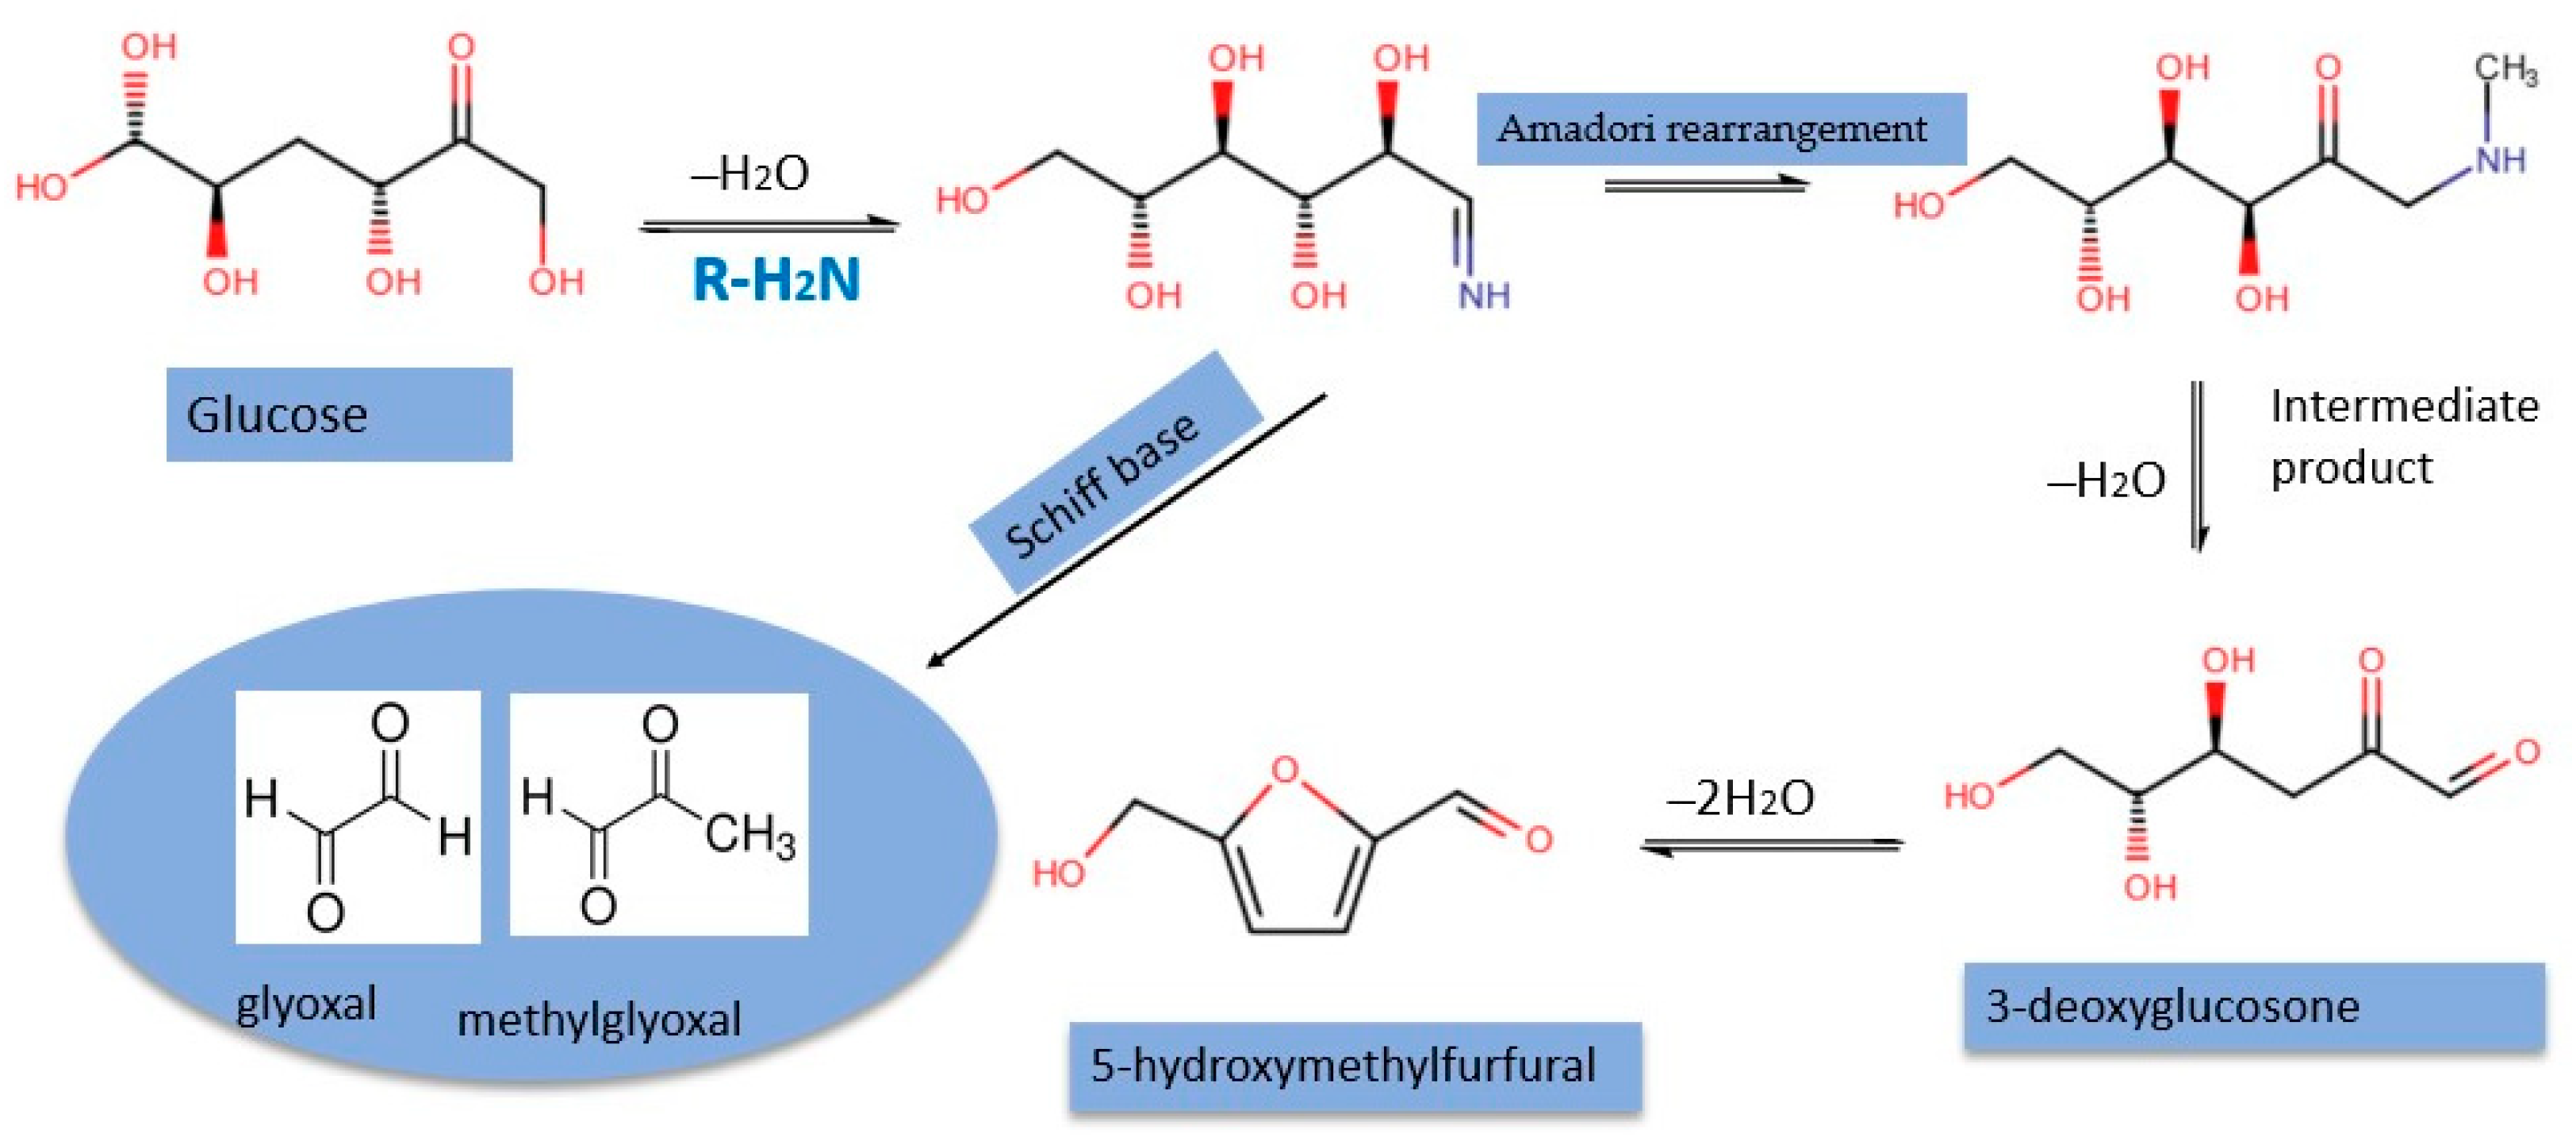
:1. Introduction
2. Results and Discussion
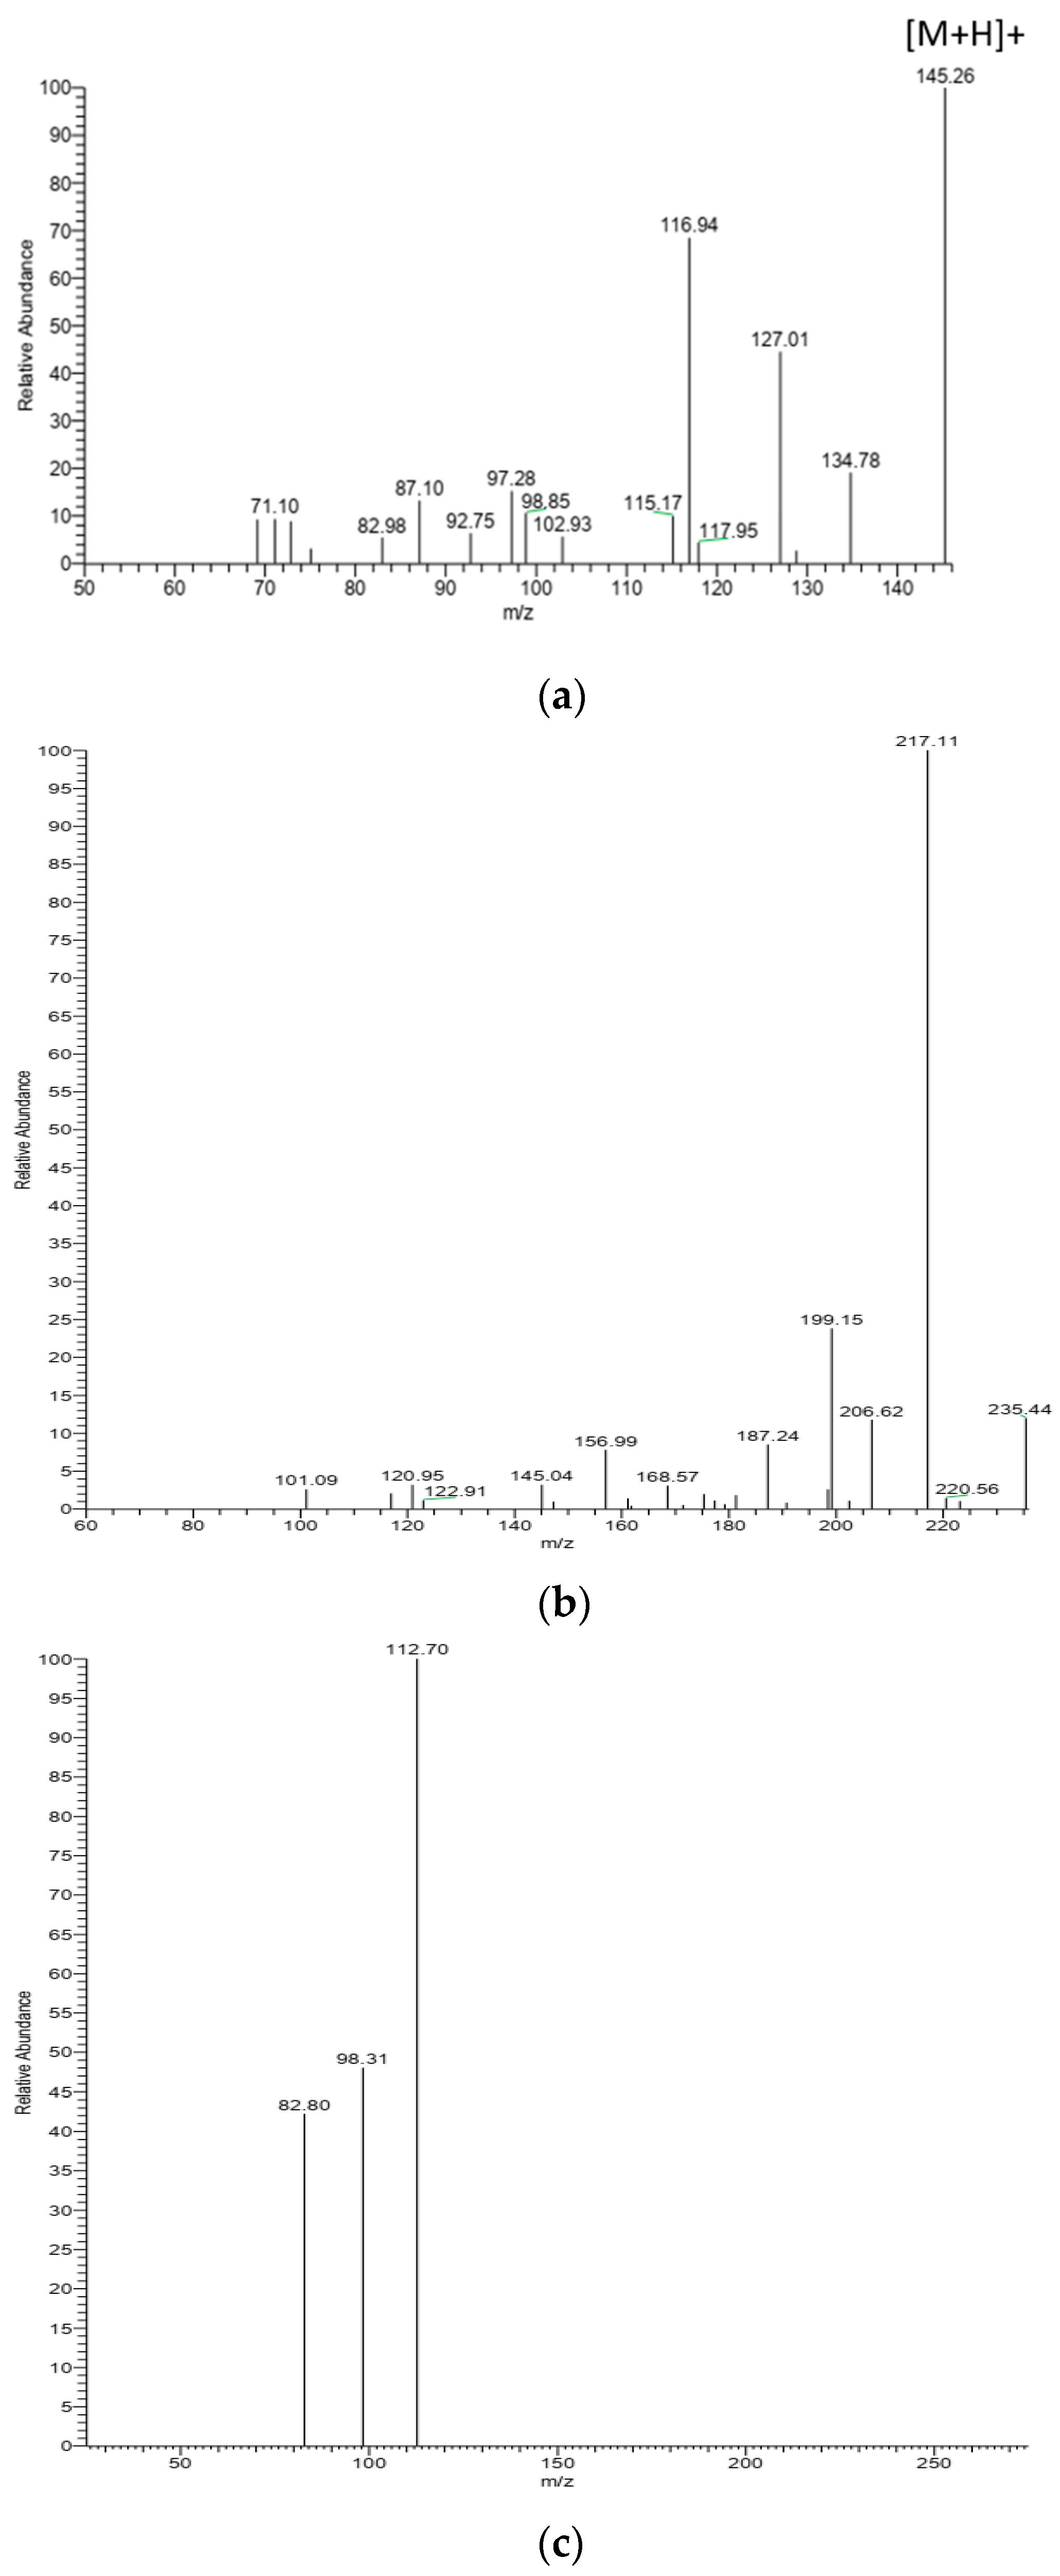
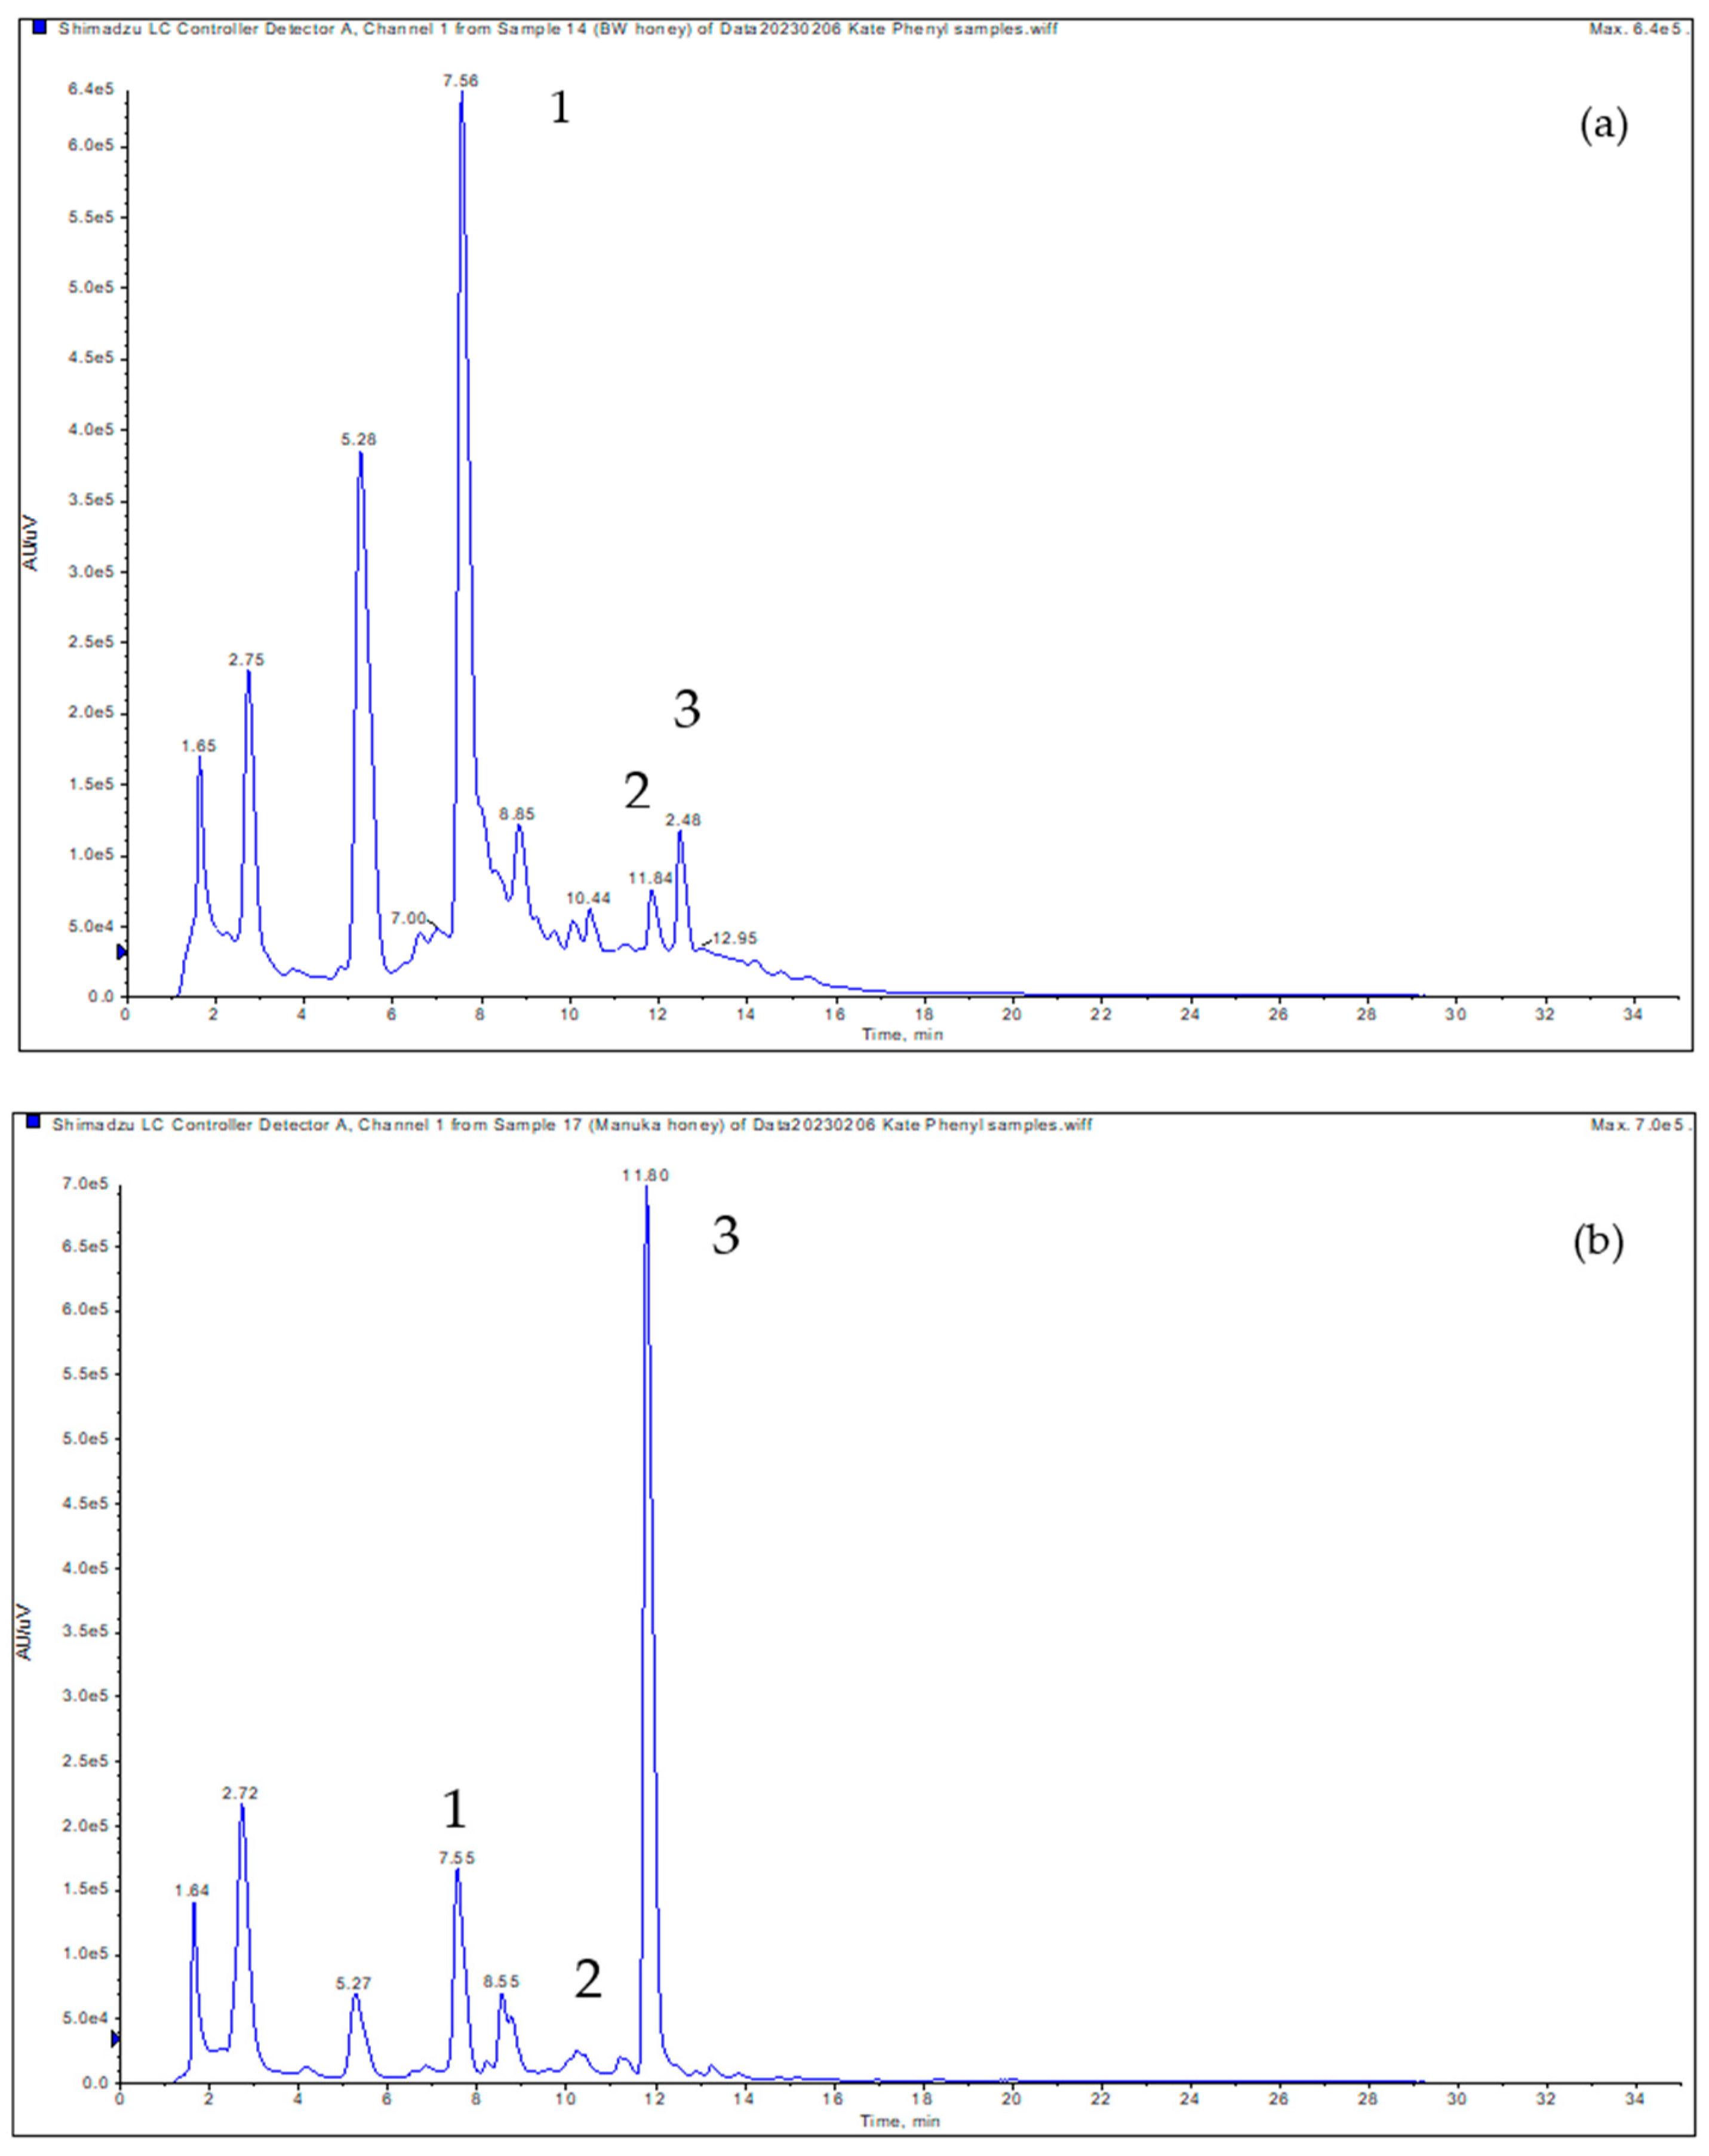
2.1. Identification of α-Dicarbonyls in U.S. Honeys
2.2. Optimization Conditions for Derivatization of α-Dicarbonyls in Honey
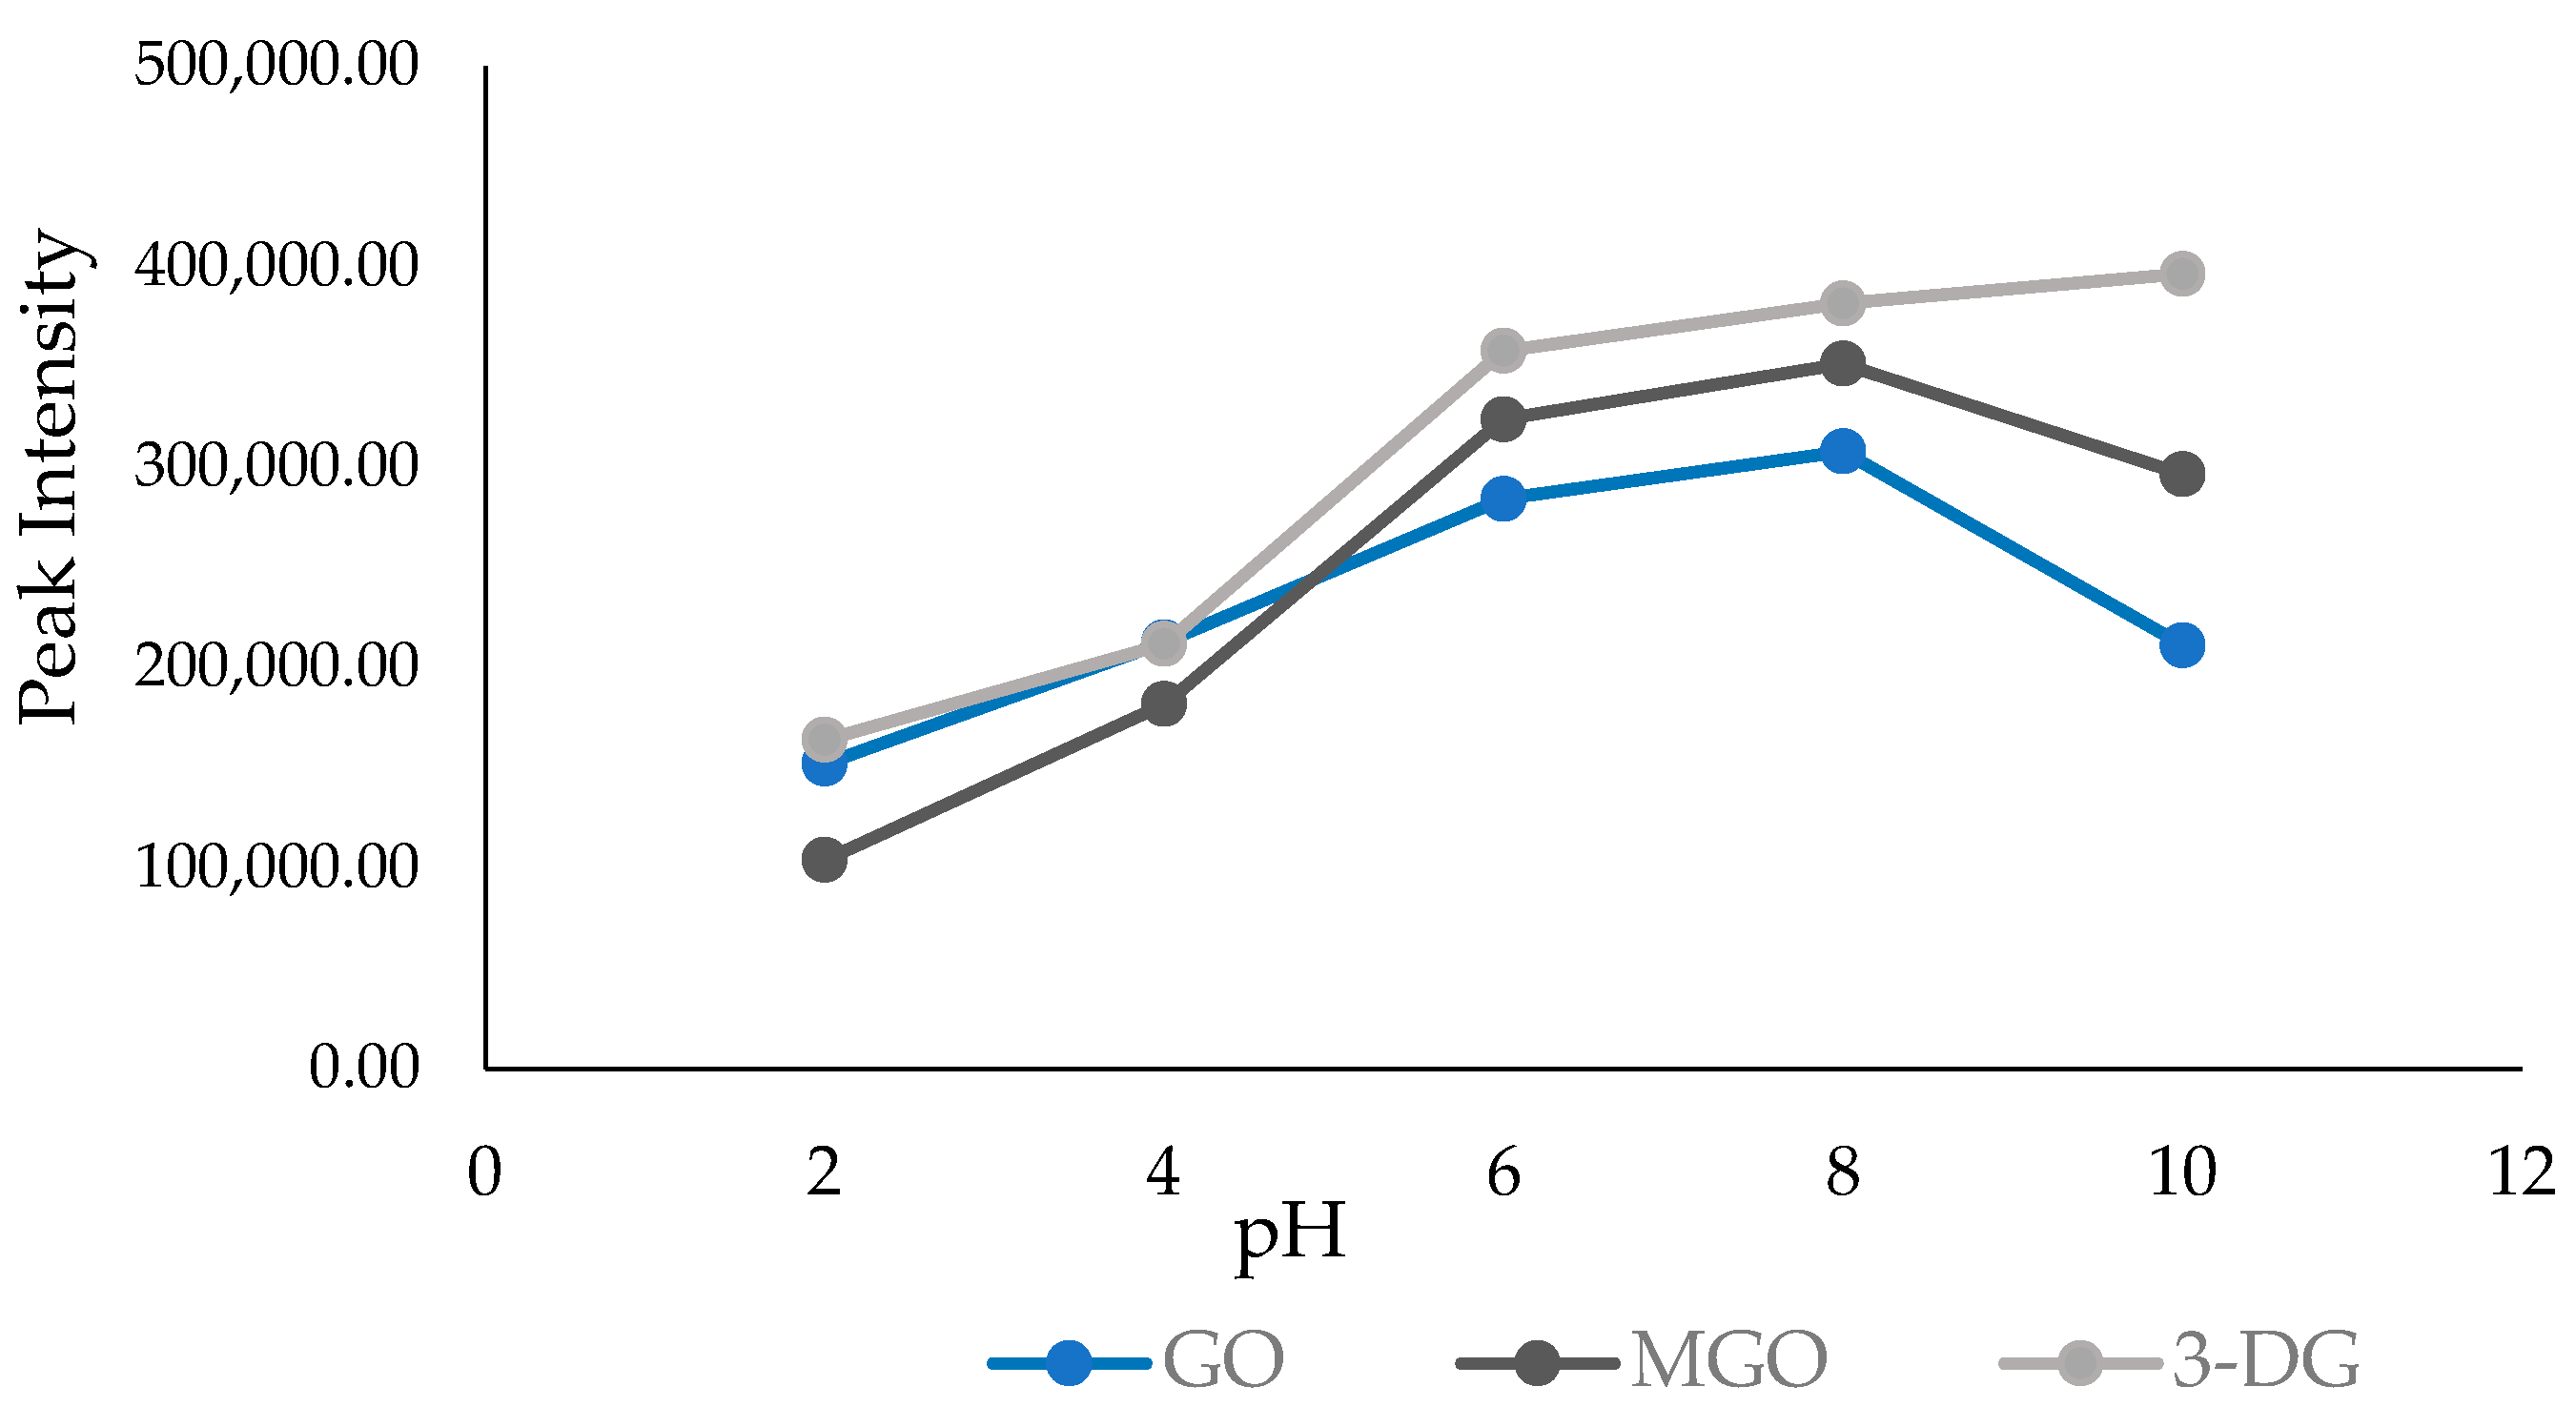
2.2.1. Effects of pH on the α-Dicarbonyl Content of Honey
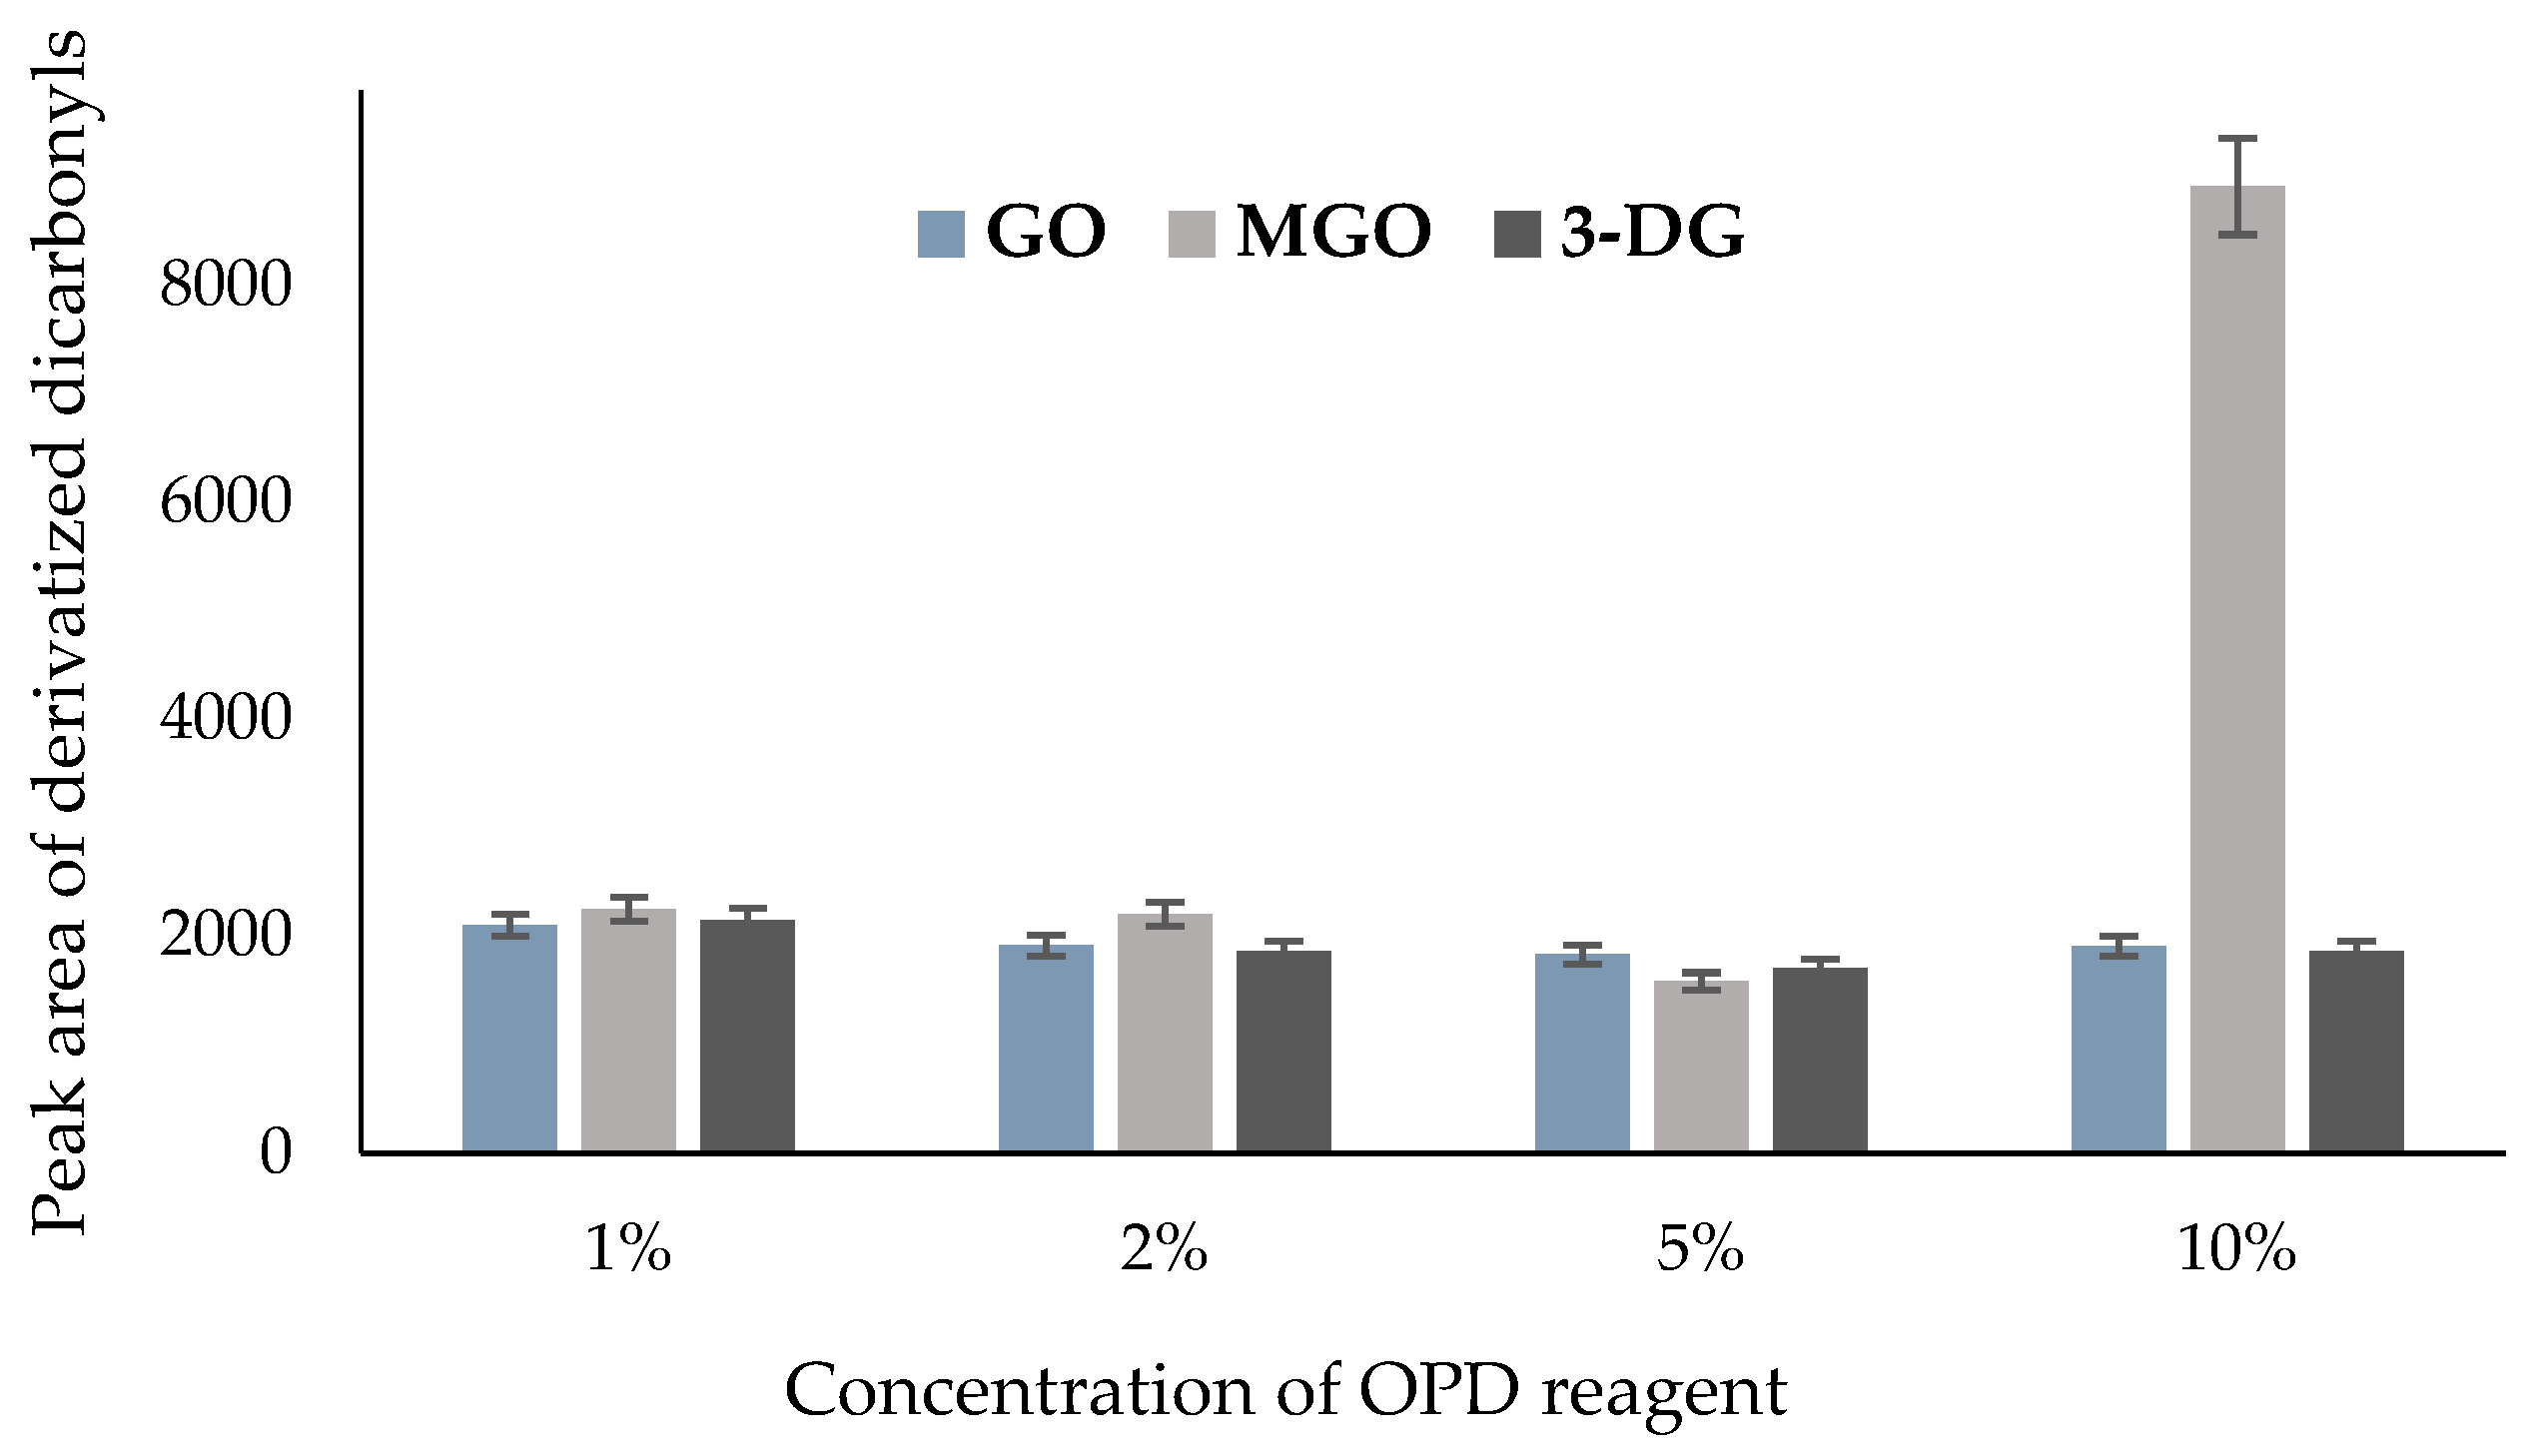
2.2.2. Effects of o-Phenylenediamine (ODP) on the α-Dicarbonyl Content of Honey
2.3. Method Validation for α-Dicarbonyl Determination in Honey
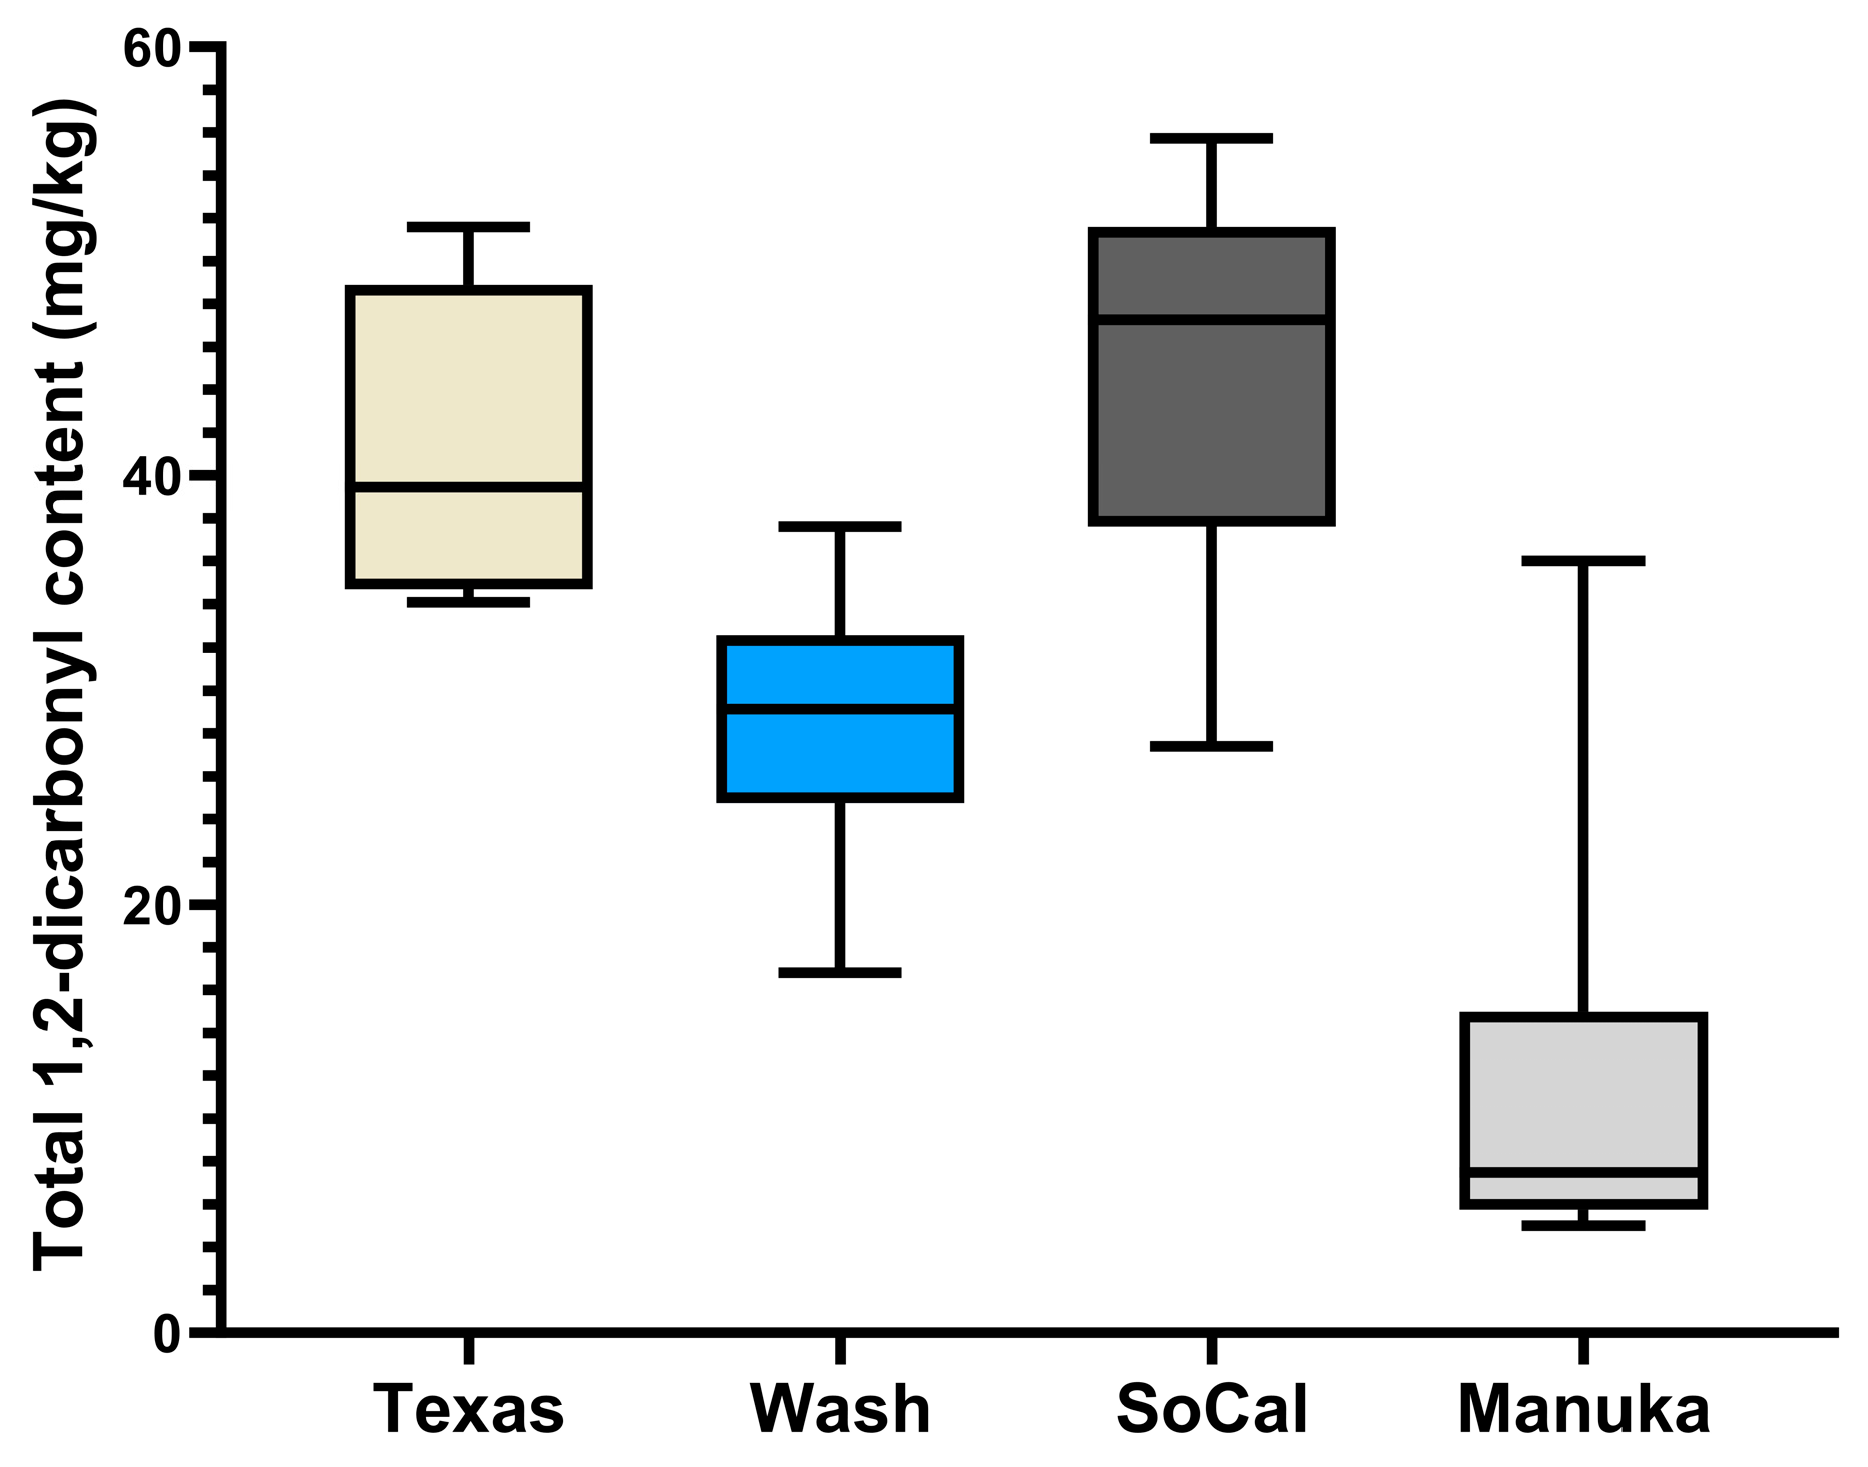
2.4. Quantification of α-Dicarbonyl Compounds in Honey
2.5. Influence of Honey Color on the Content of α-Dicarbonyls in Honey
2.6. Nutritional Consequences of MGO, GO, and 3-DG in Honey
3. Materials and Methods
3.1. Chemicals and Reagents
3.2. Honey Samples
3.3. pH of Honey
3.4. Determination of Honey Color
3.5. Derivatization of α-Dicarbonyls in Honey
3.6. Preparation of α-Dicarbonyls (MGO, GO, and 3-DG) in Honey
3.7. HPLC-MS/MS Analysis of α-Dicarbonyl Derivatives
3.8. HPLC-UV Analysis of α-Dicarbonyl Derivatives
3.9. Quantitation of Derivatized α-Dicarbonyls in Honey
3.10. Method Validation for α-Dicarbonyl Analysis
3.10.1. Linearity
3.10.2. Accuracy/Recovery
3.10.3. Precision
3.10.4. Limit of Detection (LOD) and Limit of Quantitation (LOQ)
3.10.5. Statistical Analysis
4. Conclusions
Supplementary Materials
Author Contributions
Funding
Institutional Review Board Statement
Informed Consent Statement
Data Availability Statement
Acknowledgments
Conflicts of Interest
References
- Alimentarius, C. Revised Codex Standard for Honey; World Health Organization: Rome, Italy, 2001. [Google Scholar]
- Finot, P.A. Historical Perspective of the Maillard Reaction in Food Science. Ann. N. Y. Acad. Sci. 2005, 1043, 1–8. [Google Scholar] [CrossRef] [PubMed]
- Lund, M.N.; Ray, C.A. Control of Maillard Reactions in Foods: Strategies and Chemical Mechanisms. J. Agric. Food Chem. 2017, 65, 4537–4552. [Google Scholar] [CrossRef] [PubMed]
- Anet, E.F.L.J. Degradation of Carbohydrates. Carbohydr. Res. 1968, 7, 453–459. [Google Scholar] [CrossRef]
- Smuda, M.; Glomb, M.A. Novel Insights into the Maillard Catalyzed Degradation of Maltose. J. Agric. Food Chem. 2011, 59, 13254–13264. [Google Scholar] [CrossRef] [PubMed]
- Marceau, E.; Yaylayan, V.A. Profiling of α-Dicarbonyl Content of Commercial Honeys from Different Botanical Origins: Identification of 3,4dideoxyglucoson-3-Ene (3,4-DGE) and Related Compounds. J. Agric. Food Chem. 2009, 57, 10837–10844. [Google Scholar] [CrossRef]
- Degen, J.; Hellwig, M.; Henle, T. 1,2-Dicarbonyl Compounds in Commonly Consumed Foods. J. Agric. Food Chem. 2012, 60, 7071–7079. [Google Scholar] [CrossRef]
- Arena, E.; Ballistreri, G.; Tomaselli, F.; Fallico, B. Survey of 1,2-Dicarbonyl Compounds in Commercial Honey of Different Floral Origin. J. Food Sci. 2011, 76, 1203–1210. [Google Scholar] [CrossRef] [PubMed]
- Marshall, S.M.; Schneider, K.R.; Cisneros, K.V.; Gu, L. Determination of Antioxidant Capacities, α-Dicarbonyls, and Phenolic Phytochemicals in Florida Varietal Honeys Using HPLC-DAD-ESI-MSn. J. Agric. Food Chem. 2014, 62, 8623–8631. [Google Scholar] [CrossRef] [PubMed]
- Weigel, K.U.; Opitz, T.; Henle, T. Studies on the Occurrence and Formation of 1,2-Dicarbonyls in Honey. Eur. Food Res. Technol. 2004, 218, 147–151. [Google Scholar] [CrossRef]
- Yan, S.; Sun, M.; Zhao, L.; Wang, K.; Fang, X.; Wu, L.; Xue, X. Comparison of Differences of α-Dicarbonyl Compounds between Naturally Matured and Artificially Heated Acacia Honey: Their Application to Determine Honey Quality. J. Agric. Food Chem. 2019, 67, 12885–12894. [Google Scholar] [CrossRef]
- Weenen, H. Reactive Intermediates and Carbohydrate Fragmentation in Maillard Chemistry. Food Chem. 1998, 62, 393–401. [Google Scholar] [CrossRef]
- Hellwig, M.; Degen, J.; Henle, T. 3-Deoxygalactosone, a “New” 1,2-Dicarbonyl Compound in Milk Products. J. Agric. Food Chem. 2010, 58, 10752–10760. [Google Scholar] [CrossRef] [PubMed]
- Barros, A.; Rodrigues, J.A.; Almeida, P.J.; Oliva-Teles, M.T. Determination of Glyoxal, Methylglyoxal, and Diacetyl in Selected Beer and Wine, by HPLC with UV Spectrophotometric Detection, after Derivatization with o-Phenylenediamine. J. Liq. Chromatogr. Relat. Technol. 1999, 22, 2061–2069. [Google Scholar] [CrossRef]
- Arribas-Lorenzo, G.; Morales, F.J. Analysis, Distribution, and Dietary Exposure of Glyoxal and Methylglyoxal in Cookies and Their Relationship with Other Heat-Induced Contaminants. J. Agric. Food Chem. 2010, 58, 2966–2972. [Google Scholar] [CrossRef] [PubMed]
- Knecht, K.J.; Dunn, J.A.; McFarland, K.F.; McCance, D.R.; Lyons, T.J.; Thorpe, S.R.; Baynes, J.W. Effect of Diabetes and Aging on Carboxymethyllysine Levels in Human Urine. Diabetes 1991, 40, 190–196. [Google Scholar] [CrossRef] [PubMed]
- Odani, H.; Shinzato, T.; Matsumoto, Y.; Usami, J.; Maeda, K. Increase in Three α,β-Dicarbonyl Compound Levels in Human Uremic Plasma: Specific in Vivo Determination of Intermediates in Advanced Maillard Reaction. Biochem. Biophys. Res. Commun. 1999, 256, 89–93. [Google Scholar] [CrossRef] [PubMed]
- Smith, M.A.; Taneda, S.; Richey, P.L.; Miyata, S.; Yan, S.D.; Stern, D.; Sayre, L.M.; Monnier, V.M.; Perry, G. Advanced Maillard Reaction End Products Are Associated with Alzheimer Disease Pathology. Proc. Natl. Acad. Sci. USA 1994, 91, 5710–5714. [Google Scholar] [CrossRef]
- Singh, R.; Barden, A.; Mori, T.; Beilin, L. Advanced Glycation End-Products: A Review. Diabetologia 2001, 44, 129–146. [Google Scholar] [CrossRef] [PubMed]
- Busch, M.; Franke, S.; Rüster, C.; Wolf, G. Advanced Glycation End-Products and the Kidney. Eur. J. Clin. Investig. 2010, 40, 742–755. [Google Scholar] [CrossRef]
- Hartog, J.W.L.; Voors, A.A.; Bakker, S.J.L.; Smit, A.J.; van Veldhuisen, D.J. Advanced Glycation End-Products (AGEs) and Heart Failure: Pathophysiology and Clinical Implications. Eur. J. Heart Fail. 2007, 9, 1146–1155. [Google Scholar] [CrossRef]
- Thomas, M.C.; Forbes, J.M.; MacIsaac, R.; Jerums, G.; Cooper, M.E. Low-Molecular Weight Advanced Glycation End Products: Markers of Tissue AGE Accumulation and More? Ann. N. Y. Acad. Sci. 2005, 1043, 644–654. [Google Scholar] [CrossRef]
- Bastos, D.H.M.; Shibao, J.; Ferreira, E.L.; Bombo, A. Juliana. Maillard Reaction Products in Processed Food. Nutrire 2011, 36, 63–78. [Google Scholar]
- Bierhaus, A.; Humpert, P.M.; Stern, D.M.; Arnold, B.; Nawroth, P.P. Advanced Glycation End Product Receptor-Mediated Cellular Dysfunction. Ann. N. Y. Acad. Sci. 2005, 1043, 676–680. [Google Scholar] [CrossRef] [PubMed]
- Vanholder, R.; De Smet, R.; Glorieux, G.; Argilés, A.; Baurmeister, U.; Brunet, P.; Clark, W.; Cohen, G.; De Deyn, P.P.; Deppisch, R.; et al. Review on Uremic Toxins: Classification, Concentration, and Interindividual Variability. Kidney Int. 2003, 63, 1934–1943. [Google Scholar] [CrossRef]
- Van den Eynde, M.D.G.; Kusters, Y.H.A.M.; Houben, A.J.H.M.; Scheijen, J.L.J.M.; van Duynhoven, J.; Fazelzadeh, P.; Joris, P.J.; Plat, J.; Mensink, R.P.; Hanssen, N.M.J.; et al. Diet-Induced Weight Loss Reduces Postprandial Dicarbonyl Stress in Abdominally Obese Men: Secondary Analysis of a Randomized Controlled Trial. Clin. Nutr. 2021, 40, 2654–2662. [Google Scholar] [CrossRef] [PubMed]
- Adams, C.J.; Boult, C.H.; Deadman, B.J.; Farr, J.M.; Grainger, M.N.C.; Manley-Harris, M.; Snow, M.J. Isolation by HPLC and Characterisation of the Bioactive Fraction of New Zealand Manuka (Leptospermum scoparium) Honey. Carbohydr. Res. 2008, 343, 651–659. [Google Scholar] [CrossRef] [PubMed]
- Ames, J.M. Control of the Maillard Reaction in Food Systems. Trends Food Sci. Technol. 1990, 1, 150–154. [Google Scholar] [CrossRef]
- Nie, S.P.; Huang, J.G.; Hu, J.L.; Zhang, Y.N.; Wang, S.; Li, C.; Marcone, M.; Xie, M.Y. Effect of PH, Temperature and Heating Time on the Formation of Furan in Sugar-Glycine Model Systems. Food Sci. Hum. Wellness 2013, 2, 87–92. [Google Scholar] [CrossRef]
- Renn, P.T.; Sathe, S.K. Effects of PH, Temperature, and Reactant Molar Ratio on L-Leucine and D-Glucose Maillard Browning Reaction in an Aqueous System. J. Agric. Food Chem. 1997, 45, 3782–3787. [Google Scholar] [CrossRef]
- Henle, T.; Walter, A.W.; Klostermeyer, H. Simultaneous Determination of Protein-Bound Maillard Products by Ion Exchange Chromatography and Photodiode Array Detection. In Maillard Reactions in Chemistry, Food and Health; Woodhead Publishing: Sawston, UK, 2005; pp. 195–200. [Google Scholar] [CrossRef]
- Jenny, G.; Glomb, M.A. Degradation of Glucose: Reinvestigation of Reactive α-Dicarbonyl Compounds. J. Agric. Food Chem. 2009, 57, 8591–8597. [Google Scholar] [CrossRef]
- Saltmarch, M.; Labuza, T.P. Nonenzymatic Browning via the Maillard Reaction in Foods. Diabetes 1982, 31, 29–36. [Google Scholar] [CrossRef]
- Mavric, E.; Wittmann, S.; Barth, G.; Henle, T. Identification and Quantification of Methylglyoxal as the Dominant Antibacterial Constituent of Manuka (Leptospermum scoparium) Honeys from New Zealand. Mol. Nutr. Food Res. 2008, 52, 483–489. [Google Scholar] [CrossRef] [PubMed]
- Stephens, J.M.; Schlothauer, R.C.; Morris, B.D.; Yang, D.; Fearnley, L.; Greenwood, D.R.; Loomes, K.M. Phenolic Compounds and Methylglyoxal in Some New Zealand Manuka and Kanuka Honeys. Food Chem. 2010, 120, 78–86. [Google Scholar] [CrossRef]
- Becerril-Sánchez, A.L.; Quintero-salazar, B.; Dublán-garcía, O.; Escalona-buendía, H.B. Phenolic Compounds in Honey and Their Relationship with Antioxidant Activity, Botanical Origin, and Color. Antioxidants 2021, 10, 1700. [Google Scholar] [CrossRef] [PubMed]
- Kroh, L.W. Caramelisation in Food and Beverages. Food Chem. 1994, 51, 373–379. [Google Scholar] [CrossRef]
- Jasicka-Misiak, I.; Makowicz, E.; Stanek, N. Chromatographic Fingerprint, Antioxidant Activity, and Colour Characteristic of Polish Goldenrod (Solidago virgaurea L.) Honey and Flower. Eur. Food Res. Technol. 2018, 244, 1169–1184. [Google Scholar] [CrossRef]
- Islam, A.; Khalil, I.; Islam, N.; Moniruzzaman, M.; Mottalib, A.; Sulaiman, S.A.; Gan, S.H. Physicochemical and Antioxidant Properties of Bangladeshi Honeys Stored for More than One Year. BMC Complement. Altern. Med. 2012, 12, 177. [Google Scholar] [CrossRef]
- Al-Farsi, M.; Al-Amri, A.; Al-Hadhrami, A.; Al-Belushi, S. Color, Flavonoids, Phenolics and Antioxidants of Omani Honey. Heliyon 2018, 4, e00874. [Google Scholar] [CrossRef]
- Kavanagh, S.; Gunnoo, J.; Marques Passos, T.; Stout, J.C.; White, B. Physicochemical Properties and Phenolic Content of Honey from Different Floral Origins and from Rural versus Urban Landscapes. Food Chem. 2019, 272, 66–75. [Google Scholar] [CrossRef]
- Pontis, J.A.; da Costa, L.A.M.A.; da Silva, S.J.R.; Flach, A. Color, Phenolic and Flavonoid Content, and Antioxidant Activity of Honey from Roraima, Brazil. Food Sci. Technol. 2014, 34, 69–73. [Google Scholar] [CrossRef]
- Markowicz, D.; Monaro, E.; Siguemoto, E.; Sefor, M. Maillard Reaction Products in Processed Food: Pros and Cons. In Food Industrial Processes—Methods and Equipment; IntechOpen: London, UK, 2012. [Google Scholar] [CrossRef]
- Friedman, M. Dietary Impact of Food Processing. Annu. Rev. Nutr. 1992, 12, 119–137. [Google Scholar] [CrossRef]
- Friedman, M. Food Browning and Its Prevention: An Overview. J. Agric. Food Chem. 1996, 44, 631–653. [Google Scholar] [CrossRef]
- USDA. United States Standards for Grades of Extracted Honey. In Agricultural Marketing Service Fruit and Vegetable Division Processed Products Branch; USDA: Washington, DC, USA, 1985. [Google Scholar]
- Glomb, M.A.; Tschirnich, R. Detection of Alpha-Dicarbonyl Compounds in Maillard Reaction Systems and in Vivo. J. Agric. Food Chem. 2001, 49, 5543–5550. [Google Scholar] [CrossRef] [PubMed]
- Šebeková, K.; Somoza, V. Dietary Advanced Glycation Endproducts (AGEs) and Their Health Effects—PRO. Mol. Nutr. Food Res. 2007, 51, 1079–1084. [Google Scholar] [CrossRef] [PubMed]
- Surh, Y.J.; Liem, A.; Miller, J.A.; Tannenbaum, S.R. 5-Sulfooxymethylfurfural as a Possible Ultimate Mutagenic and Carcinogenic Metabolite of the Maillard Reaction Product, 5-Hydroxymethylfurfural. Carcinogenesis 1994, 15, 2375–2377. [Google Scholar] [CrossRef] [PubMed]
- Rabbani, N.; Thornalley, P.J. Dicarbonyl Stress in Cell and Tissue Dysfunction Contributing to Ageing and Disease. Biochem. Biophys. Res. Commun. 2015, 458, 221–226. [Google Scholar] [CrossRef] [PubMed]
- Dobler, D.; Ahmed, N.; Song, L.; Eboigbodin, K.E.; Thornalley, P.J. Increased Dicarbonyl Metabolism in Endothelial Cells in Hyperglycemia Induces Anoikis and Impairs Angiogenesis by RGD and GFOGER Motif Modification. Diabetes 2006, 55, 1961–1969. [Google Scholar] [CrossRef]
- Degen, J.; Vogel, M.; Richter, D.; Hellwig, M.; Henle, T. Metabolic Transit of Dietary Methylglyoxal. J. Agric. Food Chem. 2013, 61, 10253–10260. [Google Scholar] [CrossRef]
- Papetti, A.; Mascherpa, D.; Marrubini, G.; Gazzani, G. Effect of In Vitro Digestion on Free α-Dicarbonyl Compounds in Balsamic Vinegars. J. Food Sci. 2013, 78, C514–C519. [Google Scholar] [CrossRef]
- Mittelmaier, S.; Fünfrocken, M.; Fenn, D.; Berlich, R.; Pischetsrieder, M. Quantification of the Six Major α-Dicarbonyl Contaminants in Peritoneal Dialysis Fluids by UHPLC/DAD/MSMS. Anal. Bioanal. Chem. 2011, 401, 1183–1193. [Google Scholar] [CrossRef]
- Mittelmaier, S.; Fünfrocken, M.; Fenn, D.; Pischetsrieder, M. 3-Deoxygalactosone, a New Glucose Degradation Product in Peritoneal Dialysis Fluids: Identification, Quantification by HPLC/DAD/MSMS and Its Pathway of Formation. Anal. Bioanal. Chem. 2011, 399, 1689–1697. [Google Scholar] [CrossRef]
- Linden, T.; Cohen, A.; Deppisch, R.; Kjellstrand, P.; Wieslander, A. 3,4-Dideoxyglucosone-3-Ene (3,4-DGE): A Cytotoxic Glucose Degradation Product in Fluids for Peritoneal Dialysis. Kidney Int. 2002, 62, 697–703. [Google Scholar] [CrossRef] [PubMed]
- Distler, L.; Georgieva, A.; Kenkel, I.; Huppert, J.; Pischetsrieder, M. Structure- and Concentration-Specific Assessment of the Physiological Reactivity of α-Dicarbonyl Glucose Degradation Products in Peritoneal Dialysis Fluids. Chem. Res. Toxicol. 2014, 27, 1421–1430. [Google Scholar] [CrossRef]
- Golej, J.; Hoeger, H.; Radner, W.; Unfried, G.; Lubec, G. Oral Administration of Methylglyoxal Leads to Kidney Collagen Accumulation in the Mouse. Life Sci. 1998, 63, 801–807. [Google Scholar] [CrossRef] [PubMed]
- Henatsch, D.; den Hartog, G.J.M.; Duijvestijn, A.M.; Wolffs, P.F.; Phielix, E.; Stokroos, R.J.; Briedé, J.J. The Contribution of α-Dicarbonyl Compound Dependent Radical Formation to the Antiseptic Effect of Honey. J. Funct. Foods 2018, 45, 239–246. [Google Scholar] [CrossRef]
- Yan, S.; Wu, L.; Xue, X. α-Dicarbonyl Compounds in Food Products: Comprehensively Understanding Their Occurrence, Analysis, and Control. Compr. Rev. Food Sci. Food Saf. 2023, 22, 1387–1417. [Google Scholar] [CrossRef]
- Ruiz-Matute, A.I.; Castro Vazquez, L.; Hernández-Hernández, O.; Sanz, M.L.; Martínez-Castro, I. Identification and Determination of 3-deoxyglucosone and Glucosone in Carbohydrate-rich Foods. Wiley Online LibraryAI Ruiz-Matute, L Castro Vazquez, O Hernández-Hernández, ML Sanz, I Martínez-Castro. J. Sci. Food Agric. 2014, 95, 2424–2430. [Google Scholar] [CrossRef]
- Terio, V.; Bozzo, G.; Ceci, E.; Savarino, A.E.; Barrasso, R.; Di Pinto, A.; Mottola, A.; Marchetti, P.; Tantillo, G.; Bonerba, E. Methylglyoxal (MGO) in Italian Honey. Appl. Sci. 2021, 11, 831. [Google Scholar] [CrossRef]
- Khalil, M.I.; Sulaiman, S.A.; Gan, S.H. High 5-Hydroxymethylfurfural Concentrations Are Found in Malaysian Honey Samples Stored for More than One Year. Food Chem. Toxicol. 2010, 48, 2388–2392. [Google Scholar] [CrossRef]
- Beretta, G.; Granata, P.; Ferrero, M.; Orioli, M.; Maffei, R. Standardization of Antioxidant Properties of Honey by a Combination of Spectrophotometric/Fluorimetric Assays and Chemometrics. Anal. Chim. Acta 2005, 533, 185–191. [Google Scholar] [CrossRef]
- White, J.W.; Beaty, C.M.R.; Eaton, W.G.; Hart, B.; Huser, W.; Killion, E.; Lamssies, R.R.; Lee, T.; Moen, W.E. Instrumental Color Classification of Honey: Collaborative Study. J. Assoc. Off. Anal. Chem. 2008, 67, 1983–1985. [Google Scholar] [CrossRef]


| α-Dicarbonyl | Linearity (R2) | LOD (mg/kg) | LOQ (mg/kg) | Intraday Precision (%RSD) | Interday Precision (%RSD) | %Recovery (Mean ± SD) |
|---|---|---|---|---|---|---|
| MGO | 0.9989 | 0.0018 | 0.006 | 1.98 | 2.19 | 75.8 ± 0.21 |
| GO | 0.9999 | 0.0015 | 0.005 | 2.68 | 4.98 | 67.0 ± 0.21 |
| 3-DG | 0.9979 | 0.002 | 0.008 | 3.93 | 4.24 | 82.5 ± 0.25 |
| Honey | Geographical Location | 3-Deoxygluconse (3-DG) mg/kg | Glyoxal (GO) mg/kg | Methylglyoxal (MGO) mg/kg | Total Dicarbonyl Content (mg/kg) |
|---|---|---|---|---|---|
| Washington A | Washington | 10.80 | 3.44 | 2.57 | 16.81 |
| Washington B | Washington | 22.14 | 9.43 | 6.03 | 37.60 |
| Washington C | Washington | 18.56 | 8.10 | 4.25 | 30.91 |
| Washington D | Washington | 17.02 | 9.26 | 1.38 | 27.66 |
| Washington E | Washington | 21.04 | 7.88 | 1.69 | 30.62 |
| Washington F | Washington | 15.71 | 7.42 | 4.23 | 27.36 |
| Texas A | Texas | 30.26 | 4.61 | N/D 1 | 34.87 |
| Texas B | Texas | 29.12 | 4.94 | N/D | 34.07 |
| Texas C | Texas | 46.99 | 4.59 | N/D | 51.58 |
| Texas D | Texas | 37.47 | 4.62 | N/D | 42.09 |
| Texas E | Texas | 43.34 | 4.65 | N/D | 48.00 |
| Texas F | Texas | 32.04 | 4.76 | N/D | 36.80 |
| SoCal A | Southern California | 24.51 | 2.86 | N/D | 27.38 |
| SoCal B | Southern California | 36.24 | 4.75 | N/D | 41.00 |
| SoCal C | Southern California | 41.37 | 5.56 | N/D | 46.94 |
| SoCal D | Southern California | 45.45 | 4.74 | N/D | 50.19 |
| SoCal E | Southern California | 42.84 | 4.75 | N/D | 47.60 |
| SoCal F | Southern California | 50.24 | 4.49 | N/D | 55.74 |
| Manuka | New Zealand | 8.16 | N/D | 28.82 | 36.98 |
| Average | 30.17 ± 12.97 | 5.60 ± 1.93 | 6.99 ± 9.76 | 38.12 ± 10.16 | |
| Range | 10.80–50.24 | 2.86–9.43 | 1.38–28.82 | 16.81–55.74 |
| Honey | Geographical Origin | pH | Color | Total Dicarbonyl Content (mg/kg) |
|---|---|---|---|---|
| Washington A | Washington | 3.80 | 89.94 (Light amber) 1 | 16.81 |
| Washington B | Washington | 3.81 | 89.94 (Light amber) | 37.60 |
| Washington C | Washington | 3.83 | 90.45 (Light amber) | 30.91 |
| Washington D | Washington | 3.74 | 90.84 (Light amber) | 27.66 |
| Washington E | Washington | 3.83 | 91.11 (Light amber) | 30.62 |
| Washington F | Washington | 3.81 | 90.76 (Light amber) | 27.36 |
| Texas A | Texas | 4.20 | 117.69 (Dark amber) | 34.87 |
| Texas B | Texas | 4.00 | 117.31 (Dark amber) | 34.07 |
| Texas C | Texas | 3.75 | 118.27 (Dark amber) | 51.58 |
| Texas D | Texas | 3.73 | 118.42 (Dark amber) | 42.09 |
| Texas E | Texas | 3.74 | 119.86 (Dark amber) | 48.00 |
| Texas F | Texas | 4.05 | 120.44 (Dark amber) | 36.80 |
| SoCal A | California | 3.88 | 99. 97 (Amber) | 27.38 |
| SoCal B | California | 3.90 | 100.56 (Amber) | 41.00 |
| SoCal C | California | 3.82 | 100.53 (Amber) | 46.94 |
| SoCal D | California | 3.83 | 99.42 (Amber) | 50.19 |
| SoCal E | California | 3.86 | 100.77 (Amber) | 47.60 |
| SoCal F | California | 3.96 | 99.76 (Amber) | 55.74 |
| Manuka | New Zealand | 3.87 | 64.42 (Light Amber) | 36.98 |
| Average | 3.86 ± 0.11 | 100.92 ± 14.58 | 38.12 ± 10.16 | |
| Range | 3.74–4.20 | 64.42–119.45 | 16.81–55.74 | |
| Regression values | R = 0.267 (p > 0.05) | R = 0.668 (p < 0.05) |
| Honey | Geographical Origin | MGO (mg/kg) | GO (mg/kg) | 3-DG (mg/kg) | References |
|---|---|---|---|---|---|
| Multifloral | Germany | 0.4–5.4 | 0.2–2.7 | 79–1266 | [10] |
| Multifloral | Canada/Australia/Hungary | 0.8–33 | 0.3–1.3 | 143–1099 | [6] |
| Multifloral | Italy/Hungary | 0.2–2.9 | 0.1–10.9 | 75.9–808.8 | [8] |
| Multifloral | Florida/New Zealand | 3.63–483 | 2.19–7.35 | 206–884 | [9] |
| Manuka | New Zealand | N/D 1–761 | N/D–7.0 | 119–1451 | [35] |
| Manuka/Revamil | New Zealand/Netherlands | 29.3–497.1 | 14.4–27.3 | 221.6–687.3 | [59] |
| Multifloral | Multiple locations | 1.6–725 | N/D | 271–1641 | [7] |
| Acacia | China | 0.77–4.79 | 0.56–3.18 | 114.36–146.42 | [60] |
| Multifloral | Spain | N/D | N/D | 150–2380 | [61] |
| Honeydew | Italy | 5.7–9.9 | N/D | N/D | [62] |
| Eucalyptus | Italy | 9.9–12.7 | N/D | N/D | [62] |
| Multifloral | USA | 1.38–28.82 | 2.86–9.43 | 10.80–30.24 | [62] |
| α-Dicarbonyls | Low Concentration (mg/mL) | Middle Concentration (mg/mL) | High Concentration (mg/mL) |
|---|---|---|---|
| Spiked MGO | 0.001 | 0.01 | 0.1 |
| Spiked GO | 0.006 | 0.03 | 0.06 |
| Spiked 3-DG | 0.001 | 0.01 | 0.1 |
Disclaimer/Publisher’s Note: The statements, opinions and data contained in all publications are solely those of the individual author(s) and contributor(s) and not of MDPI and/or the editor(s). MDPI and/or the editor(s) disclaim responsibility for any injury to people or property resulting from any ideas, methods, instructions or products referred to in the content. |
© 2024 by the authors. Licensee MDPI, Basel, Switzerland. This article is an open access article distributed under the terms and conditions of the Creative Commons Attribution (CC BY) license (https://creativecommons.org/licenses/by/4.0/).
Share and Cite
Nyarko, K.; Greenlief, C.M. Investigations of Major α-Dicarbonyl Content in U.S. Honey of Different Geographical Origins. Molecules 2024, 29, 1588. https://doi.org/10.3390/molecules29071588
Nyarko K, Greenlief CM. Investigations of Major α-Dicarbonyl Content in U.S. Honey of Different Geographical Origins. Molecules. 2024; 29(7):1588. https://doi.org/10.3390/molecules29071588
Chicago/Turabian StyleNyarko, Kate, and C. Michael Greenlief. 2024. "Investigations of Major α-Dicarbonyl Content in U.S. Honey of Different Geographical Origins" Molecules 29, no. 7: 1588. https://doi.org/10.3390/molecules29071588