
A Novel Antimicrobial Mechanism of Azalomycin F Acting on Lipoteichoic Acid Synthase and Cell Envelope

Abstract
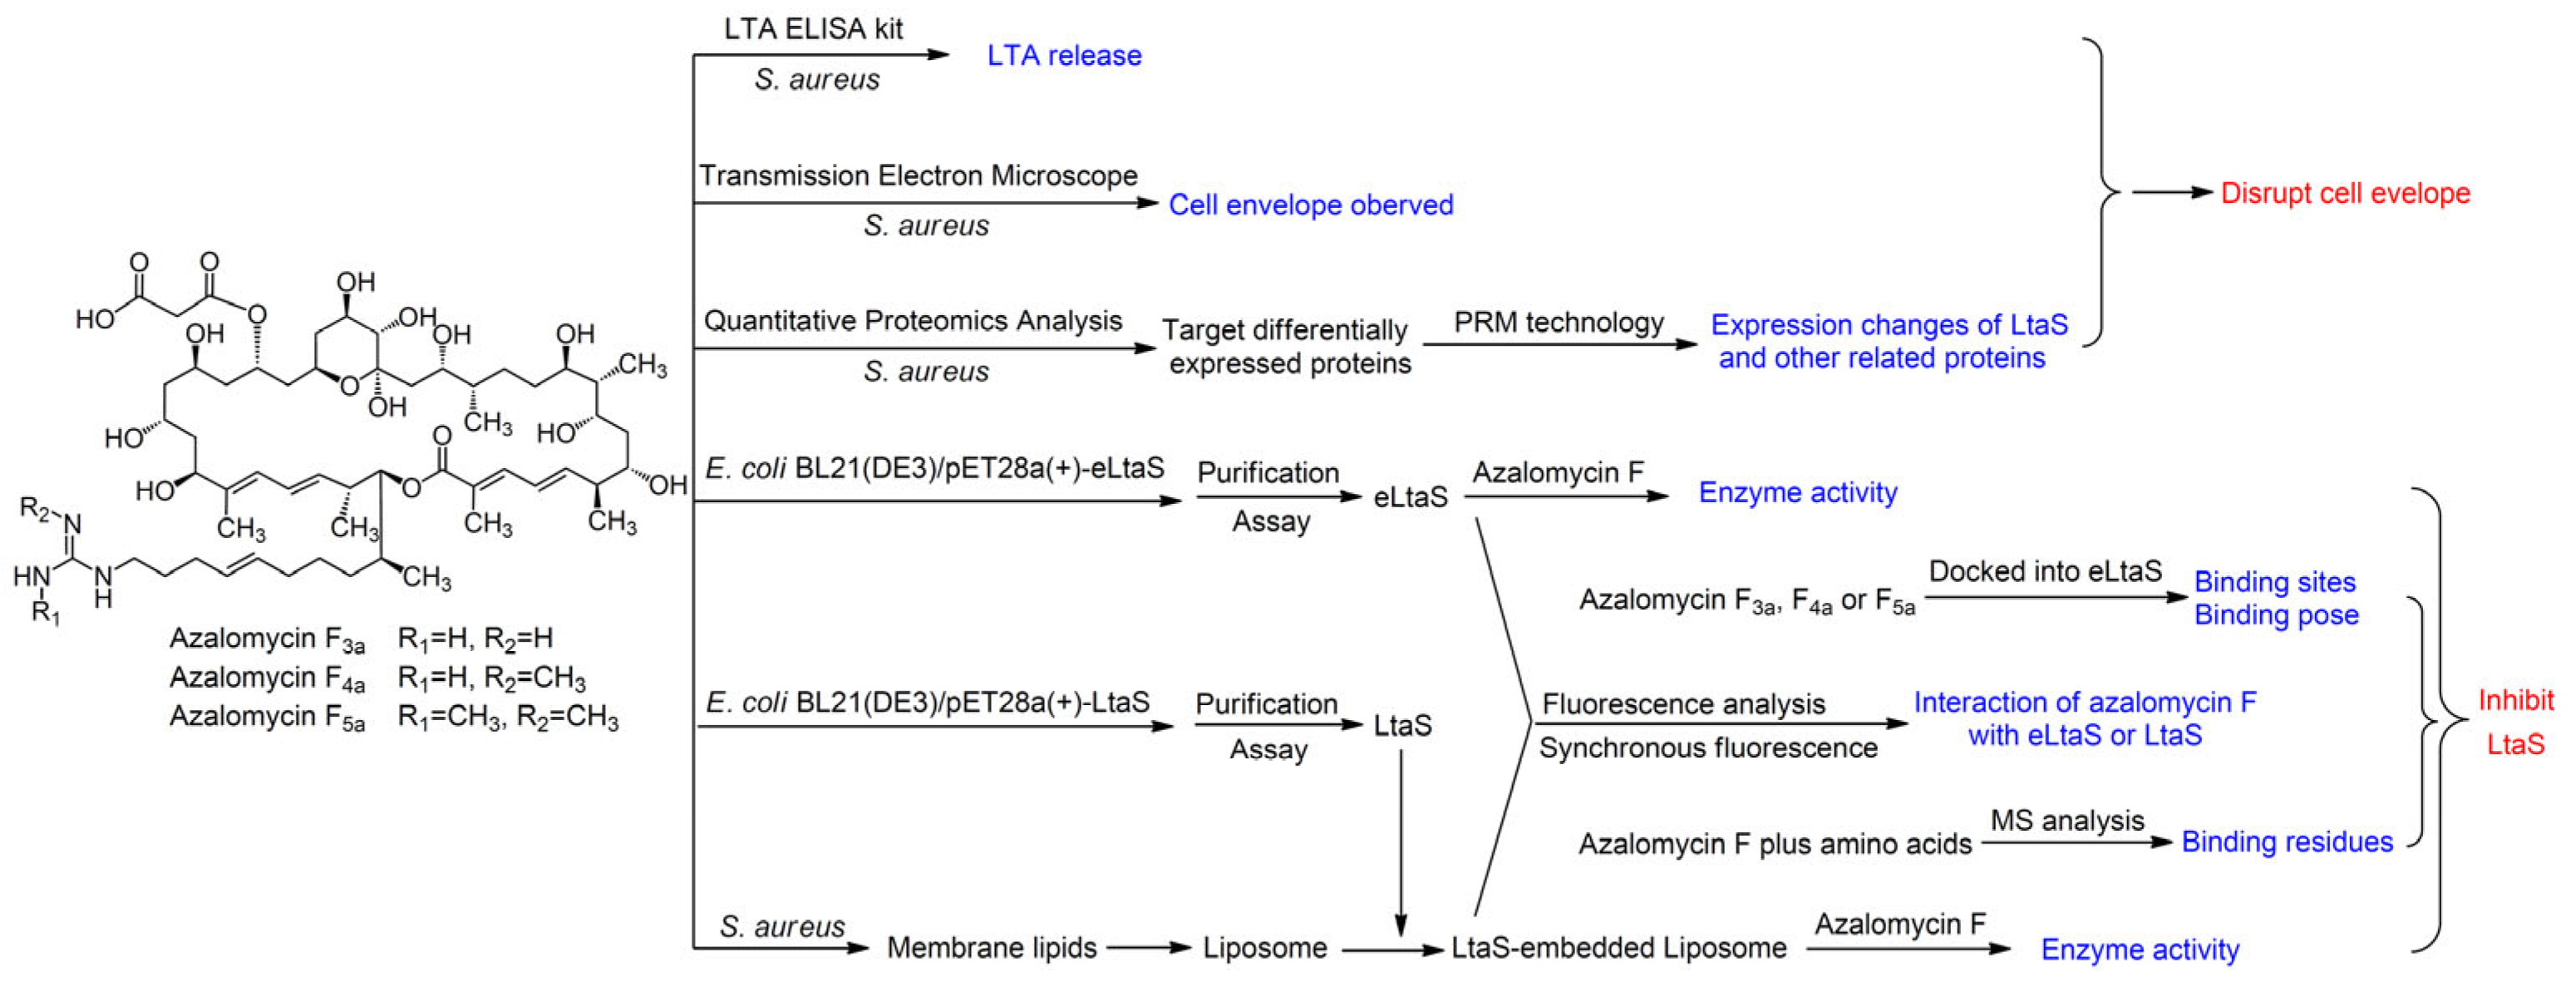
:1. Introduction
2. Results and Discussion
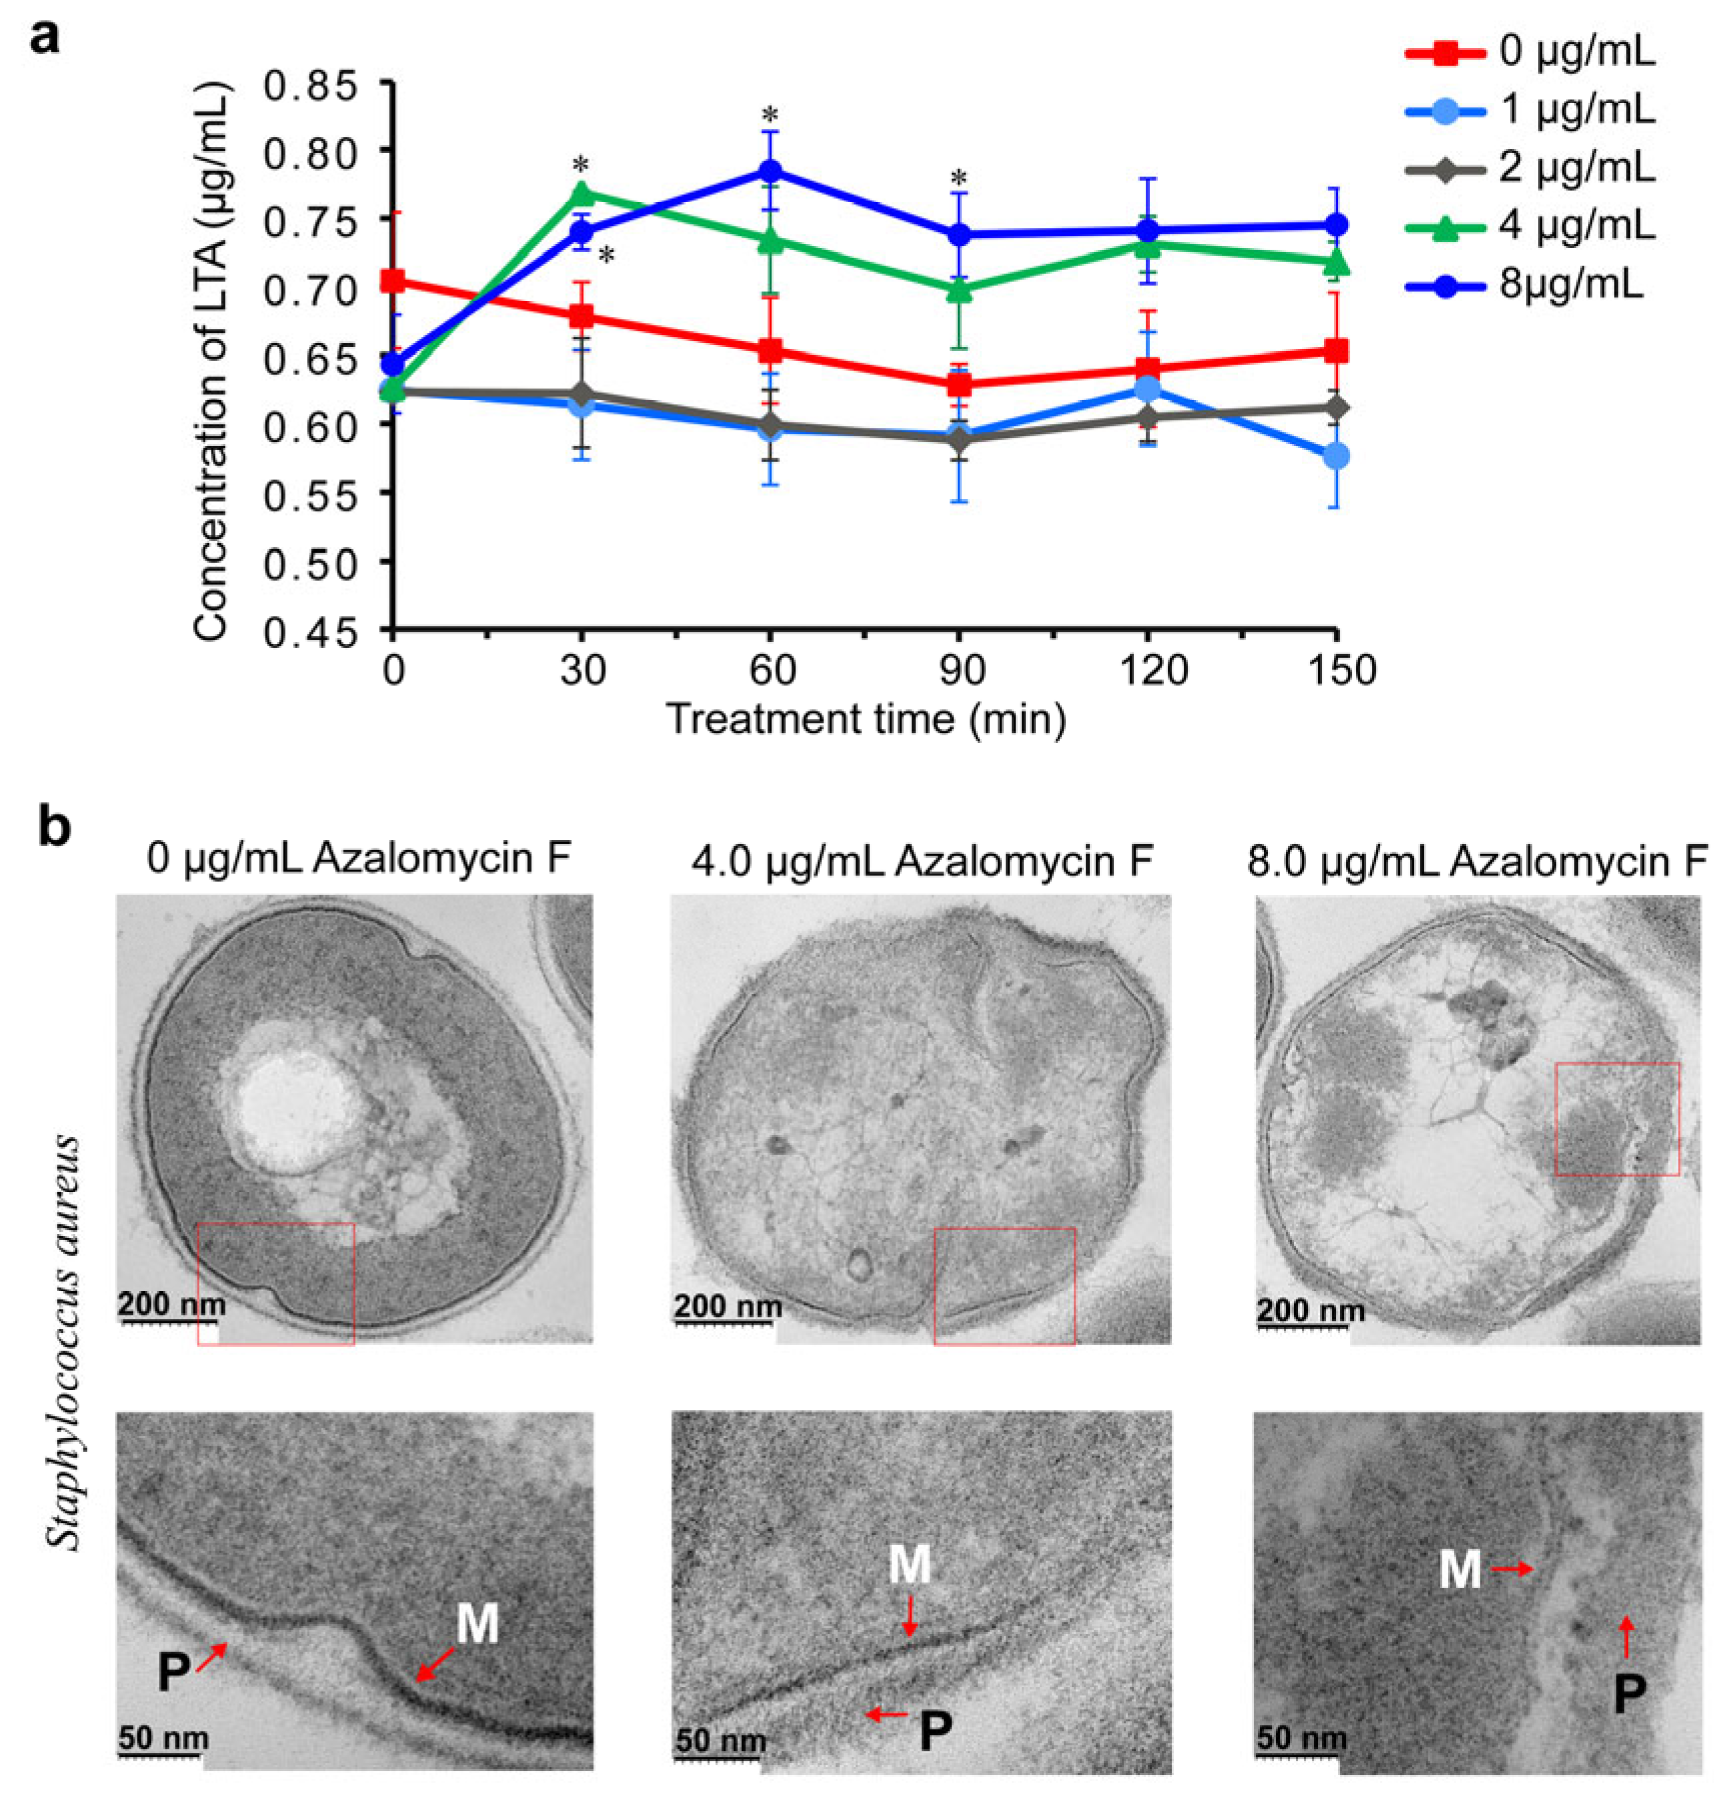
2.1. Azalomycin F Accelerating the Release of Cellular LTA
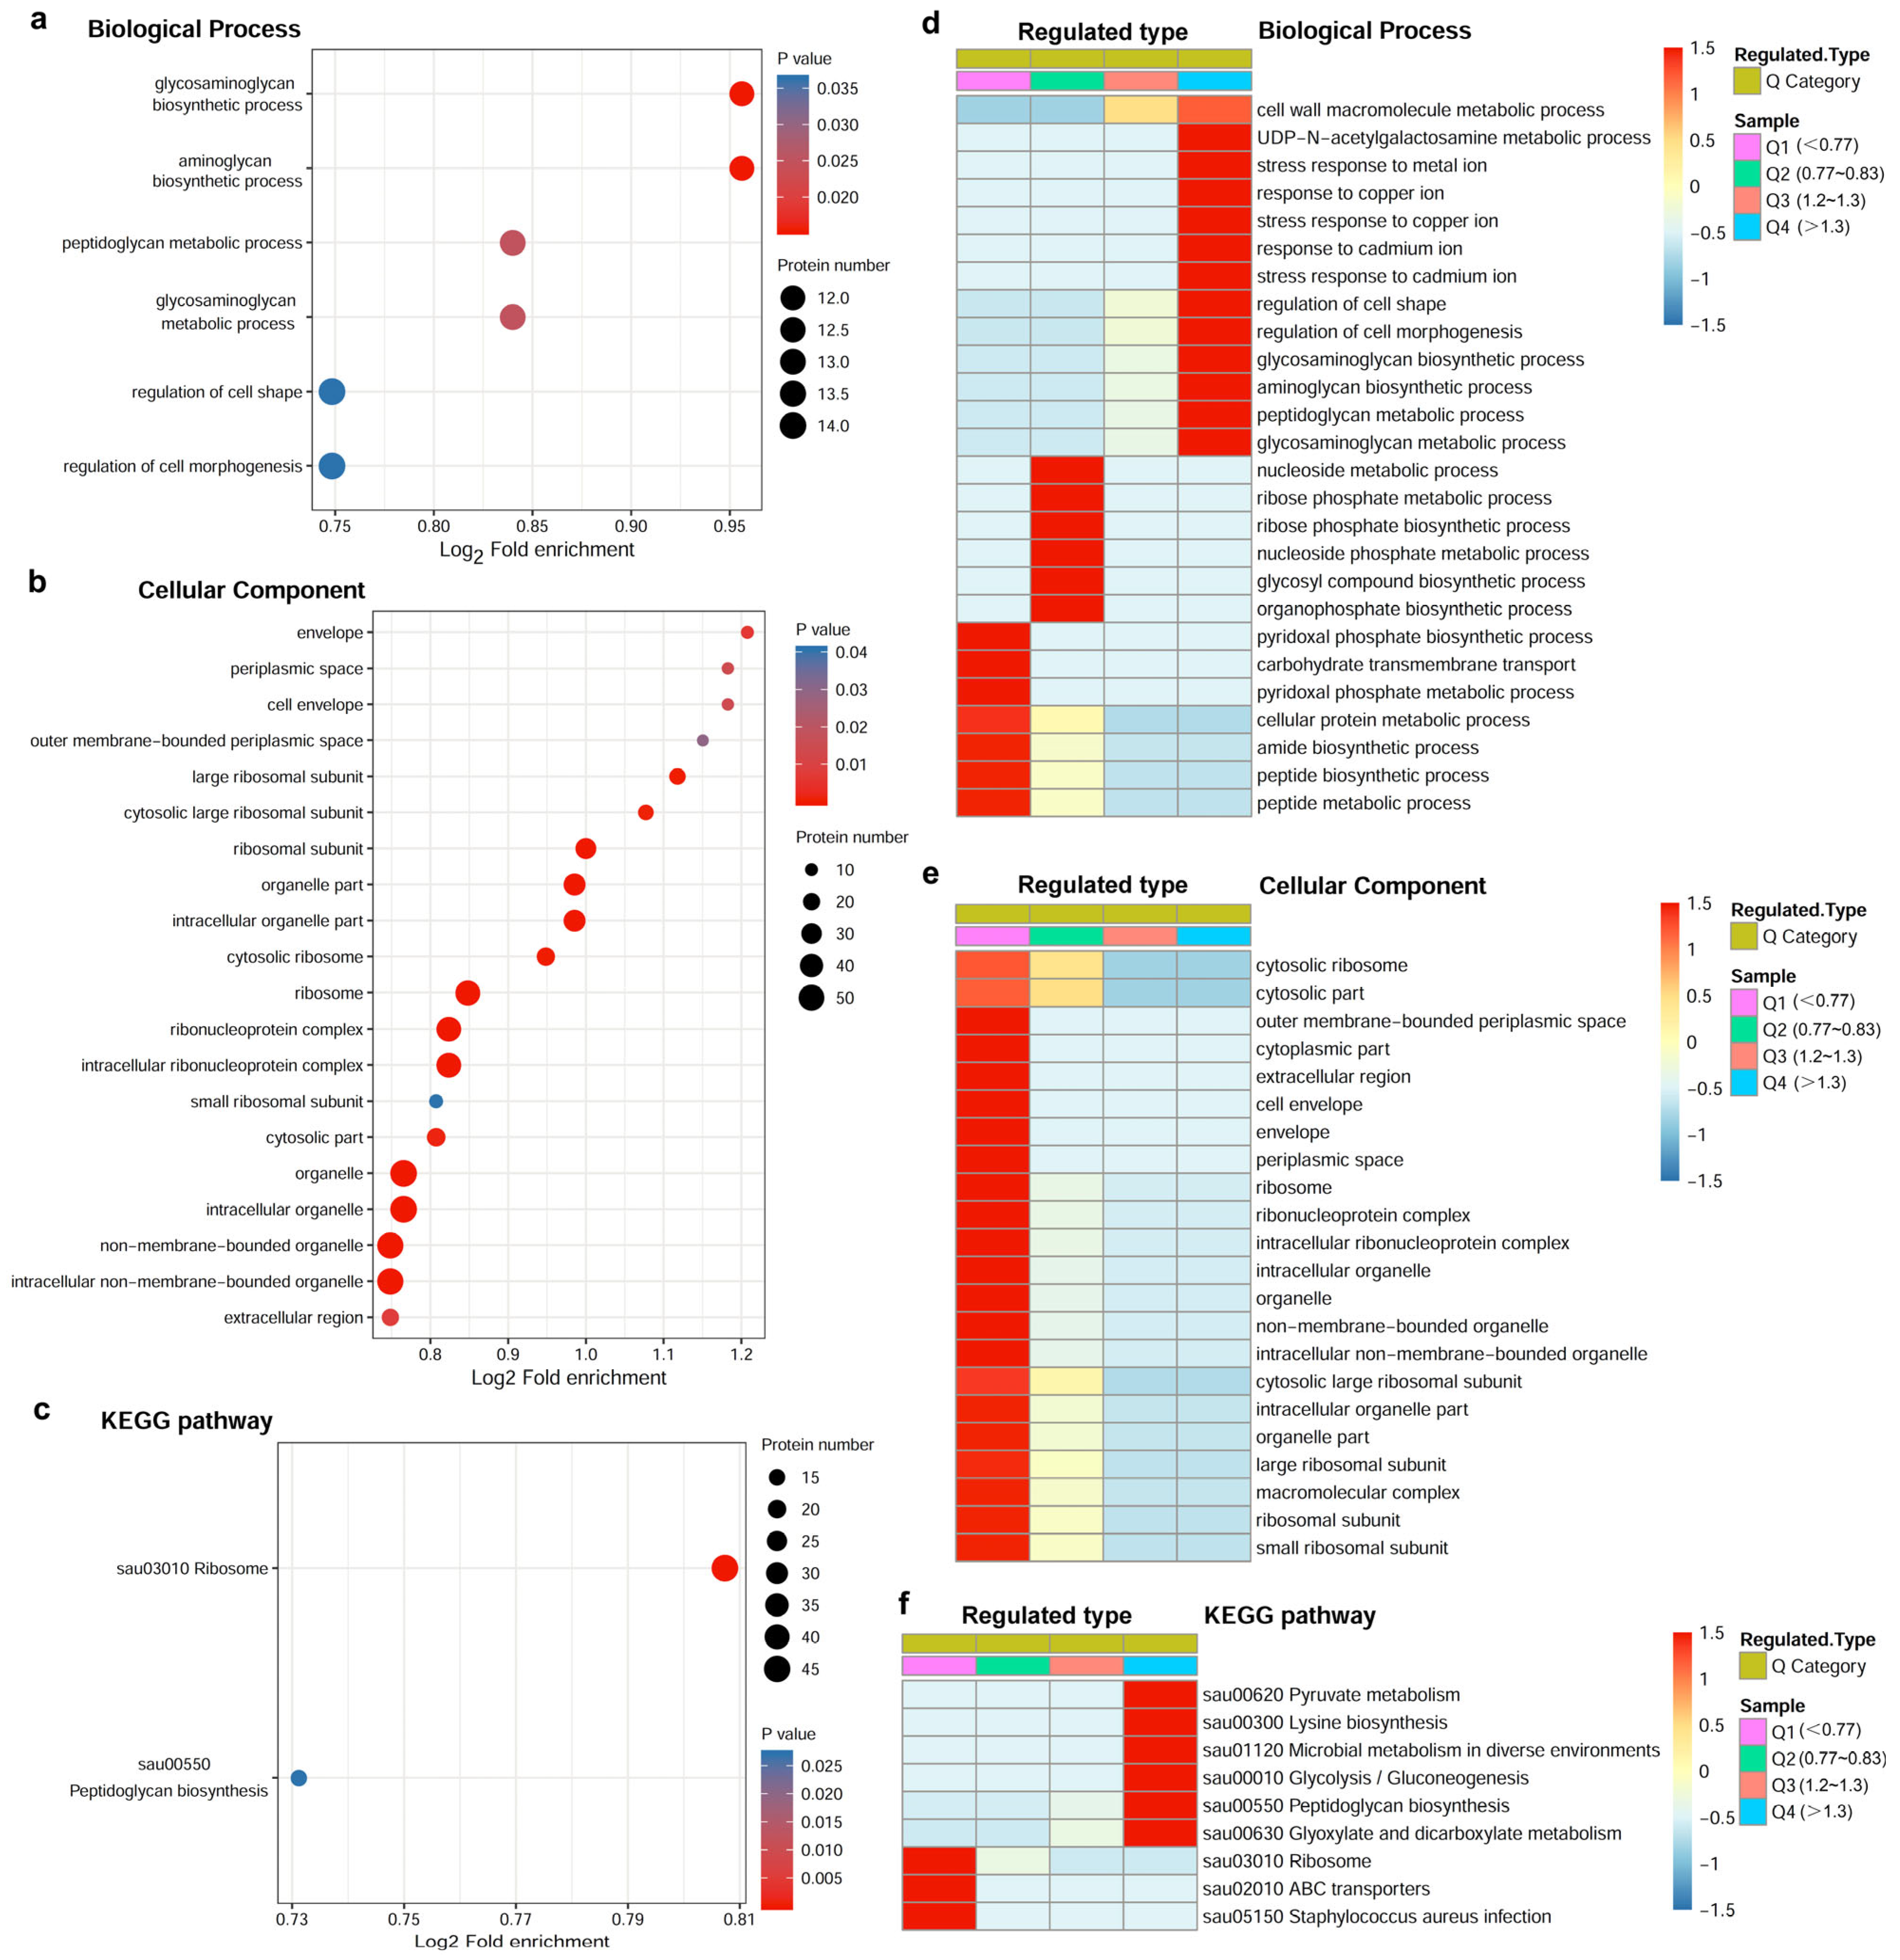
2.2. Influence of Azalomycin F on the Expressions of LtaS and Other Related Enzymes
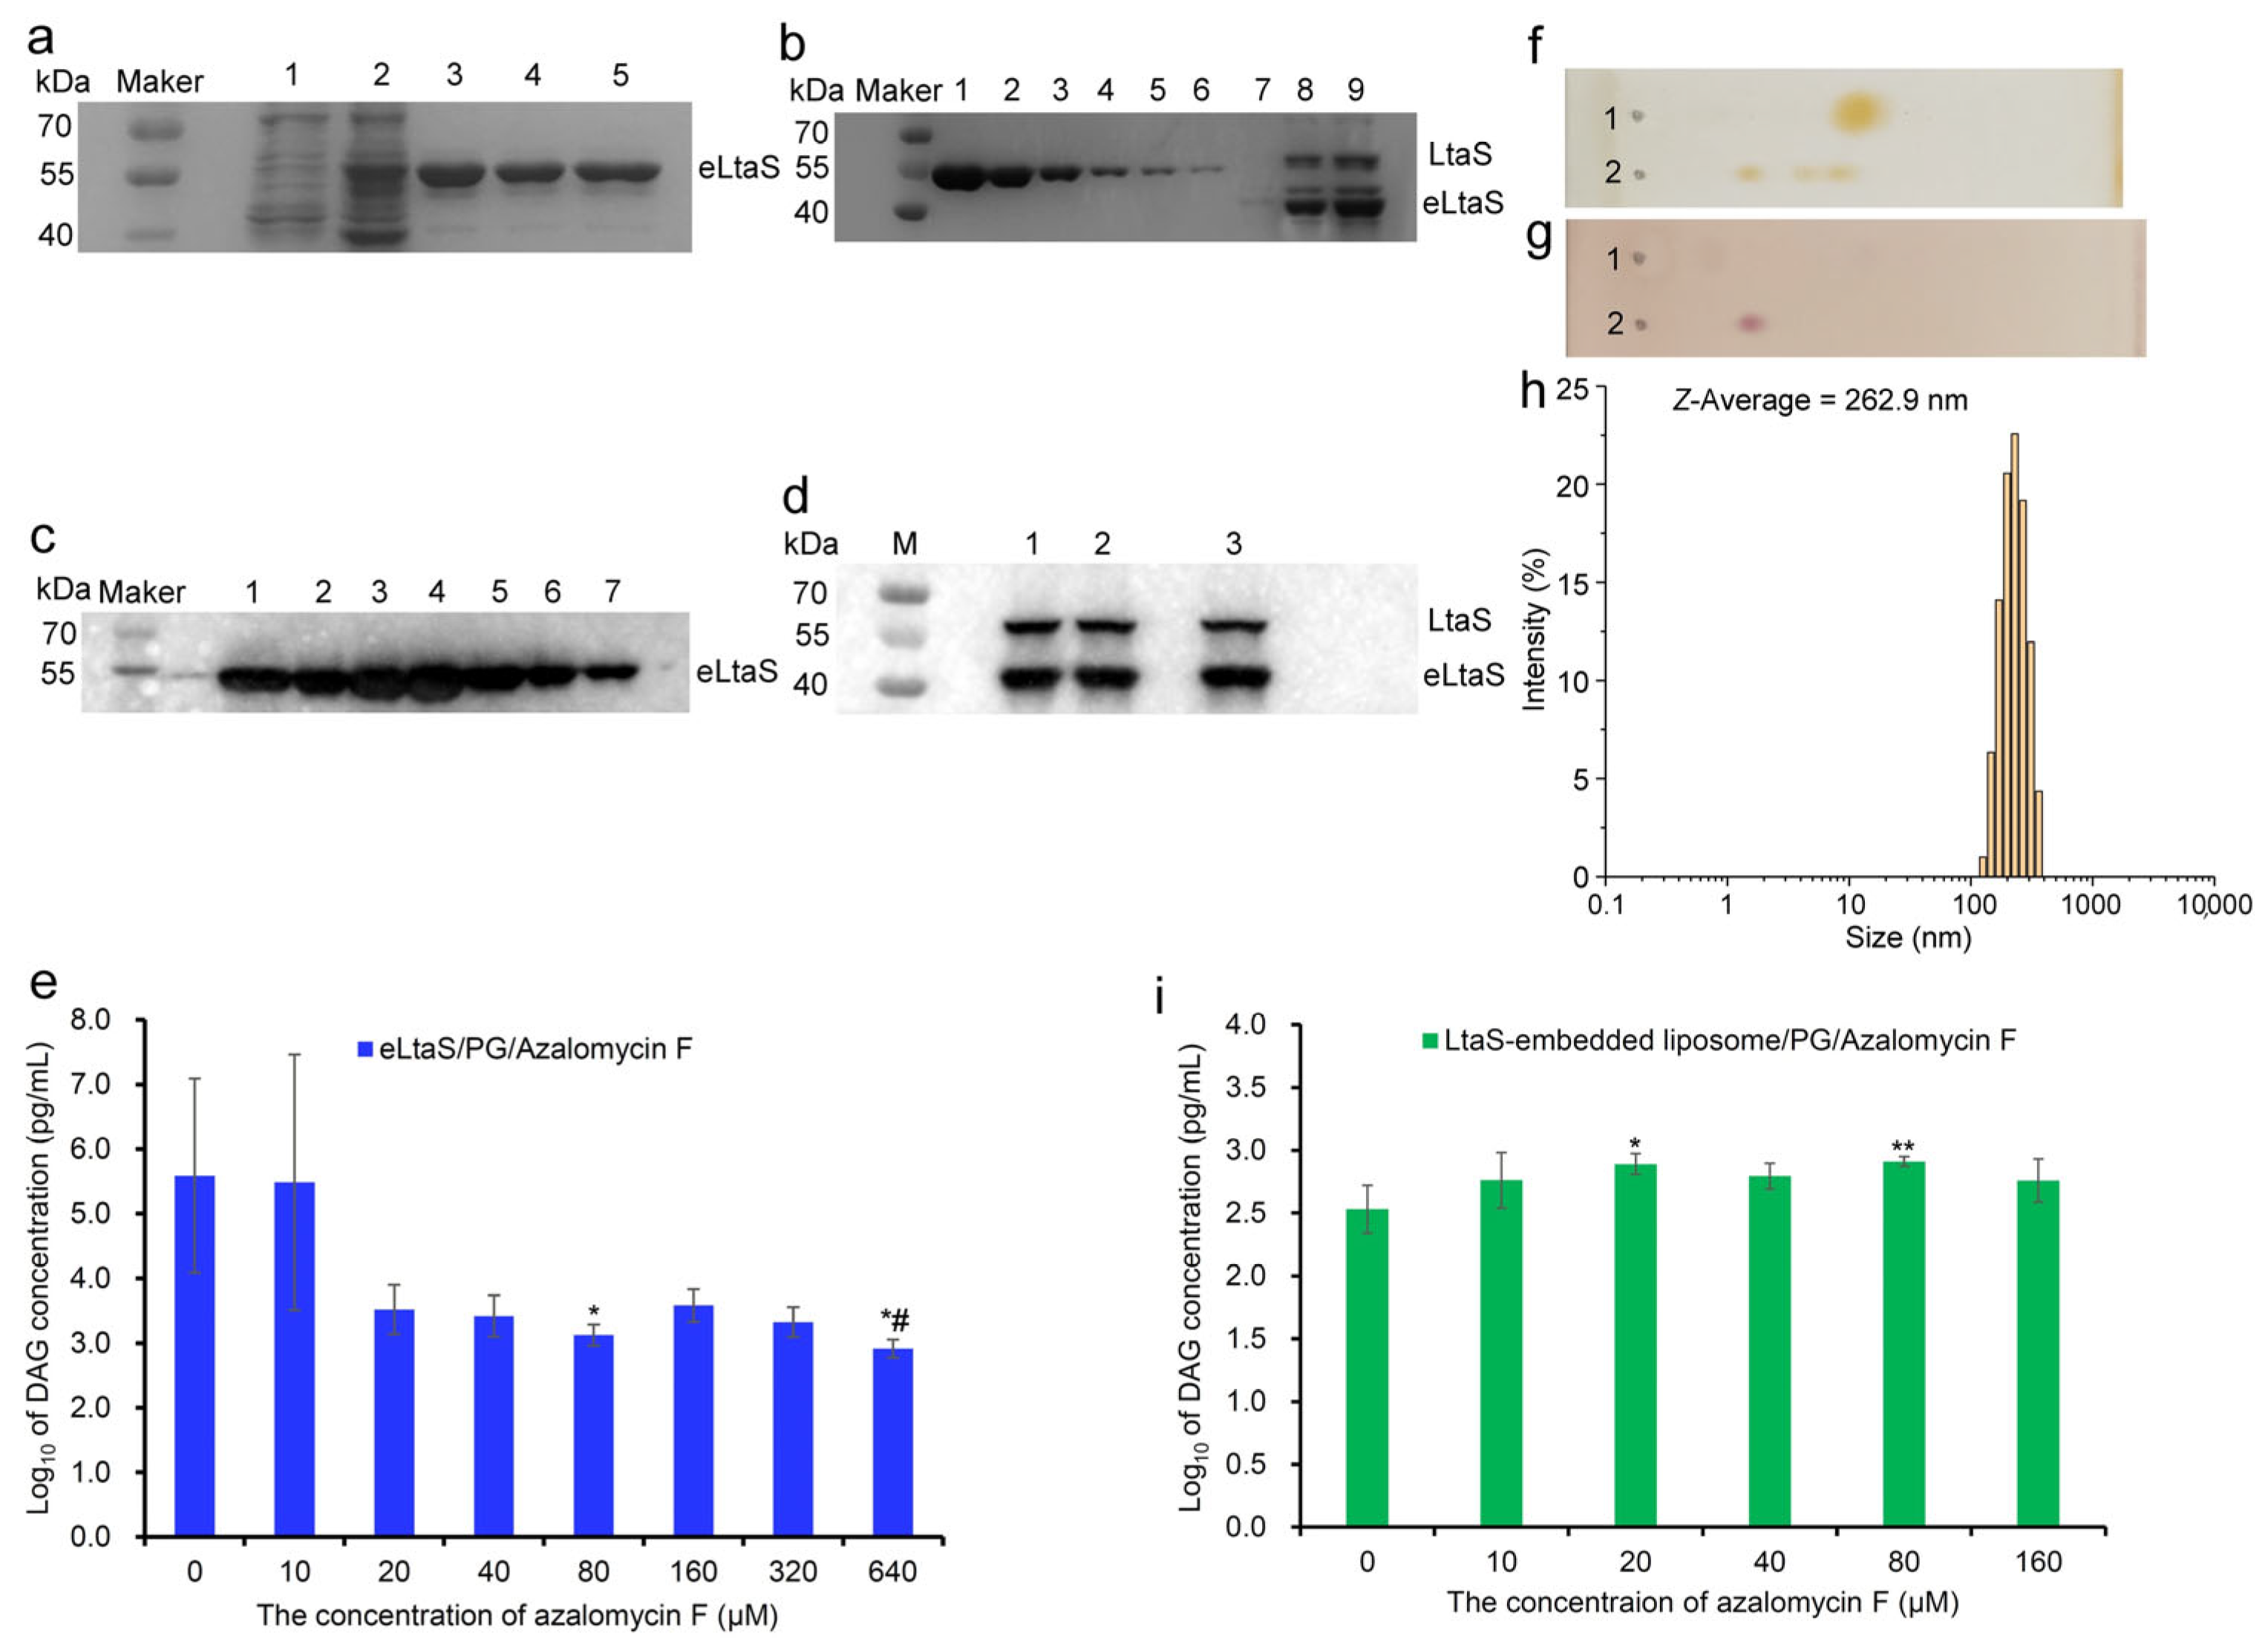
2.3. Azalomycin F Inhibiting LtaS to Synthesize LTA
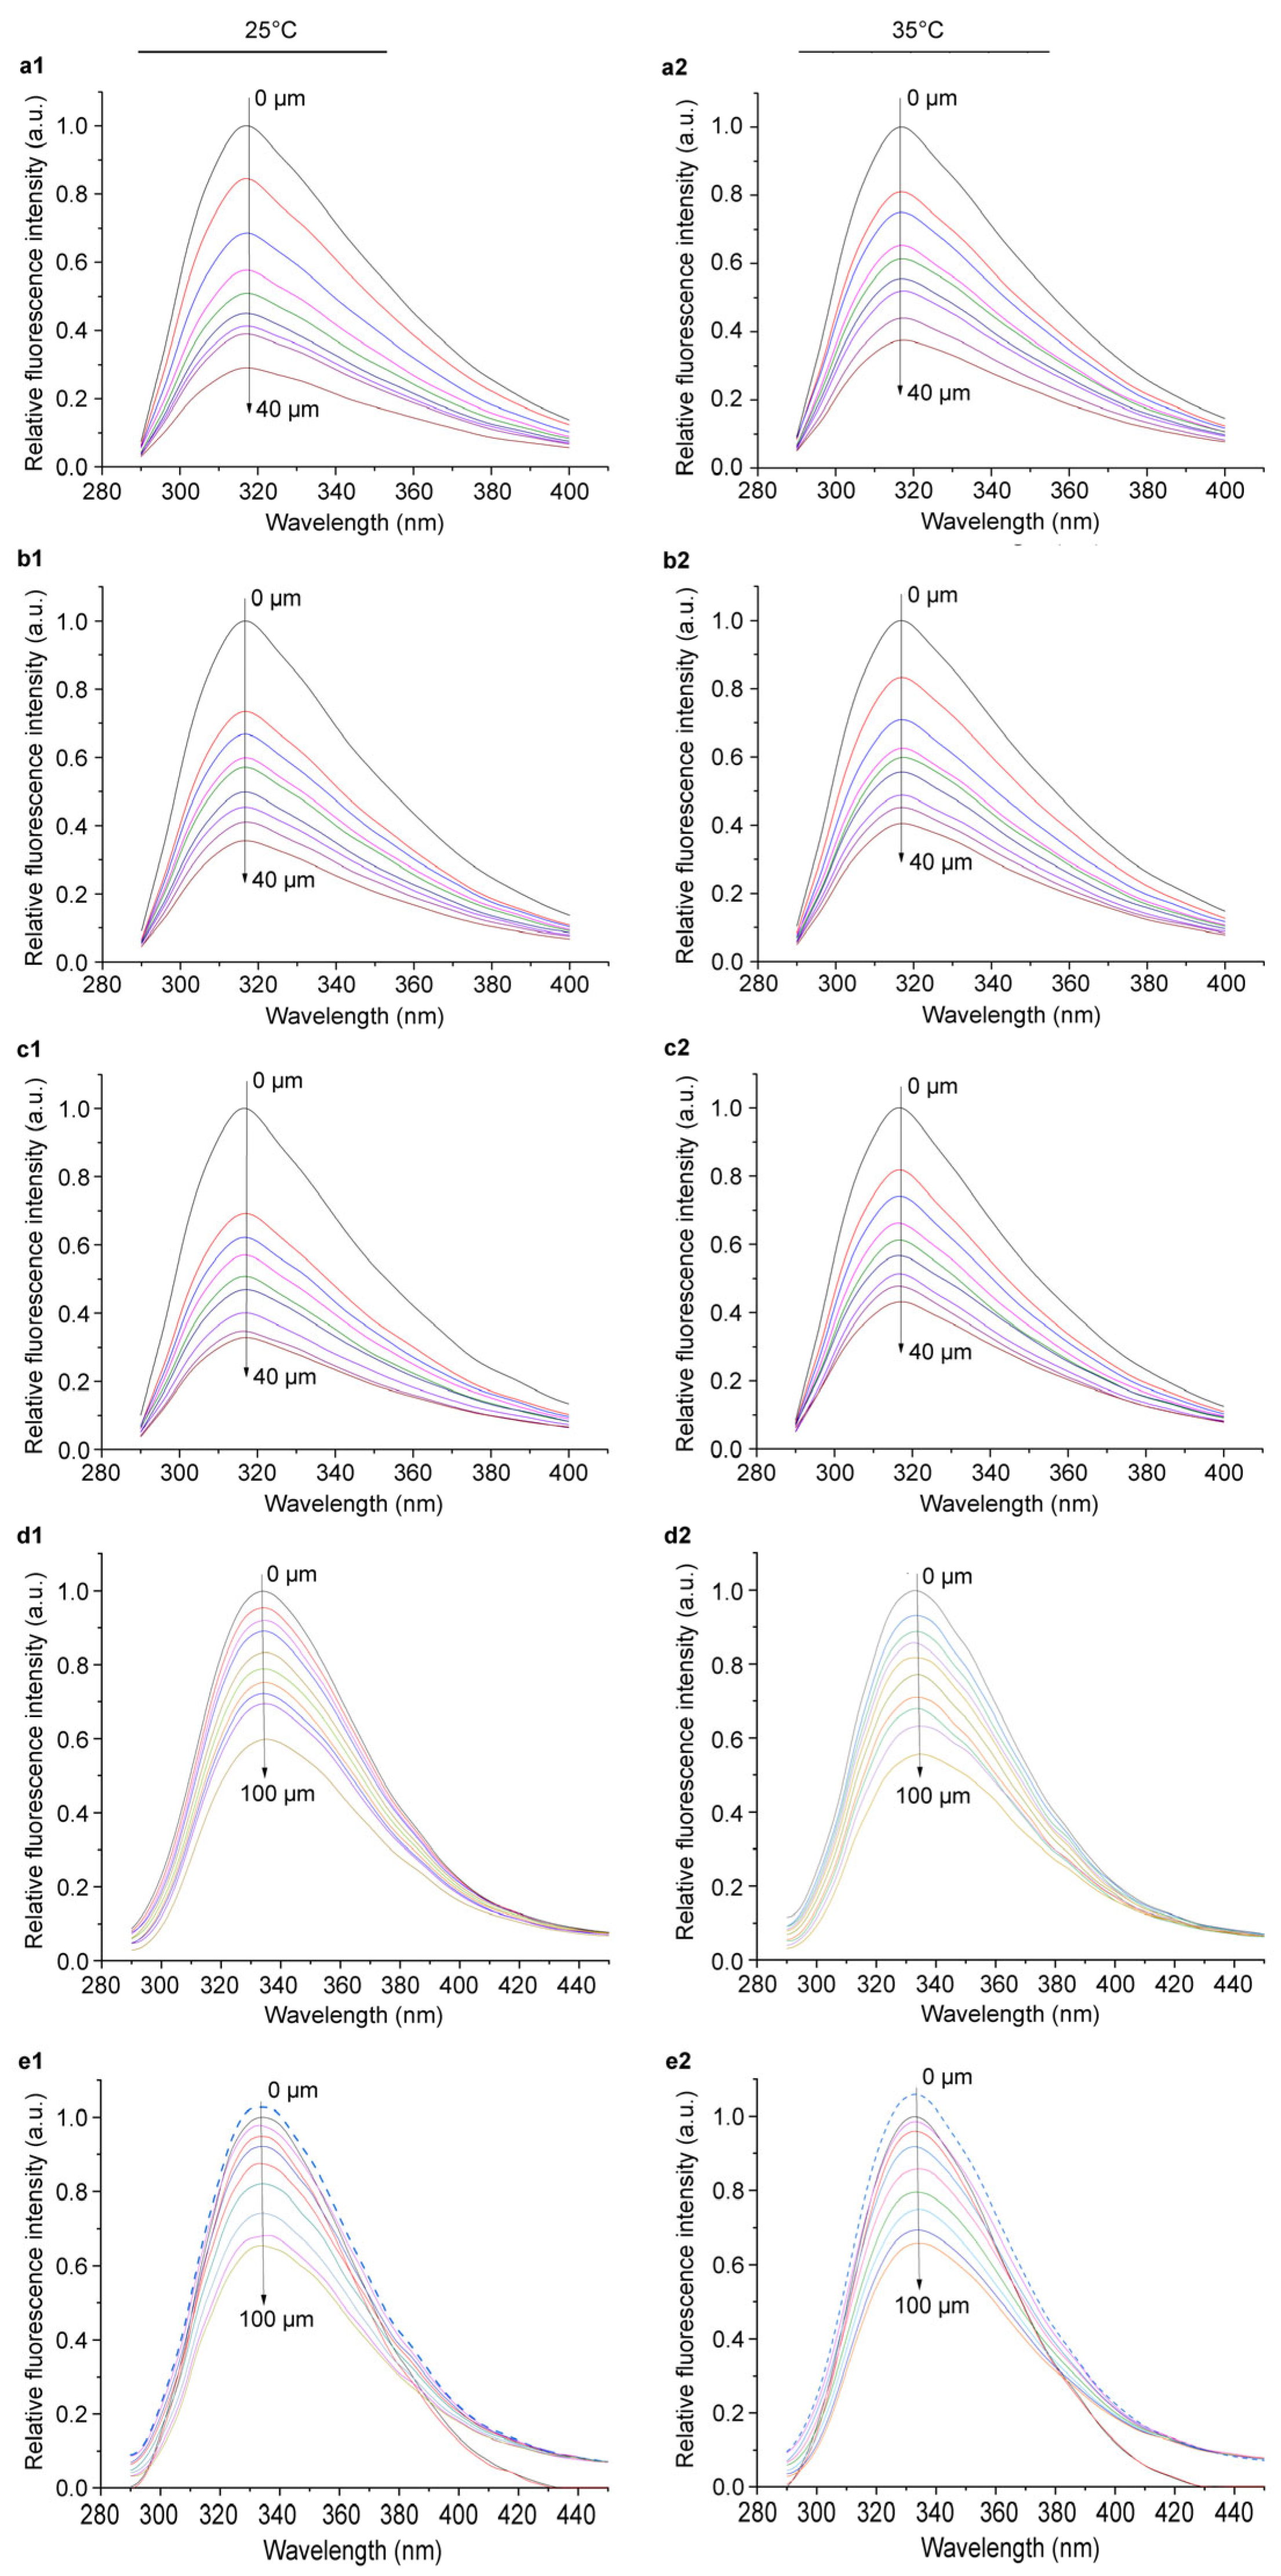
2.4. Action Mode of Azalomycin F Interacting with LtaS
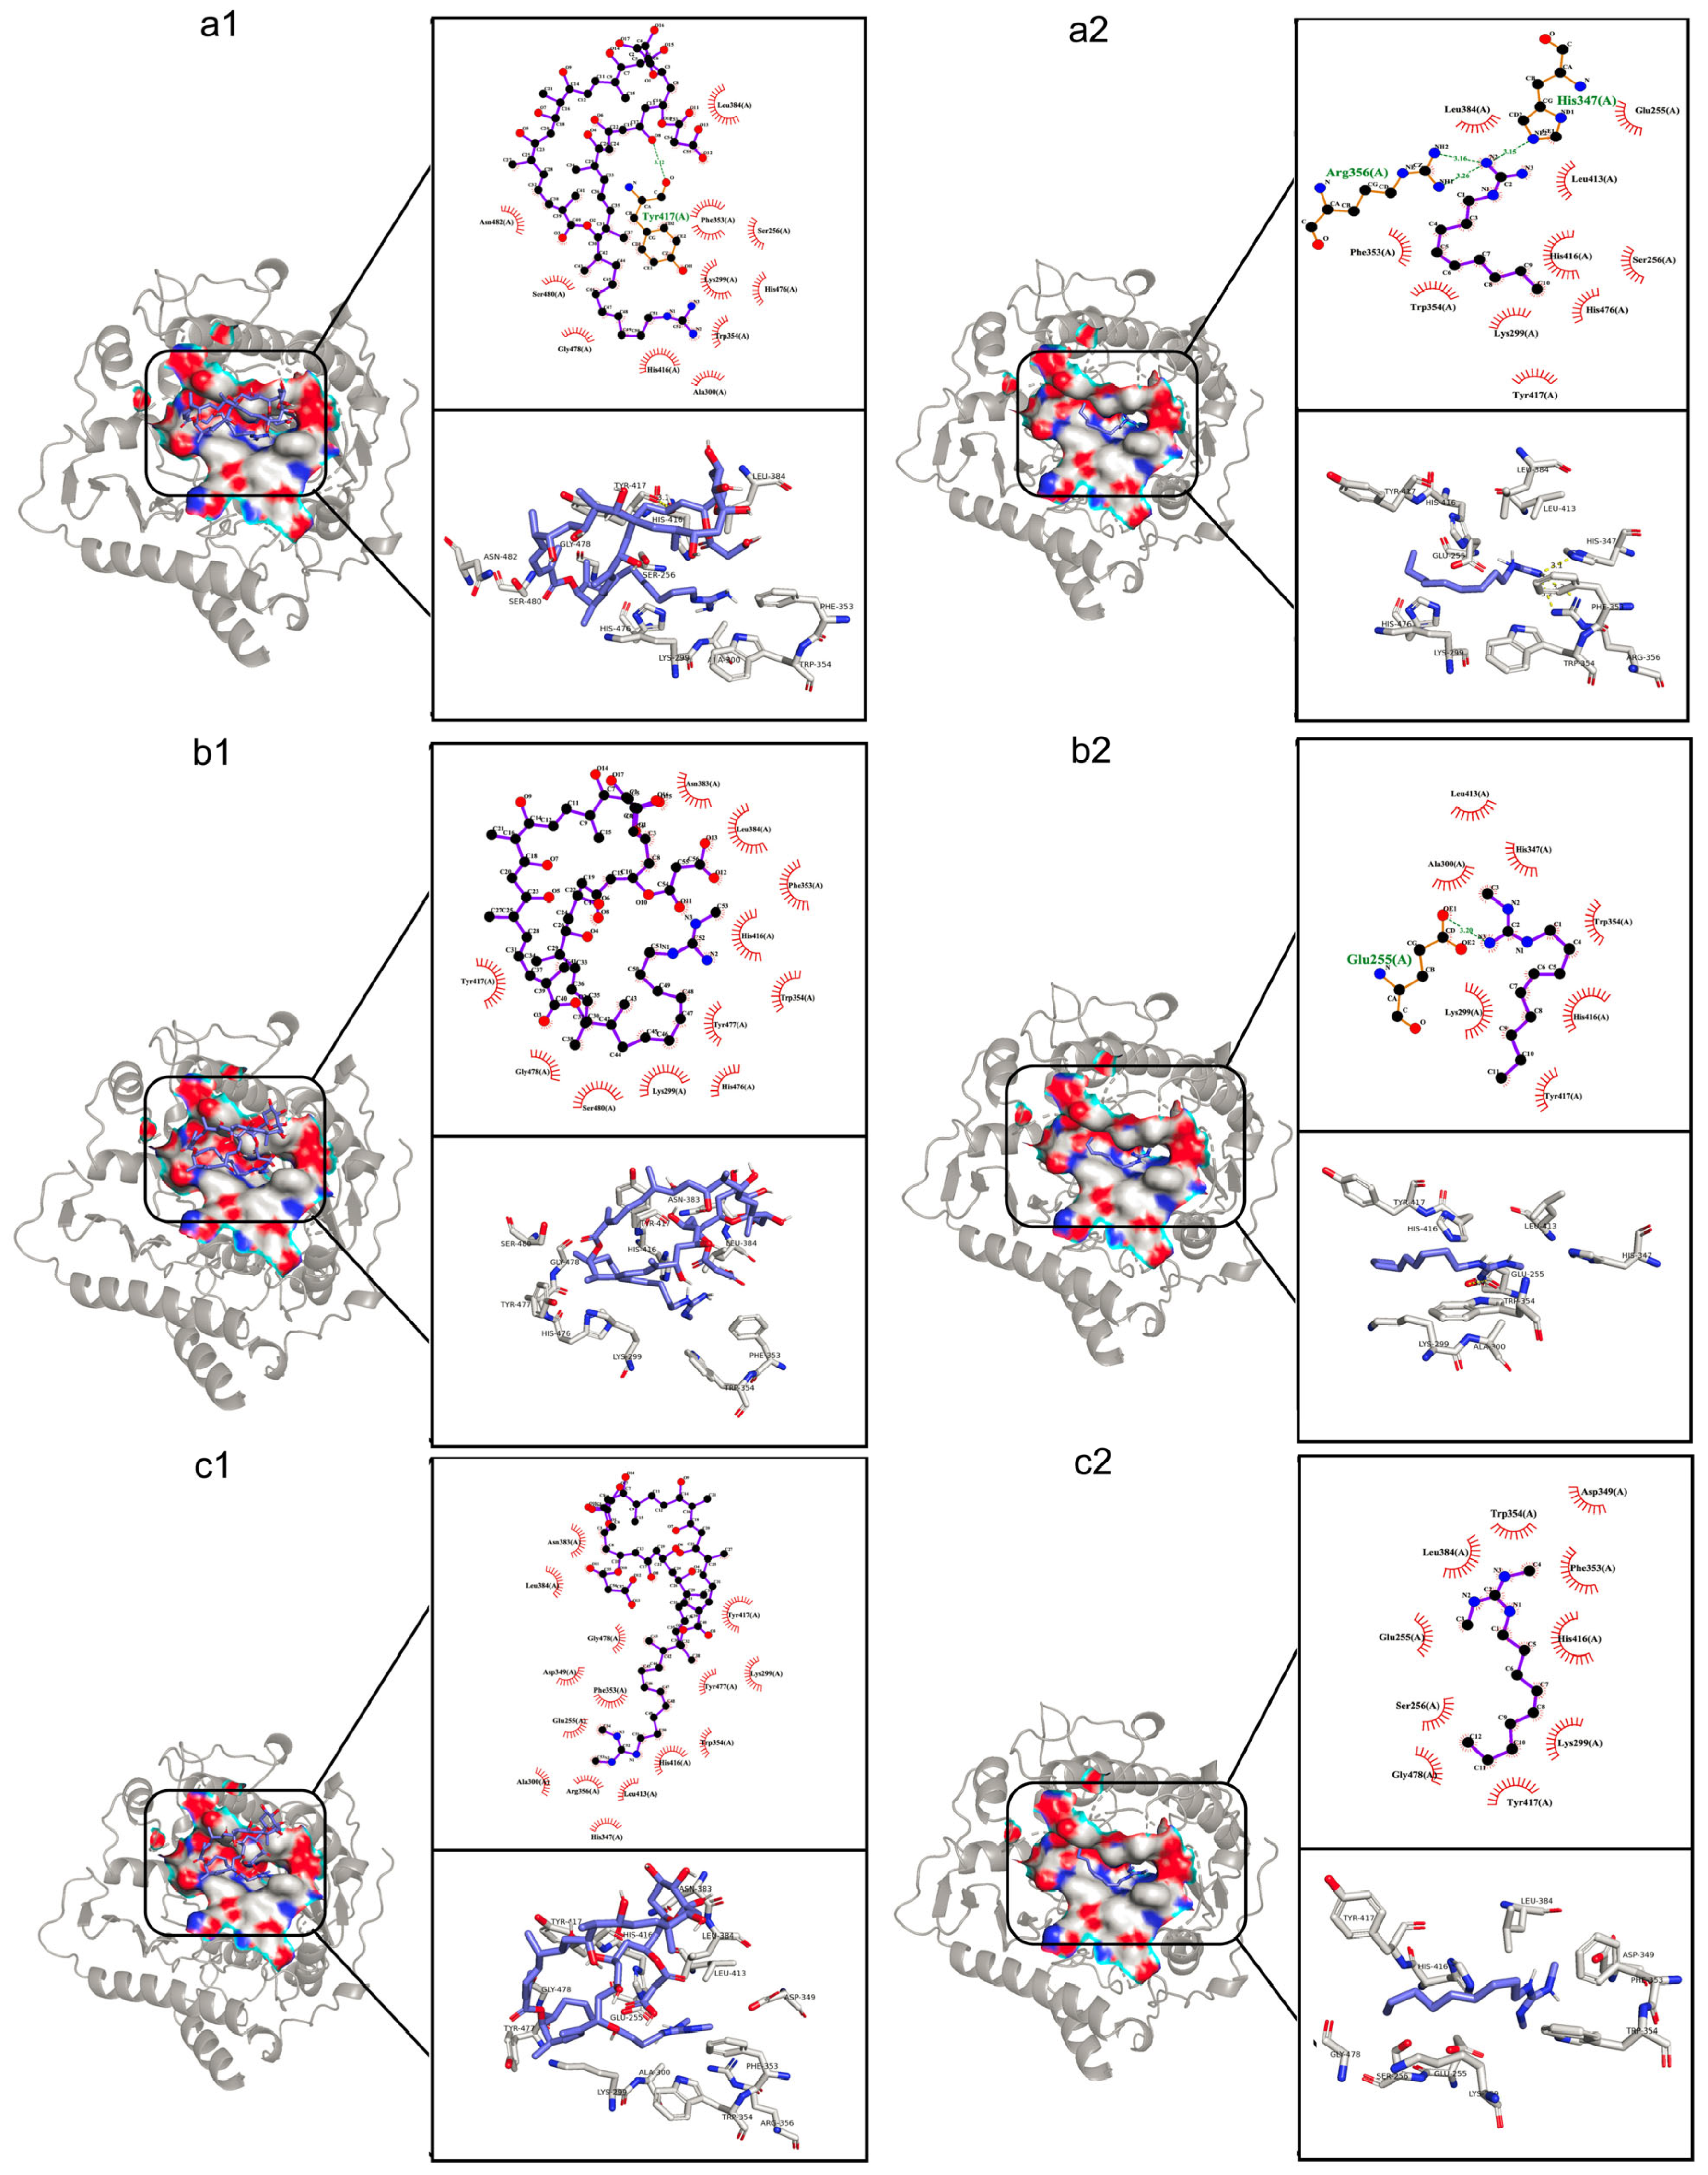
2.5. Binding Site of Azalomycin F to LtaS
3. Materials and Methods
3.1. Materials, Chemicals and Reagents
3.2. Influences of Azalomycin F on the LTA Release of S. aureus
3.3. Transmission Electron Microscope (TEM)
3.4. Proteome
3.5. Targeted Protein Quantification
3.6. Influence of Azalomycin F on the LTA Synthesis from LtaS
3.7. Interaction of Azalomycin F with the eLtaS or LtaS of S. aureus
3.7.1. Fluorescence Spectroscopy
3.7.2. Synchronous Fluorescence Spectra
3.8. Mass Spectrometry
3.9. Molecular Docking
3.10. Statistical Analysis
4. Conclusions
Supplementary Materials
Author Contributions
Funding
Institutional Review Board Statement
Informed Consent Statement
Data Availability Statement
Acknowledgments
Conflicts of Interest
References
- MacLean, R.C.; Millan, A.S. The evolution of antibiotic resistance. Science 2019, 365, 1082–1083. [Google Scholar] [CrossRef]
- Antimicrobial Resistance Collaborators. Global burden of bacterial antimicrobial resistance in 2019: A systematic analysis. Lancet 2022, 399, 629–655. [Google Scholar] [CrossRef] [PubMed]
- Tong, S.Y.C.; Davis, J.S.; Eichenberger, E.; Holland, T.L.; Fowler, V.G. Staphylococcus aureus infections: Epidemiology, pathophysiology, clinical manifestations, and management. Clin. Microbiol. Rev. 2015, 28, 603–661. [Google Scholar] [CrossRef]
- Laxminarayan, R.; Sridhar, D.; Blaser, M.; Wang, M.; Woolhouse, M. Achieving global targets for antimicrobial resistance. Science 2016, 353, 874–875. [Google Scholar] [CrossRef] [PubMed]
- Kurosu, M.; Siricilla, S.; Mitachi, K. Advances in MRSA drug discovery: Where are we and where do we need to be? Expert Opin. Drug Dis. 2013, 8, 1095–1116. [Google Scholar] [CrossRef]
- Leitão, J.H. Microbial virulence factors. Int. J. Mol. Sci. 2020, 21, 5320. [Google Scholar] [CrossRef] [PubMed]
- Xia, G.; Kohler, T.; Peschel, A. The wall teichoic acid and lipoteichoic acid polymers of Staphylococcus aureus. Int. J. Med. Microbiol. 2010, 300, 148–154. [Google Scholar] [CrossRef]
- Vickery, C.R.; Wood, B.M.; Morris, H.G.; Losick, R.; Walker, S. Reconstitution of Staphylococcus aureus lipoteichoic acid synthase activity identifies Congo red as a selective inhibitor. J. Am. Chem. Soc. 2018, 140, 876–879. [Google Scholar] [CrossRef]
- Chee Wezen, X.; Chandran, A.; Eapen, R.S.; Waters, E.; Bricio-Moreno, L.; Tosi, T.; Dolan, S.; Millership, C.; Kadioglu, A.; Gründling, A.; et al. Structure-based discovery of lipoteichoic acid synthase inhibitors. J. Chem. Inf. Model. 2022, 62, 2586–2599. [Google Scholar] [CrossRef]
- Richter, S.G.; Elli, D.; Kim, H.K.; Hendrickx, A.P.A.; Sorg, J.A.; Schneewind, O.; Missiakas, D. Small molecule inhibitor of lipoteichoic acid synthesis is an antibiotic for Gram-positive bacteria. Proc. Natl. Acad. Sci. USA 2013, 110, 3531–3536. [Google Scholar] [CrossRef]
- Douglas, E.J.A.; Marshall, B.; Alghamadi, A.; Joseph, E.A.; Duggan, S.; Vittorio, S.; De Luca, L.; Serpi, M.; Laabei, M. Improved antibacterial activity of 1,3,4-oxadiazole-based compounds that restrict Staphylococcus aureus growth independent of LtaS function. ACS Infect. Dis. 2023, 9, 2141–2159. [Google Scholar] [CrossRef] [PubMed]
- Muscato, J.D.; Morris, H.G.; Mychack, A.; Rajagopal, M.; Baidin, V.; Hesser, A.R.; Lee, W.; İnecik, K.; Wilson, L.J.; Kraml, C.M.; et al. Rapid Inhibitor Discovery by Exploiting Synthetic Lethality. J. Am. Chem. Soc. 2022, 144, 3696–3705. [Google Scholar] [CrossRef] [PubMed]
- Song, X.; Yuan, G.; Li, P.; Cao, S. Guanidine-containing polyhydroxyl macrolides: Chemistry, biology, and structure-activity relationship. Molecules 2019, 24, 3913. [Google Scholar] [CrossRef] [PubMed]
- Yuan, G.; Lin, H.; Wang, C.; Hong, K.; Liu, Y.; Li, J. 1H and 13C assignments of two new macrocyclic lactones isolated from Streptomyces sp. 211726 and revised assignments of azalomycins F3a, F4a and F5a. Magn. Reson. Chem. 2011, 49, 30–37. [Google Scholar] [CrossRef] [PubMed]
- Chandra, A.; Nair, M.G. Azalomycin F complex from Streptomyces hygroscopicus, MSU/MN-4-75B. J. Antibiot. 1995, 48, 896–898. [Google Scholar] [CrossRef]
- Yuan, G.; Li, P.; Pan, W.; Pang, H.; Chen, S. The relative configurations of azalomycins F5a, F4a and F3a. J. Mol. Struct. 2013, 1035, 31–37. [Google Scholar] [CrossRef]
- Hu, Y.; Wang, M.; Wu, C.; Tan, Y.; Li, J.; Hao, X.; Duan, Y.; Guan, Y.; Shang, X.; Wang, Y.; et al. Identification and proposed relative and absolute configurations of niphimycins C-E from the marine-derived Streptomyces sp. IMB7-145 by genomic analysis. J. Nat. Prod. 2018, 81, 178–187. [Google Scholar] [CrossRef]
- Lee, S.R.; Guo, H.; Yu, J.S.; Park, M.; Dahse, H.; Jung, W.H.; Beemelmanns, C.; Kim, K.H. Revised structural assignment of azalomycins based on genomic and chemical analysis. Org. Chem. Front. 2021, 8, 4791–4798. [Google Scholar] [CrossRef]
- Yuan, G.; Xu, L.; Xu, X.; Li, P.; Zhong, Q.; Xia, H.; Hu, Y.; Li, P.; Song, X.; Li, J.; et al. Azalomycin F5a, a polyhydroxy macrolide binding to the polar head of phospholipid and targeting to lipoteichoic acid to kill methicillin-resistant Staphylococcus aureus. Biomed. Pharmacother. 2019, 109, 1940–1950. [Google Scholar] [CrossRef]
- Lotz, S.; Starke, A.; Ziemann, C.; Morath, S.; Hartung, T.; Solbach, W.; Laskay, T. β-lactam antibiotic-induced release of lipoteichoic acid from Staphylococcus aureus leads to activation of neutrophil granulocytes. Ann. Clin. Microbiol. Antimicrob. 2006, 5, 15. [Google Scholar] [CrossRef]
- Desai, H.; Wong, R.; Ahmed, K. A novel way of treating multidrug-resistant enterococci. N. Am. J. Med. Sci. 2016, 8, 229–231. [Google Scholar] [CrossRef]
- Yang, X.; Huang, E.; Yousef, A.E. Brevibacillin, a cationic lipopeptide that binds to lipoteichoic acid and subsequently disrupts cytoplasmic membrane of Staphylococcus aureus. Microbiol. Res. 2017, 195, 18–23. [Google Scholar] [CrossRef]
- Periti, P.; Mazzei, T. Antibiotic-induced release of bacterial cell wall components in the pathogenesis of sepsis and septic shock: A review. J. Chemother. 1998, 10, 427–448. [Google Scholar] [CrossRef]
- Neuhaus, F.C.; Baddiley, J. A continuum of anionic charge: Structures and functions of d-alanyl-teichoic acids in gram-positive bacteria. Microbiol. Mol. Biol. Rev. 2003, 67, 686–723. [Google Scholar] [CrossRef]
- Karatsa-Dodgson, M.; Wormann, M.E.; Grundling, A. In vitro analysis of the Staphylococcus aureus lipoteichoic acid synthase enzyme using fluorescently labeled lipids. J. Bacteriol. 2010, 192, 5341–5349. [Google Scholar] [CrossRef]
- Breil, C.; Abert Vian, M.; Zemb, T.; Kunz, W.; Chemat, F. “Bligh and Dyer” and Folch methods for solid-liquid-liquid extraction of lipids from microorganisms. Comprehension of solvatation mechanisms and towards substitution with alternative solvents. Int. J. Mol. Sci. 2017, 18, 708. [Google Scholar] [CrossRef]
- Xi, L.; Wang, Y.; He, Q.; Zhang, Q.; Du, L. Interaction between Pin1 and its natural product inhibitor epigallocatechin-3-gallate by spectroscopy and molecular dynamics simulations. Spectrochim. Acta A Mol. Biomol. Spectrosc. 2016, 169, 134–143. [Google Scholar] [CrossRef] [PubMed]
- Du, W.; Teng, T.; Zhou, C.C.; Xi, L.; Wang, J.Z. Spectroscopic studies on the interaction of bovine serum albumin with ginkgolic acid: Binding characteristics and structural analysis. J. Lumin. 2012, 132, 1207–1214. [Google Scholar] [CrossRef]
- Liang, L.; Subirade, M. Beta-lactoglobulin/folic acid complexes: Formation, characterization, and biological implication. J. Phys. Chem. B 2010, 114, 6707–6712. [Google Scholar] [CrossRef]
- Eftink, M.R.; Ghiron, C.A. Fluorescence quenching studies with proteins. Anal. Biochem. 1981, 114, 199–227. [Google Scholar] [CrossRef] [PubMed]
- Sheng, L.; Ding, H.; Wang, Z.; Song, G. Binding of amphiphilic p(DMAEMA79-b-AZOM5) diblock copolymer with bovine serum albumin—A spectroscopic investigation with warfarin and ibuprofen as site markers. J. Mol. Struct. 2010, 979, 152–159. [Google Scholar] [CrossRef]
- Al-Shabib, N.A.; Khan, J.M.; Malik, A.; Alsenaidy, M.A.; Rehman, M.T.; AlAjmi, M.F.; Alsenaidy, A.M.; Husain, F.M.; Khan, R.H. Molecular insight into binding behavior of polyphenol (rutin) with beta lactoglobulin: Spectroscopic, molecular docking and MD simulation studies. J. Mol. Liq. 2018, 269, 511–520. [Google Scholar] [CrossRef]
- Dufour, C.; Dangles, O. Flavonoid-serum albumin complexation: Determination of binding constants and binding sites by fluorescence spectroscopy. Biochim. Biophys. Acta 2005, 1721, 164–173. [Google Scholar] [CrossRef] [PubMed]
- Ross, P.D.; Subramanian, S. Thermodynamics of protein association reactions: Forces contributing to stability. Biochemistry 1981, 20, 3096–3102. [Google Scholar] [CrossRef] [PubMed]
- Ma, R.; Pan, H.; Shen, T.; Li, P.; Chen, Y.; Li, Z.; Di, X.; Wang, S. Interaction of flavonoids from Woodwardia unigemmata with bovine serum albumin (BSA): Application of spectroscopic techniques and molecular modeling methods. Molecules 2017, 22, 1317. [Google Scholar] [CrossRef] [PubMed]
- Zhu, G.F.; Wang, Y.; Liu, J.; Wang, H.; Xi, L.; Du, L.F. Interaction between ginkgolic acid and human serum albumin by spectroscopy and molecular modeling methods. J. Solut. Chem. 2014, 43, 1232–1249. [Google Scholar] [CrossRef]
- Pacheco, M.E.; Bruzzone, L. Synchronous fluorescence spectrometry: Conformational investigation or inner filter effect? J. Lumin. 2013, 137, 138–142. [Google Scholar] [CrossRef]
- Bi, S.; Yan, L.; Pang, B.; Wang, Y. Investigation of three flavonoids binding to bovine serum albumin using molecular fluorescence technique. J. Lumin. 2012, 132, 132–140. [Google Scholar] [CrossRef]
- Zhu, G.F.; Wang, Y.; Xi, L.; Liu, J.; Wang, H.; Du, L.F. Spectroscopy and molecular docking studies on the binding of propyl gallate to human serum albumin. J. Lumin. 2015, 159, 188–196. [Google Scholar] [CrossRef]
- Hu, Y.J.; Liu, Y.; Jiang, W.; Zhao, R.M.; Qu, S.S. Fluorometric investigation of the interaction of bovine serum albumin with surfactants and 6-mercaptopurine. J. Photochem. Photobiol. B 2005, 80, 235–242. [Google Scholar] [CrossRef]
- Arai, M.; Hamano, K. Isolation of three main components, F3, F4 and F5, from azalomycin F-complex. J. Antibiot. 1970, 23, 107–112. [Google Scholar] [CrossRef] [PubMed]
- Lu, D.; Wörmann, M.E.; Zhang, X.; Schneewind, O.; Gründling, A.; Freemont, P.S. Structure-based mechanism of lipoteichoic acid synthesis by Staphylococcus aureus LtaS. Proc. Natl. Acad. Sci. USA 2009, 106, 1584–1589. [Google Scholar] [CrossRef] [PubMed]
- Yuan, G.; Li, P.; Xu, X.; Li, P.; Zhong, Q.; He, S.; Yi, H.; Yi, W.; Guan, Y.; Wen, Z.T. Azalomycin F5a eradicates Staphylococcus aureus biofilm by rapidly penetrating and subsequently inducing cell lysis. Int. J. Mol. Sci. 2020, 21, 862. [Google Scholar] [CrossRef] [PubMed]
- Yuan, G.; Li, P.; Yang, J.; Pang, H.; Pei, Y. Anti-methicillin-resistant Staphylococcus aureus assay of azalomycin F5a and its derivatives. Chin. J. Nat. Med. 2014, 12, 309–313. [Google Scholar] [CrossRef]
- Wang, J.Z.; Ren, S.Y.; Zhu, G.F.; Xi, L.; Han, Y.G.; Luo, Y.; Du, L.F. Hg2+ interference with the structure of tobacco etch virus protease (TEVp) and its implications for biological engineering. J. Mol. Struct. 2013, 1052, 85–92. [Google Scholar] [CrossRef]
- Bojko, B.; Sulkowska, A.; Maciazek-Jurczyk, M.; Rownicka, J.; Sulkowski, W.W. The influence of dietary habits and pathological conditions on the binding of theophylline to serum albumin. J. Pharm. Biomed. Anal. 2010, 52, 384–390. [Google Scholar] [CrossRef] [PubMed]
- Ding, F.; Liu, W.; Zhang, X.; Wu, L.J.; Zhang, L.; Sun, Y. Identification of pyrazosulfuron-ethyl binding affinity and binding site subdomain IIA in human serum albumin by spectroscopic methods. Spectrochim. Acta A Mol. Biomol. Spectrosc. 2010, 75, 1088–1094. [Google Scholar] [CrossRef] [PubMed]
- Xu, Y.; Wang, J.Z.; Li, J.S.; Huang, X.H.; Xing, Z.H.; Du, L.F. Heat treatment-induced functional and structural aspects of Mus musculus TAp63γ. J. Mol. Struct. 2011, 996, 42–47. [Google Scholar] [CrossRef]
- DeLano, W.L. Pymol: An open-source molecular graphics tool. CCP4 Newsl. Protein Crystallogr. 2002, 40, 82–92. [Google Scholar]
- Gan, J.H.; Liu, J.X.; Liu, Y.; Chen, S.W.; Dai, W.T.; Xiao, Z.X.; Cao, Y. DrugRep: An automatic virtual screening server for drug repurposing. Acta Pharmacol. Sin. 2023, 44, 888–896. [Google Scholar] [CrossRef]
- Morris, G.M.; Huey, R.; Lindstrom, W.; Sanner, M.F.; Belew, R.K.; Goodsell, D.S.; Olson, A.J. AutoDock4 and AutoDockTools4: Automated docking with selective receptor flexibility. J. Comput. Chem. 2009, 30, 2785–2791. [Google Scholar] [CrossRef] [PubMed]
- Wallace, A.C.; Laskowski, R.A.; Thornton, J.M. LIGPLOT: A program to generate schematic diagrams of protein-ligand interactions. Protein Eng. 1995, 8, 127–134. [Google Scholar] [CrossRef] [PubMed]


| System b | Temperature (°C) | Ksv (×104 L·mol−1) | Kq (×1012 L·mol−1·s−1) | Ka (×104 L·mol−1) | n | ΔH (KJ·mol−1) | ΔS (KJ·mol−1·k−1) | ΔG (KJ·mol−1) | nH |
|---|---|---|---|---|---|---|---|---|---|
| (A) | 25 | 5.358 | 5.358 | 4.660 | 1.019 | 31.123 | 0.114 | −2.803 | /c |
| 35 | 3.751 | 3.751 | 4.543 | 0.918 | 31.123 | 0.114 | −3.941 | / | |
| (B) | 25 | 4.091 | 4.091 | 9.465 | 0.753 | −48.796 | −0.145 | −5.568 | / |
| 35 | 3.474 | 3.474 | 4.993 | 0.898 | −48.796 | −0.145 | −4.118 | / | |
| (C) | 25 | 4.881 | 4.881 | 11.495 | 0.748 | −58.010 | −0.174 | −6.050 | / |
| 35 | 3.100 | 3.100 | 5.375 | 0.842 | −58.010 | −0.174 | −4.306 | / | |
| (D) | 25 | 0.663 | 0.663 | 4.385 | 0.558 | 23.418 | 0.091 | −3.662 | 0.503 |
| 35 | 0.816 | 0.816 | 5.960 | 0.531 | 23.418 | 0.091 | −4.571 | 0.438 | |
| (E) | 25 | 0.531 | 0.531 | 1.366 | 0.773 | 11.347 | 0.041 | −0.772 | 0.503 |
| 35 | 0.546 | 0.546 | 1.585 | 0.755 | 11.347 | 0.041 | −1.179 | 0.563 |
Disclaimer/Publisher’s Note: The statements, opinions and data contained in all publications are solely those of the individual author(s) and contributor(s) and not of MDPI and/or the editor(s). MDPI and/or the editor(s) disclaim responsibility for any injury to people or property resulting from any ideas, methods, instructions or products referred to in the content. |
© 2024 by the authors. Licensee MDPI, Basel, Switzerland. This article is an open access article distributed under the terms and conditions of the Creative Commons Attribution (CC BY) license (https://creativecommons.org/licenses/by/4.0/).
Share and Cite
Luo, Z.; Li, P.; Zhang, D.; Zhu, J.; Wang, W.; Zhao, W.; Li, P.; Yuan, G. A Novel Antimicrobial Mechanism of Azalomycin F Acting on Lipoteichoic Acid Synthase and Cell Envelope. Molecules 2024, 29, 856. https://doi.org/10.3390/molecules29040856
Luo Z, Li P, Zhang D, Zhu J, Wang W, Zhao W, Li P, Yuan G. A Novel Antimicrobial Mechanism of Azalomycin F Acting on Lipoteichoic Acid Synthase and Cell Envelope. Molecules. 2024; 29(4):856. https://doi.org/10.3390/molecules29040856
Chicago/Turabian StyleLuo, Zilong, Pingyi Li, Duoduo Zhang, Jianping Zhu, Wan Wang, Wenjia Zhao, Peibo Li, and Ganjun Yuan. 2024. "A Novel Antimicrobial Mechanism of Azalomycin F Acting on Lipoteichoic Acid Synthase and Cell Envelope" Molecules 29, no. 4: 856. https://doi.org/10.3390/molecules29040856