


Magnesium Ion Gated Ion Rejection through Carboxylated Graphene Oxide Nanopore: A Theoretical Study

Abstract
:
1. Introduction
2. Results and Discussion
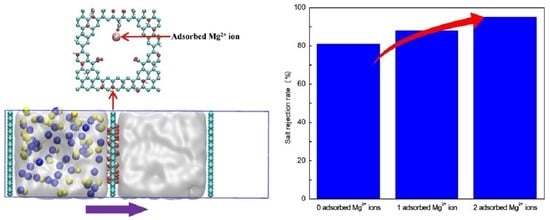
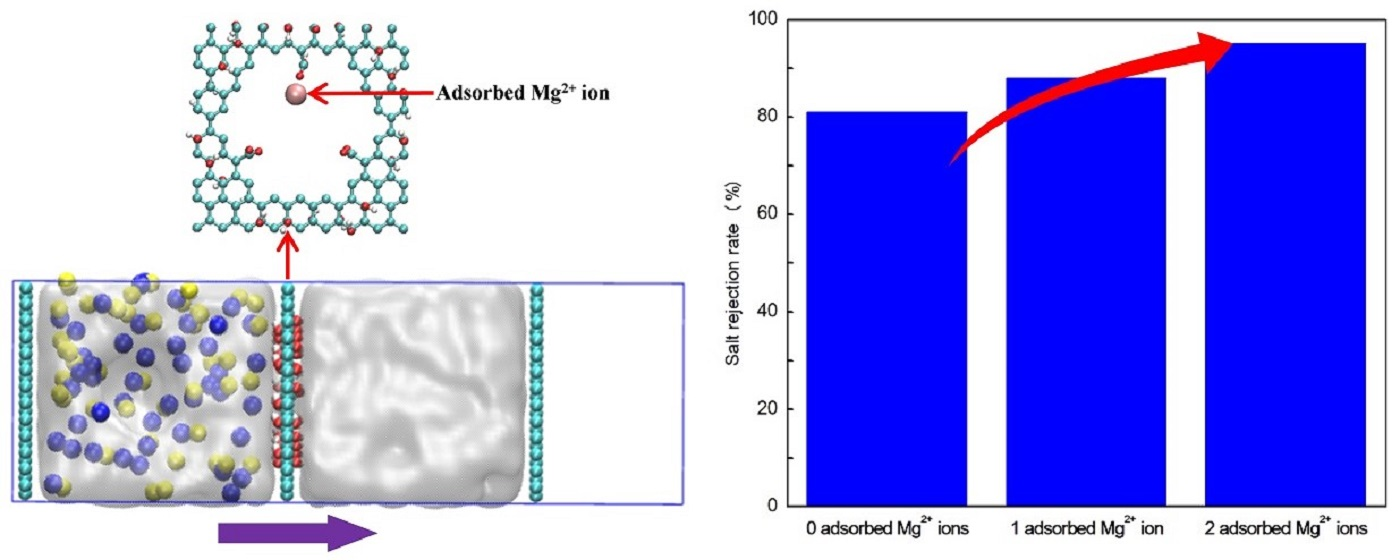
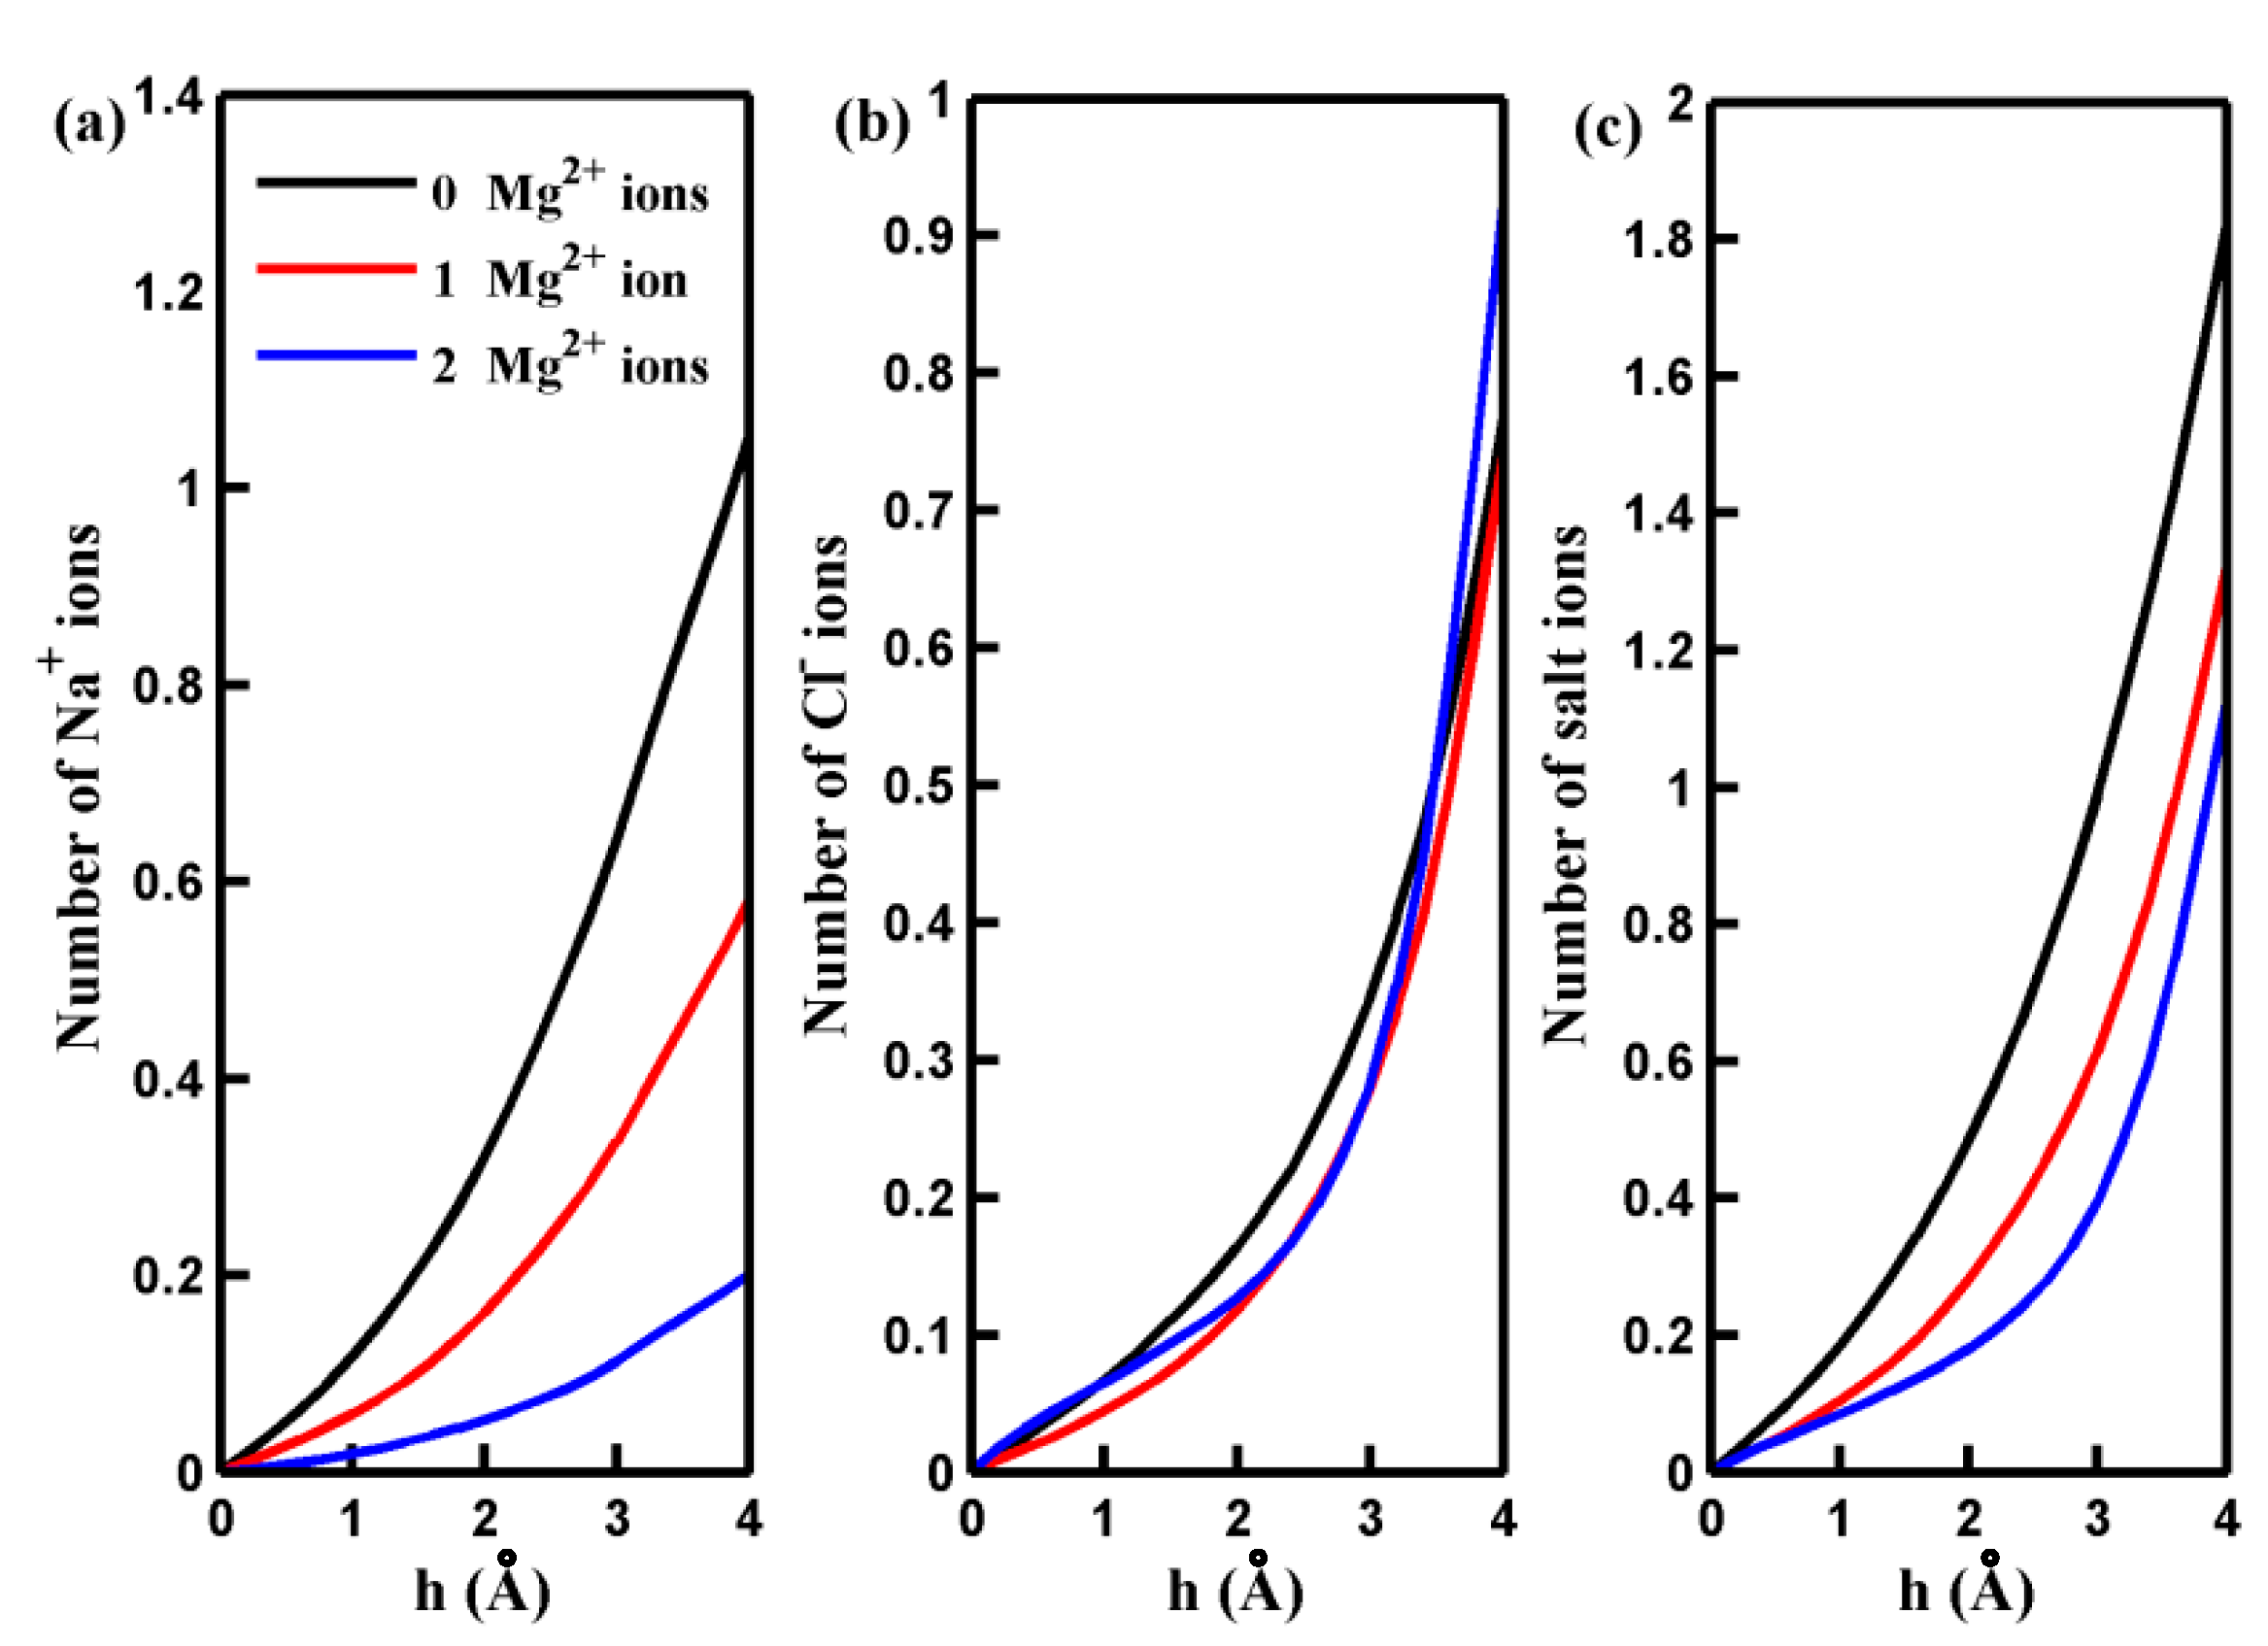
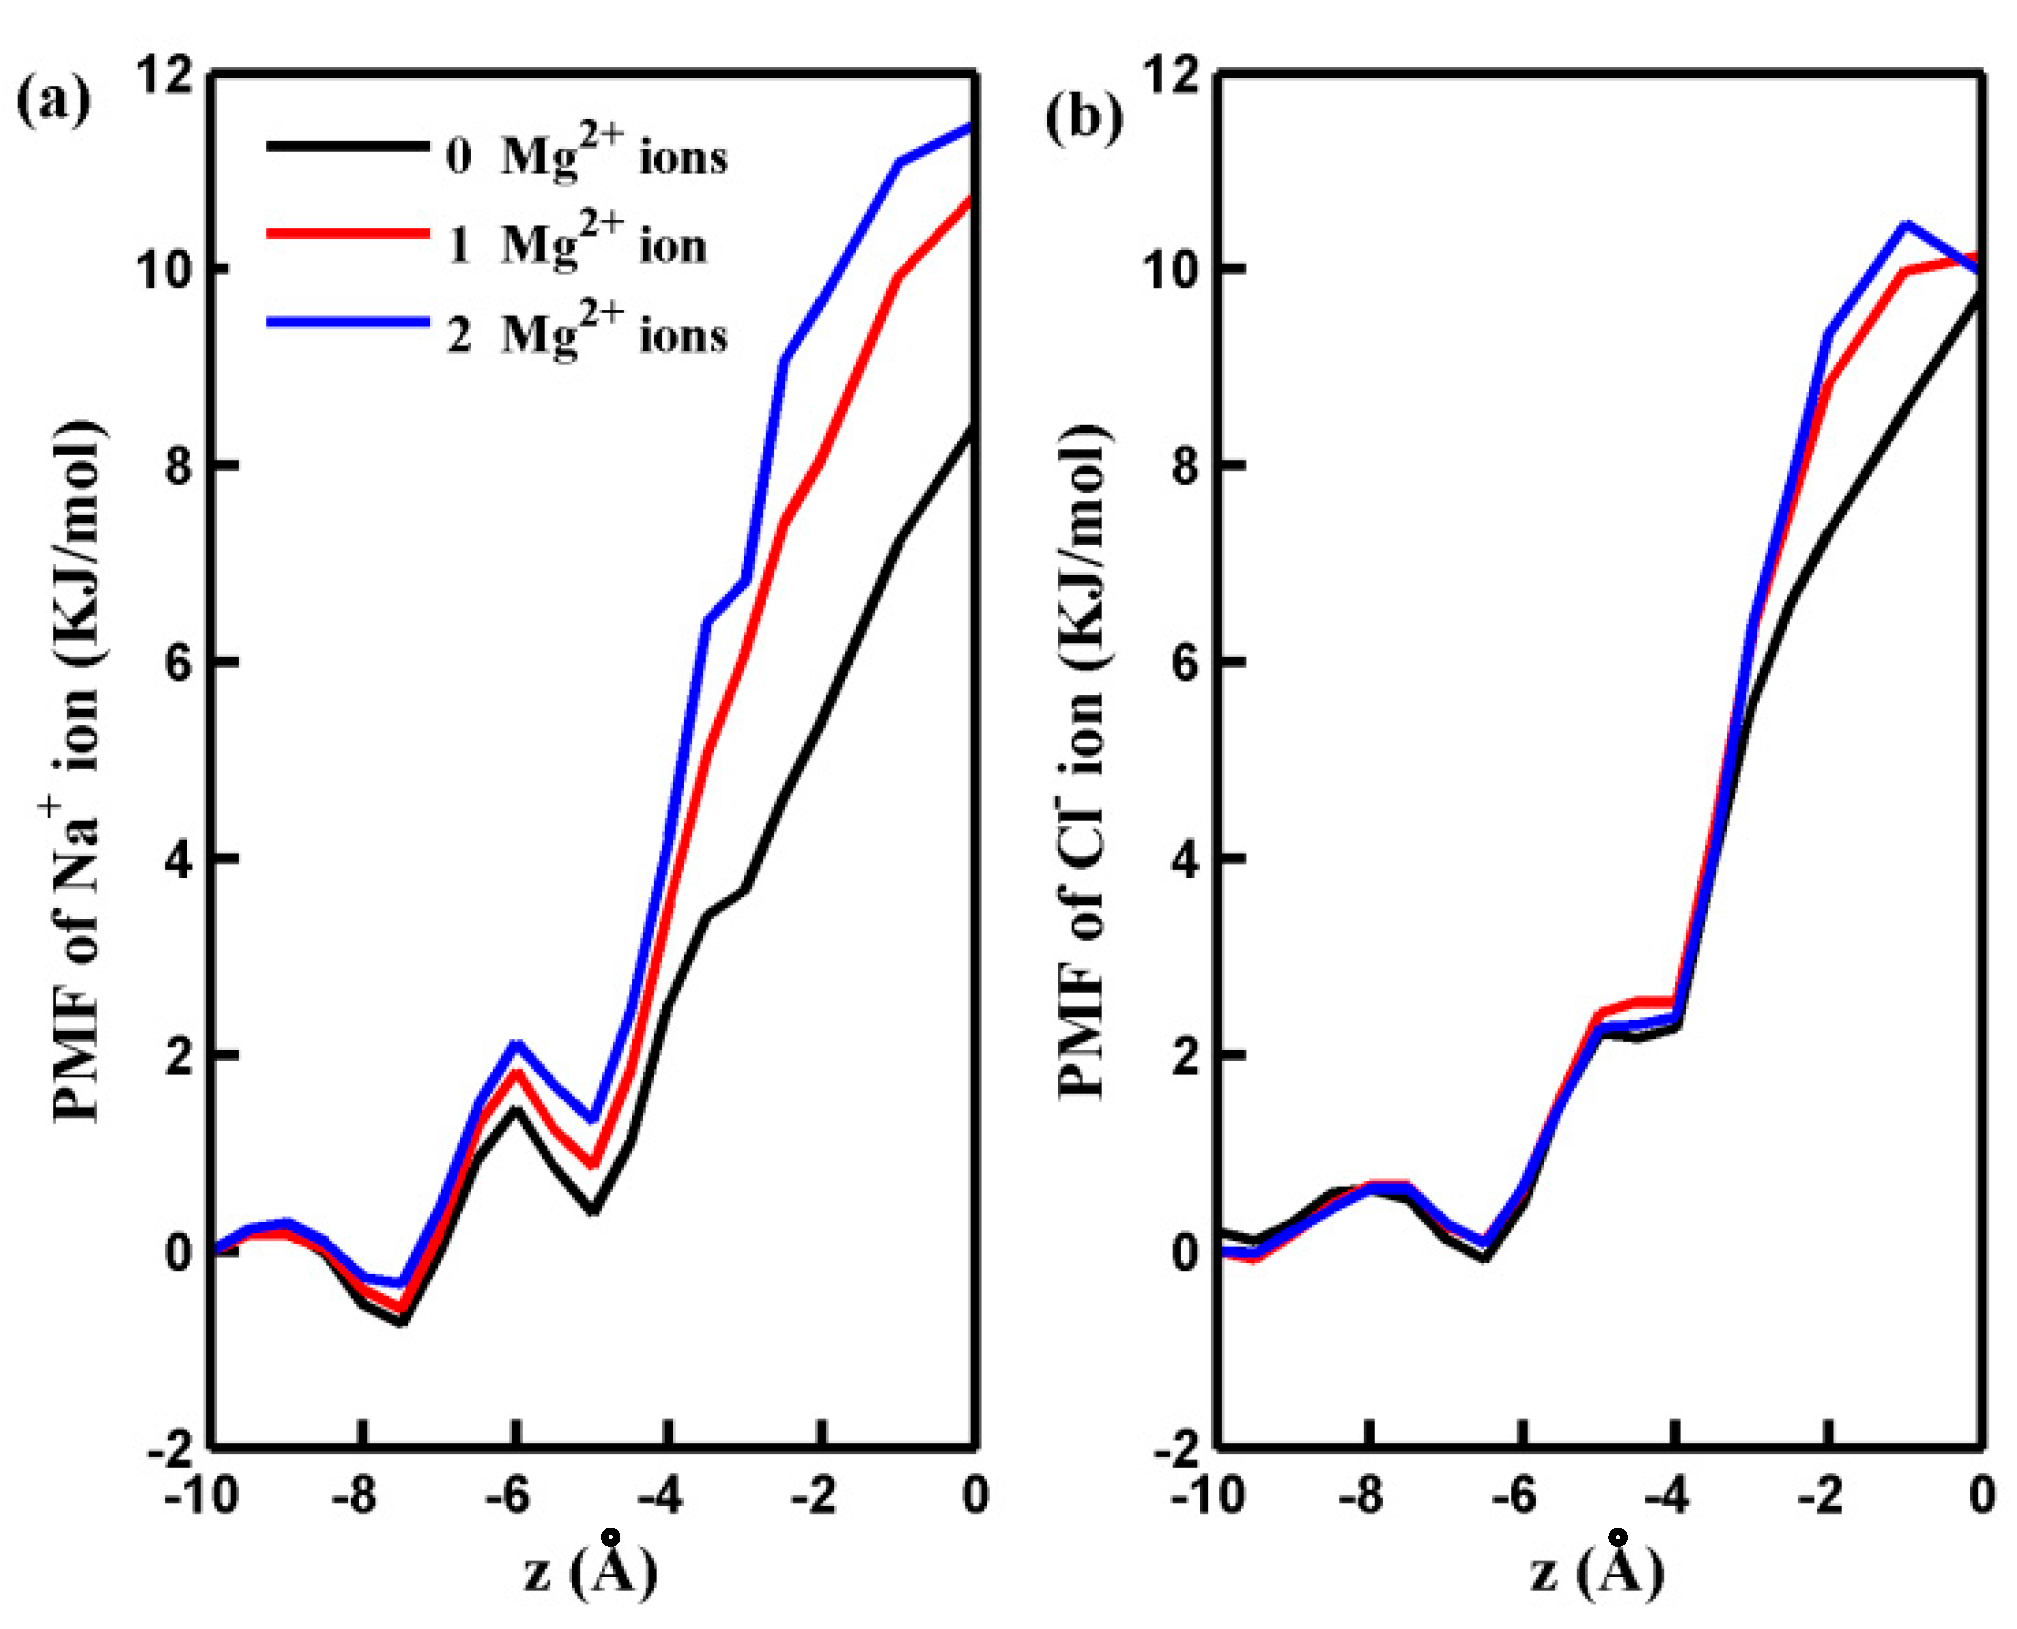
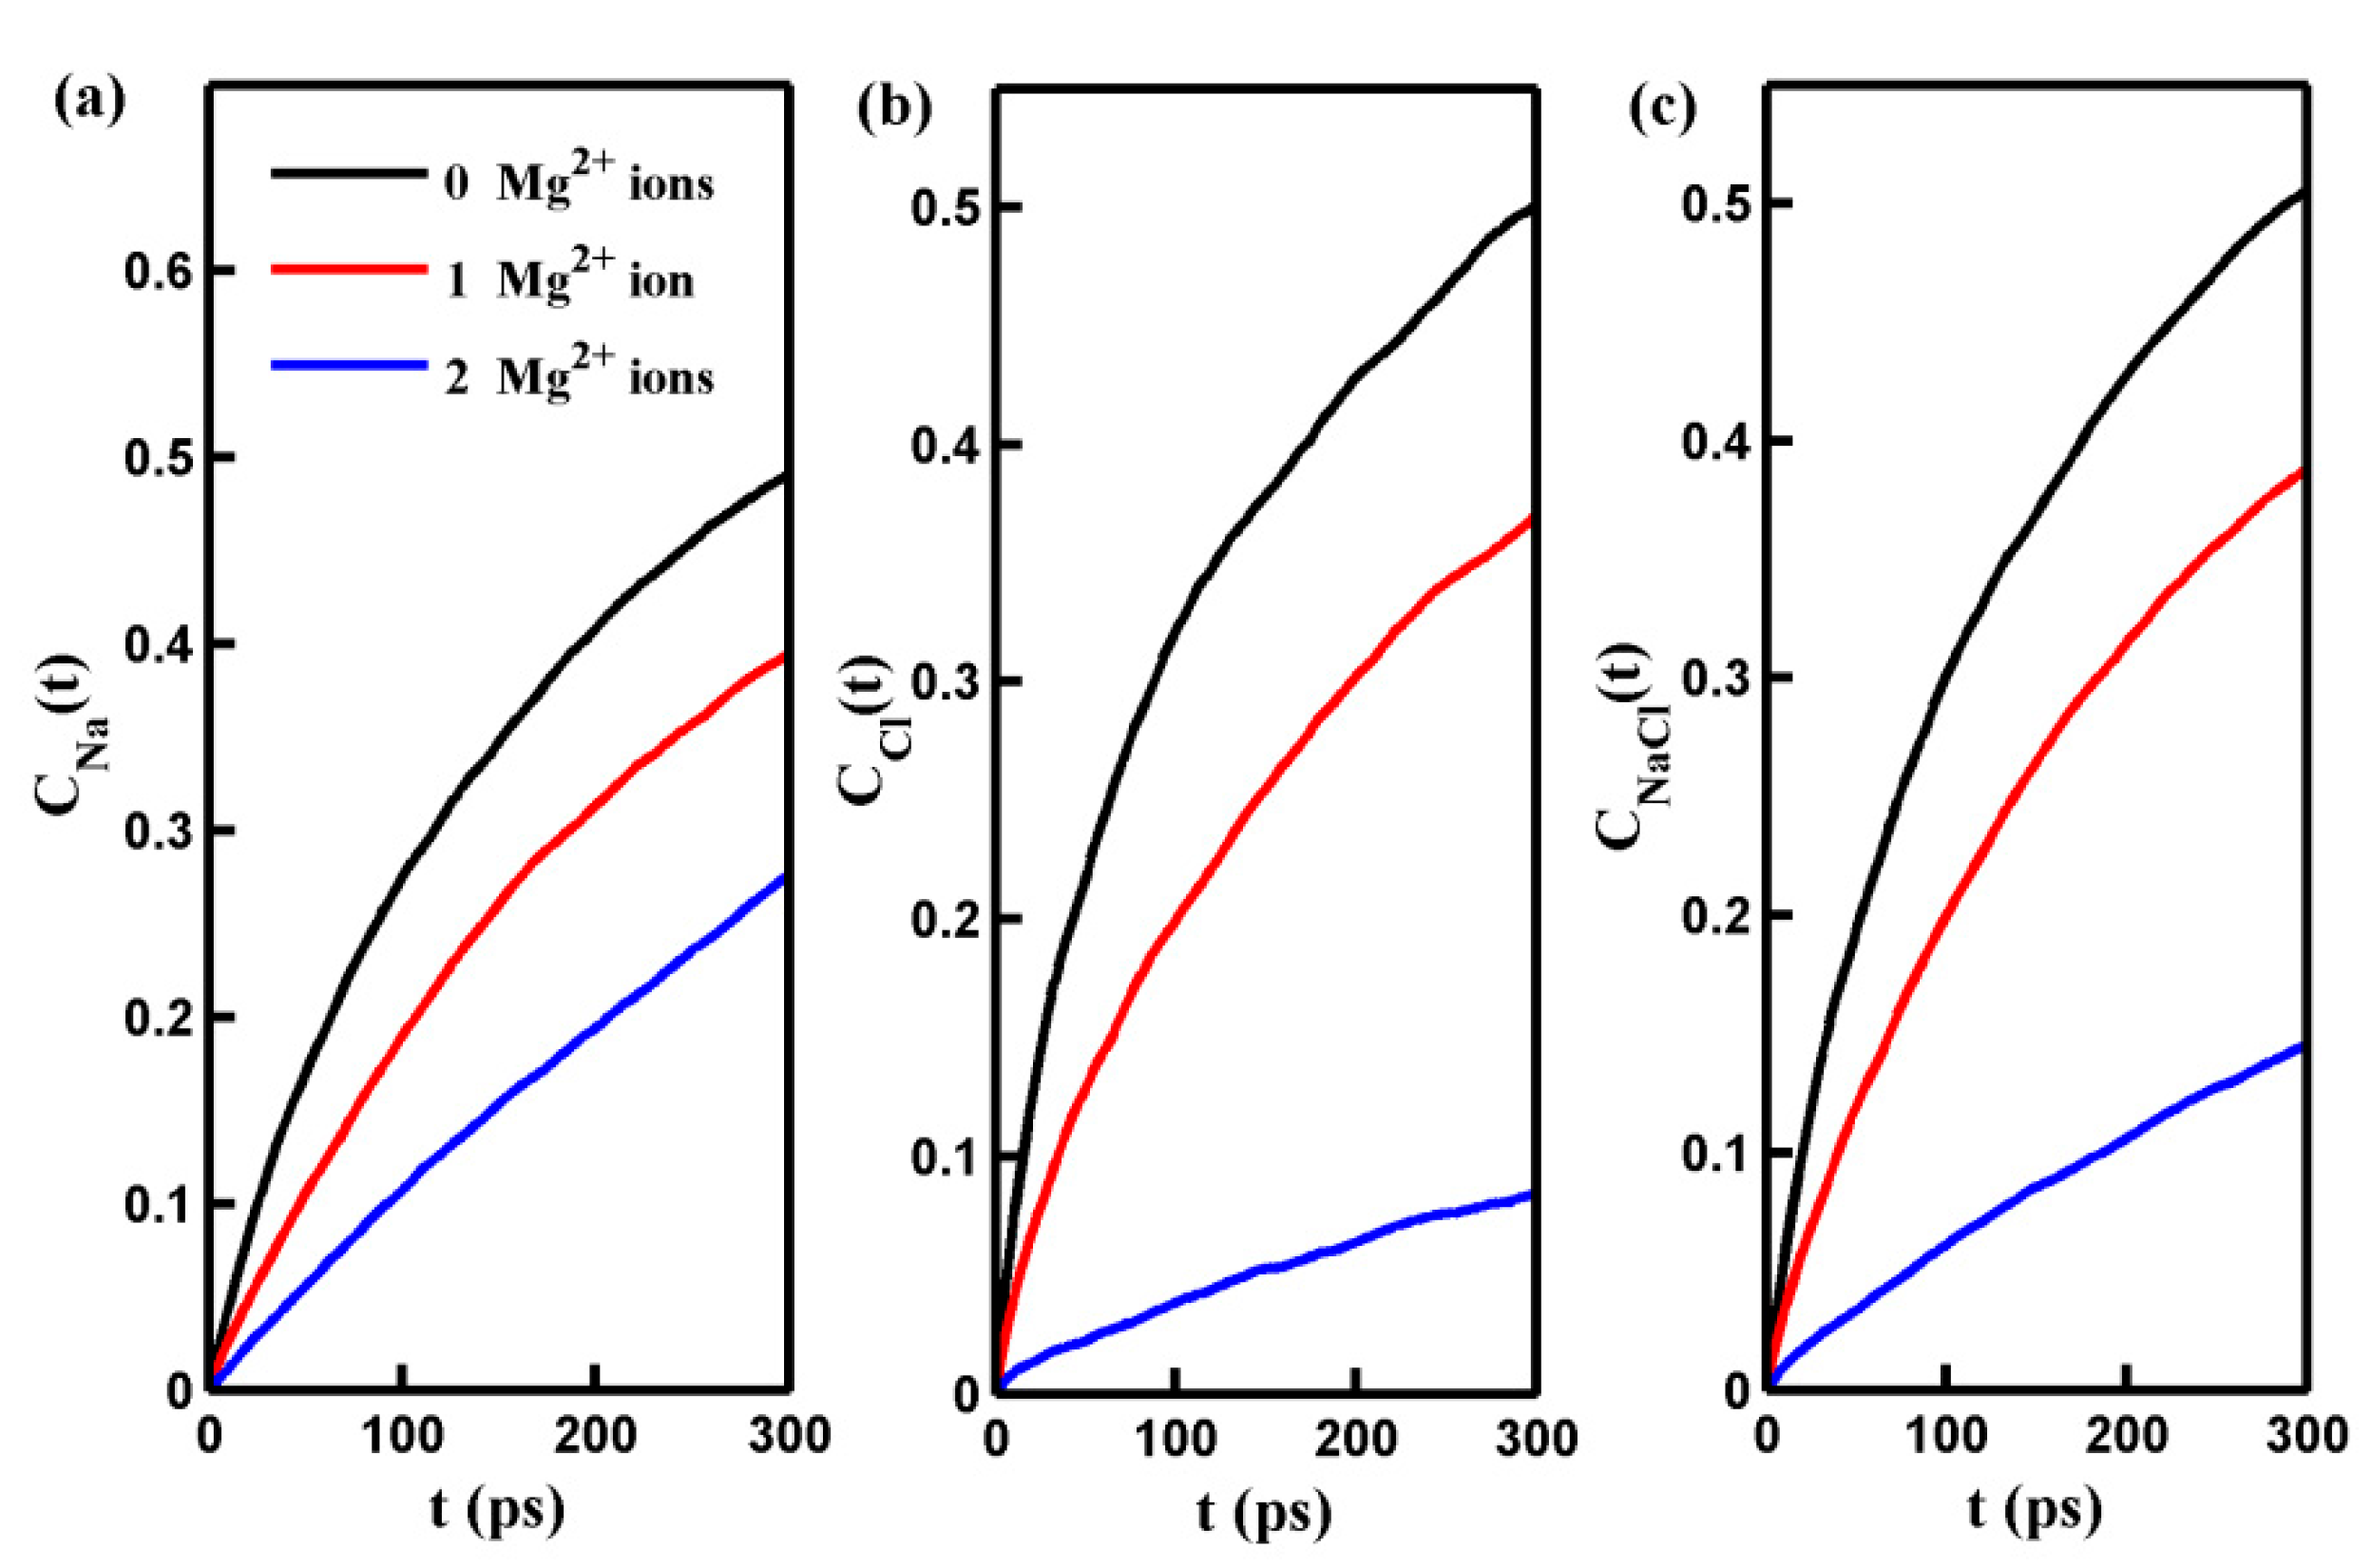
2.1. Salt Rejection Rate
SRNaCl = (1 − nNaCl/NNaCl)
CNaCl(t) = 〈HNaCl(t)HNaCl(0)〉/〈HNaCl(0)2〉
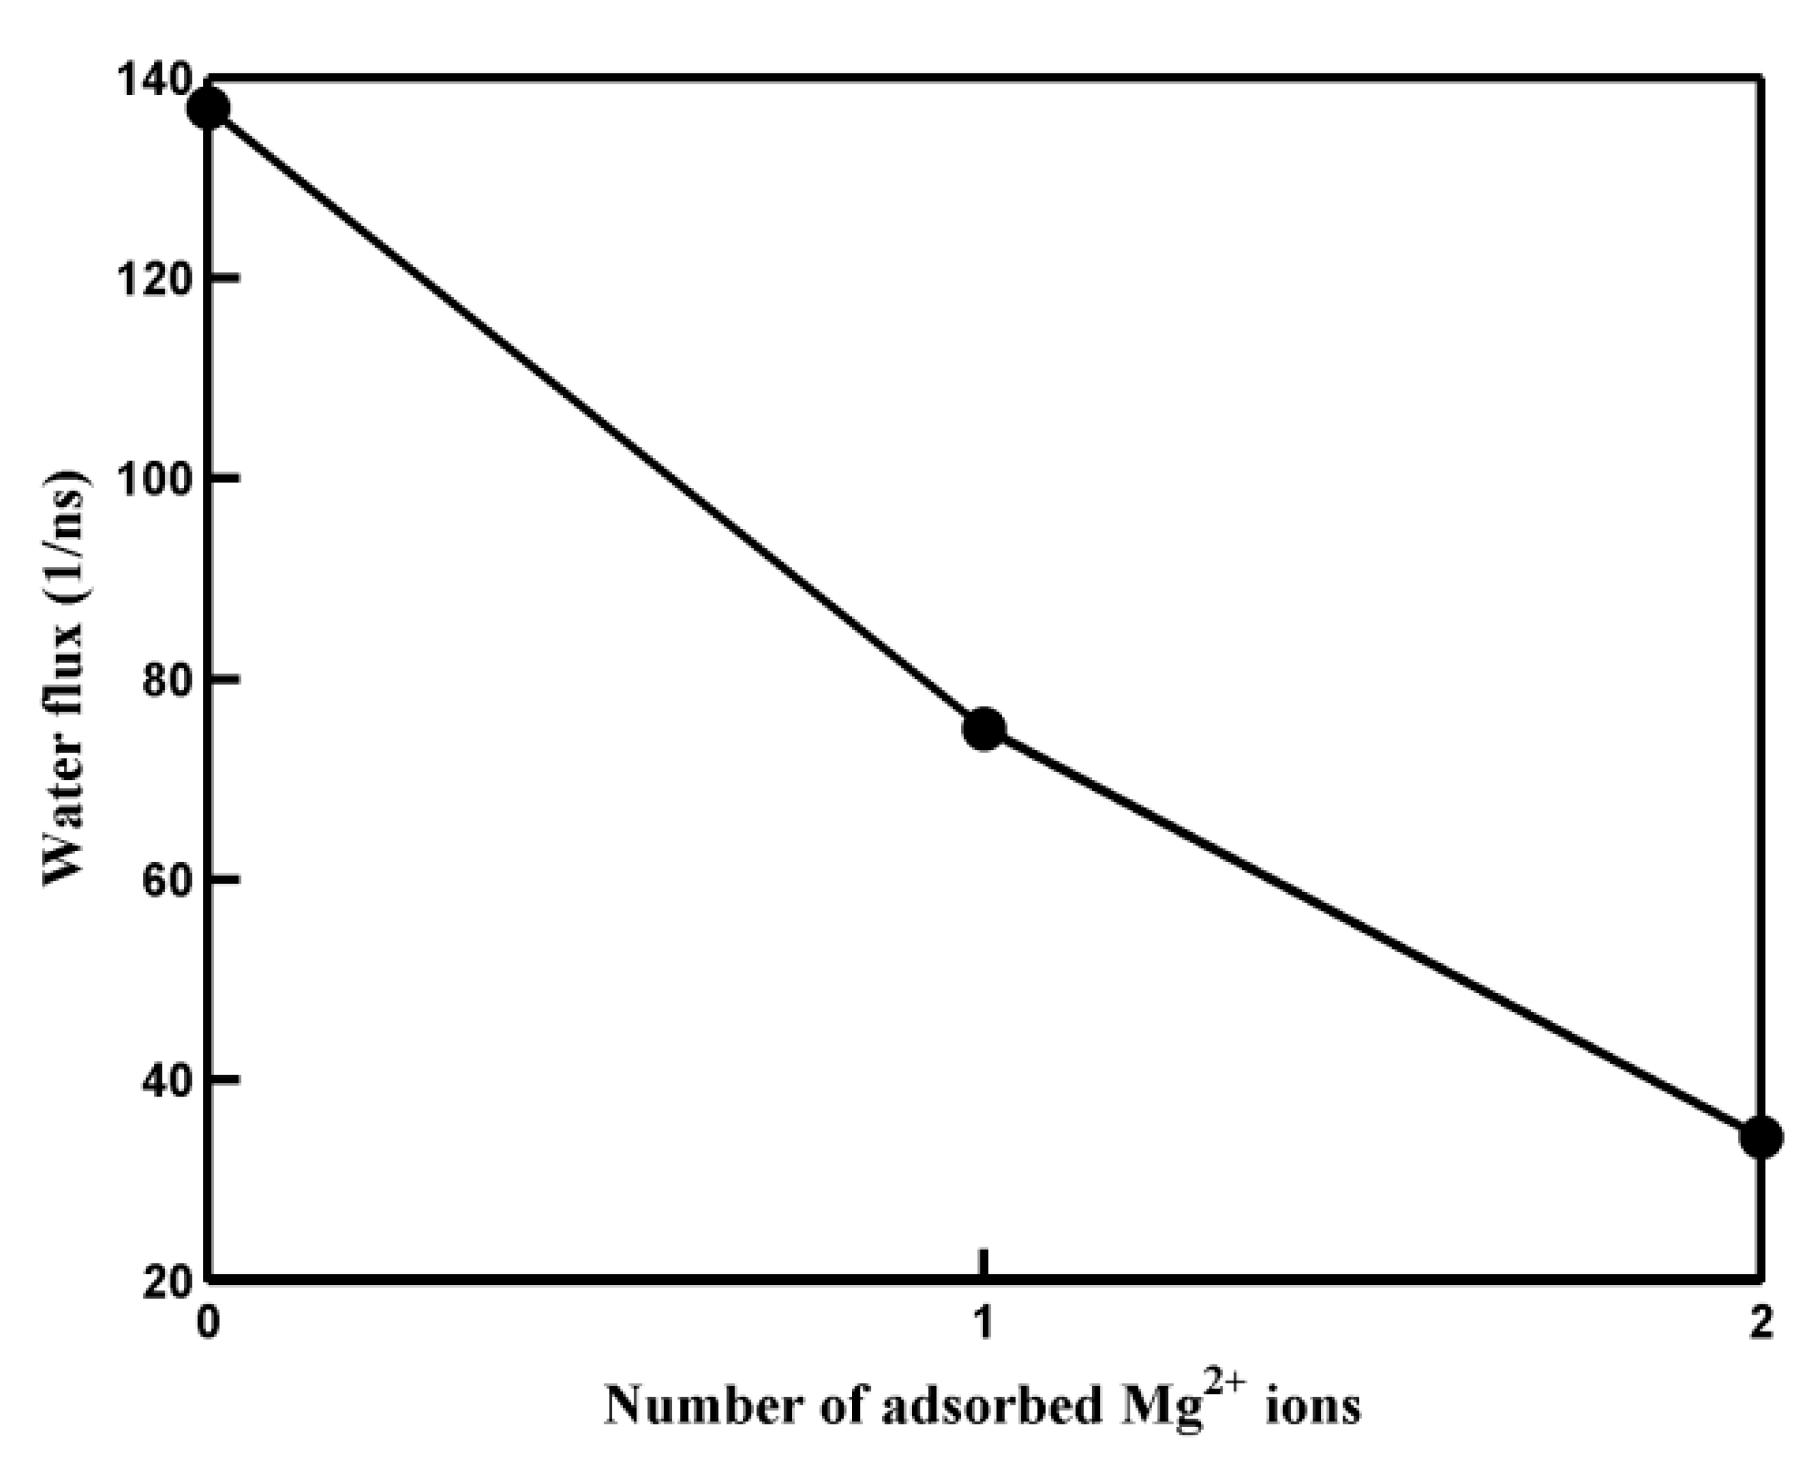
2.2. Water Flux
2.3. Effects of the Oxidization Degree on Desalination
2.4. Water Desalination Performance of Another Porous GO Membrane
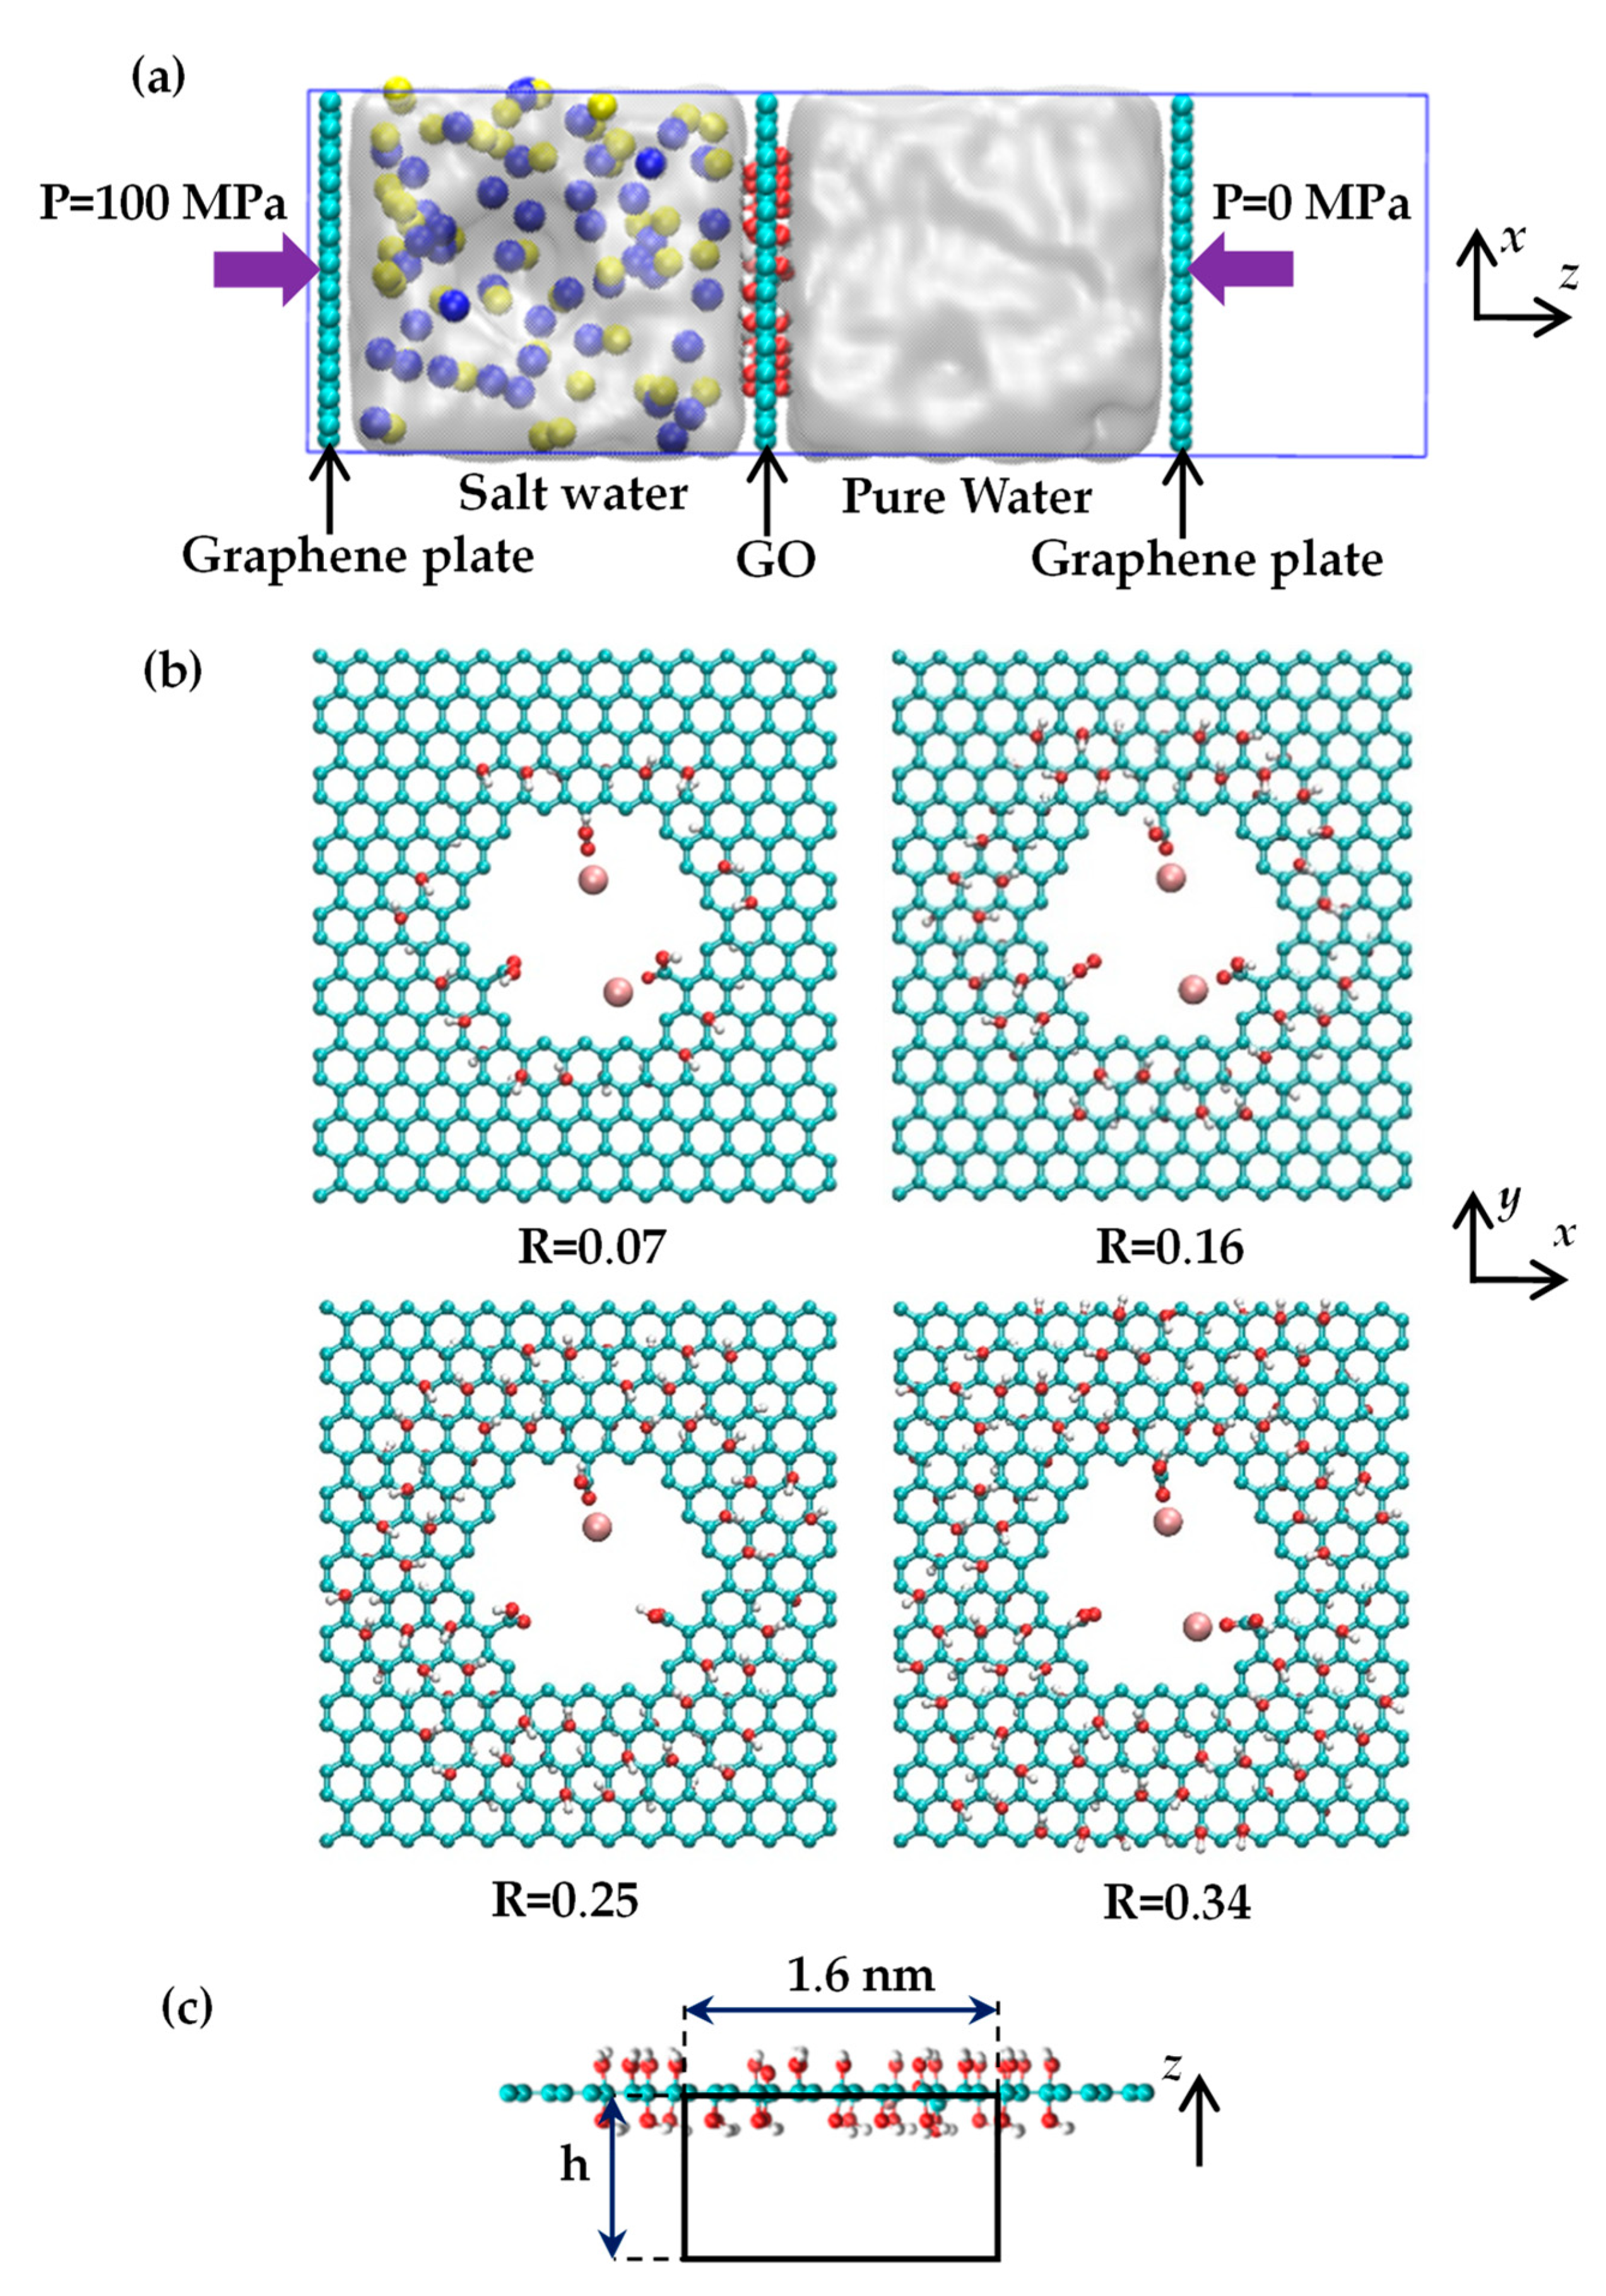
3. Materials and Methods
4. Conclusions
Supplementary Materials
Author Contributions
Funding
Data Availability Statement
Conflicts of Interest
References
- Shannon, M.A.; Bohn, P.W.; Elimelech, M.; Georgiadis, J.G.; Mariñas, B.J.; Mayes, A.M. Science and technology for water purification in the coming decades. Nature 2008, 452, 301–310. [Google Scholar] [CrossRef] [PubMed]
- Elimelech, M. The global challenge for adequate and safe water. Aqua 2006, 55, 3–10. [Google Scholar] [CrossRef]
- Jang, J.H.; Woo, J.Y.; Lee, J.; Han, C.S. Ambivalent effect of thermal reduction in mass rejection through graphene oxide membrane. Environ. Sci. Technol. 2016, 50, 10024–10030. [Google Scholar] [CrossRef] [PubMed]
- Jafarzadeh, R.; Azamat, J.; Erfan-Niya, H. Water desalination across functionalized silicon carbide nanosheet membranes: Insights from molecular simulations. Struct. Chem. 2020, 31, 293–303. [Google Scholar] [CrossRef]
- Yang, Y.Z.; Mu, L.H.; Chen, L.; Shi, G.S.; Fang, H.P. Precise control of the interlayer spacing between graphene sheets by hydrated cations. Phys. Chem. Chem. Phys. 2019, 21, 7623–7629. [Google Scholar] [CrossRef]
- Greenlee, L.F.; Lawler, D.F.; Freeman, B.D.; Marrot, B.; Moulin, P. Reverse osmosis desalination: Water sources, technology, and today’s challenges. Water Res. 2009, 43, 2317–2348. [Google Scholar] [CrossRef] [PubMed]
- Werber, J.R.; Osuji, C.O.; Elimelech, M. Materials for next-generation desalination and water purification membranes. Nat. Rev. Mater. 2016, 1, 16018. [Google Scholar] [CrossRef]
- Khawaji, A.D.; Kutubkhanah, I.K.; Wie, J.-M. Advances in seawater desalination technologies. Desalination 2008, 221, 47–69. [Google Scholar] [CrossRef]
- Jones, E.; Qadir, M.; van Vliet, M.T.H.; Smakhtin, V.; Kang, S.-mu. The state of desalination and brine production: A global outlook. Sci. Total Environ. 2019, 657, 1343–1356. [Google Scholar] [CrossRef]
- Cohen-Tanugi, D.; Grossman, J.C. Water desalination across nanoporous graphene. Nano Lett. 2012, 12, 3602–3608. [Google Scholar] [CrossRef]
- Heiranian, M.; Farimani, A.B.; Aluru, N.R. Water desalination with a single-layer MoS2 nanopore. Nat. Commun. 2015, 6, 8616. [Google Scholar] [CrossRef] [PubMed]
- Xue, M.M.; Qiu, H.; Guo, W.L. Exceptionally fast water desalination at complete salt rejection by pristine graphyne monolayers. Nanotechnology 2013, 24, 505720. [Google Scholar] [CrossRef] [PubMed]
- Lim, Y.J.; Goh, K.; Kurihara, M.; Wang, R. Seawater desalination by reverse osmosis: Current development and future challenges in membrane fabrication—A review. J. Membr. Sci. 2021, 629, 119292. [Google Scholar] [CrossRef]
- Lim, Y.J.; Ma, Y.; Chew, J.W.; Wang, R. Assessing the potential of highly permeable reverse osmosis membranes for desalination: Specific energy and footprint analysis. Desalination 2022, 533, 115771. [Google Scholar] [CrossRef]
- Prihasto, N.; Liu, Q.F.; Kim, S.H. Pre-treatment strategies for seawater desalination by reverse osmosis system. Desalination 2009, 249, 308–316. [Google Scholar] [CrossRef]
- Shatat, M.; Riffat, S.B. Water desalination technologies utilizing conventional and renewable energy sources. Int. J. Low-Carbon Technol. 2014, 9, 1–19. [Google Scholar] [CrossRef]
- Surwade, S.P.; Smirnov, S.N.; Vlassiouk, I.V.; Unocic, R.R.; Veith, G.M.; Dai, S.; Mahurin, S.M. Water desalination using nanoporous single-layer graphene. Nat. Nanotechnol. 2015, 10, 459–464. [Google Scholar] [CrossRef]
- Celebi, K.; Buchheim, J.; Wyss, R.M.; Droudian, A.; Gasser, P.; Shorubalko, I.; Kye, J.-I.; Lee, C.; Park, H.G. Ultimate permeation across atomically thin porous graphene. Science 2014, 344, 289–292. [Google Scholar] [CrossRef]
- Han, Y.; Xu, Z.; Gao, C. Ultrathin graphene nanofiltration membrane for water purification. Adv. Funct. Mater. 2013, 23, 3693–3700. [Google Scholar] [CrossRef]
- Wang, Y.H.; He, Z.J.; Gupta, K.M.; Shi, Q.; Lu, R.F. Molecular dynamics study on water desalination through functionalized nanoporous graphene. Carbon 2017, 116, 120–127. [Google Scholar] [CrossRef]
- Dreyer, D.R.; Park, S.; Bielawski, C.W.; Ruoff, R.S. The chemistry of graphene oxide. Chem. Soc. Rev. 2010, 39, 228–240. [Google Scholar] [CrossRef]
- Huang, H.B.; Ying, Y.L.; Peng, X.S. Graphene oxide nanosheet: An emerging star material for novel separation membranes. J. Mater. Chem. A. 2014, 2, 13772–13782. [Google Scholar] [CrossRef]
- Golchoobi, A.; Tasharrofi, S.; Taghdisian, H. Functionalized nanoporous graphene membrane for water desalination; Effect of feed salinity on permeability and salt rejection, a molecular dynamics study. Comput. Mater. Sci. 2020, 172, 109399. [Google Scholar] [CrossRef]
- Sun, C.Z.; Bai, B.F. Improved CO2/CH4 separation performance in negatively charged nanoporous graphene membranes. J. Phys. Chem. C 2018, 122, 6178–6185. [Google Scholar] [CrossRef]
- Sun, C.Z.; Boutilier, M.S.H.; Au, H.; Poesio, P.; Bai, B.F.; Karnik, R.; Hadjiconstantinou, N.G. Mechanisms of molecular permeation through nanoporous graphene membranes. Langmuir 2014, 30, 675–682. [Google Scholar] [CrossRef] [PubMed]
- Cohen-Tanugi, D.; Lin, L.C.; Grossman, J.C. Multilayer nanoporous graphene membranes for water desalination. Nano Lett. 2016, 16, 1027–1033. [Google Scholar] [CrossRef] [PubMed]
- Tian, Z.Q.; Mahurin, S.M.; Dai, S.; Jiang, D.E. Ion-gated gas separation through porous graphene. Nano Lett. 2017, 17, 1802–1807. [Google Scholar] [CrossRef] [PubMed]
- Liu, Q.; Chen, M.G.; Sun, L.L.; Liu, G.P.; Xu, R. Pore density effect on separations of water/ethanol and methanol/ethanol through graphene oxide membranes: A theoretical study. Sep. Purif. Technol. 2023, 308, 122975. [Google Scholar] [CrossRef]
- Zhang, M.X.; Sun, B.; Shah, K.W.; Zhang, X.S. Molecular dynamics study on electric field-facilitated separation of H2O/O2 through nanoporous graphene oxide membrane. J. Mol. Liq. 2022, 351, 118634. [Google Scholar] [CrossRef]
- Fang, C.; Yu, Z.; Qiao, R. Impact of surface ionization on water transport and salt leakage through graphene oxide membranes. J. Phys. Chem. C 2017, 121, 13412–13420. [Google Scholar] [CrossRef]
- Lim, Y.J.; Goh, K.; Wang, R. The coming of age of water channels for separation membranes: From biological to biomimetic to synthetic. Chem. Soc. Rev. 2022, 51, 4537–4582. [Google Scholar] [CrossRef] [PubMed]
- Liu, Q.; Wu, Y.Y.; Wang, X.; Liu, G.P.; Zhu, Y.D.; Tu, Y.S.; Lu, X.H.; Jin, W.Q. Molecular dynamics simulation of water-ethanol separation through monolayer graphene oxide membranes: Significant role of O/C ratio and pore size. Sep. Purif. Technol. 2019, 224, 219–226. [Google Scholar] [CrossRef]
- Köhler, M.H.; Bordin, J.R.; Barbosa, M.C. Ion flocculation in water: From bulk to nanoporous membrane desalination. J. Mol. Liq. 2019, 277, 516–521. [Google Scholar] [CrossRef]
- Sint, K.; Wang, B.Y.; Král, P. Selective ion passage through functionalized graphene nanopores. J. Am. Chem. Soc. 2008, 130, 16448–16449. [Google Scholar] [CrossRef] [PubMed]
- Sun, C.Z.; Zhu, S.H.; Liu, M.C.; Shen, S.H.; Bai, B.F. Selective molecular sieving through a large graphene nanopore with surface charges. J. Phys. Chem. Lett. 2019, 10, 7188–7194. [Google Scholar] [CrossRef] [PubMed]
- Fang, C.; Wu, H.Y.; Lee, S.Y.; Mahajan, R.L.; Qiao, R. The ionized graphene oxide membranes for water-ethanol separation. Carbon 2018, 136, 262–269. [Google Scholar] [CrossRef]
- Azamat, J.; Khataee, A.; Joo, S.W. Molecular dynamics simulation of trihalomethanes separation from water by functionalized nanoporous graphene under induced pressure. Chem. Eng. Sci. 2015, 127, 285–292. [Google Scholar] [CrossRef]
- Hosseini, M.; Azamat, J.; Erfan-Niya, H. Water desalination through fluorine-functionalized nanoporous graphene oxide membranes. Mater. Chem. Phys. 2019, 223, 277–286. [Google Scholar] [CrossRef]
- Mahadevi, A.S.; Sastry, G.N. Cation-π interaction: Its role and relevance in chemistry, biology, and material science. Chem. Rev. 2013, 113, 2100–2138. [Google Scholar] [CrossRef]
- Chen, L.; Shi, G.S.; Shen, J.; Peng, B.Q.; Zhang, B.W.; Wang, Y.Z.; Bian, F.G.; Wang, J.J.; Li, D.Y.; Qian, Z.; et al. Ion sieving in graphene oxide membranes via cationic control of interlayer spacing. Nature 2017, 550, 380–383. [Google Scholar] [CrossRef]
- Shahbabaei, M.; Kim, D. Transport of water molecules through noncylindrical pores in multilayer nanoporous graphene. Phys. Chem. Chem. Phys. 2017, 19, 20749–20759. [Google Scholar] [CrossRef] [PubMed]
- Pathania, Y.; Gaganpreet. Self-passivated nanoporous phosphorene as a membrane for water desalination. Desalination 2021, 497, 114777. [Google Scholar] [CrossRef]
- Liu, Y.C.; Cheng, Z.W.; Song, M.R.; Jiang, L.Z.; Fu, G.; Liu, L.; Li, J.Y. Molecular dynamics simulation-directed rational design of nanoporous graphitic carbon nitride membranes for water desalination. J. Membr. Sci. 2021, 620, 118869. [Google Scholar] [CrossRef]
- Wei, N.; Peng, X.S.; Xu, Z.P. Understanding water permeation in graphene oxide membranes. ACS Appl. Mater. Interfaces 2014, 6, 5877–5883. [Google Scholar] [CrossRef] [PubMed]
- Bussi, G.; Donadio, D.; Parrinello, M. Canonical sampling through velocity rescaling. J. Chem. Phys. 2007, 126, 014101. [Google Scholar] [CrossRef] [PubMed]
- Oostenbrink, C.; Villa, A.; Mark, A.E.; van Gunsteren, W.F. A biomolecular force field based on the free enthalpy of hydration and solvation: The GROMOS force-field parameter sets 53A5 and 53A6. J. Comput. Chem. 2004, 25, 1656–1676. [Google Scholar] [CrossRef] [PubMed]
- Tu, Y.S.; Lv, M.; Xiu, P.; Huynh, T.; Zhang, M.; Castelli, M.; Liu, Z.R.; Huang, Q.; Fan, C.H.; Fang, H.P.; et al. Destructive extraction of phospholipids from Escherichia coli membranes by graphene nanosheets. Nat. Nanotechnol. 2013, 8, 594–601. [Google Scholar] [CrossRef]
- Jorgensen, W.L.; Chandrasekhar, J.; Madura, J.D.; Impey, R.W.; Klein, M.L. Comparison of simple potential functions for simulating liquid water. J. Chem. Phys. 1983, 79, 926–935. [Google Scholar] [CrossRef]
- Hess, B.; Bekker, H.; Berendsen, H.J.C.; Fraaije, J.G.E.M. LINCS: A linear constraint solver for molecular simulations. J. Comput. Chem. 1997, 18, 1463–1472. [Google Scholar] [CrossRef]
- Hockney, R.W. The potential calculation and some applications. Methods Comput. Phys. 1970, 9, 136–211. [Google Scholar]
- Darden, T.; York, D.; Pedersen, L. Particle mesh Ewald: An N⋅log (N) method for Ewald sums in large systems. J. Chem. Phys. 1993, 98, 10089–10092. [Google Scholar] [CrossRef]
- Essmann, U.; Perera, L.; Berkowitz, M.L.; Darden, T.; Lee, H.; Pedersen, L.G. A smooth particle mesh Ewald method. J. Chem. Phys. 1995, 103, 8577–8593. [Google Scholar] [CrossRef]
- Comer, J.; Gumbart, J.C.; Hénin, J.; Lelièvre, T.; Pohorille, A.; Chipot, C. The adaptive biasing force method: Everything you always wanted to know but were afraid to ask. J. Phys. Chem. B 2015, 119, 1129–1151. [Google Scholar] [CrossRef] [PubMed]
- Prasad, V.; Kannam, S.K.; Hartkamp, R.; Sathian, S.P. Water desalination using graphene nanopores: Influence of the water models used in simulations. Phys. Chem. Chem. Phys. 2018, 20, 16005–16011. [Google Scholar] [CrossRef]
- Prasad, V.; Sathian, S.P. The effect of temperature on water desalination through two-dimensional nanopores. J. Chem. Phys. 2020, 152, 164701. [Google Scholar] [CrossRef]
- Frisch, M.J.; Trucks, G.W.; Schlegel, H.B.; Scuseria, G.E.; Robb, M.A.; Cheeseman, J.R.; Scalmani, G.; Barone, V.; Mennucci, B.; Petersson, G.A.; et al. Uranyl Extraction by N, N-Dialkylamide Ligands Studied by Static and Dynamic DFT Simulations. In Gaussian 09; Gaussian Inc: Wallingford, CT, USA, 2009; Volume 19, p. 227. [Google Scholar]
- Tu, Y.S.; Li, P.; Sun, J.J.; Jiang, J.; Dai, F.F.; Li, C.Z.; Wu, Y.Y.; Chen, L.; Shi, G.S.; Tan, Y.W.; et al. Remarkable antibacterial activity of reduced graphene oxide functionalized by copper ions. Adv. Funct. Mater. 2021, 31, 2008018. [Google Scholar] [CrossRef]
- Wendler, K.; Thar, J.; Zahn, S.; Kirchner, B. Estimating the Hydrogen Bond Energy. J. Phys. Chem. A 2010, 114, 9529–9536. [Google Scholar] [CrossRef] [PubMed]


| Number of Adsorbed Mg2+ Ions | Na+ (ps) | Cl− (ps) | Water Molecule (ps) |
|---|---|---|---|
| 0 Mg2+ ions | 10.7316 | 8.1324 | 3.6078 |
| 1 Mg2+ ion | 12.2970 | 8.9998 | 8.2718 |
| 2 Mg2+ ions | 21.5172 | 10.9348 | 12.4690 |
| RO Membrane | Water Permeability (L/cm2/Day/MPa) | Salt Rejection (%) |
|---|---|---|
| MoS2 nanopore [11] | 16 | 100 |
| Hydrogenated graphene nanopore [10] | 39 | 100 |
| Phosphoerne nanopore [42] | 11 | 100 |
| g-C3N4 nanopore [43] | 15 | 100 |
| Hydroxylated graphene nanopore [10] | 66 | 100 |
| Pore without adsorbed Mg2+ ions (current job) | 234 | 81 |
| Pore with one adsorbed Mg2+ ion (current job) | 128 | 88 |
| Pore with two adsorbed Mg2+ ions (current job) | 59 | 95 |
Disclaimer/Publisher’s Note: The statements, opinions and data contained in all publications are solely those of the individual author(s) and contributor(s) and not of MDPI and/or the editor(s). MDPI and/or the editor(s) disclaim responsibility for any injury to people or property resulting from any ideas, methods, instructions or products referred to in the content. |
© 2024 by the authors. Licensee MDPI, Basel, Switzerland. This article is an open access article distributed under the terms and conditions of the Creative Commons Attribution (CC BY) license (https://creativecommons.org/licenses/by/4.0/).
Share and Cite
Jiang, J.; Tu, Y.; Gu, Z. Magnesium Ion Gated Ion Rejection through Carboxylated Graphene Oxide Nanopore: A Theoretical Study. Molecules 2024, 29, 827. https://doi.org/10.3390/molecules29040827
Jiang J, Tu Y, Gu Z. Magnesium Ion Gated Ion Rejection through Carboxylated Graphene Oxide Nanopore: A Theoretical Study. Molecules. 2024; 29(4):827. https://doi.org/10.3390/molecules29040827
Chicago/Turabian StyleJiang, Jianjun, Yusong Tu, and Zonglin Gu. 2024. "Magnesium Ion Gated Ion Rejection through Carboxylated Graphene Oxide Nanopore: A Theoretical Study" Molecules 29, no. 4: 827. https://doi.org/10.3390/molecules29040827