Article

Phytochemical Diversity Comparison in Leaves and Roots of Wild and Micropropagated Latvian Sea Holly (Eryngium maritimum L.)

Institute for Environmental Solutions, “Lidlauks”, Priekuli Parish, LV-4126 Cesis, Latvia
*
Author to whom correspondence should be addressed.
Molecules 2023, 28(9), 3924; https://doi.org/10.3390/molecules28093924
Submission received: 13 April 2023 / Revised: 29 April 2023 / Accepted: 4 May 2023 / Published: 6 May 2023
(This article belongs to the Special Issue Phytochemical Profile and Biological Evaluation of Plant Extracts)

Abstract

:
The goal of the current study was to compare the chemical composition of the roots, shoots, and leaves of wild-growing Eryngium maritimum L., and of in vitro and in field-cultivated plants in Latvia. The essential oil yield obtained by hydrodistillation ranged from 0.14% to 0.54%, while analysis of the chemical composition using GC-MS revealed a total of 44 different volatiles, with differences in the types and amounts of volatiles between the leaves and roots. Using 96-well plate techniques, the concentration of total phenolic compounds, saponins, and sugars in the aqueous ethanolic extracts of E. maritimum were assessed, along with their capacity to scavenge stable DPPH radicals. Extracts from roots had a lower concentration of total phenolic compounds compared to those from the leaves of wild grown and cultivated plants but did not differ from in vitro shoots. Root, leaf, and shoot samples of the same genotype from different growth conditions had approximately the same concentration of total saponins, while total sugar concentrations were higher in the roots. The growth conditions had a significant effect on the concentration of total phenolic compounds and antiradical activity, with differences that were significant observed between plant aboveground and belowground parts. Analysis using UHPLC-ESI-q-TOF-MS revealed 63 compounds, with amino acids and hydroxycinnamic acid derivatives (such as chlorogenic and rosmarinic acid) being the major compound groups that significantly differed between plant growth conditions. We also demonstrated that rapid screening of volatile compounds in in vitro plants using headspace gas chromatography mass spectrometry analyses can predict the formation of marker compounds in the same mericlones grown in field conditions. These findings provide valuable insights into the chemical composition of E. maritimum and its potential for use in various applications.

1. Introduction

E. maritimum, also known as sea holly, is a plant species that grows in coastal areas of Europe and northern Africa, covering the Black Sea, the Mediterranean, the Atlantic coasts of North Africa and Europe, and the coasts of the North Sea and Baltic Sea [1]. Latvia and Estonia are the northern borders of the distribution range of sea holly [2]. It is considered an endangered species in Europe, including Latvia, due to the destruction of its habitat and excessive harvesting from the wild. It is forbidden to collect herbs for commercial purposes in the wild because they are identified as needing protection in the Red Data Book of the Baltic Region [3] because of issues such as habitat degradation, excessive harvesting, and disruption of coastal ecosystems. In addition to Latvia, several countries such as the UK, France, Italy [4], and Poland [5] also consider sea holly to be an endangered or vulnerable species. Efforts are being made to conserve and protect sea holly populations in Europe, including through habitat restoration and protection measures as well as through regulations on the harvesting and trade of the plant. For those reasons, biotechnological techniques such as in vitro cultures can be used for the conservation and propagation of these endangered plant species [6,7,8,9,10]. Alternatively, efforts can be made to cultivate sea holly under controlled conditions in order to obtain its phytochemicals without contributing to the depletion of wild populations.
Used as ornamentals or vegetables, E. maritimum also has a long history of use in traditional medicine for a variety of purposes, including as a digestive aid, diuretic, and anti-inflammatory agent [11,12]. Additionally, the plant has been used to treat conditions such as fever and bronchitis [13]. Potential anticancer properties, such as the capability of E. maritimum to reduce the toxicity associated with chemotherapeutic agents such as cisplatin [14], as well as enzymatic inhibitory properties [15], have also been described. Due to its antimicrobial, antioxidant, hepatoprotective, and anti-inflammatory properties [11,12,13,16], sea holly appears to be an excellent candidate for use as a cosmetic additive [17] and is already used as an extract that is added to formulations such as lotions, creams, and serums [18,19]. Leaves and roots of the plant are edible, but its commercial use is generally limited to small-scale, local consumption [20]. However, some of these species have been consumed in some traditional dishes in certain regions [21,22]. The commercial exploitation of the species for the food industry is hindered by the slow adaptation of plants to changes in costal ecosystems [20], as well as the endangered status of northern populations [5].
Due to E. maritimum’s endangered status, it is important to ensure that any harvesting of sea holly is carried out sustainably and with appropriate permits and regulations in place to protect the plant and its habitat. Alternatively, efforts can be made to cultivate sea holly under controlled conditions in order to obtain its phytochemicals without contributing to the depletion of wild populations.
From a chemical composition perspective, E. maritimum is known to contain essential oils [5,11,23,24,25,26,27], triterpenoid saponins [6,23], flavonoids, and phenolic acids [6,7,15,23,28,29], etc. The essential oil content in the aerial parts of wild plants from Portugal [26], Corsica, Sardinia [25], and Greece [27] varied between 0.06% and 0.09%, while plants from Sicily had a much higher essential oil content at 0.93% [24]. Only one study has investigated essential oil content in the dried roots (0.01%) of E. maritimum of plants cultivated in a botanical garden in Poland, and it confirmed that the leaves contain more EO than the roots [5]. The dominant compounds in oils from Portugal [26] were found to be 4,4,11,11-Tetramethyl-7-tetracyclo[6.2.1.0(3.8)0(3.9)]undecanol and germacrene D. The major compounds in EO samples from Sicily [24] were found to be germacrene D and spathulenol. On the other hand, studies carried out in Poland [5] showed that the main compounds in the roots were hexadecanoic acid, menthol, and menthone. The main compounds in the leaves were 2,3,4-trimethylbenzaldehyde and germacrene D, and 2,3,4-trimethylbenzaldehyde was found in shoot culture. It is described that leaf EO components have been proven to have antifungal and antibacterial properties; for example, oxygenated sesquiterpenes 4βH-muurol-9-en-15-al and 4βH-cadin-9-en-15-ol are described to show efficiency against Listeria monocytogenes and Escherichia coli [30]. Kikowska et al. [5] found that essential oils from E. maritimum leaves were effective against Trichophyton mentagophytes and Staphylococcus aureus. Previous research [29] on Tunisian E. maritimum extracts from leaves, roots, and stems showed no significant differences in the total phenolic content (TPC) between plant parts. On the other hand, Kikowska et al. [7] reported that the total phenolic content was higher in whole plants compared to separate shoots and roots from in vitro cultures of E. maritimum. However, when testing fresh materials, the biomass from in vitro cultures consistently exhibited more polyphenols than the same organs from intact plants [7]. Previous studies [7,12,15,30] have demonstrated that the non-volatile chemical composition of root and leaf extracts of E. maritimum varies. Among the most frequently reported phytochemical compounds in E. maritimum samples are hydroxycinnamic acid derivatives (such as rosmarinic, chlorogenic, and caffeic acids) [8,12,13,14,30,31]. Flavonoids are also an important class of compounds with a wide range of components and are believed to contribute to the antioxidant properties of many aromatic plants used in the food, pharmaceutical, and cosmetic industries [32]. E. maritimum is no exception, and the total flavonoid content in its composition has been widely studied using spectrophotometric quantification methods [12,15,22,27,30]. The saponins possess amphipathic properties, which means that they have both hydrophilic and hydrophobic characteristics [33]. The first phytochemical investigations on Eryngium species’ saponin content were initiated in the early 1970s [12], and the study has continued to the present day. Saponins have been recognized by separation techniques such as thin layer chromatography (TLC) [34,35] or liquid chromatography (LC) analysis [7,17]. The identification of saponins has confirmed that Eryngium species, including E. maritimum, are abundant sources of triterpene saponins [6,34,35].
The aim of this study was therefore to analyze the chemical composition of both volatile and non-volatile compounds extracted from different parts of E. maritimum plants grown in Latvia [10], including the leaves of wild-collected specimens as well as leaves and shoots of in vitro propagated plantlets and leaves and roots of field-grown micropropagated plantlets from the same populations. It should be noted that this study represents the first time such an analysis has been conducted on this particular plant species in Latvia.
To assess phytochemical profiling, high-throughput 96-well plate spectrophotometric assays were employed to evaluate total phenolics, total sugars, total saponins, and DPPH antioxidant activity. It should be noted that the total saponin content of E. maritimum using spectrophotometric assays on a high-throughput 96-well plate has not been reported previously. Nonvolatile secondary metabolites were tentatively identified using liquid chromatography high-resolution mass spectrometry (LC-qTOF-MS). Additionally, the content and chemical composition of steam-distilled essential oils from wild-grown plants and acclimated plants in the field were evaluated using gas chromatography mass spectrometry (GC-MS). Our results revealed differences in the types and amounts of volatiles between the leaves and roots. Furthermore, the usefulness of headspace gas chromatography mass spectrometry (HS-GC-MS) for fast screening studies of in vitro plant volatile compounds was demonstrated. This method can be used to predict the formation of marker compounds in the same plants that have been acclimated in the field.

2. Results and Discussion

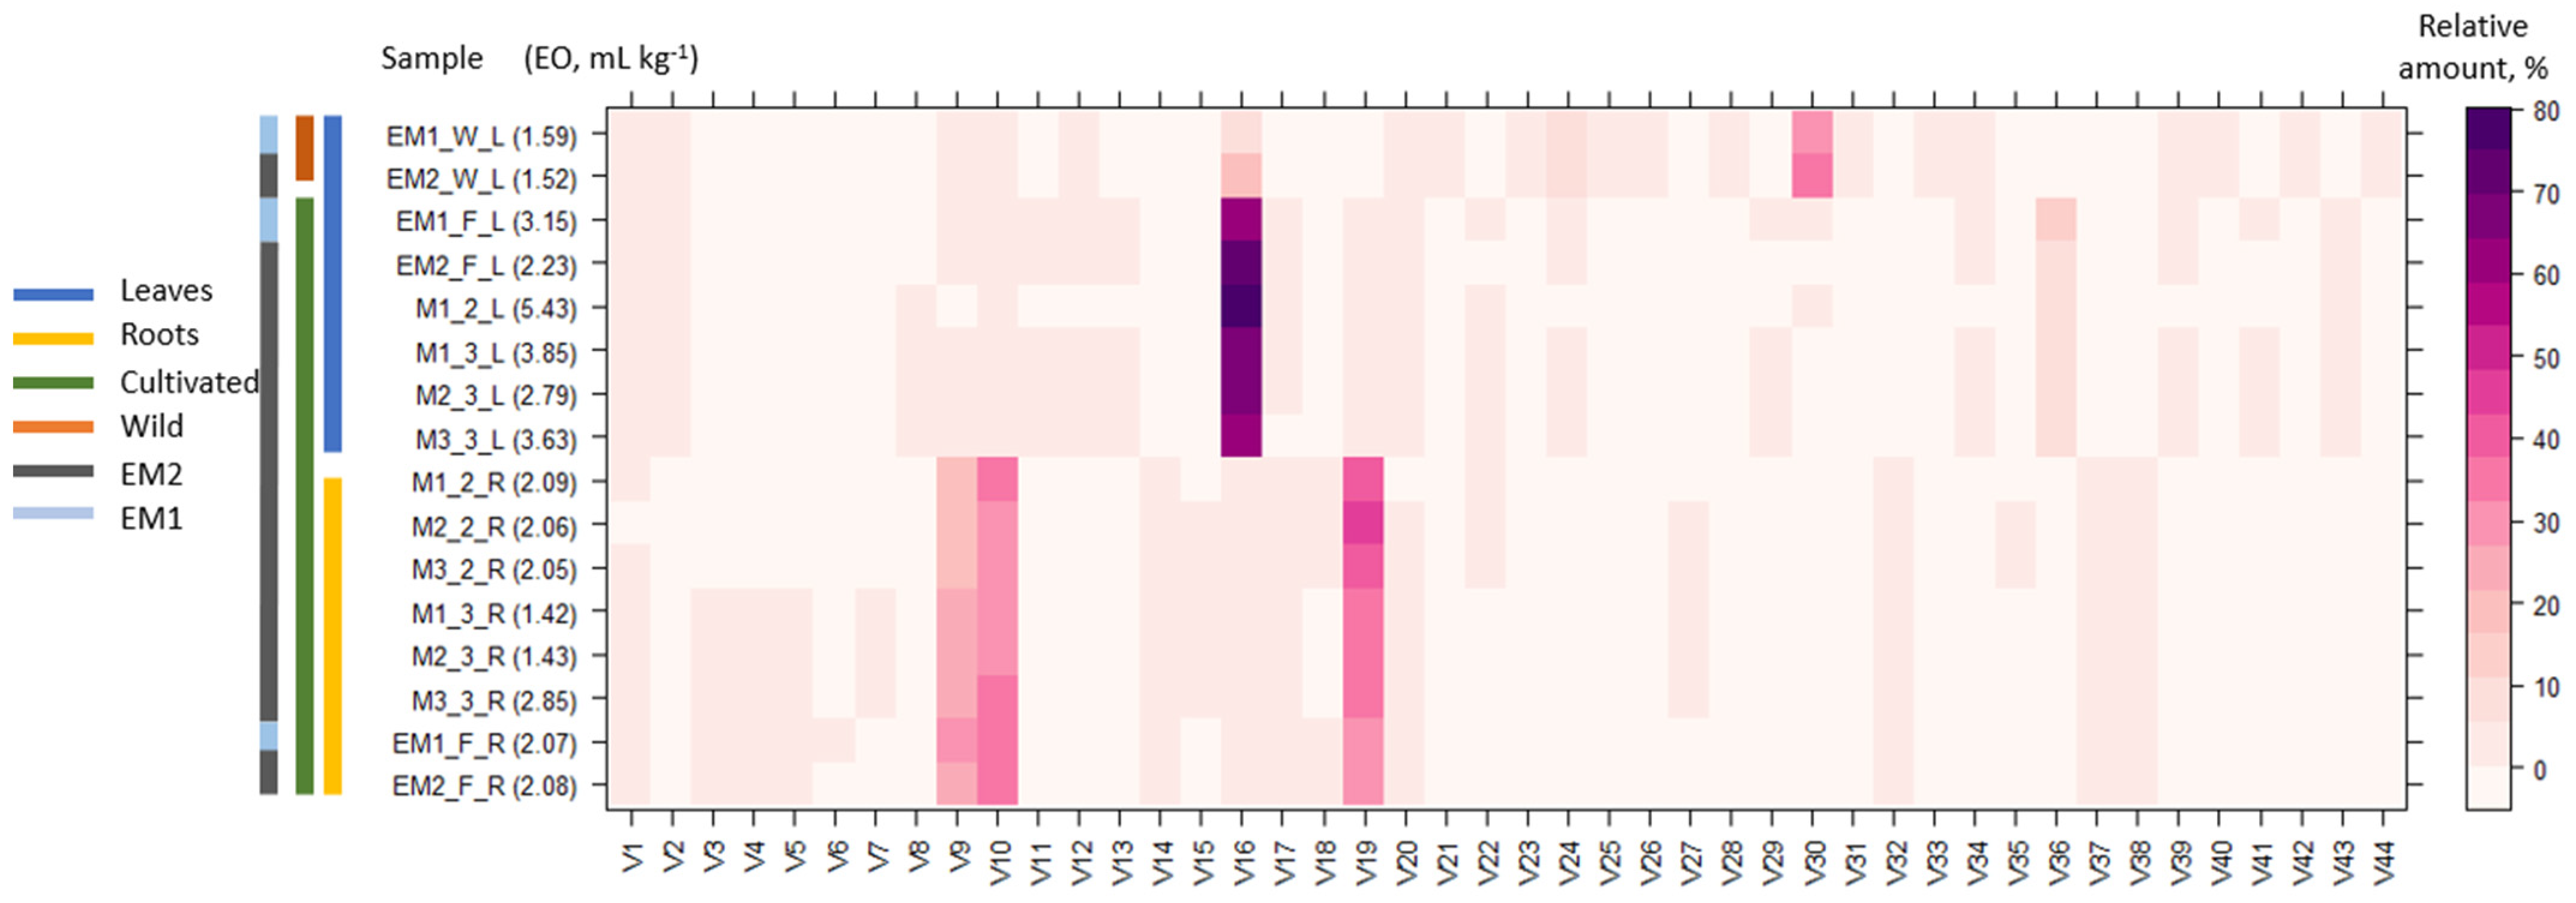
2.1. Essential Oil Quantification and Volatile Profile Characterization by GC-MS

Researchers have previously studied the chemical composition and essential oil (EO) content of numerous Eryngium species. Differences in essential oil content and composition between aerial parts and roots have been described previously [5,24,25].
Hydrodistillation of E. maritimum dried leaves yielded 1.52 (0.15%) to 5.43 (0.54%) mg mL−1 essential oil in leaves and 1.42 (0.14%) to 2.85 (0.28%) mg mL−1 in roots (Figure 1). The leaves from 20 wild plants (EM1 W_L and EM2 W_L) contained 1.5 to 2.0 times less essential oil than those from 20 plants grown in the agricultural field for two seasons (EM1 F_L and EM2 F_L) of the respective population. This is the first study to compare the chemical composition of wild and cultivated plants of E. maritimum. Previously, cultivation has been shown to increase the EO content in Pelargonium inquinans [36], decrease Origanum syriacum [37], and have no significant effect on EO content in Glechoma hederaceae [38]. The essential oil content in the leaves of a single field-grown mericlone (M1) exceeded essential oil content in the pooled sample of the wild (EM2) by 3.6 times in the first vegetation season and 1.8 times in the second vegetation season. Further extensive studies are needed to clarify whether the EO yield is influenced more by the age of the plant or the weather conditions of the growing season. The yields of essential oils obtained from the roots were lower than in leaves. In the two field-grown populations (EM1 and EM2), the essential oil yield ratio from leaves and roots was 1.1–1.5, but in single mericlones (M1, M2, and M3) in the second vegetation season it was 1.3–2.7. The essential oil yields found in wild sea holly plants (0.1%) in Latvia slightly exceed the amount of essential oil in wild collected aerial parts from Portugal (0.08%) [26], Corsica (0.06%), Sardinia (0.09%) [25], and Greece (0.09%) [27]. However, plants from Sicily were reported to have much higher essential oil content in aerial part—0.93% [24]. Such differences may arise due to genetic differences between the populations, differing environmental conditions, and biotic and abiotic stressors, as well as collection at different phenological phases. Only one study has investigated essential oil content in in dried roots (0.01%) of E. maritimum of plants cultivated in botanical garden in Poland [5], which was lower than the one found in this study. This study confirmed the previous findings that leaves contain more EO than roots [5].
Overall, 44 different volatiles (V) were identified in hydro-distilled essential oils by GC-MS (Table 1). The composition and amount of volatiles in wild and cultivated plants differed between wild and cultivated plants. Germacrene D is common among dominant compounds in both wild (7.92–18.28%) and cultivated (61.13–75.05%) plants. A previously high content of Germacrene D (10.5–40%) has been found in leaves and aerial parts in Portuguese, Italian, and Polish samples. The dominant compounds of the essential oil obtained from leaves collected in the wild were 4βH-muurol-9-en-15-al (V30) > germacrene D (V16) > spathulenol (V24) > 4βH-cadin-9-en-15-ol (V39). Similar profiles have earlier been reported in samples from Poland, Corsica, and Sardinia [5,25]. In contrast, dominant compounds in oils from Portugal [26] were 4,4,11,11-Tetramethyl-7-tetracyclo[6.2.1.0(3.8)0(3.9)]undecanol, germacrene D. The major compounds in samples from Sicily [24] were germacrene D and spathulenol, but 4βH-muurol-9-en-15-al, 4βH-cadin-9-en-15-al, 4βH-muurol-9-en-15-ol, and 4βH-cadin-9-en-15-ol were not found. The sequence of dominant compounds in leaves from field-cultivated plants was germacrene D (V16) > eudesma-4,7-diene-1β-ol (V36) > cumene (V1) > α-muurolene (V19), thus differing from the profile of wild plants. In the wild, sea holly grows in sand dunes affected by salinity from seas and oceans. In the field, soil contained more nutrients and no salinity stress, which could be a major factor contributing to the change in EO components. Previous studies [39] on Teucrium scordium and Mentha pulegium have demonstrated that the components of EOs change in adaptive response to salinity stress. Further studies on E. maritimum are needed to clarify the effect of salinity and soil fertility on EO quantitative and qualitative compositions. Dominant compounds have a major effect on the biological activity of essential oils, thus the differences in oils from various populations and differences arising from wild collection and cultivation of the species may lead to different properties and applications. The leaf EO components have been proven to have antifungal and antibacterial properties, e.g., oxygenated sesquiterpenes 4βH-muurol-9-en-15-al (V30) and 4βH-cadin-9-en-15-ol (V39) have been seen to show efficiency against Listeria monocytogenes and Escherichia coli [28]. Kikowska et al. [5] found that essential oils from E. maritimum leaves were effective against Trichophyton mentagophytes and Staphylococcus aureus. According to Machado [40], E. maritimum essential oils or some of their constituents can be potentially useful in the clinical management and research of new therapeutic agents for leishmaniasis.
The relative amounts of the E. maritimum essential oil components differed between the leaves and roots of micropropagated plants and the leaves of wild plants segregating in three distinctive clusters (Figure 1). The clusters were discriminated by a higher proportion of Germacrene D in the leaves, a higher α-muurolene, duraldehyde, and mesitaldehyde content in roots, and a higher 4βH-Muurol-9-en-15-al content in the leaves of wild plants. Differences in the composition of EO between roots and leaves have been reported in the only study previously determining the EO of both organ systems [5]. Similarly, to this study, the content of Germacrene D was more pronounced in leaves. In this study, the major compounds separated from the roots were α-muurolene (V19) > duraldehyde (V10) > mesitaldehyde (V9), but Kikowska et al. [5] reported menthol > menthone > menthyl acetate > 2,3,4-trimethylbenzaldehyde as the dominant compounds in roots, which were not detected in this study. The last one may lead to discussions because its molar mass is identical to that of duraldehyde, also referred to as 2,4,5-trimethylbenzaldehyde. A similar EO composition was observed in root samples of in vitro and field-cultivated samples. More studies on E. maritimum root EO content and composition are needed to clarify the diversity across genetical and environmental gradients.

2.2. Phytochemical Screening of E. maritimum Plant Extracts

The ability of E. maritimum aqueous ethanolic extracts to scavenge stable DPPH radicals, along with the total phenolic, saponin, and sugar contents in the extracts using 96-well plate methods, was evaluated.
Phenolic compounds are a diverse group of secondary metabolites that are often found in plants and are known to have a wide range of biological activities. The amounts of total phenolics in E. maritimum ethanolic extracts were estimated by the Folin–Ciocalteu method, and the obtained results varied from 0.08 to 1.02 g GAE/100 g dry weight, confirming the results of the studies published previously [7,15,27,28,30,41]. Previous studies [29] of Tunisian E. maritimum leaf, root, and stem extracts found no significant differences of TPC content between plant parts. According to Kikowska et al. [7], whole plants had a higher total phenolic content than separate shoots and roots from in vitro cultures of E. maritimum. However, when fresh materials were tested, the biomass from in vitro cultures always had more polyphenols than the same organs from intact plants [7]. Our results are in line with these findings. Extracts from roots showed a smaller capacity to accumulate phenolic compounds in comparison to leaves from intact plants (M(1)(2)(3)_1_L and M(1)(2)(3)_1_R). In contrast, roots from in vitro plantlets had one of the highest total phenolic content yields among all tested extracts. In contrast to previous studies, we found that polyphenols were not the dominant class of chemical compounds in E. maritimum; significantly higher amounts of total saponins were observed, varying from 2.97 to 10.27 g ESE on 100 g dry weight. To the best of our knowledge, this is the first paper presenting the 96-well plate method for determination of total saponins in E. maritimum leaf and root extracts by the modified anisaldehyde–sulfuric acid method. Saponins are characterized by their amphipathic nature, which means they have both hydrophilic and hydrophobic properties [33]. Beginning in the early 1970s, the first phytochemical studies of the genus Eryngium focused on its saponin content [12], with continuing research up to the present day confirming that not only E. maritimum, but also other Eryngium species are rich sources of triterpene saponins [6,34,35]. According to Kowalczyk [35], triterpenoid saponin production by E. maritimum in vitro root cultures was significantly lower than that of an intact plant. In contrast, in this study root and leaf samples of the same plant generated approximately the same total saponin amounts. We believe that this is because most of the previous studies were based on the identification of saponins by separation using thin layer chromatography (TLC) [34,35] and liquid chromatography (LC) analysis [7,17], while we performed total saponin testing. The presence of phenolic compounds in E. maritimum suggests that this plant may have potential health benefits, particularly in terms of its antioxidant and anti-inflammatory properties, including antimicrobial properties, while the unique structure of saponins characterized by a triterpene aglycone and one or more sugar chains allows them to interact with cell membranes and form complexes with cholesterol and other lipids, which can have various biological effects [33]. In accordance with studies made by Amessis-Ouchemoukh et al. [41], anti-acetylcholinesterase activity and ferrous ion-chelating power was exhibited by the methanolic extracts of E. maritimum leaves. Meot-Duros et al. [29] confirmed that sea holly polar fraction of leaves presented a strong antibacterial activity against two microorganisms, Pseudomonas aeruginosa and P. marginalis. A recent study demonstrated that E. maritimum rhizome aqueous extracts exhibit a rich diversity of pharmacologically bioactive compounds with potential therapeutic applications. The extract demonstrated no cytotoxicity and instead exhibited antioxidant and anti-inflammatory properties in Jurkat cells by stimulating an antioxidant response and reducing the secretion of cytokines and nitric oxide [42]. Experiments performed by Küpeli [43] on mice showed that aqueous and ethanolic extracts of the aerial parts and roots of E. maritimum, collected in Turkey, had strong anti-inflammatory and antinociceptive effects. Even more, the saponin–phenolic acid methanolic fractions of the Polish E. maritimum in different organs and undifferentiated in vitro culture—cell suspension—showed high antibacterial activity against S. aureus [35]. The stable DPPH radical against ascorbic acid was used within this study to assess the ability of the obtained E. maritimum leaf and root ethanolic extracts to scavenge radicals, suggesting the above-mentioned phytochemical group constituents’, such as phenolic compounds and saponins, capability of deactivating the free radicals. Antiradical activity (ARA) values ranged from 19.47 to 211.60 mg ASE/100 g DW, while DPPH values ranged from 3.9 to 42.5% (Table 2). According to Traversier [17], in research funded by Cosmetic Laboratoires Clarin, antiradical activity as well as biological activities such as anti-collagenase, antimicrobial, and anti-tyrosinase activity of E. maritimum extracts depend on the technique of extraction used. At the same time, extracts with low DPPH (%) activity (11 and 34%, respectively) showed the highest values of tyrosinase assay (123 and 130%) against kojic acid 50 μg mL−1 (99%) and collagenase assay (57 and 19%) in comparison with phenanthroline 2 mg mL−1 (132%), suggesting this plant’s potential use in different cosmetic applications. While Pereira et al. [15] described the biotechnological evaluation of the different organs of E. maritimum in terms of its antidiabetic and antioxidant potential in the form of decoction and tincture, DPPH scavenging of sea holly was found to be higher in extracts derived from leaves (39.1–84.2%) in comparison with roots (31.5–51.3%), confirming that these extracts may help manage type 2 diabetes and could be useful in preventing oxidative-stress-related disorders. It is also important to consider that the E. maritimum extracts’ total sugar content could affect their antibacterial, therapeutic, and preservation qualities. The concentration of total sugars had high variation, ranging from 0.85 to 36.85 g glucose equivalents per 100 g of dried sample. Higher concentrations of total sugars were observed in the root extracts in all cases. The antibacterial effects of concentrated sugar solutions against pathogens such as S. aureus, Bacillus subtilis, and P. aeruginosa have been demonstrated in earlier research [44,45]. According to Mizzi’s findings [46], high sugar concentrations inhibit bacterial growth, while very low concentrations have the opposite effect, i.e., they promote bacterial growth. This suggests that there is a critical concentration at which sugars stop acting as antimicrobial agents and start functioning as media. In very recent research by Nakurte [46], it was confirmed that total sugars extracted from Matricaria recutita white ray floret supercritical fluid extracts were highly positively correlated with inhibitory activity against E. coli and P. aeruginosa, with a weaker influence on inhibitory activity against P. aeruginosa and S. aureus. Plant parts, growth conditions, and population can have a significant impact on TPC, ARA, TSC, and total sugar content. The test highlighted significant differences (p < 0.05) between plant part and growth conditions, but no significant differences were observed between populations. Significant differences in total sugar content and TPC were observed between plant aboveground and belowground parts, whereas the growth conditions had a significant effect on TPC and ARA.
All the above-mentioned phytochemicals groups are important; therfore, we further screened and identified these bioactive compounds with LC-qTOF-MS, as it can provide more reliable and authentic data.

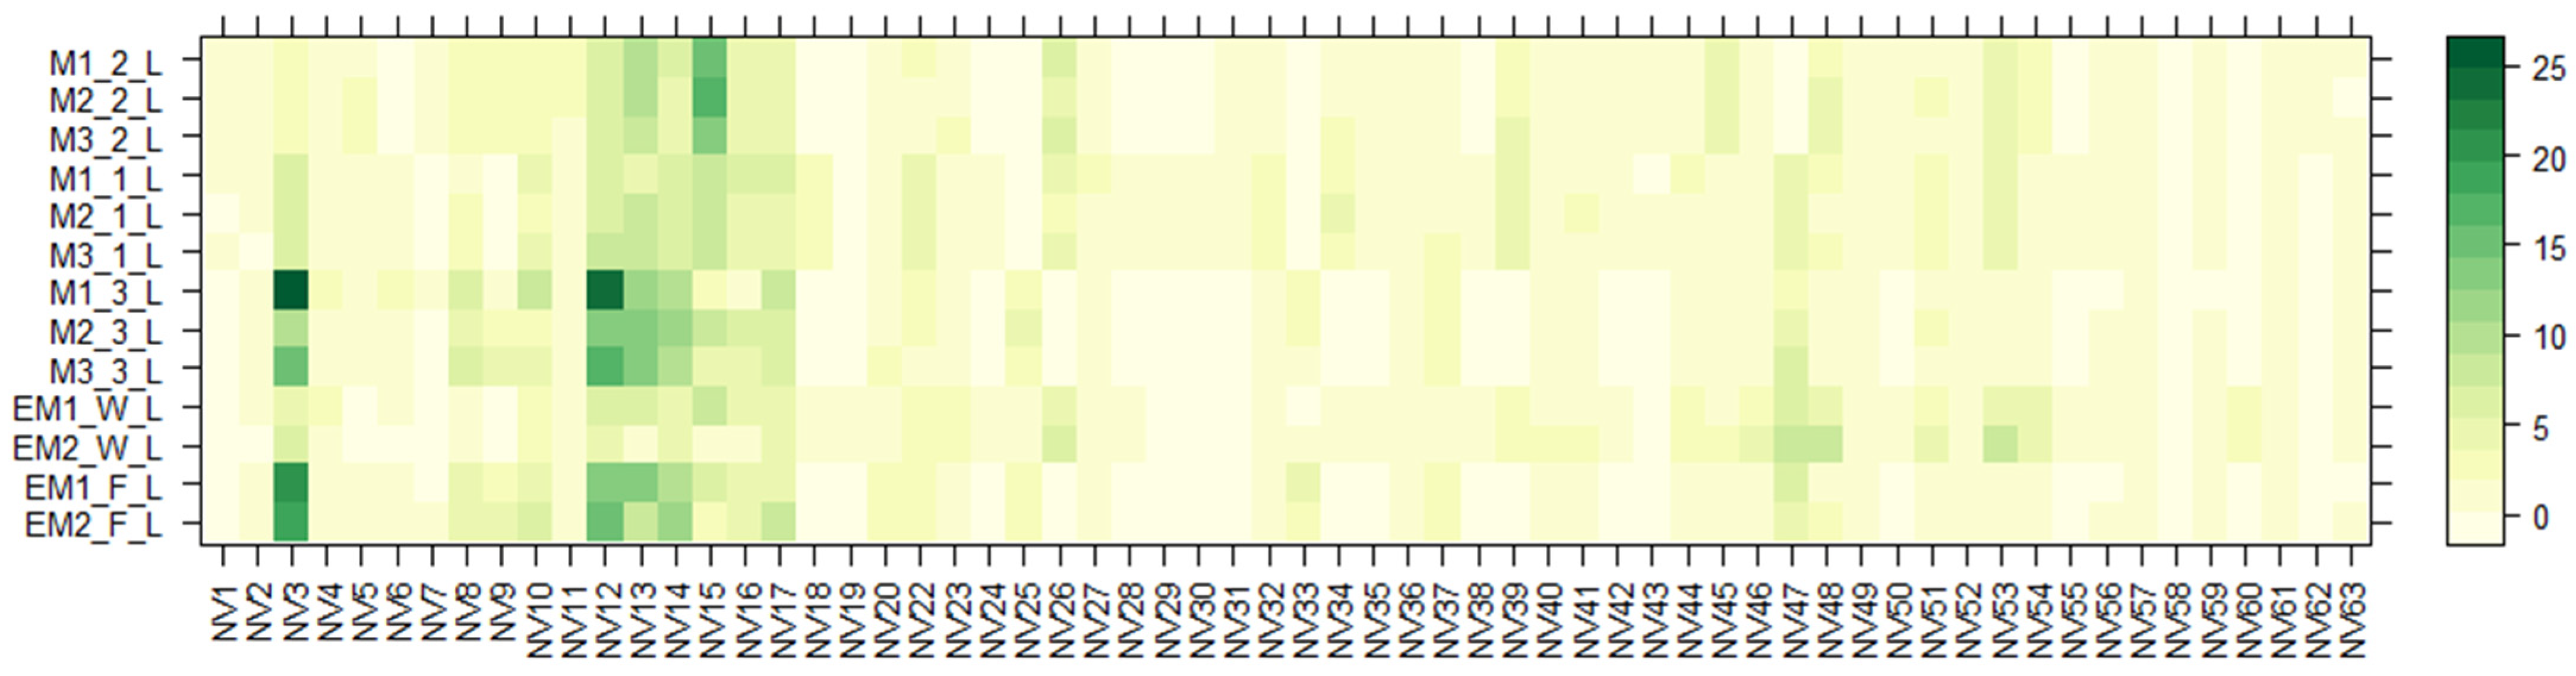
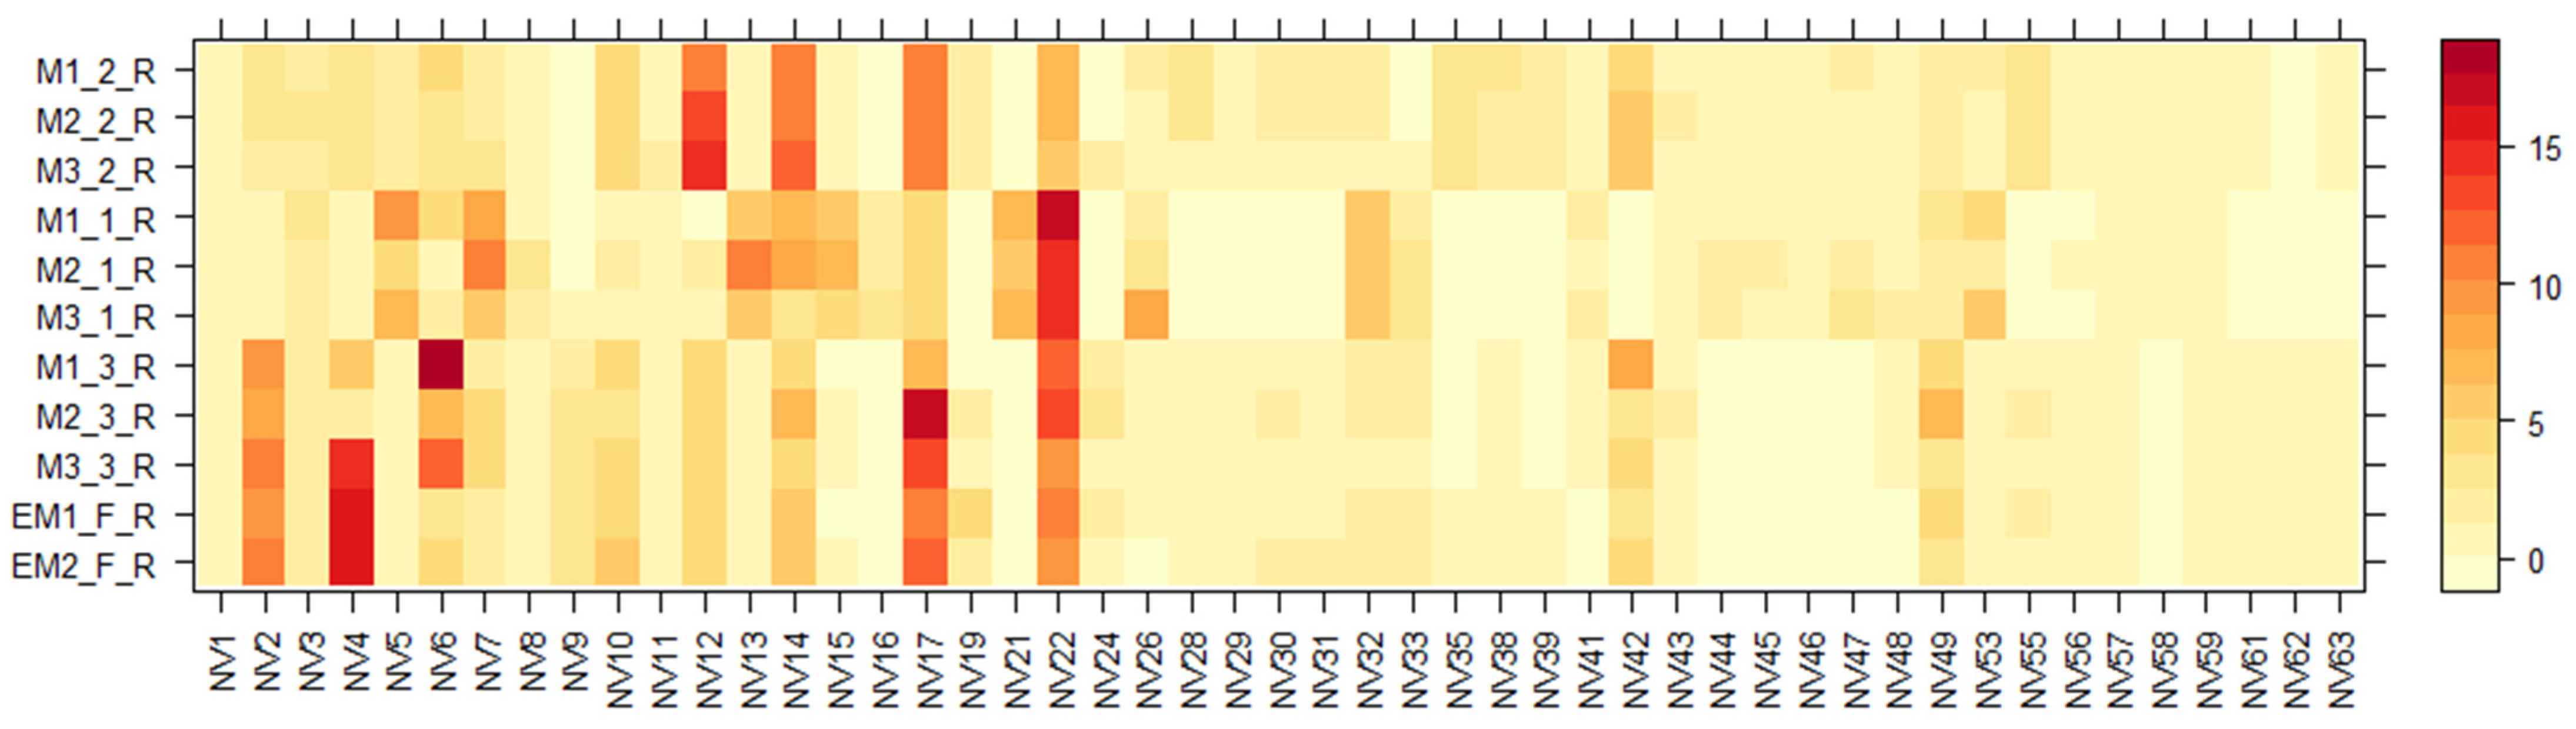
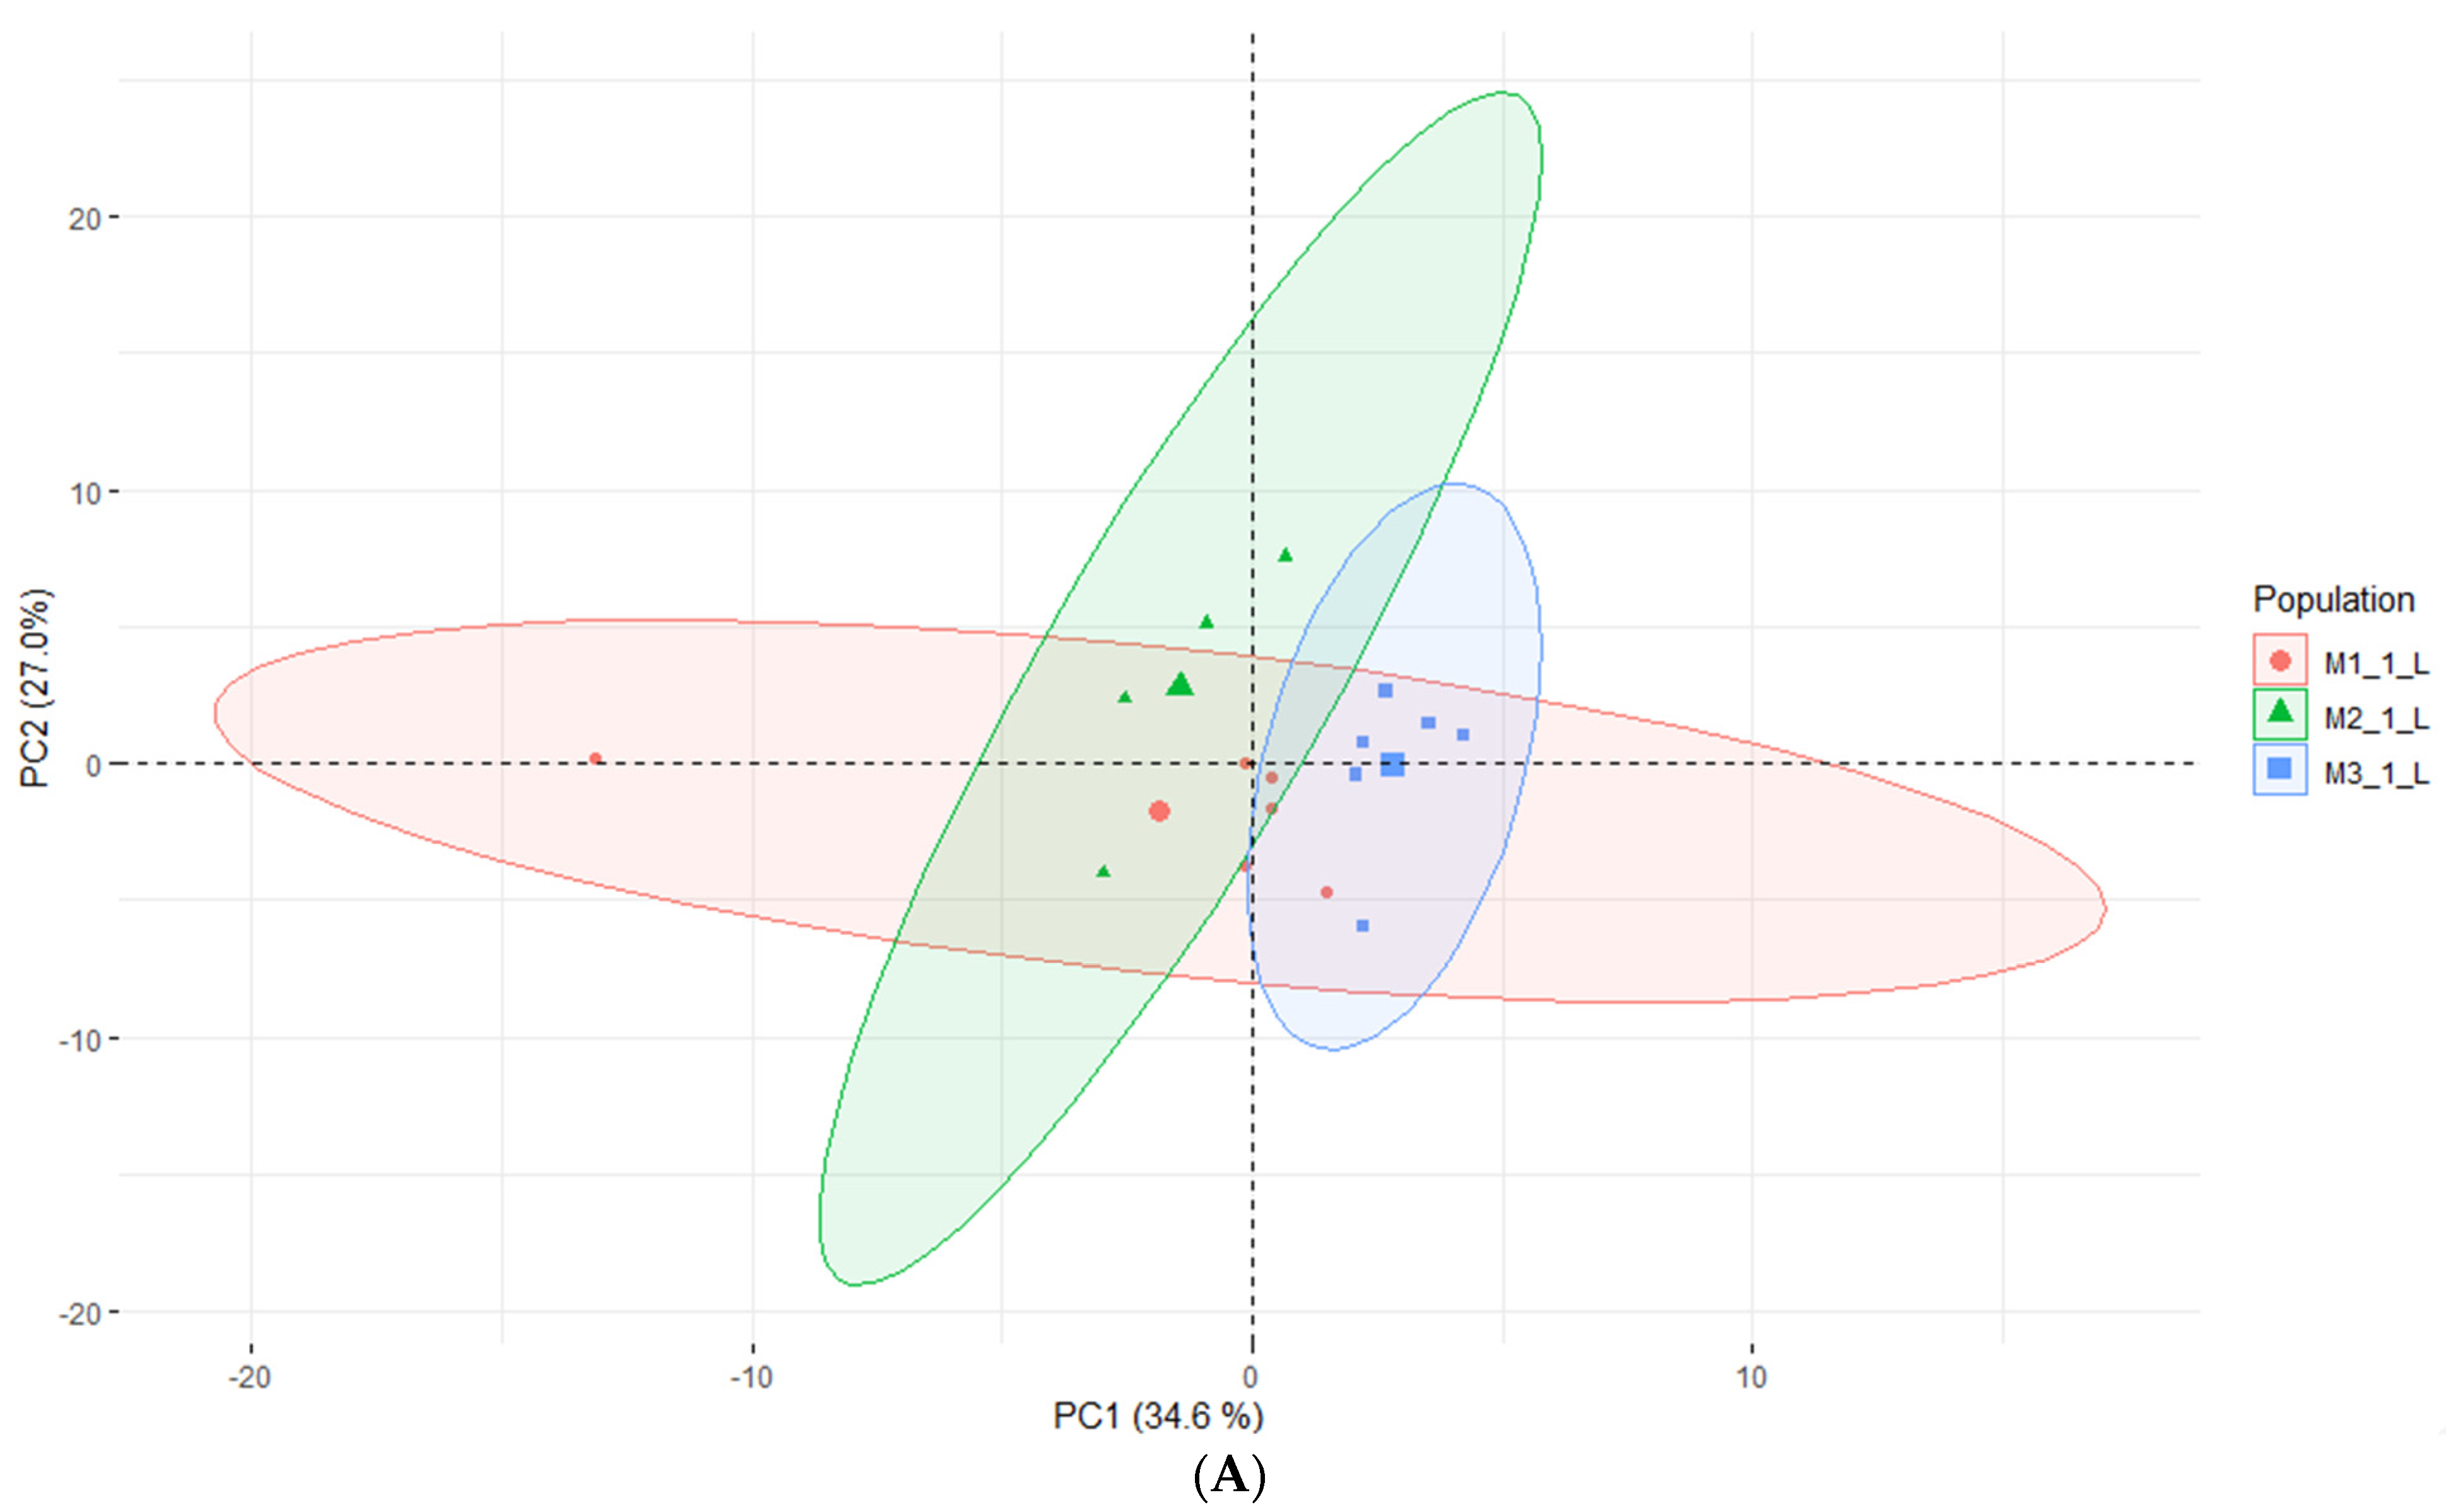
2.3. LC-MS of E. maritimum Plant Extracts

Using the UHPLC-ESI-q-TOF-MS technique, separation and tentative identification of nonvolatile (NV) compounds was performed on E. maritimum aqueous ethanolic extracts. The obtained results for all separated compounds are presented in Table 3. In total, sixty-three nonvolatile compounds (NV1-NV-63) were identified, including AA-amino acids, C-coumarins, CA-cinnamic acid derivatives, F-flavonoids, HC-hydroxycinnamic acid derivatives, O-oligosaccharides, OG-O-glycosyl compounds, PG-phenolic glycosides, QA-quinic acid derivatives, and TT-triterpenoids. As in previous studies [7,12,15,30], the non-volatile chemical compound composition of the root and leaf extracts of E. maritimum differ. Therefore, two heatmap diagrams (Figure 2 and Figure 3) were evaluated, which summarize the relative amounts (%) of all separated non-volatile compounds among all analyzed extracts.
According to Figure 2 and Figure 3, chemical composition varies between shoot and root organ systems as well as in plants obtained from different growing systems—wild, in vitro, or field conditions. One of the major groups that dominated in both leaf and root samples were amino acids (AA). A total of sixteen different amino acids and their derivatives, including seven essential AA, were detected. Several amino acids, even those that are not directly involved in making proteins, are found to play important roles in plant growth and response to changes in their environment. They are also the building blocks of many primary and secondary metabolites [47]. To determine the total yields, AA extracted from E. maritimum plant extracts were quantified by leucine equivalents, and their total amounts in mg per 100 g DW are summarized in Table 4. Total amino acid amounts ranged from 36.4 mg to 846.8 mg of leucine equivalents, with the highest amount released from in vitro micropropagated plant roots (M1(1); (2); (3)_R). The most dominant AA were leucine (NV12), isoleucine (NV10), phenylalanine (NV14), and tryptophan (NV17). These data are in agreement with those previously published by Taç and Özcan et al. [48], who analyzed E. maritimum plants located in dunes in Turkey and concluded that sea holly plants can be effectively used for biochemical and biotechnological applications in many different areas, including human nutrition and health.
The next dominant phytochemical group was hydroxycinnamic acid derivatives (HC), which include such compounds as neochlorogenic acid (NV21), chlorogenic acid (NV22), rosmarinic acid (NV49), and ferulol (NV43). This phytochemical class is one of the most often reported in E. maritimum samples [8,12,13,14,30,31]. The mean values of chlorogenic acid (CA) were generally higher in all our tested E. maritimum extracts, ranging from 15.0 mg to 5.75 g in 100 g DW, in comparison with rosmarinic acid (RA), ranging from 0.6 mg to 1.2 g in 100 g DW. However, in both cases, the most significant amounts appear in the roots of in vitro-cultured plants (M1_(1);(2);(3)_R). ANOVA revealed significant differences (p < 0.05) among growth conditions, while there were no significant differences between populations and plant parts. Large scale and long-term studies have been conducted to investigate the importance of RA and CA biosynthetic pathways in plants [49,50,51]; however, one thing is clear: regardless of the species, in plants these compounds can serve as one of the quality markers at every stage of plant development. According to Kikowska [6], RA and CA can be used as marker compounds to reveal how well different supplements work for E. maritimum micropropagation in vitro. By changing the concentration of auxins (indole-3-acetic acid (IAA), indole-3-butyric acid (IBA), or 1-naphthaleneacetic acid (NAA)) added, the concentration of RA and CA can be changed from 0.002 to 0.743 mg in 1 g DW. In the same study, similar relationships were observed: roots from in vitro-regenerated plants contain much higher yields of RA and CA compared with those from field-grown plants, while the concentration amounts between RA and CA were opposite to our study. No less important and characterized by a wide range of compounds is the class of flavonoids (F), which consists of fifteen separate compounds in total, mostly recognized as kaempferol, quercetin, luteolin, and isorhamnetin derivatives. It is believed that this compound class is among the ones contributing to antioxidant properties in a wide range aromatic plants used in the industries of food, pharmacy, and cosmetics [32]. E. maritimum is no exception, and the composition of flavonoids in it has been widely studied [12,15,20,27,30]. Although most of the authors performed spectrophotometric quantification of total flavonoids, finding their concentrations to be 24.3 mg quercetin equivalents (QE) in 1 g DW [41], 22 mg QE in 1 g DW [15], and 1.5 mg rutine equivalents (RE) in 1 g DW [13], estimation of total flavonoid amount using HPLC gave even lower amounts in the range of 0.29 to 0.34 mg in 1 g DW (originally 29.12 mg to 34.37 mg in 100 g DW) [7]. The observed trends are similar to our study: in the root samples they are found in a smaller number and yields compared to the leaf extracts. Because the separation and detection of triterpene saponins (TT) depend on several different parameters in the sample extraction process, as has already been said, we used spectrophotometric analysis to determine their total amount (TSC) in our study. With the help of the LC-qTOF-MS method, eryngioside derivative triterpenoids were found to be the most common saponins in the tested samples. Seven of them (NV56–NV59, NV61–NV63) were separated from E. maritimum tested extracts, but the presence of these compounds is mostly confirmed in other species, such as E. yuccifolium [52], E. alpinum [31], and E. planum [35]. According to Wang [23], eryngioside J and eryngioside L extracted from E. campestre showed moderate cytotoxic properties against different cell lines such as PANC-1, A-549, PC-3, HL-60, and MRC-5, indicating that triterpenoid saponins may provide an interesting lead for cancer drug development.

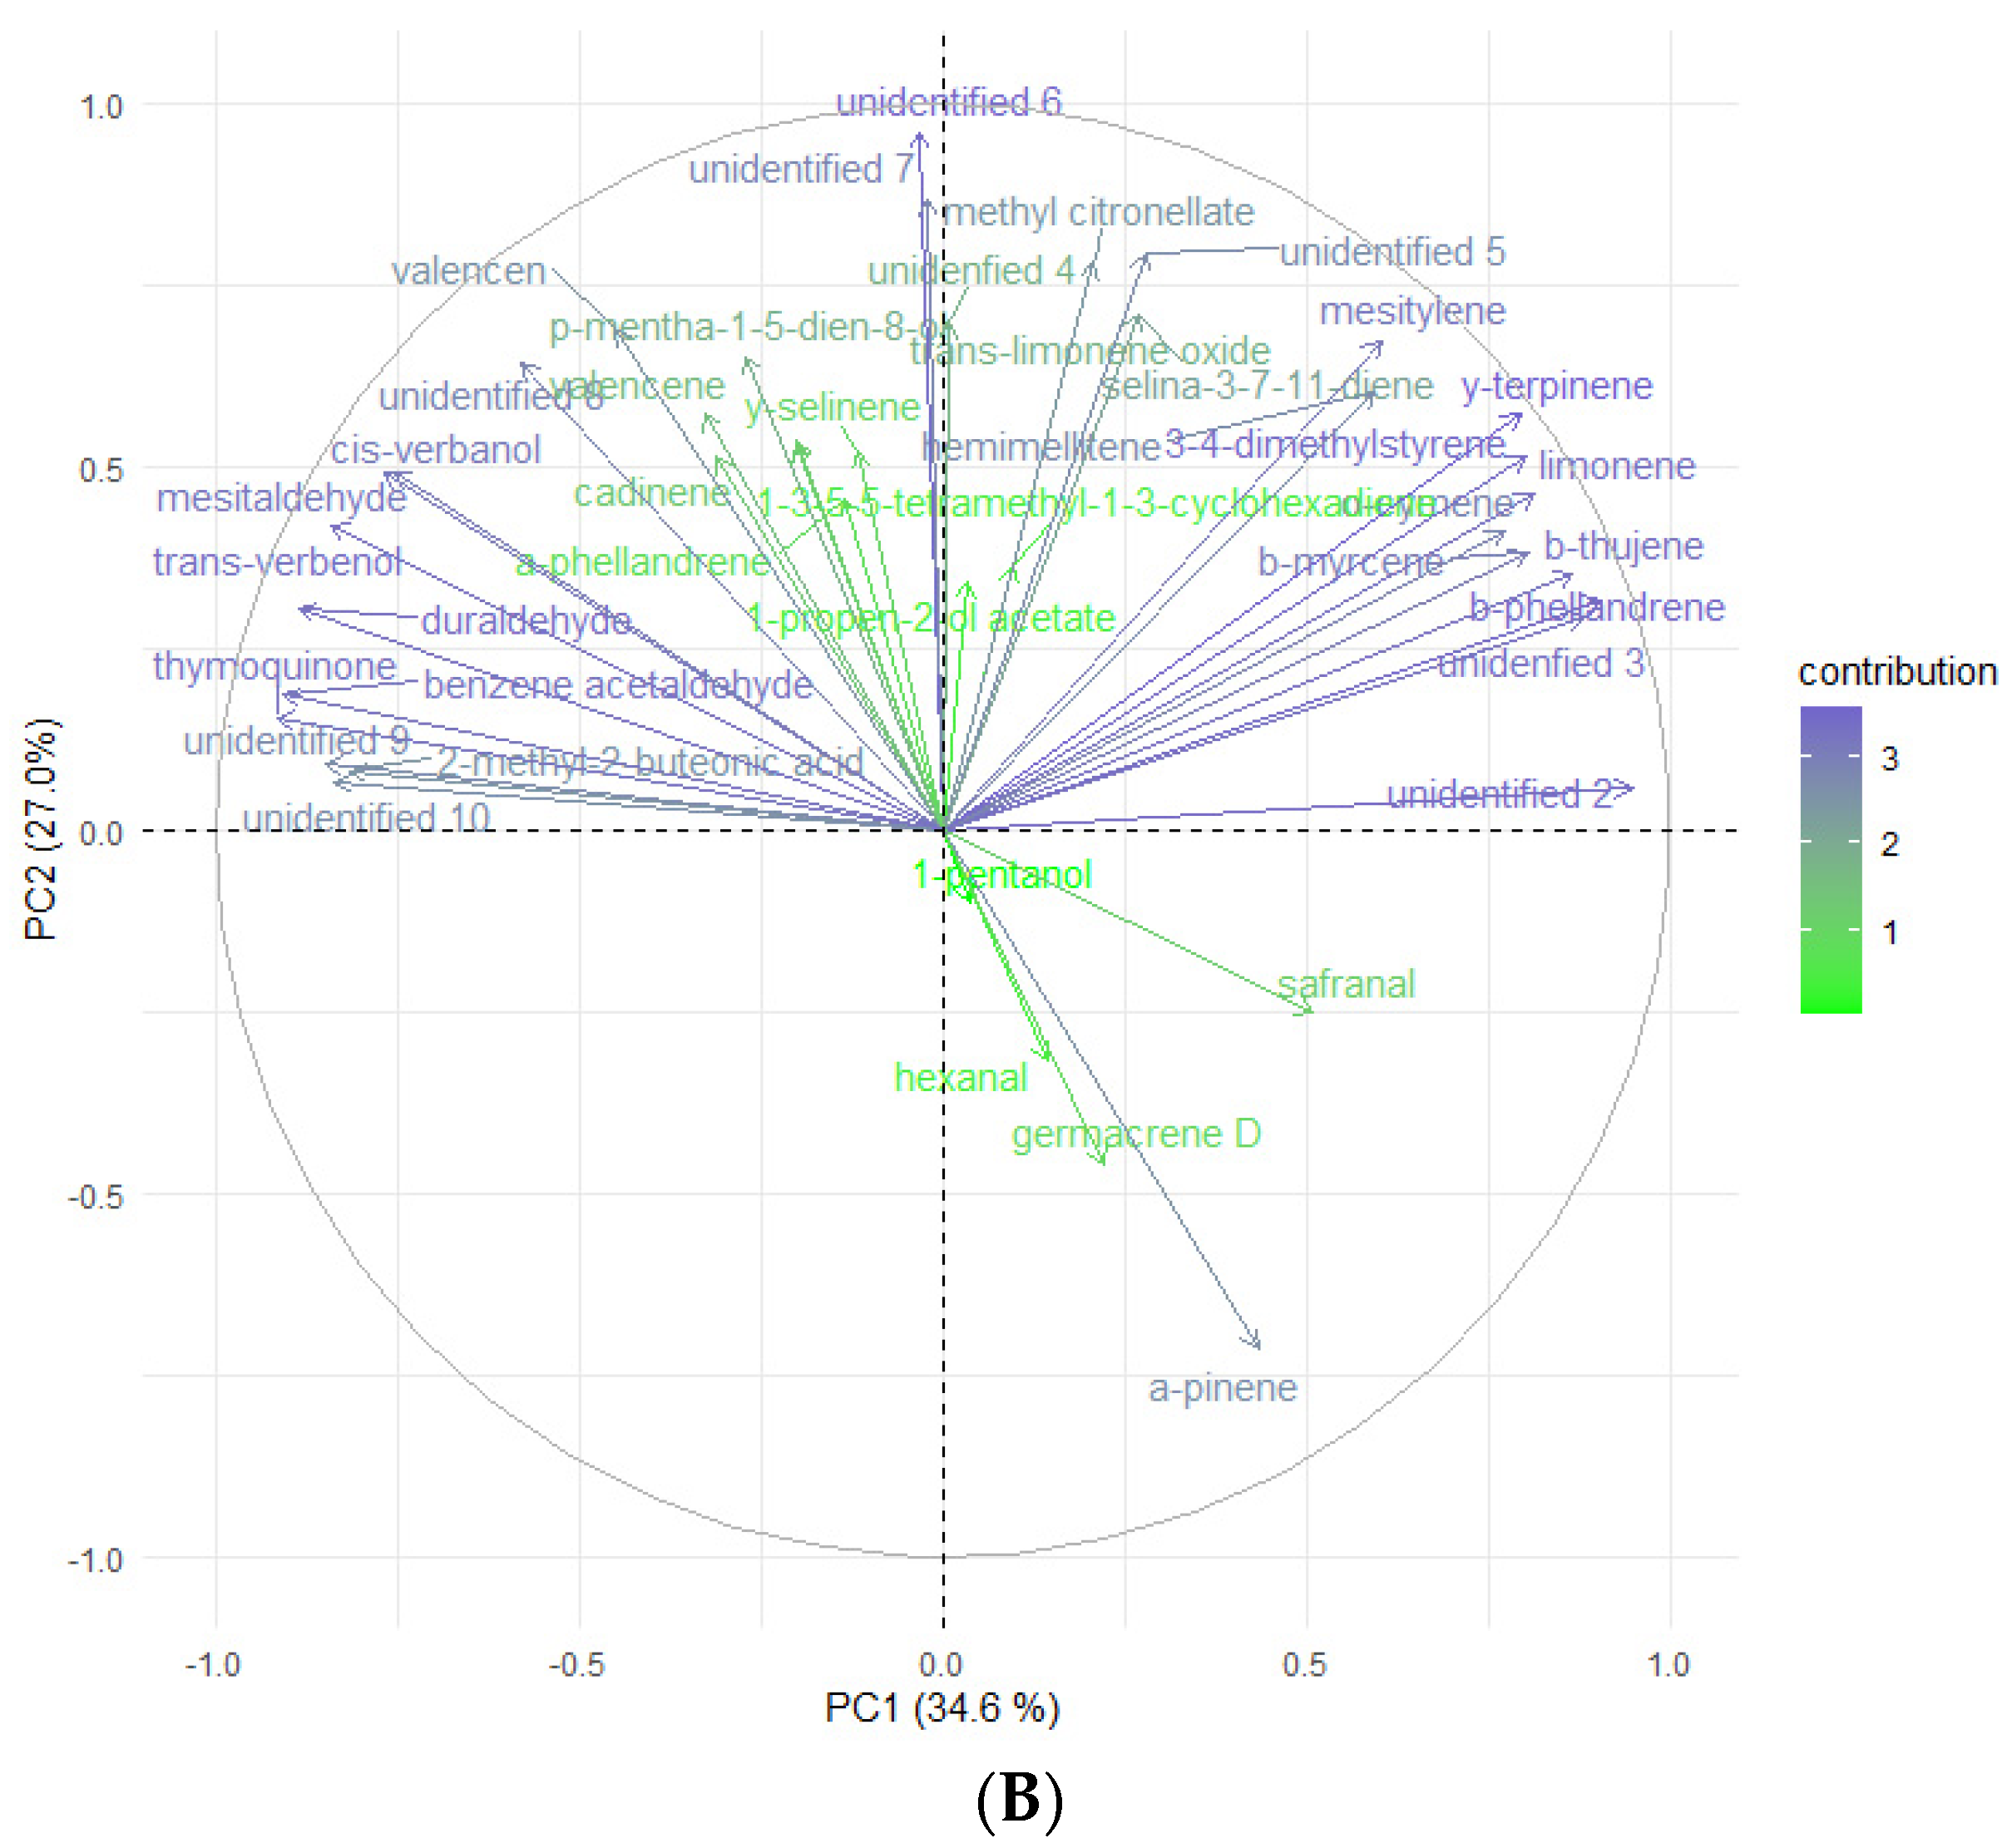
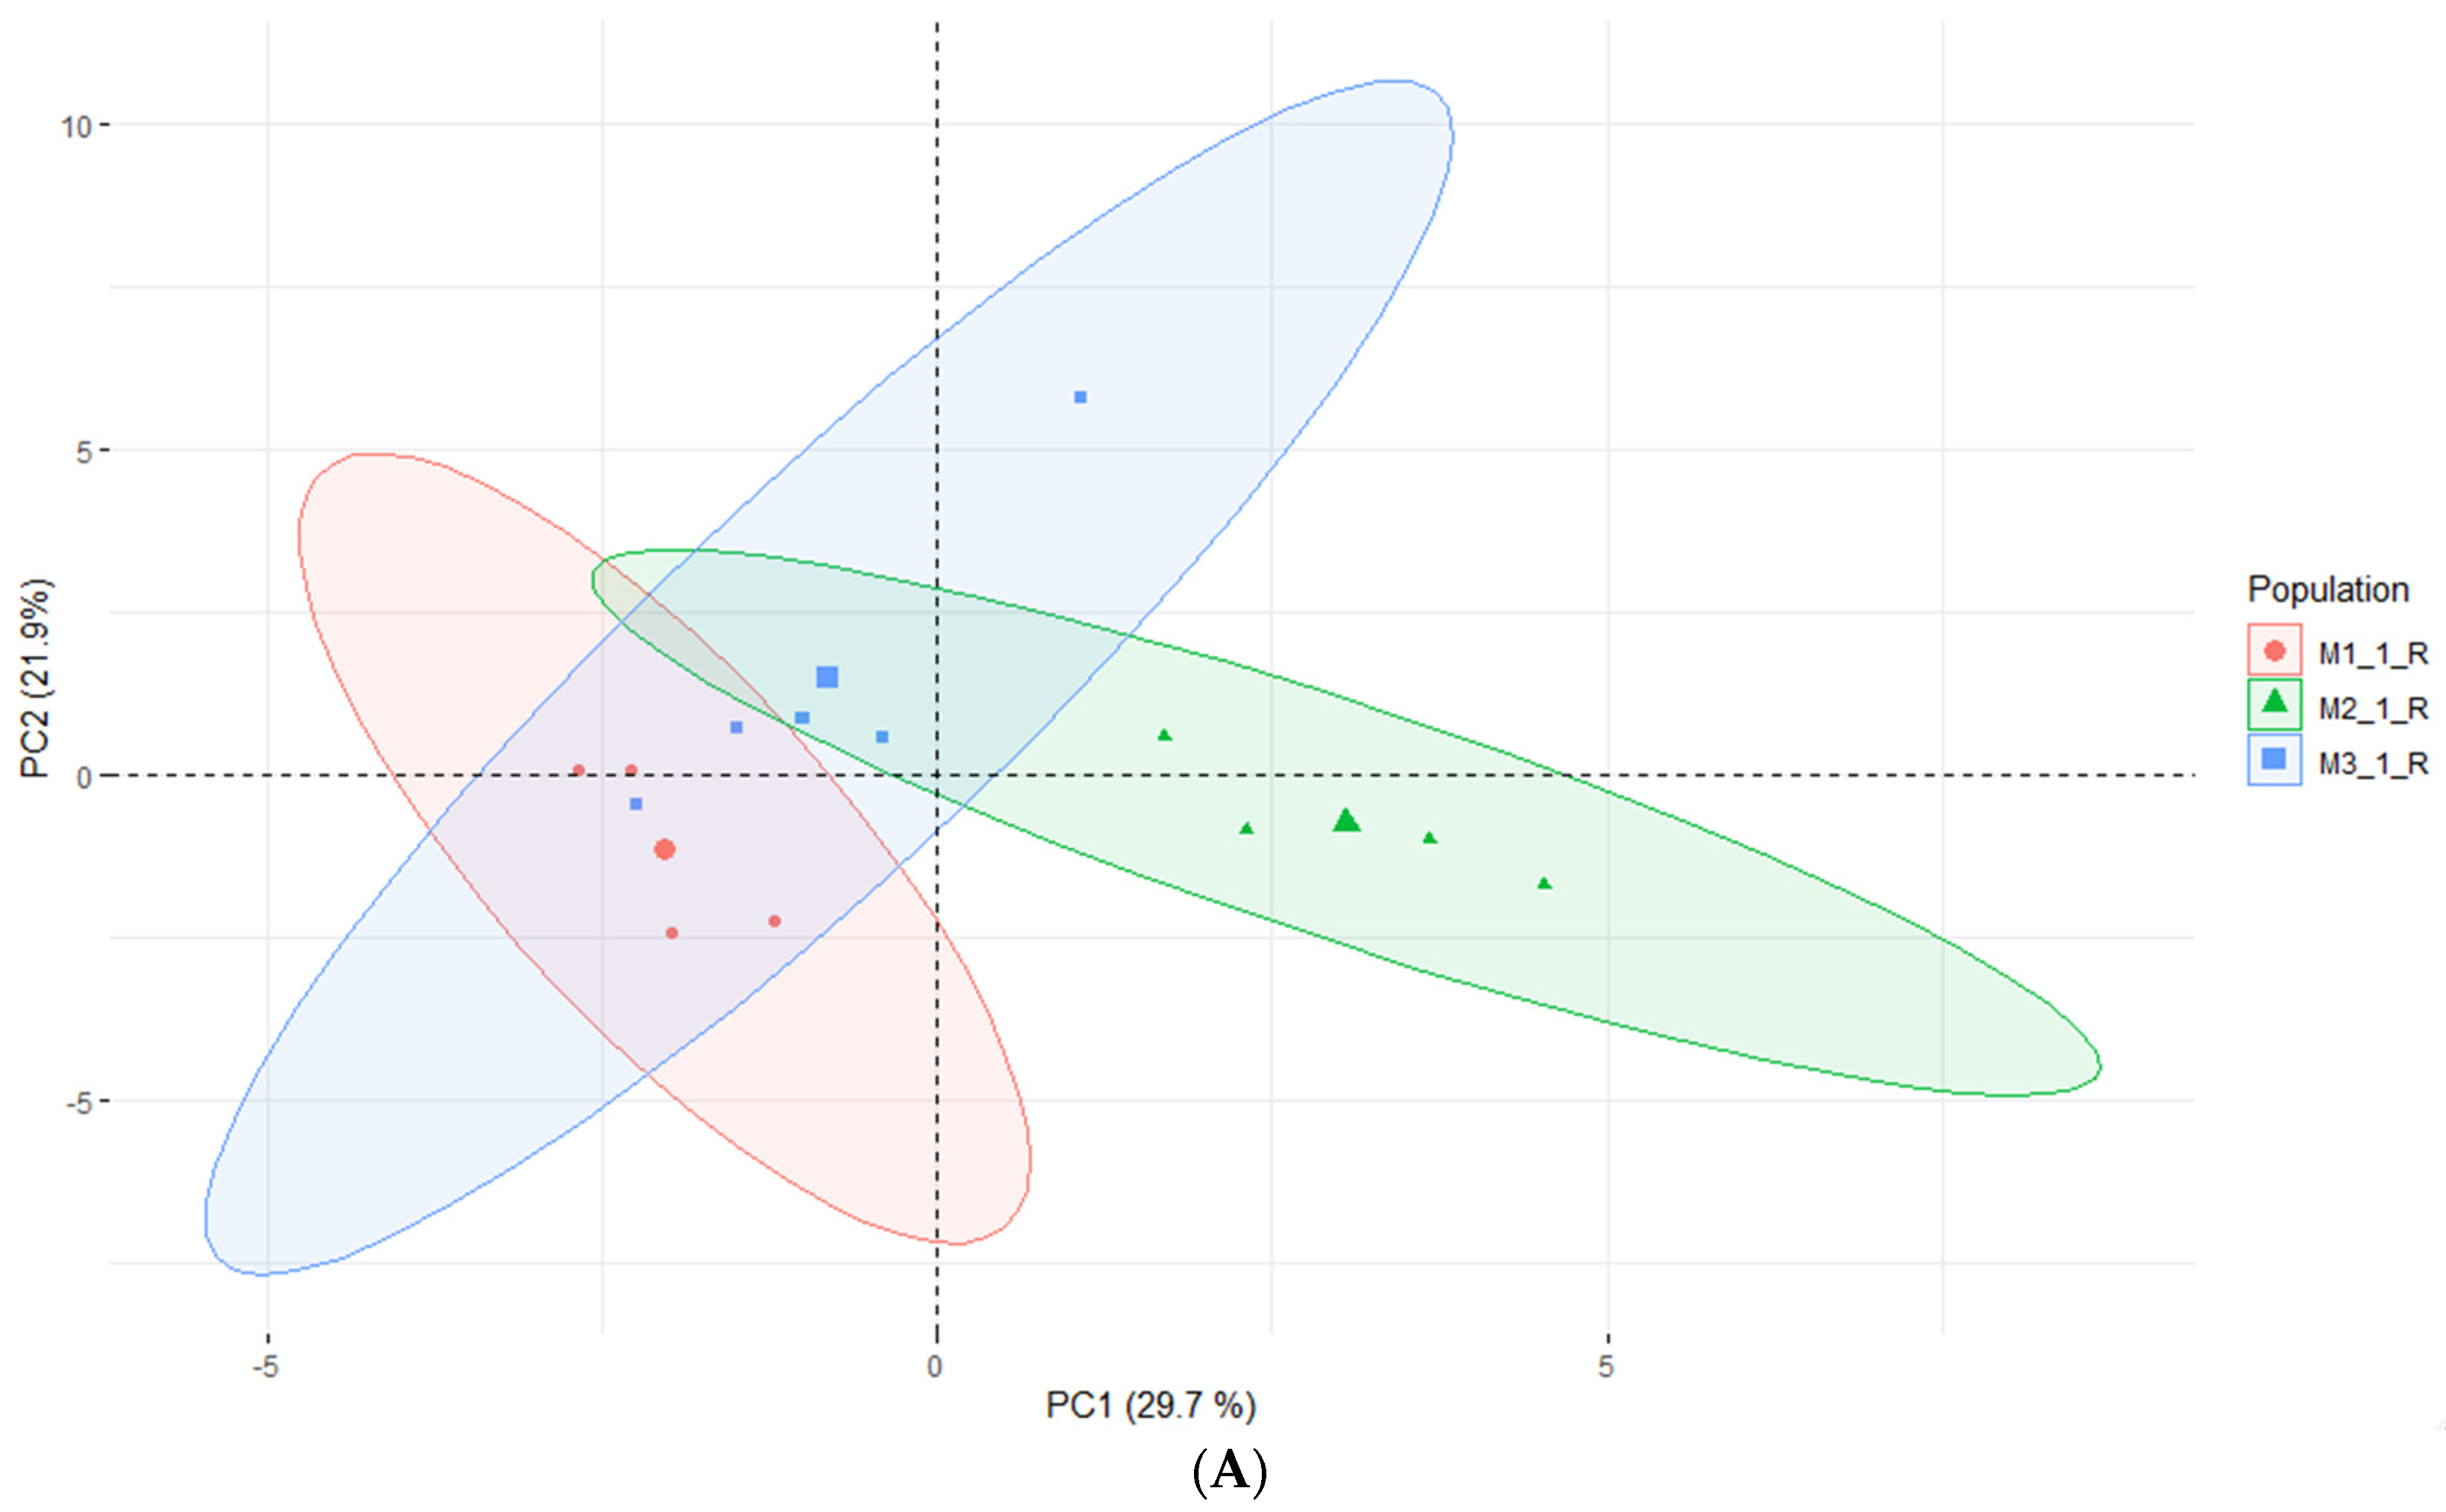
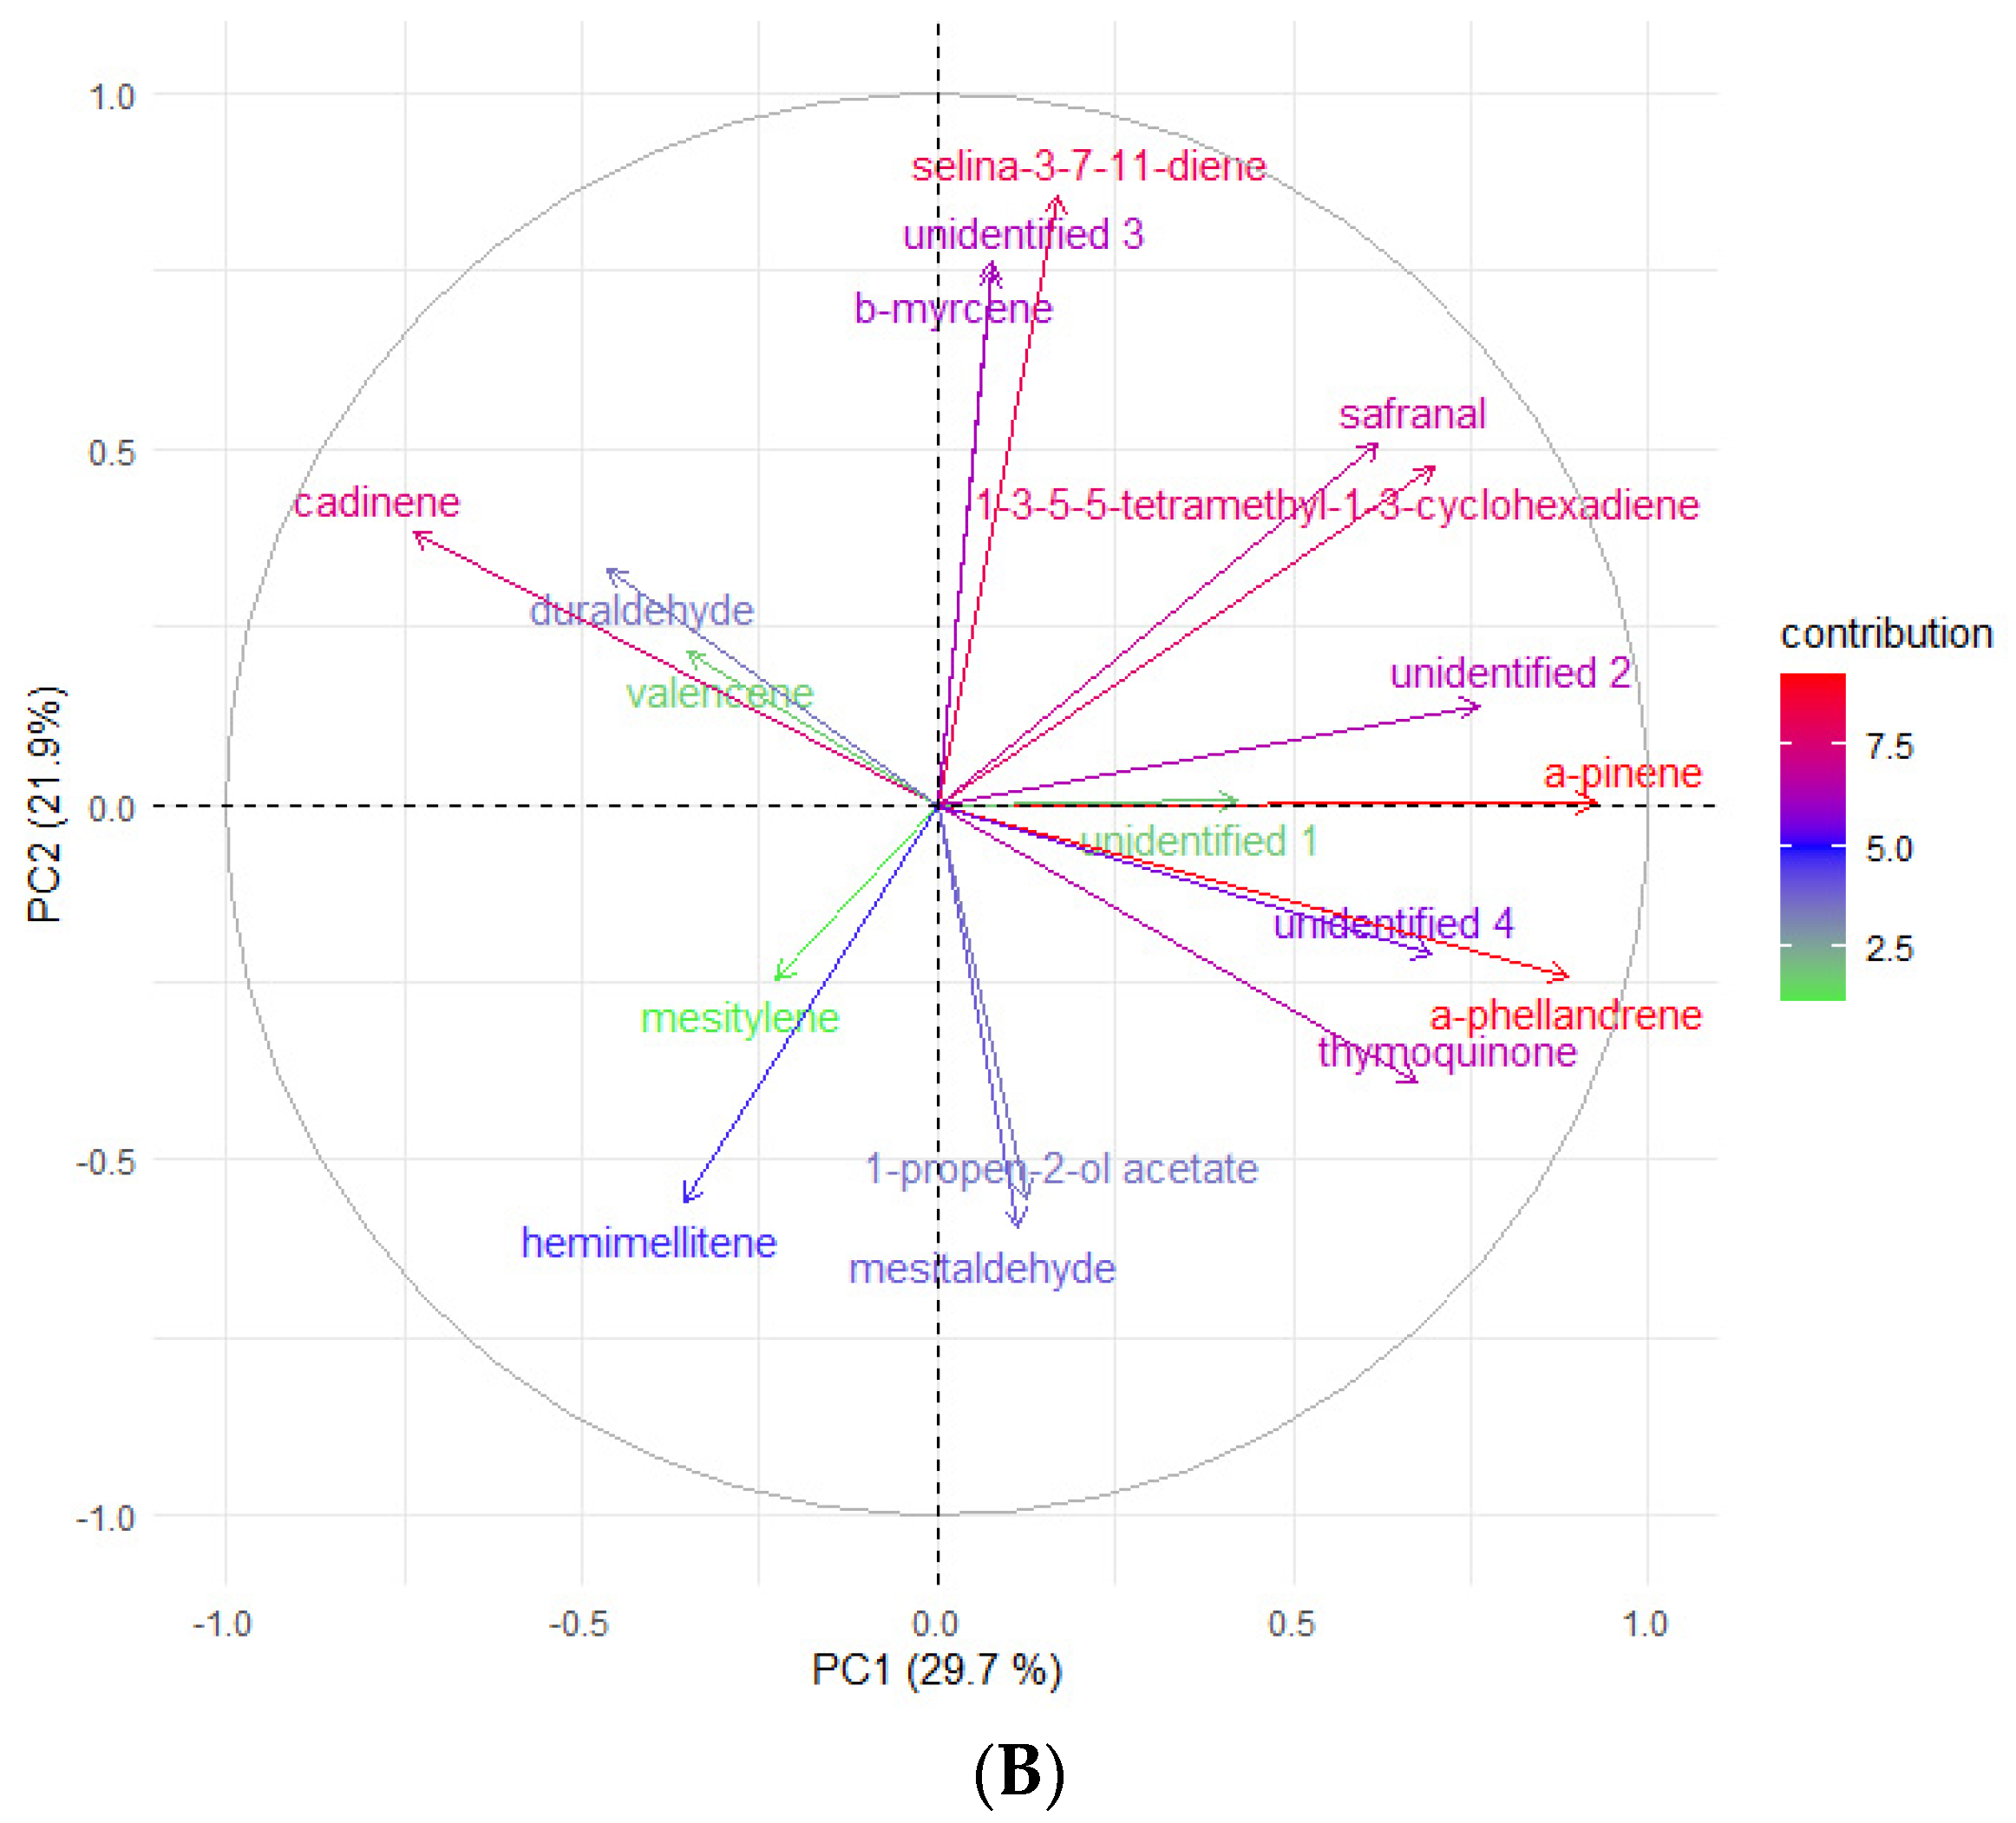
2.4. Headspace-GC-MS Analysis of E. maritimum In Vitro Micropropagated Plants

Headspace gas chromatography-mass spectrometry (HS-GC-MS) analysis is a powerful technique for analyzing the volatile organic compounds (VOCs) present in fresh aromatic plants [53]. These analyses can provide a detailed profile of the volatile compounds present in fresh aromatic plants, including their chemical structures, relative concentrations, and potential bioactivities, and they can be used as fast and simple indicators of plant material authenticity. The information that is gathered can be used in several ways. For example, it can be used as a chemotaxonomic tool between in vitro micropropagated plants and their field-adapted counterparts when only a small amount of plant biomass is available, such as with in vitro samples. As far the authors know, this study is the first to describe the chemical composition of volatiles extracted from freshly grown micropropagated plant parts (shoots and roots) of E. maritimum. Table 5 lists the identified volatile constituents and their relative percentages in the fresh headspace specimens. The analyses allowed the identification of 33 compounds in total: 33 for the leaves and 16 for the roots (99.1% and 99.9% of the total components detected, respectively).
According to Kikowska [5], the composition of essential oils obtained from in vitro shoots and analyzed by GC-FID-MS was very similar to that of leaf oil. Most of the identified compounds were found in both oils, and the dominant constituents were 2,3,4-trimethylbenzaldehyde, followed by trans-verbenol, germacrene D, and mesytilene. As shown in Table 5, while some compounds were consistent with the EO obtained from in vitro shoots (mesytilene, trans-verbenol, germacrene D), others were found in higher concentrations in the headspace samples. The most prevalent compounds were α-pinene, mesitaldehyde, duraldehyde, valencene, β-myrcene, mesitylene, and cadinene. The most common class of chemicals, as was expected given the employed technique (static headspace), were hydrocarbon monoterpenes and sesquiterpene hydrocarbons (lower boiling points). Using the HS data, the differences between the volatile organic compounds found in fresh shoots (Figure 4) and fresh roots (Figure 5) of E. maritimum in in vitro plantlets from three mericlones were evaluated using principal component analysis (PCA). Both root and shoot samples formed clusters according to mericlones. Clusters were partially overlapping, indicating that mericlones from the same population have both common and specific volatile organic compound profiles. Mericlone M3 occupied positive values of the first principal component, but most of the samples of M2 had negative ones. The major compounds contributing to the division were β-phellandrene, β-thujene, and limonene, for the positive values, and thymoquinine, trans-verbenol, and mesitaldehyde for the negative ones. All mericlones were equally distributed along the second principal component. Regarding root samples, most of the samples of mericlone M2 had positive scores for the first principal component (Figure 5), indicating higher values of α-pinene, α-phellandrene, 1,3,5,5-tetramethyl-1,3-cyclohexadiene, and thymoquinone. PCA clustered samples of mericlone M1 on the negative scores of the first principal component, indicating higher values of cadinene, duraldehyde, valencene, mesitylene, and hemimellitene.

3. Materials and Methods

3.1. Plant Materials

The seeds and leaves of E. maritimum were gathered in September 2020 from two wild populations in Latvia, near Ziemupe (EM1) (N 56°48′4″ E 21°4′4″) and Užava (EM2) (N 57°14′49″ E 21°25′52″). Permits for the collection of protected plants were obtained from the Nature Conservation Agency (decision no. 3.6/470/2020-N5 issued on 13 August 2020). The leaves of the 20 randomly sampled wild plants were used for chemical analysis (Table 6). Collected seeds were used for plant propagation in vitro as previously described [10]. The shoots and roots of micropropagated plantlets of three mericlones (M1, M2, and M3) of the population EM2 were subjected to chemical analysis. Micropropagated plantlets were adapted to ex vitro conditions for 60 days and further planted in field conditions in June 2021 and cultivated as previously described [10]. Roots and leaves were collected from the plantlets grown in field conditions for three months (September 2021) and at the next vegetation season (September 2022). Twenty plantlets each from different mericlone of populations EM1 and EM2 were sampled after three-month cultivation under field conditions. Three mericlones (M1, M2, and M3) of the population EM2 were sampled both after three-month cultivation and at the next vegetation season.

3.2. Chemicals and Reagents

The process of preparing the extract involved the use of ethanol (96%) sourced from Kalsnavas Elevators Ltd. (Jaunkalsnava, Latvia). LC-MS grade acetonitrile, methanol, and formic acid were procured from Fisher Scientific (Loughborough, UK), while water used for LC-qTOF-MS analysis was purified via a Smart2Pure water purification system (Thermo Scientific, Dreieich, Germany). Gallic acid, cyclohexane, xylene, ascorbic acid, and chlorogenic acid were obtained from Acros Organics (Geel, Belgium), and Na2CO3 was sourced from Honeywell (Charlotte, NC, USA). In addition, 2,2-diphenyl-1-picrylhydrazyl (DPPH) and phenol were purchased from Alfa Aesar (Kandel, Germany). We used Folin–Ciocalteu reagent, H2SO4, HNO3, HCl, and D-glucose, all of which were purchased from Fisher Scientific (Loughborough, UK). Standards of rosmarinic acid and leucine were obtained from Sigma-Aldrich (St. Louis, MO, USA).

3.3. Essential Oil Quantification and Volatile Profile Characterization by GC-MS

The plant samples were dried at 38 °C for analysis. The essential oils were prepared using a Clevenger-type hydrodistillation apparatus. In brief, 10 grams of powdered herbal drug were placed in a 500 mL flask, distilled water was added as the distillation liquid, and 0.50 mL of xylene was added to a graduated tube. The distillation process was carried out at a rate of 3–4 mL min−1 for 3 hours. The essential oil yield (mL kg−1) was calculated based on the dried weight of the samples. The oil was then separated and dried over anhydrous sodium sulfate to remove any moisture and preserved in a sealed amber glass vial at 4 °C until GC–MS analysis. For the volatile profile characterization of the essential oils, samples were diluted in cyclohexane, mixed, and injected into a GC-MS system. The analyses were conducted using an Agilent Technologies 7820A gas chromatograph equipped with an Agilent 5977B mass selective detector (MSD). The system utilized a non-polar HP-5 capillary column (60 m × 0.25 mm, 0.25 µm film thickness) coated with 5% phenyl and 95% methyl polysiloxane. Helium (He) was used as the carrier gas with a split ratio of 1:100 and a flow rate of 1.5 mL/min. A volume of 3 μL was injected, and the temperature program started at 70 °C and was then increased at a rate of 5 °C/min to 230 °C, followed by an increase to 295 °C at a rate of 7 °C/min. Finally, the temperature was maintained at 295 °C for 30 min, and the injector temperature was set at 270 °C. The mass spectra were recorded at 70 eV within a range of 70–500 m/z. The ion source temperature was maintained at 230 °C. The components were identified based on their retention indices, determined with reference to a homologous series of C5–C24 n-alkanes, and by comparison of their mass spectra with those stored in the National Institute of Standards and Technology (NIST) MS Search 2.2 library. The GC-MS data were analyzed using the Agilent MassHunter Qualitative Analysis 10.0 data acquisition software. The content of separated compounds was calculated in peak areas using the normalization method without correction factors (reported compound contents are only approximate without the determination of response factors).

3.4. The Identification and Quantification of Volatile Compounds by HS-GC-MS Analysis

Fresh sea holly leaves and roots were collected from experimental plants and were placed into 20 mL headspace vials. Analysis was carried out using a Gerstel MPS autosampler in conjunction with an Agilent Technologies 7820A gas chromatograph and Agilent 5977B mass selective detector (MSD). A polar CP-Wax 52CB capillary column (50 m × 0.32 mm, 0.20 µm film thickness) was used. The carrier gas was helium (He) with a split ratio of 1:50 and a flow rate of 1.0 mL min−1. The incubation temperature was 100 °C, the incubation period was 25 min, the agitator cycle was 30 s on and 15 s off, and the injection volume was 1700 μL. The temperature program was started at 60 °C and was then increased at a rate of 7 °C min−1 to 250 °C, which was then maintained for 2 min. The temperature of the injector was 250 °C. The mass spectra were recorded at 70 eV. The mass range was 50–650 m/z. The ion source temperature was maintained at 230 °C. The components were identified on the basis of their retention indices (calculated with reference to the homologous series of C5–C24 n-alkanes) by comparing their mass spectra to those in the National Institute of Standards and Technology (NIST) MS Search 2.2 library. To analyze GC-MS data, the Agilent MassHunter Qualitative Analysis 10.0 data program was utilized. The amount of separated compounds was calculated in peak areas using the normalization method without correction factors (reported compound contents are only approximate without the determination of response factors).

3.5. Extract Preparation for UHPLC-HRMS Analysis and 96-Well Plate Assays

For all studied samples (Table 6), aqueous ethanolic extracts of dried samples (leaves and roots) were prepared by dissolving the samples in 70% ethanol at a ratio of 1:10. Samples were mixed and heated at 70 °C for 60 min in an ultrasound bath. The samples were cooled and centrifuged for 10 min at 4400 rpm. The obtained solutions were filtered through a membrane filter with pores of 0.45 µm and diluted to an appropriate concentration for analysis.

3.6. UHPLC-HRMS Analysis

Using an Agilent 1290 Infinity II series HPLC system combined with an Agilent 6530 qTOF MS system, the undiluted extracts were analyzed. A Zorbax Eclipse Plus C18 Rapid Resolution HD column with a flow rate of 0.3 mL/min and column oven temperature of 50 °C was utilized. The sample injection volume was 3 μL, and the needle was washed for 30 s with 70% methanol. The mobile phase consisted of a combination of A (0.1% formic acid in water) and B (0.1% formic acid in acetonitrile), using a gradient elution program. This is how the gradient elution program was implemented: Initial 2%B, 0–2 min 2%B, 2–10 min 40%B, 10–20 min 80%B, 20–27 min 95%B, 27–40 min 95%B, 40–42 min 1%B. At 280 nm and 330 nm, the UV/Vis spectra were captured. The mass spectrometer was configured for 70 V fragmentation, 325 °C gas temperature, 10 L min−1 drying gas, 20 psi nebulizer pressure, 400 °C sheath gas temperature, and 12 L min−1 sheath gas flow. The source was electrospray ionization in positive mode. Mass spectra in the m/z range of 50 to 2000 were obtained using internal reference masses of 121.050873 m/z and 922.009798 m/z (G1969-85001 ESI-TOF Reference Mass Solution Kit, Agilent Technologies & Supelco). Using the Agilent MassHunter Qualitative Analysis 10.0 data acquisition software, the LC-MS data were analyzed. For the identification of isolated compounds, the Agilent MassHunter Metlin Metabolomics Database and LipidMaps Database were used. For quantification of individual compounds and classes, specific individual standards were prepared according to Table 7.

3.7. 96-Well Plate Assays

Samples were diluted with ethanol (96%) to obtain a minimum concentration of 10 mg mL−1. The amounts of total phenolic content (TPC), total sugars, and antiradical activity in the examined extracts were determined using an Epoch2 UV/VIS Microplate Spectrophotometer (BioTek, Agilent, Germany), in triplicate, as previously described by Nakurte et al. [46]. A modified anisaldehyde–sulfuric acid method was used to determine total saponin content (TSC) [54]. The experimental procedure is briefly described in Table 8.

3.8. Statistical Analysis

Levelplots, PCA, and one-way ANOVA test with scaled or non-scaled data were created in the R software version 4.2.3. The levelplots were createdusing the package “lattice”, while PCA was created with the package “factoMineR”. A one-way ANOVA test, followed by Tukey’s test (p < 0.05), was used to analyze the impact of growth condition, population, or plant part on the TPC, TSC, total sugar content, and ARA.

4. Conclusions

Considering the endangered status of E. maritimum, it is crucial to practice sustainable harvesting with appropriate regulations and permits in place to safeguard the plant and its ecosystem. Alternatively, the cultivation of sea holly under controlled conditions can be pursued to obtain its phytochemicals without compromising wild populations. In this regard, it is essential to conduct a comprehensive investigation of the chemical profile of the cultivated plants. The insights gained from such studies can be of immense value to the industry. During the implementation of this research, we successfully accomplished our objectives, which included a comparative analysis of the chemical composition of leaves from Eryngium maritimum wild-grown plants of Latvian origin, as well as the shoots and roots of micropropagated plantlets and the shoots and roots of field-grown plants. Essential oils were extracted from the plants by hydrodistillation. The results showed that leaves from wild plants contained 1.5–2.0 times less essential oil than plants grown in an agricultural field. Hydro-distilled essential oils were analyzed using GC-MS, and 44 distinct volatiles were detected. The predominant compounds found in both wild and cultivated samples were identified as 4βH-muurol-9-en-15-al, germacrene D, spathulenol, and 4βH-cadin-9-ent-15-ol. Forty-four different volatiles were identified in hydro-distilled essential oils by GC-MS, with the most common compounds being within wild and cultivated samples, these being 4βH-muurol-9-en-15-al, germacrene D, spathulenol, and 4βH-cadin-9-ent-15-ol. The aqueous ethanol extracts were evaluated for their ability to scavenge stable DPPH radicals and for their total phenolic, saponin, and sugar contents by high-throughput 96-well plate spectrophotometric assays. The results showed that the root and leaf extracts contained different chemical compositions, with leaves containing more phenolic compounds and roots containing more sugars. Triterpenoid saponin production by E. maritimum in in vitro root cultures was significantly lower than that of an intact plant, but both root and leaf samples of the same plant generated approximately the same total saponin amounts. This suggests that this plant may have potential health benefits, particularly in terms of its antioxidant and anti-inflammatory properties, including antimicrobial properties. Additionally, nonvolatile compounds were separated and analyzed using UHPLC-ESI-q-TOF-MS, revealing a total of sixty-three compounds, including amino acids, hydroxycinnamic acid derivatives, flavonoids, and others. The chemical composition was found to vary between the shoot and root organ systems as well as in plants obtained from different growing systems. Amino acids were found to be the most dominant group, with leucine, isoleucine, phenylalanine, and tryptophan being the most abundant; thus, the species has potential as a novel food plant as a source of essential amino acids. Hydroxycinnamic acid derivatives were also prominent, with chlorogenic acid being the most abundant compound. Flavonoids, consisting mostly of kaempferol, quercetin, luteolin, and isorhamnetin derivatives, were also identified. Even more, this study is the first to describe the chemical composition of volatiles extracted from the freshly grown micropropagated plant parts (shoots and roots) of E. maritimum using headspace gas chromatography-mass spectrometry. The abovementioned findings suggest that E. maritimum plants can be used for biochemical and biotechnological purposes in a variety of fields, including human nutrition and health.

Author Contributions

Conceptualization, I.N., M.B. and I.M.; methodology and investigation, I.N., M.B. and I.M.; data curation, I.N. and I.M.; writing—original draft preparation, I.N., M.B. and I.M.; writing—review and editing, I.N., M.B. and I.M.; visualization, I.N. and M.B.; supervision, I.N.; project administration, I.M. All authors have read and agreed to the published version of the manuscript.

Funding

This work was supported by the European Regional Development Fund project “Research on plant tissue culture application for commercial propagation of endangered medicinal plants” (No. 1.1.1.1/19/A/083).

Institutional Review Board Statement

Not applicable.

Informed Consent Statement

Not applicable.

Data Availability Statement

The data presented in this study are available on request from the corresponding authors.

Acknowledgments

The authors express their gratitude to Dace Kļaviņa from the National Botanical Garden of Latvia for her assistance with plant micropropagation. They would also like to thank Arta Kronberga, scientific manager of SIA “Field & Forest”, Laura Kaļāne, and Jessica Girardi, researchers of the Institute for Environmental Solutions, for their efforts in cultivating E. maritimum.

Conflicts of Interest

The authors declare no conflict of interest.

Sample Availability

Not applicable.

References

  1. Clausing, G.; Vickers, K.; Kadereit, J.W. Historical Biogeography in a Linear System: Genetic Variation of Sea Rocket (Cakile maritima) and Sea Holly (Eryngium maritimum) along European Coasts. Mol. Ecol. 2000, 9, 1823–1833. [Google Scholar] [CrossRef] [PubMed]
  2. Necajeva, J.; Ievinsh, G. Seed Dormancy and Germination of an Endangered Coastal Plant Eryngium maritimum (Apiaceae). Est. J. Ecol. 2013, 62, 150–161. [Google Scholar] [CrossRef]
  3. Ingelög, T.; Andersson, R.; Tjernberg, M. Red Data Book of The BALTIC Region; Swedish Treatened Species Unit in cooperation with the Institute of Biology: Uppsala, Sweden, 1993. [Google Scholar]
  4. Isermann, M.; Rooney, P. Biological Flora of the British Isles: Eryngium maritimum. J. Ecol. 2014, 102, 789–821. [Google Scholar] [CrossRef]
  5. Kikowska, M.; Kalemba, D.; Dlugaszewska, J.; Thiem, B. Chemical Composition of Essential Oils from Rare and Endangered Species—Eryngium maritimum L. and E. alpinum L. Plants 2020, 9, 417. [Google Scholar] [CrossRef] [PubMed]
  6. Kikowska, M.; Thiem, B.; Sliwinska, E.; Rewers, M.; Kowalczyk, M.; Stochmal, A.; Oleszek, W. The Effect of Nutritional Factors and Plant Growth Regulators on Micropropagation and Production of Phenolic Acids and Saponins from Plantlets and Adventitious Root Cultures of Eryngium Maritimum L. J. Plant Growth Regul. 2014, 33, 809–819. [Google Scholar] [CrossRef]
  7. Kikowska, M.; Chanaj-Kaczmarek, J.; Derda, M.; Budzianowska, A.; Thiem, B.; Ekiert, H.; Szopa, A. The Evaluation of Phenolic Acids and Flavonoids Content and Antiprotozoal Activity of Eryngium Species Biomass Produced by Biotechnological Methods. Molecules 2022, 27, 363. [Google Scholar] [CrossRef] [PubMed]
  8. Sultana, K.W.; Das, S.; Chandra, I.; Roy, A. Efficient Micropropagation of Thunbergia coccinea Wall. and Genetic Homogeneity Assessment through RAPD and ISSR Markers. Sci. Rep. 2022, 12, 1683. [Google Scholar] [CrossRef]
  9. Ayuso, M.; García-Pérez, P.; Ramil-Rego, P.; Gallego, P.P.; Barreal, M.E. In Vitro Culture of the Endangered Plant Eryngium viviparum as Dual Strategy for Its Ex Situ Conservation and Source of Bioactive Compounds. Plant Cell Tissue Organ Cult. 2019, 138, 427–435. [Google Scholar] [CrossRef]
  10. Mežaka, I.; Kļaviņa, D.; Kaļāne, L.; Kronberga, A. Large-Scale In Vitro Propagation and Ex Vitro Adaptation of the Endangered Medicinal Plant Eryngium maritimum L. Horticulturae 2023, 9, 271. [Google Scholar] [CrossRef]
  11. Lajnef, H.B.; Ferioli, F.; Pasini, F.; Politowicz, J.; Khaldi, A.; D’Antuono, L.F.; Caboni, M.F.; Nasri, N. Chemical Composition and Antioxidant Activity of the Volatile Fraction Extracted from Air-Dried Fruits of Tunisian Eryngium maritimum L. Ecotypes. J. Sci. Food Agric. 2018, 98, 635–643. [Google Scholar] [CrossRef]
  12. Erdem, S.A.; Nabavi, S.F.; Orhan, I.E.; Daglia, M.; Izadi, M.; Nabavi, S.M. Blessings in disguise: A review of phytochemical composition and antimicrobial activity of plants belonging to the genus Eryngium. DARU J. Pharm. Sci. 2015, 23, 53. [Google Scholar] [CrossRef] [PubMed]
  13. Kholkhal, W.; Ilias, F.; Bekhechi, C.; Bekkara, F. Eryngium maritimum: A rich medicinal plant of polyphenols and flavonoids compounds with antioxidant, antibacterial and antifungal activities. Curr. Res. J. Biol. Sci. 2012, 4, 437–443. [Google Scholar]
  14. Mejri, H.; Tir, M.; Feriani, A.; Ghazouani, L.; Allagui, M.; Saidani-Tounsi, M. Does Eryngium maritimum seeds extract protect against CCl4 and cisplatin induced toxicity in rats: Preliminary phytochemical screening and assessment of its in vitro and in vivo antioxidant activity and antifibrotic effect. J. Funct. Foods 2017, 37, 363–372. [Google Scholar] [CrossRef]
  15. Pereira, C.G.; Locatelli, M.; Innosa, D.; Cacciagrano, F.; Polesná, L.; Santos, T.F.; Rodrigues, M.J.; Custódio, L. Unravelling the potential of the medicinal halophyte Eryngium maritimum L.: In vitro inhibition of diabetes-related enzymes, antioxidant potential, polyphenolic profile and mineral composition. S. Afr. J. Bot. 2019, 120, 204–212. [Google Scholar] [CrossRef]
  16. Benmerache, A.; Magid, A.A.; Berrehal, D.; Kabouche, A.; Voutquenne-Nazabadioko, L.; Messaili, S.; Abedini, A.; Harakat, D.; Kabouche, Z. Chemical composition, antibacterial, antioxidant and tyrosinase inhibitory activities of glycosides from aerial parts of Eryngium tricuspidatum L. Phytochem. Lett. 2016, 18, 23–28. [Google Scholar] [CrossRef]
  17. Traversier, M.; Gaslonde, T.; Lecso, M.; Michel, S.; Delannay, E. Comparison of extraction methods for chemical composition, antibacterial, depigmenting and antioxidant activities of Eryngium maritimum. Int. J. Cosmet. Sci. 2020, 42, 127–135. [Google Scholar] [CrossRef]
  18. Seppic: Unique Ingredients, Created for Products Used Every Day. Available online: https://www.seppic.com/en (accessed on 29 April 2023).
  19. Fabbrimarine la Cosmetica Marina. Available online: https://www.fabbricosmetica.com/en (accessed on 29 April 2023).
  20. Petropoulos, S.A.; Karkanis, A.; Martins, N.; Ferreira, I.C.F.R. Edible halophytes of the Mediterranean basin: Potential candidates for novel food products. Trends Food Sci. Technol. 2018, 74, 69–84. [Google Scholar] [CrossRef]
  21. Rodrigues, T.L.M.; Silva, M.E.P.; Gurgel, E.S.C.; Oliveira, M.S.; Lucas, F.C.A. Eryngium foetidum L. (Apiaceae): A Literature Review of Traditional Uses, Chemical Composition, and Pharmacological Activities. Evid. Based Complement. Alternat. Med. 2022, 14, 2896895. [Google Scholar] [CrossRef]
  22. The Local Food-Nutraceuticals Consortium. Understanding local Mediterranean diets: A multidisciplinary pharmacological and ethnobotanical approach. Pharmacol. Res. 2005, 52, 353–366. [Google Scholar] [CrossRef]
  23. Wang, P.; Su, Z.; Yuan, W.; Deng, G.; Li, S. Phytochemical Constituents and Pharmacological Activities of Eryngium L. (Apiaceae). Pharm. Crop. 2012, 3, 99–120. [Google Scholar] [CrossRef]
  24. Maggio, A.; Bruno, M.; Formisano, C.; Rigano, D.; Senatore, F. Chemical Composition of the Essential Oils of Three Species of Apiaceae Growing Wild in Sicily: Bonannia graeca, Eryngium maritimum and Opopanax chironium. Nat. Prod. Commun. 2013, 8, 841–844. [Google Scholar] [CrossRef]
  25. Darriet, F.; Andreani, S.; De Cian, M.-C.; Costa, J.; Muselli, A. Chemical variability and antioxidant activity of Eryngium maritimum L. essential oils from Corsica and Sardinia. Flavour Fragr. J. 2014, 29, 3–13. [Google Scholar] [CrossRef]
  26. Beeby, E.; Magalhães, M.; Poças, J.; Collins, T.; Lemos, M.F.L.; Barros, L.; Ferreira, I.C.F.R.; Cabral, C.; Pires, I.M. Secondary metabolites (essential oils) from sand-dune plants induce cytotoxic effects in cancer cells. J. Ethnopharmacol. 2020, 258, 112803. [Google Scholar] [CrossRef]
  27. Matejić, J.S.; Stojanović-Radić, Z.Z.; Krivošej, Z.D.; Zlatković, B.K.; Marin, P.D.; Džamić, A.M. Biological activity of extracts and essential oils of two Eryngium (Apiaceae) species from the Balkan peninsula. Acta Med. Median. 2019, 58, 24–31. [Google Scholar] [CrossRef]
  28. Darriet, F.; Bendahou, M.; Desjobert, J.M.; Costa, J.; Muselli, A. Bicyclo[4.4.0]decane oxygenated sesquiterpenes from Eryngium maritimum essential oil. Planta Med. 2012, 78, 386–389. [Google Scholar] [CrossRef] [PubMed]
  29. Meot-Duros, L.; Le Floch, G.; Magné, C. Radical scavenging, antioxidant and antimicrobial activities of halophytic species. J. Ethnopharmacol. 2008, 116, 258–262. [Google Scholar] [CrossRef] [PubMed]
  30. Rjeibi, I.; Saad, A.B.; Ncib, S.; Souid, S. Phenolic composition and antioxidant properties of Eryngium maritimum (sea holly). J. Coast. Life Med. 2017, 5, 212–215. [Google Scholar] [CrossRef]
  31. Kikowska, M.; Kruszka, D.; Derda, M.; Hadaś, E.; Thiem, B. Phytochemical Screening and Acanthamoebic Activity of Shoots from in Vitro Cultures and in Vivo Plants of Eryngium alpinum L.—The Endangered and Protected Species. Molecules 2020, 25, 1416. [Google Scholar] [CrossRef]
  32. Ali, A.; Bashmil, Y.M.; Cottrell, J.J.; Suleria, H.A.R.; Dunshea, F.R. LC-MS/MS-QTOF Screening and Identification of Phenolic Compounds from Australian Grown Herbs and Their Antioxidant Potential. Antioxidants 2021, 10, 1770. [Google Scholar] [CrossRef]
  33. Mugford, S.T.; Osbourn, A. Saponin Synthesis and Function. In Isoprenoid Synthesis in Plants and Microorganisms; Bach, T., Rohmer, M., Eds.; Springer: New York, NY, USA, 2012; Volume 28, pp. 405–424. [Google Scholar] [CrossRef]
  34. Kikowska, M.; Długaszewska, J.; Kubicka, M.M.; Kędziora, I.; Budzianowski, J.; Thiem, B. In vitro antimicrobial activity of extracts and their fractions from three Eryngium L. species. Herba Pol. 2016, 62, 67–77. [Google Scholar] [CrossRef]
  35. Kowalczyk, M.; Masullo, M.; Thiem, B.; Piacente, S.; Stochmal, A.; Oleszek, W. Three new triterpene saponins from roots of Eryngium planum. Nat. Prod. Res. 2014, 28, 653–660. [Google Scholar] [CrossRef] [PubMed]
  36. Tembeni, B.; Oyedeji, O.O.; Manene, C.N.; Oyemitan, A.I.; Oyedeji, A.O. Anti-inflammatory, Analgesic Activity and Toxicity of Two Pelargonium inquinans Ait Essential Oils: Wild and Cultivated. J. Essent. Oil Bear. Plants 2019, 22, 1252–1264. [Google Scholar] [CrossRef]
  37. El Gendy, A.N.; Leonardi, M.; Mugnaini, L.; Bertelloni, F.; Ebani, V.V.; Nardoni, S.; Mancianti, F.; Hendawy, S.; Omer, E.; Pistelli, L. Chemical composition and antimicrobial activity of essential oil of wild and cultivated Origanum syriacum plants grown in Sinai, Egypt. Ind. Crop. Prod. 2015, 67, 201–207. [Google Scholar] [CrossRef]
  38. Sile, I.; Krizhanovska, V.; Nakurte, I.; Mezaka, I.; Kalane, L.; Filipovs, J.; Vecvanags, A.; Pugovics, O.; Grinberga, S.; Dambrova, M.; et al. Wild-Grown and Cultivated Glechoma hederacea L.: Chemical Composition and Potential for Cultivation in Organic Farming Conditions. Plants 2022, 11, 819. [Google Scholar] [CrossRef] [PubMed]
  39. Stanković, M.; Zlatić, N.; Mašković, J.; Mašković, P.; Jakovljević, D. Teucrium scordium L. and Mentha pulegium L. essential oil importance in adaptive response to salinity stress. Biochem. Syst. Ecol. 2022, 102, 104419. [Google Scholar] [CrossRef]
  40. Machado, M.; Santoto, G.; Sousa, M.C.; Salgueiro, L.; Cavaleiro, C. Activity of essential oils on the growth of Leishmania infantum promastigotes. Flavour Fragr. J. 2010, 25, 156–160. [Google Scholar] [CrossRef]
  41. Amessis-Ouchemoukh, N.; Madani, K.; Falé, P.L.V.; Serralheiro, M.L.; Araújo, M.E.M. Antioxidant capacity and phenolic contents of some Mediterranean medicinal plants and their potential role in the inhibition of cyclooxygenase-1 and acetylcholinesterase activities. Ind. Crop. Prod. 2014, 53, 6–15. [Google Scholar] [CrossRef]
  42. Cortés-Fernández, I.; Sureda, A.; Adrover, M.; Caprioli, G.; Maggi, F.; Gil-Vives, L.; Capó, X. Antioxidant and anti-inflammatory potential of rhizome aqueous extract of sea holly (Eryngium maritimum L.) on Jurkat cells. J. Ethnopharmacol. 2023, 305, 116120. [Google Scholar] [CrossRef]
  43. Küpeli, E.; Kartal, M.; Aslan, S.; Yesilada, E. Comparative evaluation of the anti-inflammatory and antinociceptive activity of Turkish Eryngium species. J. Ethnopharmacol. 2006, 107, 32–37. [Google Scholar] [CrossRef]
  44. Kwakman, P.H.S.; te Velde, A.A.; de Boer, L.; Vandenbroucke-Grauls, C.M.J.; Zaat, S.A.J. Two major medicinal honeys have different mechanisms of bactericidal activity. PLoS ONE 2011, 6, e17709. [Google Scholar] [CrossRef]
  45. Mizzi, L.; Maniscalco, D.; Gaspari, S.; Chatzitzika, C.; Gatt, R.; Valdramidis, V.P. Assessing the individual microbial inhibitory capacity of different sugars against pathogens commonly found in food systems. Lett. Appl. Microbiol. 2020, 71, 251–258. [Google Scholar] [CrossRef] [PubMed]
  46. Nakurte, I.; Berga, M.; Pastare, L.; Kienkas, L.; Senkovs, M.; Boroduskis, M.; Ramata-Stunda, A. Valorization of Bioactive Compounds from By-Products of Matricaria recutita White Ray Florets. Plants 2023, 12, 396. [Google Scholar] [CrossRef] [PubMed]
  47. Trovato, M.; Funck, D.; Forlani, G.; Okumoto, S.; Amir, R. Amino Acids in Plants: Regulation and Functions in Development and Stress Defense. Front. Plant Sci. 2021, 12, 772810. [Google Scholar] [CrossRef]
  48. Taç, S.; Özcan, T. Fatty Acid and Amino Acid Profiles in Some Dune Vegetation Species from Istanbul. Süleyman Demirel Univ. J. Nat. Appl. Sci. 2019, 23, 892–903. [Google Scholar] [CrossRef]
  49. Trócsányi, E.; György, Z.; Zámboriné-Németh, É. New insights into rosmarinic acid biosynthesis based on molecular studies. Curr. Plant Biol. 2020, 23, 100162. [Google Scholar] [CrossRef]
  50. Guan, H.; Luo, W.; Bao, B.; Cao, Y.; Cheng, F.; Yu, S.; Fan, Q.; Zhang, L.; Wu, Q.; Shan, M. A Comprehensive Review of Rosmarinic Acid: From Phytochemistry to Pharmacology and Its New Insight. Molecules 2022, 27, 3292. [Google Scholar] [CrossRef] [PubMed]
  51. Magaña, A.A.; Kamimura, N.; Soumyanath, A.; Stevens, J.F.; Maier, C.S. Caffeoylquinic acids: Chemistry, biosynthesis, occurrence, analytical challenges, and bioactivity. Plant J. 2021, 107, 1299–1319. [Google Scholar] [CrossRef]
  52. Zhang, Z.; Li, S.; Ownby, S.; Wang, P.; Yuan, W.; Zhang, W.; Scott Beasley, R. Phenolic compounds and rare polyhydroxylated triterpenoid saponins from Eryngium yuccifolium. Phytochemistry 2008, 69, 2070–2080. [Google Scholar] [CrossRef]
  53. Belliardo, F.F.; Bicchi, C.C.; Cordero, C.C.; Liberto, E.; Rubiolo, P.; Sgorbini, B. Headspace-Solid-Phase Microextraction in the Analysis of the Volatile Fraction of Aromatic and Medicinal Plants. J. Chromatogr. Sci. 2006, 44, 416–429. [Google Scholar] [CrossRef]
  54. Vador, N.; Vador, B.; Hole, R. Simple spectrophotometric methods for standardizing ayurvedic formulation. Indian J. Pharm. Sci. 2012, 74, 161–163. [Google Scholar] [CrossRef]
Figure 1. Essential oil content (mg mL−1) (EO) and heatmap of the chemical components of the essential oil of wild and field-grown E. maritimum over different samples and sample parts. The legend denotes scaled relative amounts of the volatile chemical constituents (V1–V44, according to Table 1). The deep purple color indicates higher concentrations, whereas the pale pink color indicates lower corresponding values.
Molecules 28 03924 g001
Figure 2. Variation in the non-volatile chemical components of the aqueous ethanolic extracts of E. maritimum leaves over different samples. The legend denotes scaled relative amounts (%) of the non-volatile chemical constituents (Table 3). The deep green color indicates higher concentrations, whereas the pale yellow-to-pale green color indicates lower corresponding values.
Molecules 28 03924 g002
Figure 3. Variation in the non-volatile chemical components of the aqueous ethanolic extracts of E. maritimum roots over different samples. The legend denotes scaled relative amounts (%) of the non-volatile chemical constituents (Table 3). The deep red color indicates higher concentrations, whereas the pale yellow-to-orange color indicates lower corresponding values.
Molecules 28 03924 g003
Figure 4. Principal component analysis (A) and contributions (B) referred to the main volatile organic compounds detected in the fresh leaves of E. maritimum in vitro samples.
Molecules 28 03924 g004aMolecules 28 03924 g004b
Figure 5. Principal component analysis (A) and contributions (B) referred to the main volatile organic compounds detected in the fresh roots of E. maritimum in vitro samples.
Molecules 28 03924 g005aMolecules 28 03924 g005b
Table 1. Volatile compound composition (%) in the essential oils made from the dried leaves and roots of wild and cultivated E. maritimum plants.
NoRI aCompound bComposition Range (Leaves)Composition Range (Roots)
V1921Cumene0.18–5.15n.d–2.39
V2937α-Pinene0.60–4.23n.d
V3972Mesitylenen.dn.d–0.83
V4990Pseudocumenen.dn.d–0.41
V51201Safranaln.dn.d–0.43
V61283α-Terpinen-7-aln.dn.d–0.19
V7956Dehydrosabinenen.dn.d–0.28
V81293Dihydroedulan0.61n.d
V91337Mesitaldehyden.d–1.5716.15–27.30
V101364Duraldehyde1.03–2.5927.62–34.16
V111376α-Copaenen.d–1.09n.d
V121384α-Bourbonenen.d–1.18n.d
V131448Isogermacrene Dn.d–0.72n.d
V141375Isoledenen.d0.56–1.31
V151464dehydro-Aromadendrenen.dn.d–0.42
V161481Germacrene D17.92–75.050.39–2.55
V171409α-Gurjunenen.d–1.140.12–0.88
V181492Valencenen.dn.d–1.05
V191499α-Muurolenen.d–4.8529.64–46.83
V201481Cadina-1(6),4-diene0.72–1.21n.d–1.10
V211506α-Farnesenen.d–1.67n.d
V221645δ-Cadinoln.d–1.55n.d–1.04
V2315731,5-epoxysalvial-4(14)-enen.d–2.29n.d
V241576Spathulenoln.d–8.02n.d
V251581Caryophyllene oxiden.d–3.45n.d
V261595Mint ketonen.d–3.09n.d
V271490β-Guaienen.dn.d–0.45
V281440Aromadendranen.d–0.91n.d
V291631Ledene oxide-(II)n.d–2.28n.d
V301695 4βH-Muurol-9-en-15-al n.d–33.79n.d
V311619Patchoulanen.d–1.02n.d
V321635β-Vatirenenen.d0.33–1.12
V331778Isovalencenoln.d–0.88n.d
V341648Alloaromadendrene oxide-1n.d–2.48n.d
V351640tau-Cadinoln.dn.d–0.36
V361671Eudesma-4,7-diene-1β-oln.d–11.95n.d
V371712(E)-γ-Atlantonen.d0.3–1.11
V382040Falcarinoln.d0.11–0.66
V391742 4βH-Cadin-9-en-15-ol n.d–5.14n.d
V401876Murolan-3,9(11)-diene-10-peroxyn.d–1.32n.d
V411762Methyl farnesaten.d–0.88n.d
V42177715-hydroxy-α-muurolenen.d–1.49n.d
V431837Neophytadienen.d–2.50n.d
V4418446,10,14-trimethyl-2-Pentadecanonen.d–0.59n.d
Yields, mL kg−11.52–5.431.42–2.85
a Experimental retention indexes (RI) were determined using the HP-5MS capillary column and was found to be consistent with values reported in the literature. b Based on a National Institute of Standards and Technology (NIST) MS Search 2.2 library. n.d—not detected.
Table 2. Content of total phenolics, saponins, sugars, and DPPH free radical scavenging activity of different E. maritimum ethanolic extracts.
Sample Code TPC a,
g GAE/100 g
TSC b,
g ESC/100 g
Sugars c,
g GLE/100 g
ARA d,
mg ASE/100 g
DPPH e Quenched, %IC50, µg/mL
EM1 W_L0.64 ± 0.108.39 ± 0.215.91 ± 0.2387.20 ± 1.2617.5 ± 0.6943.76 ± 1.51
EM2 W_L0.46 ± 0.036.51 ± 0.162.49 ± 0.1178.90 ± 1.1415.8 ± 0.6339.60 ± 1.38
EM1 F_L0.83 ± 0.073.95 ± 0.192.63 ± 0.1157.58 ± 0.8311.6 ± 0.4628.89 ± 0.99
EM2 F_L0.77 ± 0.056.04 ± 0.252.22 ± 0.0954.41 ± 0.7810.9 ± 0.4327.31 ± 0.94
EM1 F_R0.22 ± 0.026.77 ± 0.3012.76 ± 0.4819.47 ± 0.523.9 ± 0.219.77 ± 0.36
EM2 F_R0.19 ± 0.016.25 ± 0.2012.68 ± 0.4824.81 ± 0.605.0 ± 0.2712.45 ± 0.46
M1_1_L0.91 ± 0.126.64 ± 0.220.91 ± 0.05115.20 ± 1.6323.1 ± 0.8857.81 ± 1.96
M2_1_L0.85 ± 0.086.76 ± 0.320.85 ± 0.05102.00 ± 1.4720.5 ± 0.7851.19 ± 1.74
M3_1_L0.91 ± 0.098.27 ± 0.361.58 ± 0.07117.30 ± 1.6723.5 ± 0.9058.87 ± 2.00
M1_1_R0.97 ± 0.088.22 ± 0.4816.56 ± 0.50211.60 ± 2.9942.5 ± 1.61106.19 ± 3.51
M2_1_R0.94 ± 0.0710.27 ± 0.4416.62 ± 0.47202.90 ± 2.8840.7 ± 1.54101.83 ± 3.34
M3_1_R0.80 ± 0.069.62 ± 0.3415.48 ± 0.51201.60 ± 2.7340.5 ± 1.53101.17 ± 3.32
M1_2_L0.90 ± 0.078.64 ± 0.466.38 ± 0.24179.18 ± 2.5436.0 ± 1.3789.92 ± 2.93
M2_2_L1.02 ± 0.1110.07 ± 0.426.93 ± 0.26183.74 ± 2.6136.9 ± 1.4192.21 ± 3.01
M3_2_L0.89 ± 0.059.39 ± 0.105.84 ± 0.22170.33 ± 2.4134.2 ± 1.2985.48 ± 2.74
M1_2_R0.08 ± 0.012.97 ± 0.1221.85 ± 0.6534.24 ± 0.496.9 ± 0.2917.18 ± 0.64
M2_2_R0.10 ± 0.023.26 ± 0.1530.08 ± 0.7838.12 ± 0.557.7 ± 0.3319.13 ± 0.71
M3_2_R0.11 ± 0.023.14 ± 0.2230.36 ± 0.8741.79 ± 0.608.4 ± 0.3620.97 ± 0.78
M1_3_L0.58 ± 0.076.94 ± 0.244.06 ± 0.3464.79 ± 0.9313.0 ± 0.5332.52 ± 1.15
M2_3_L0.59 ± 0.057.18 ± 0.276.04 ± 0.3666.95 ± 0.9613.4 ± 0.5533.60 ± 1.21
M3_3_L0.60 ± 0.036.98 ± 0.185.45 ± 0.2769.81 ± 1.0014.0 ± 0.5935.04 ± 1.26
M1_3_R0.31 ± 0.025.53 ± 0.2027.67 ± 0.6741.62 ± 0.608.4 ± 0.3620.89 ± 0.78
M2_3_R0.37 ± 0.046.12 ± 0.3336.85 ± 0.5450.15 ± 0.7210.1 ± 0.4325.17 ± 0.93
M3_3_R0.27 ± 0.064.54 ± 0.2526.02 ± 0.4048.14 ± 0.709.7 ± 0.4124.16 ± 0.89
a Total phenolic content is expressed as the gallic acid equivalents per 100 g of dry weight (g GAE/100 g). b Total saponin content is expressed as the escin equivalents per 100 g of dry weight (g ESE/100 g). c Total sugar content is expressed as the glucose equivalents per 100 g of dry weight (g GLE/100 g). d ARA radical scavenging activity is expressed as the ascorbic acid equivalents per 100 g of dry weight (mg ASE/100 g). e DPPH radical scavenging activity of 10% extracts (on a dry basis) expressed in %.
Table 3. Tentative phytocomponents, extracted from the aqueous ethanol extracts of E. maritimum dried leaves and roots, detected by LC-qTOF-MS.
No.RT (min)Proposed CompoundTentative Molecular FormulaIon ModeTheoretical (m/z)Observed (m/z)Mass Error (ppm)Class a
NV11.34HistidineC6H9N3O2[M+H]+156.0768156.07640.4AA
NV21.36ArginineC6H14N4O2[M+H]+175.119175.11563.4AA
NV31.58SucroseC12H22O11[M+K]+381.0794381.08030.9O
NV41.61ProlineC5H9NO2[M+H]+116.0702116.06950.7AA
NV51.62MethionineC5H11NO2S[M+H]+150.0583150.05721.1AA
NV61.64GlutamineC5H10N2O3[M+H]+147.0764147.07720.8AA
NV71.65AsparagineC4H8N2O3[M+H]+133.0608133.0591.8AA
NV81.72N-(1-deoxy-D-fructos-1-yl)-L-ValineC11H21NO7[M+H]+280.1391280.13820.9AA
NV91.80ValineC5H11NO2[M+H]+118.0863118.08481.5AA
NV101.82IsoleucineC6H13NO2[M+H]+132.1019132.10210.2AA
NV112.18TyrosineC9H11NO3[M+H]+182.0812182.07971.5AA
NV122.29LeucineC6H13NO2[M+H]+132.1019132.10061.3AA
NV132.42N-(1-deoxy-D-fructos-1-yl)-L-LeucineC12H23NO7[M+H]+294.1562294.15731.1AA
NV143.84PhenylalanineC9H11NO2[M+H]+166.0863166.0851.3AA
NV153.96N-(1-deoxy-D-fructos-1-yl)-L-PhenylalanineC15H21NO7[M+H]+328.1503328.15161.3AA
NV165.07N-(1-deoxy-D-fructos-1-yl)-L-TryptophanC17H22N2O7[M+H]+367.1538367.15211.7AA
NV176.35TryptophanC11H12N2O2[M+H]+205.0972205.09831.1AA
NV186.967-methoxycoumarinC10H8O3[M+H]+177.0546177.05520.6C
NV197.00Methyl cinnamateC10H10O2[M+H]+163.0754163.07560.2CA
NV207.63Caffeic acid 3-O-glucuronideC15H16O10[M+K]+379.0636379.0640.4CA
NV217.71Neochlorogenic acidC16H18O9[M+H]+355.1024355.10522.8HC
NV227.88Chlorogenic acidC16H18O9[M+H]+355.1024355.10563.2HC
NV237.99p-Coumaric acid 4-O-glucosideC15H18O8[M+NH4]+344.1340344.13793.9PG
NV248.41alpha-L-Fucopyranosyl-(1->2)-beta-D-galactopyranosyl-(1->4)-D-glucose isomer IC18H32O15[M+H]+489.1814489.17991.5O
NV258.56Unknown compound---409.185--
NV269.19Kaempferol 3-O-(6″-malonyl-glucoside)C24H22O14[M+H]+535.1082535.1145.8F
NV279.25n-p-Coumaroylquinic acidC16H18O8[M+H]+339.1074339.10851.1QA
NV289.49alpha-L-Fucopyranosyl-(1->2)-beta-D-galactopyranosyl-(1->4)-D-glucose isomer IIC18H32O15[M+H]+489.1814489.17942.0O
NV299.97Phenolic glycosideC16H22O8[M+Na]+365.1207365.12150.8PG
NV309.98Phenolic glycoside IC16H24O7[M+H]+329.1595329.16141.9PG
NV319.99Phenolic glycoside IIC16H24O7[M+H]+329.1595329.16172.2PG
NV329.56n-Feruloylquinic acid IC17H20O9[M+H]+369.118369.11860.6QA
NV3310.01n-Feruloylquinic acid IIC17H20O9[M+H]+369.118369.11880.8QA
NV3410.108-Epiiridodial glucosideC16H26O7[M+NH4]+348.2017348.20473.0OG
NV3510.75Phenolic glycosideC19H26O10[M+NH4]+432.1864432.18922.8QA
NV3611.43Quercetin 3-O-galactoside 7-O-rhamnosideC27H30O16[M+H]+611.1607611.1621.3F
NV3711.56alpha-L-Rhamnopyranosyl-(1->3)-alpha-D-galactopyranosyl-(1->3)-L-fucoseC18H32O14[M+H]+495.1684495.187218.8O
NV3811.94Unknown compound---575.179--
NV3911.95Phenylethyl primeverosideC19H28O10[M+Na]+439.1575439.16022.7OG
NV4011.97Quercetin 3-O-glucoside C21H20O12[M+H]+465.1028465.10441.6F
NV4112.18Quercetin 3-O-(6″-malonyl-glucoside)C24H22O15[M+H]+551.1031551.10471.6F
NV4212.57Phenolic glycosideC19H26O10[M+H]+415.1599415.16717.2PG
NV4312.64FerulolC10H14O2[M+H]+167.1067167.10630.4HC
NV4412.76Luteolin 7-O-rutinoside/Kaempferol 3-O-galactoside C27H30O15[M+H]+595.1657595.16792.2F
NV4512.77Luteolin 6-C-glucoside/Kaempferol 3-O-galactosideC21H20O11[M+H]+449.1078449.10971.9F
NV4613.18Isorhamnetin 3-O-glucoside 7-O-rhamnosideC28H32O16[M+H]+625.1763625.17973.4F
NV4713.37Luteolin 6-C-glucoside/Kaempferol 3-O-galactosideC21H20O11[M+H]+449.1078449.11062.8F
NV4813.80Isorhamnetin 3-O-glucosideC22H22O12[M+H]+479.1184479.1190.6F
NV4913.84Rosmarinic acidC18H16O8[M+Na]+383.0737383.07320.5HC
NV5014.25Kaempferol 3-O-arabinosideC20H18O10[M+H]+419.0973419.09932.0F
NV5114.556″-MalonylastragalinC24H22O14[M+H]+535.1082535.10890.7F
NV5214.92Kaempferol 3-O-alpha-L-rhamnofuranosideC21H20O10[M+H]+433.1129433.11441.5F
NV5315.35Kaempferol 3-O-alpha-L-arabinopyranosyl-7-O-alpha-L-rhamnopyranosideC26H28O14[M+H]+565.1552565.15371.5F
NV5415.87Kaempferol 3-(6-acetylgalactoside)C23H22O12[M+H]+491.1184491.1212.6F
NV5516.07Unknown compound---341.1419--
NV5621.28Eryngioside F/Eryngioside H/Eryngioside IC52H82O21[M+Na]+1065.52411065.52480.7TT
NV5721.98Eryngioside JC54H84O23[M+Na]+1123.52961123.52970.1TT
NV5822.42Eryngioside CC54H88O24[M+Na]+1143.55581143.55560.2TT
NV5923.35Eryngioside F/Eryngioside H/Eryngioside IC52H82O21[M+Na]+1065.52411065.52440.3TT
NV6024.096-Hydroxykaempferol 3,6,7-triglucoside or other kaempferol triglucosideC33H40O22[M+H-H2O]+771.1984771.1980.4F
NV6124.67Eryngioside K/Eryngioside LC54H84O22[M+Na]+1107.53461107.5372.4TT
NV6224.67Eryngioside K/Eryngioside LC54H84O22[M+Na]+1107.53461107.53742.8TT
NV6325.12Eryngioside F/Eryngioside H/Eryngioside IC52H82O21[M+Na]+1065.52411065.52430.2TT
a Group of compounds: AA—amino acids, C—coumarins, CA—cinnamic acid derivatives, F—flavonoids, HC—hydroxycinnamic acid derivatives, O—oligosaccharides, OG—O-glycosyl compounds, PG—phenolic glycosides, QA—quinic acid derivatives, TT—triterpenoid.
Table 4. The content of total amino acids and two selected phenolic acids in the aqueous ethanolic extracts obtained from E. maritimum leaf and root samples.
SampleAmino Acids (AA), mg/100 g DWChlorogenic Acid (CA), mg/100 g DWRosmarinic Acid (RA), mg/100 g DW
EM1 W_L53.3 ± 1.6106.0 ± 1.72.8 ± 0.4
EM2 W_L29.5 ± 0.978.0 ± 2.12.3 ± 0.3
EM1 F_L49.5 ± 1.551.0 ± 1.10.9 ± 0.1
EM2 F_L67.9 ± 2.129.0 ± 0.60.9 ± 0.1
EM1 F_R36.5 ± 1.151.0 ± 1.24.0 ± 0.5
EM2 F_R38.1 ± 1.240.0 ± 0.92.3 ± 0.3
M1_1_L184.0 ± 4.3120.0 ± 2.0259.0 ± 3.2
M2_1_L187.6 ± 4.472.0 ± 1.2181.0 ± 2.3
M3_1_L180.5 ± 4.387.0 ± 1.5266.0 ± 3.3
M1_1_R414.2 ± 9.82360.0 ± 2.9674.0 ± 8.4
M2_1_R529.4 ± 12.62560.0 ± 2.8752.0 ± 9.4
M3_1_R846.8 ± 20.15750.0 ± 2.71202.0 ± 15.9
M1_2_L112.6 ± 2.7159.0 ± 2.33.2 ± 0.4
M2_2_L113.1 ± 2.7180.0 ± 1.84.8 ± 0.6
M3_2_L108.4 ± 2.6151.0 ± 2.04.9 ± 0.5
M1_2_R63.1 ± 1.561.0 ± 0.83.1 ± 0.4
M2_2_R66.0 ± 1.675.0 ± 1.23.7 ± 0.5
M3_2_R77.3 ± 1.866.0 ± 0.94.3 ± 0.6
M1_3_L36.4 ± 0.910.0 ± 0.30.6 ± 0.04
M2_3_L62.3 ± 1.625.0 ± 0.71.1 ± 0.09
M3_3_L50.8 ± 1.215.0 ± 0.41.1 ± 0.09
M1_3_R38.3 ± 0.961.0 ± 0.94.0 ± 0.5
M2_3_R44.5 ± 1.177.0 ± 1.36.6 ± 0.8
M3_3_R39.0 ± 0.938.0 ± 0.72.1 ± 0.2
Table 5. Volatile compound composition (%) in the fresh shoots and roots of E. maritimum in vitro samples.
RI *CompoundComposition Range (Shoots)Composition Range (Roots)
9041-Propen-2-ol acetaten.d.–1.451.94–10.27
979Pentanaln.d.–0.48n.d.
1028α-Pinene3.42–42.34n.d.–9.91
1083Hexanaln.d.–0.52n.d.
1117β-Thujene0.95–5.19n.d.
1161β-Myrcene4.97–17.76n.d.–1.19
1167α -Phellandrenen.d.–0.10n.d.–0.98
12021-Pentanoln.d.–0.85n.d.
1207Limonene2.1–7.87n.d.
1211β-Phellandrenen.d.–0.38n.d.
1246γ-Terpinenen.d.–0.43n.d.
1249o-Cymenen.d.–0.47n.d.
1251Mesitylene3.82–15.434.1–11.6
12563,4-Dimethylstyrenen.d.–0.84n.d.
1340Hemimellitene0.41–2.810.82–2.71
14061,3,5,5-Tetramethyl-1,3-cyclohexadiene0.34–0.89n.d.–1.01
1462trans-Limonene oxiden.d.–0.17n.d.
1582Methyl citronellate0.05–0.31n.d.
1616Safranal0.31–2.29n.d.–0.78
1640Benzeneacetaldehyden.d.–0.37n.d.
1663cis-Verbanol0.15–0.75n.d.
1685p-Mentha-1,5-dien-8-oln.d.–0.21n.d.
1687trans-Verbenol0.56–3.16n.d.
1689γ-Selinene0.25–0.51n.d.
1695Cadinene2.68–5.913.98–15.58
1710Germacrene Dn.d.–3.28n.d.
1729Valencene I9.47–19.852.25–21.67
1732Valencene IIn.d.–0.77n.d.–0.78
1792Selina-3,7(11)-dienen.d.–0.16n.d.–0.51
18222-Methyl-2-buteonic acidn.d.–7.20n.d.–2.12
1875Thymoquinonen.d.–0.80n.d.–1.19
1896Duraldehyde1.38–8.9911.16–29.61
1929Mesitaldehyde6.74–29.1733.77–48.67
Sum of unidentified0.89–10.450–27.15
* Retention indexes (RI) determined on the CP-Wax 52CB capillary column., based on NIST (National Institute of Standards and Technology) MS Search 2.2 library. n.d—not detected.
Table 6. Plant materials from E. maritimum used for phytochemical analyses.
Sample CodePlant PartGrowth ConditionsPopulationSample Type
EM1 W_LLeavesWildEM1Pooled sample of 20 individuals
EM2 W_LLeavesEM2
EM1 F_LLeavesField-grown, first vegetation seasonEM1Pooled sample of 20 individuals
EM2 F_LLeavesEM2
EM1 F_RRootsEM1
EM2 F_RRootsEM2
M1_1_LShootIn vitroEM2Sample of individual mericlones
M2_1_LShoot
M3_1_LShoot
M1_1_RRoots
M2_1_RRoots
M3_1_RRoots
M1_2_LLeavesField-grown, first vegetation seasonEM2Sample of individual mericlones
M2_2_LLeaves
M3_2_LLeaves
M1_2_RRoots
M2_2_RRoots
M3_2_RRoots
M1_3_LLeavesField-grown, second vegetation seasonEM2Sample of individual mericlones
M2_3_LLeaves
M3_3_LLeaves
M1_3_RRoots
M2_3_RRoots
M3_3_RRoots
Table 7. Standard solutions used for quantitative analyses.
CompoundClassPurityMass, mgVolume, mLStock Solution, mg/mLCalibration Range
LeucineAmino acids99%4.510 mL water0.450.1–10 μg/mL
R2 = 0.998
Chlorogenic acidHydroxycinnamic acids98%10.110 mL methanol1.010.1–100 μg/mL
R2 = 0.998
Rosmarinic acidHydroxycinnamic acids98%9.810 mL methanol0.980.1–100 µg/mL
R2 = 0.993
Table 8. A summary of the procedures for phytochemical screening using 96-well plate assays.
Carried TestProcedureWavelengthStandard and Concentration Range
Total phenolic content
(TPC)
25 µL of extract was mixed with 75 µL of H2O and 25 µL of Folin–Ciocalteu reagent (1:10) for 6 min. 100 µL of a 7% Na2CO3 solution was added; the plate was shaken for 30 s and left in a dark place at room temperature for 90 min. 765 nm0.025–0.20 mg mL−1 gallic acid solutions
Total saponin content (TSC)20 µL of the extract was mixed with 20 µL of 0.5% anisaldehyde (diluted with ethyl acetate) and allowed to react for 10 min in a dark place. Afterwards, 200 µL of 72% sulfuric acid was added and allowed to react for color development at 60 °C for 10 min.560 nm0.10–0.40 mg mL−1 escin solutions
Total sugar content
(Sugars)
50 µL of extract was mixed with 150 µL of H2SO4 and 30 µL of 5% phenol reagent before being heated in an oven at 90 °C for 5 min. After heating, the plates were cooled.490 nm0.045–0.90 mg mL−1 glucose solutions
Antiradical activity/
DPPH radical scavenging
(ARA/DPPH)
20 µL of extract was mixed with 180 µL of 150 µM DPPH reagent. The plate was kept in the dark at room temperature for 60 min. Different concentrations of the extract were tested to find the IC50, which is the concentration at which the absorbance of DPPH dropped by 50%.517 nm0.018–0.22 μg mL−1 ascorbic acid solutions
Disclaimer/Publisher’s Note: The statements, opinions and data contained in all publications are solely those of the individual author(s) and contributor(s) and not of MDPI and/or the editor(s). MDPI and/or the editor(s) disclaim responsibility for any injury to people or property resulting from any ideas, methods, instructions or products referred to in the content.

