

Endoplasmic Reticulum-Targeting Two-Photon Fluorescent Probe for CYP1A Activity and Its Imaging Application in Endoplasmic Reticulum Stress
 and
and 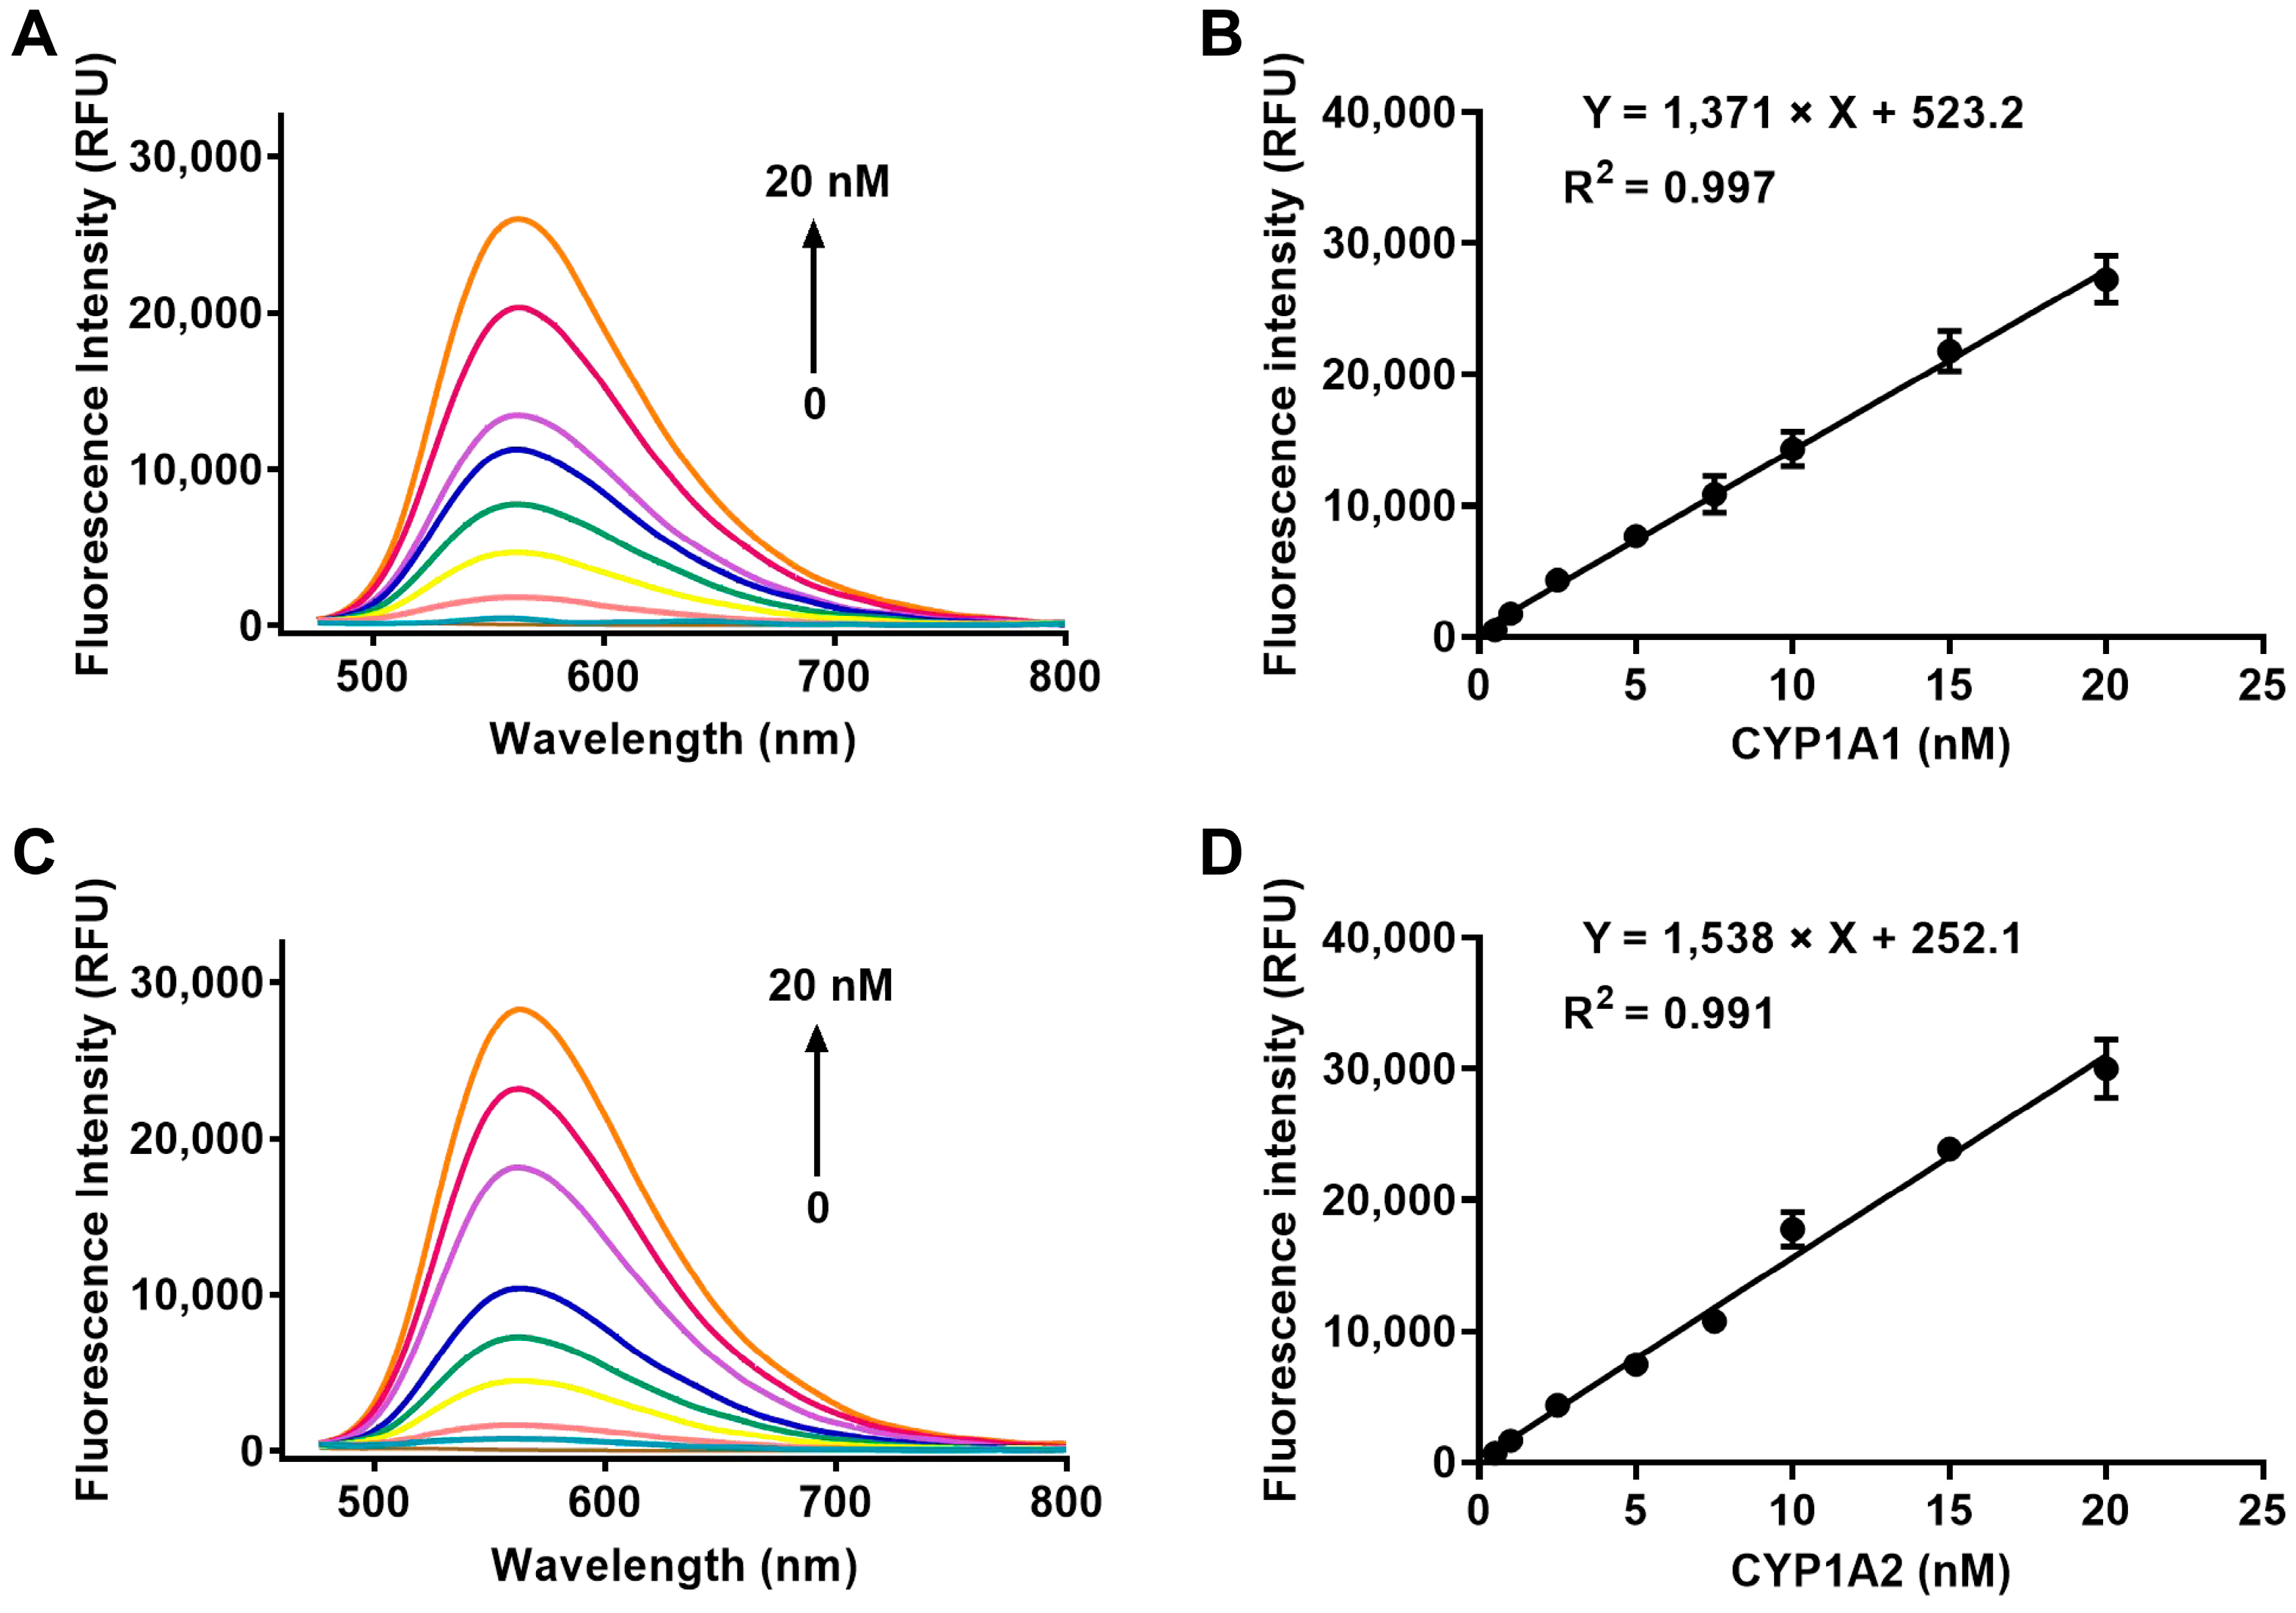
Abstract
:1. Introduction
2. Results and Discussion
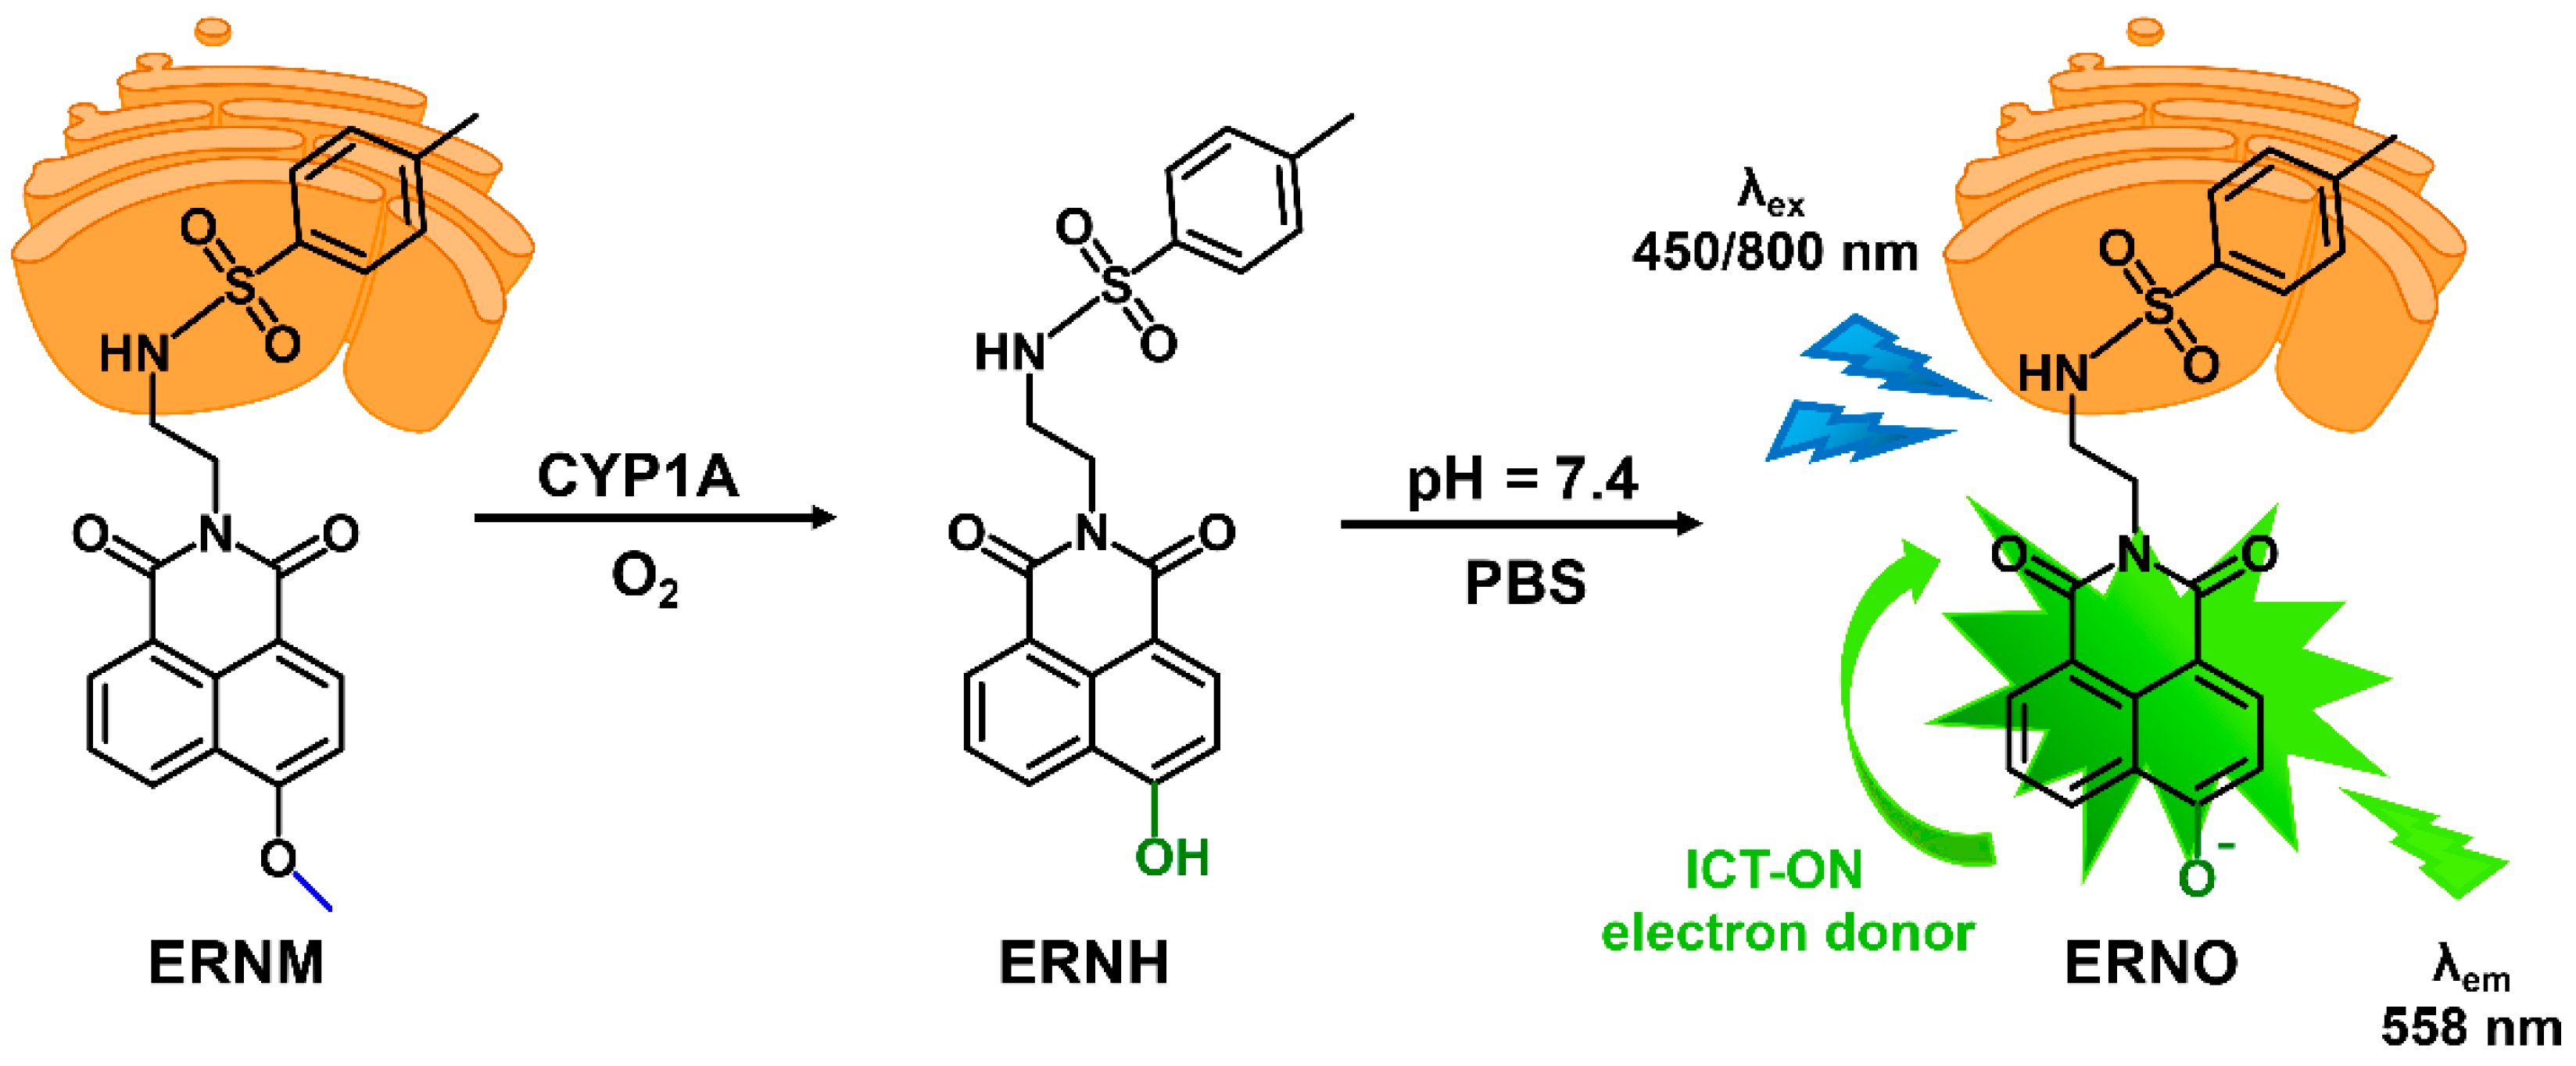
2.1. Design and Synthesis of ERNM
2.2. Spectroscopic Response of ERNM toward CYP1A
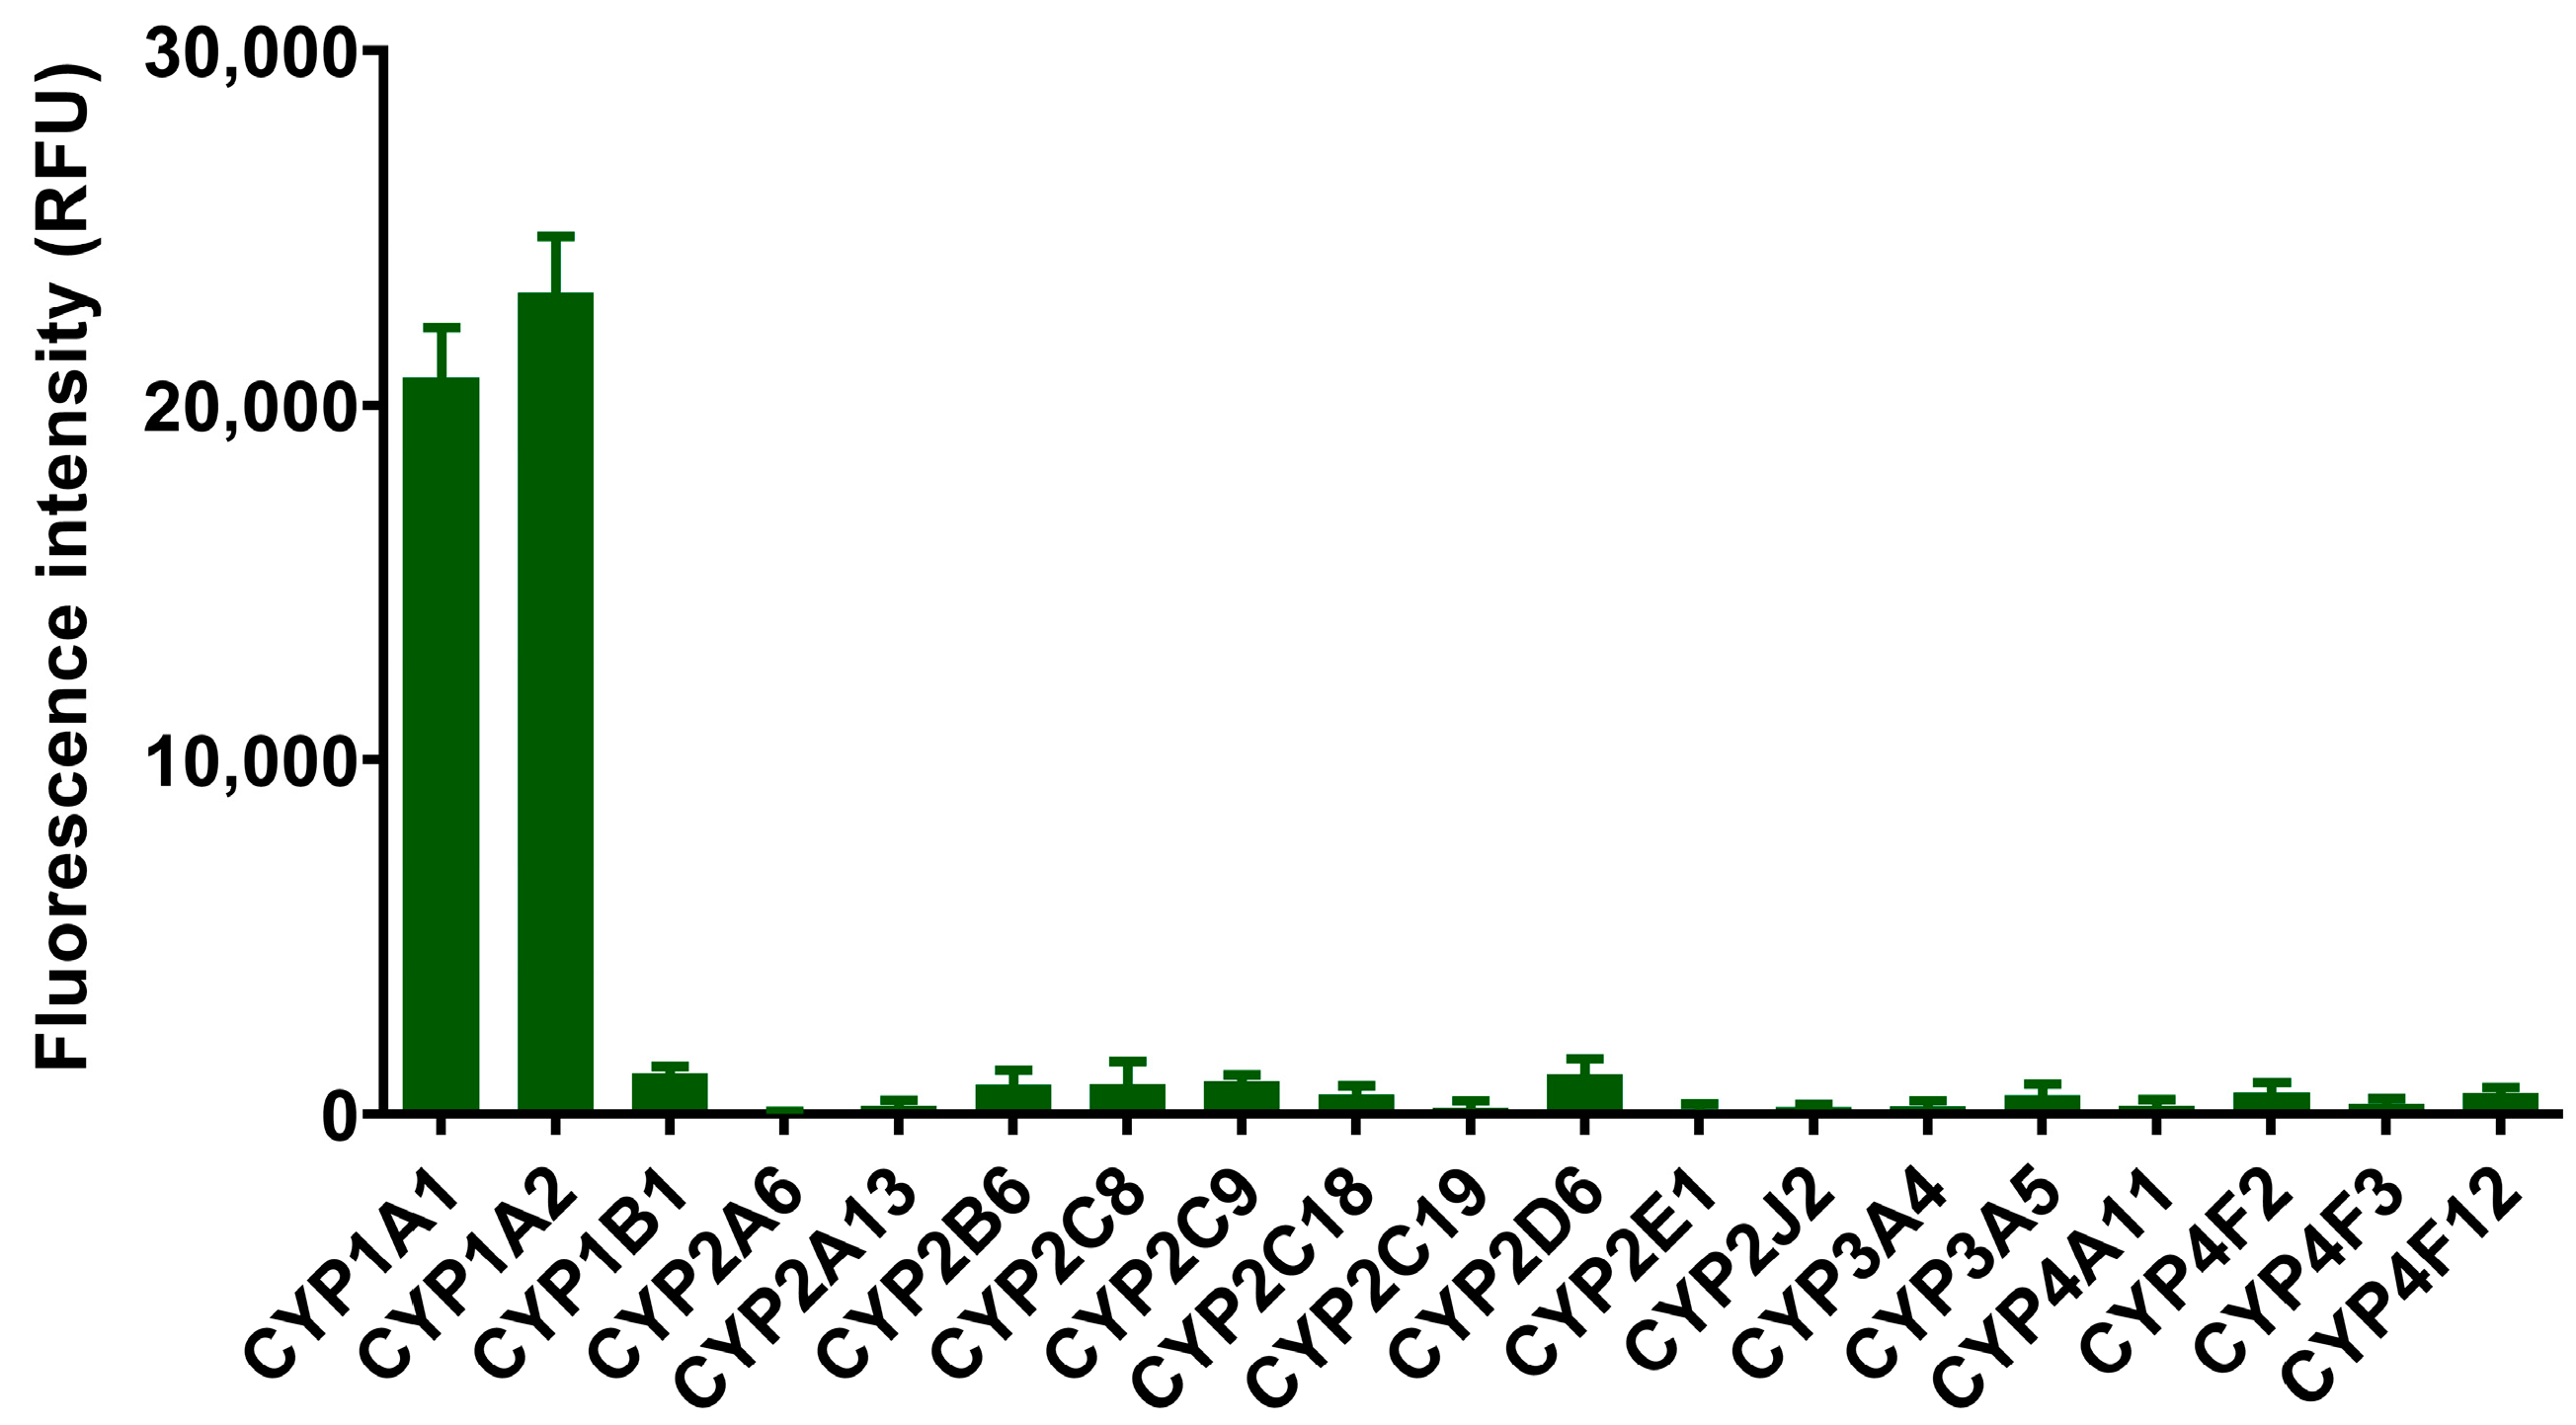
2.3. Selectivity Analysis of ERNM
2.4. Kinetic Behavior Analysis
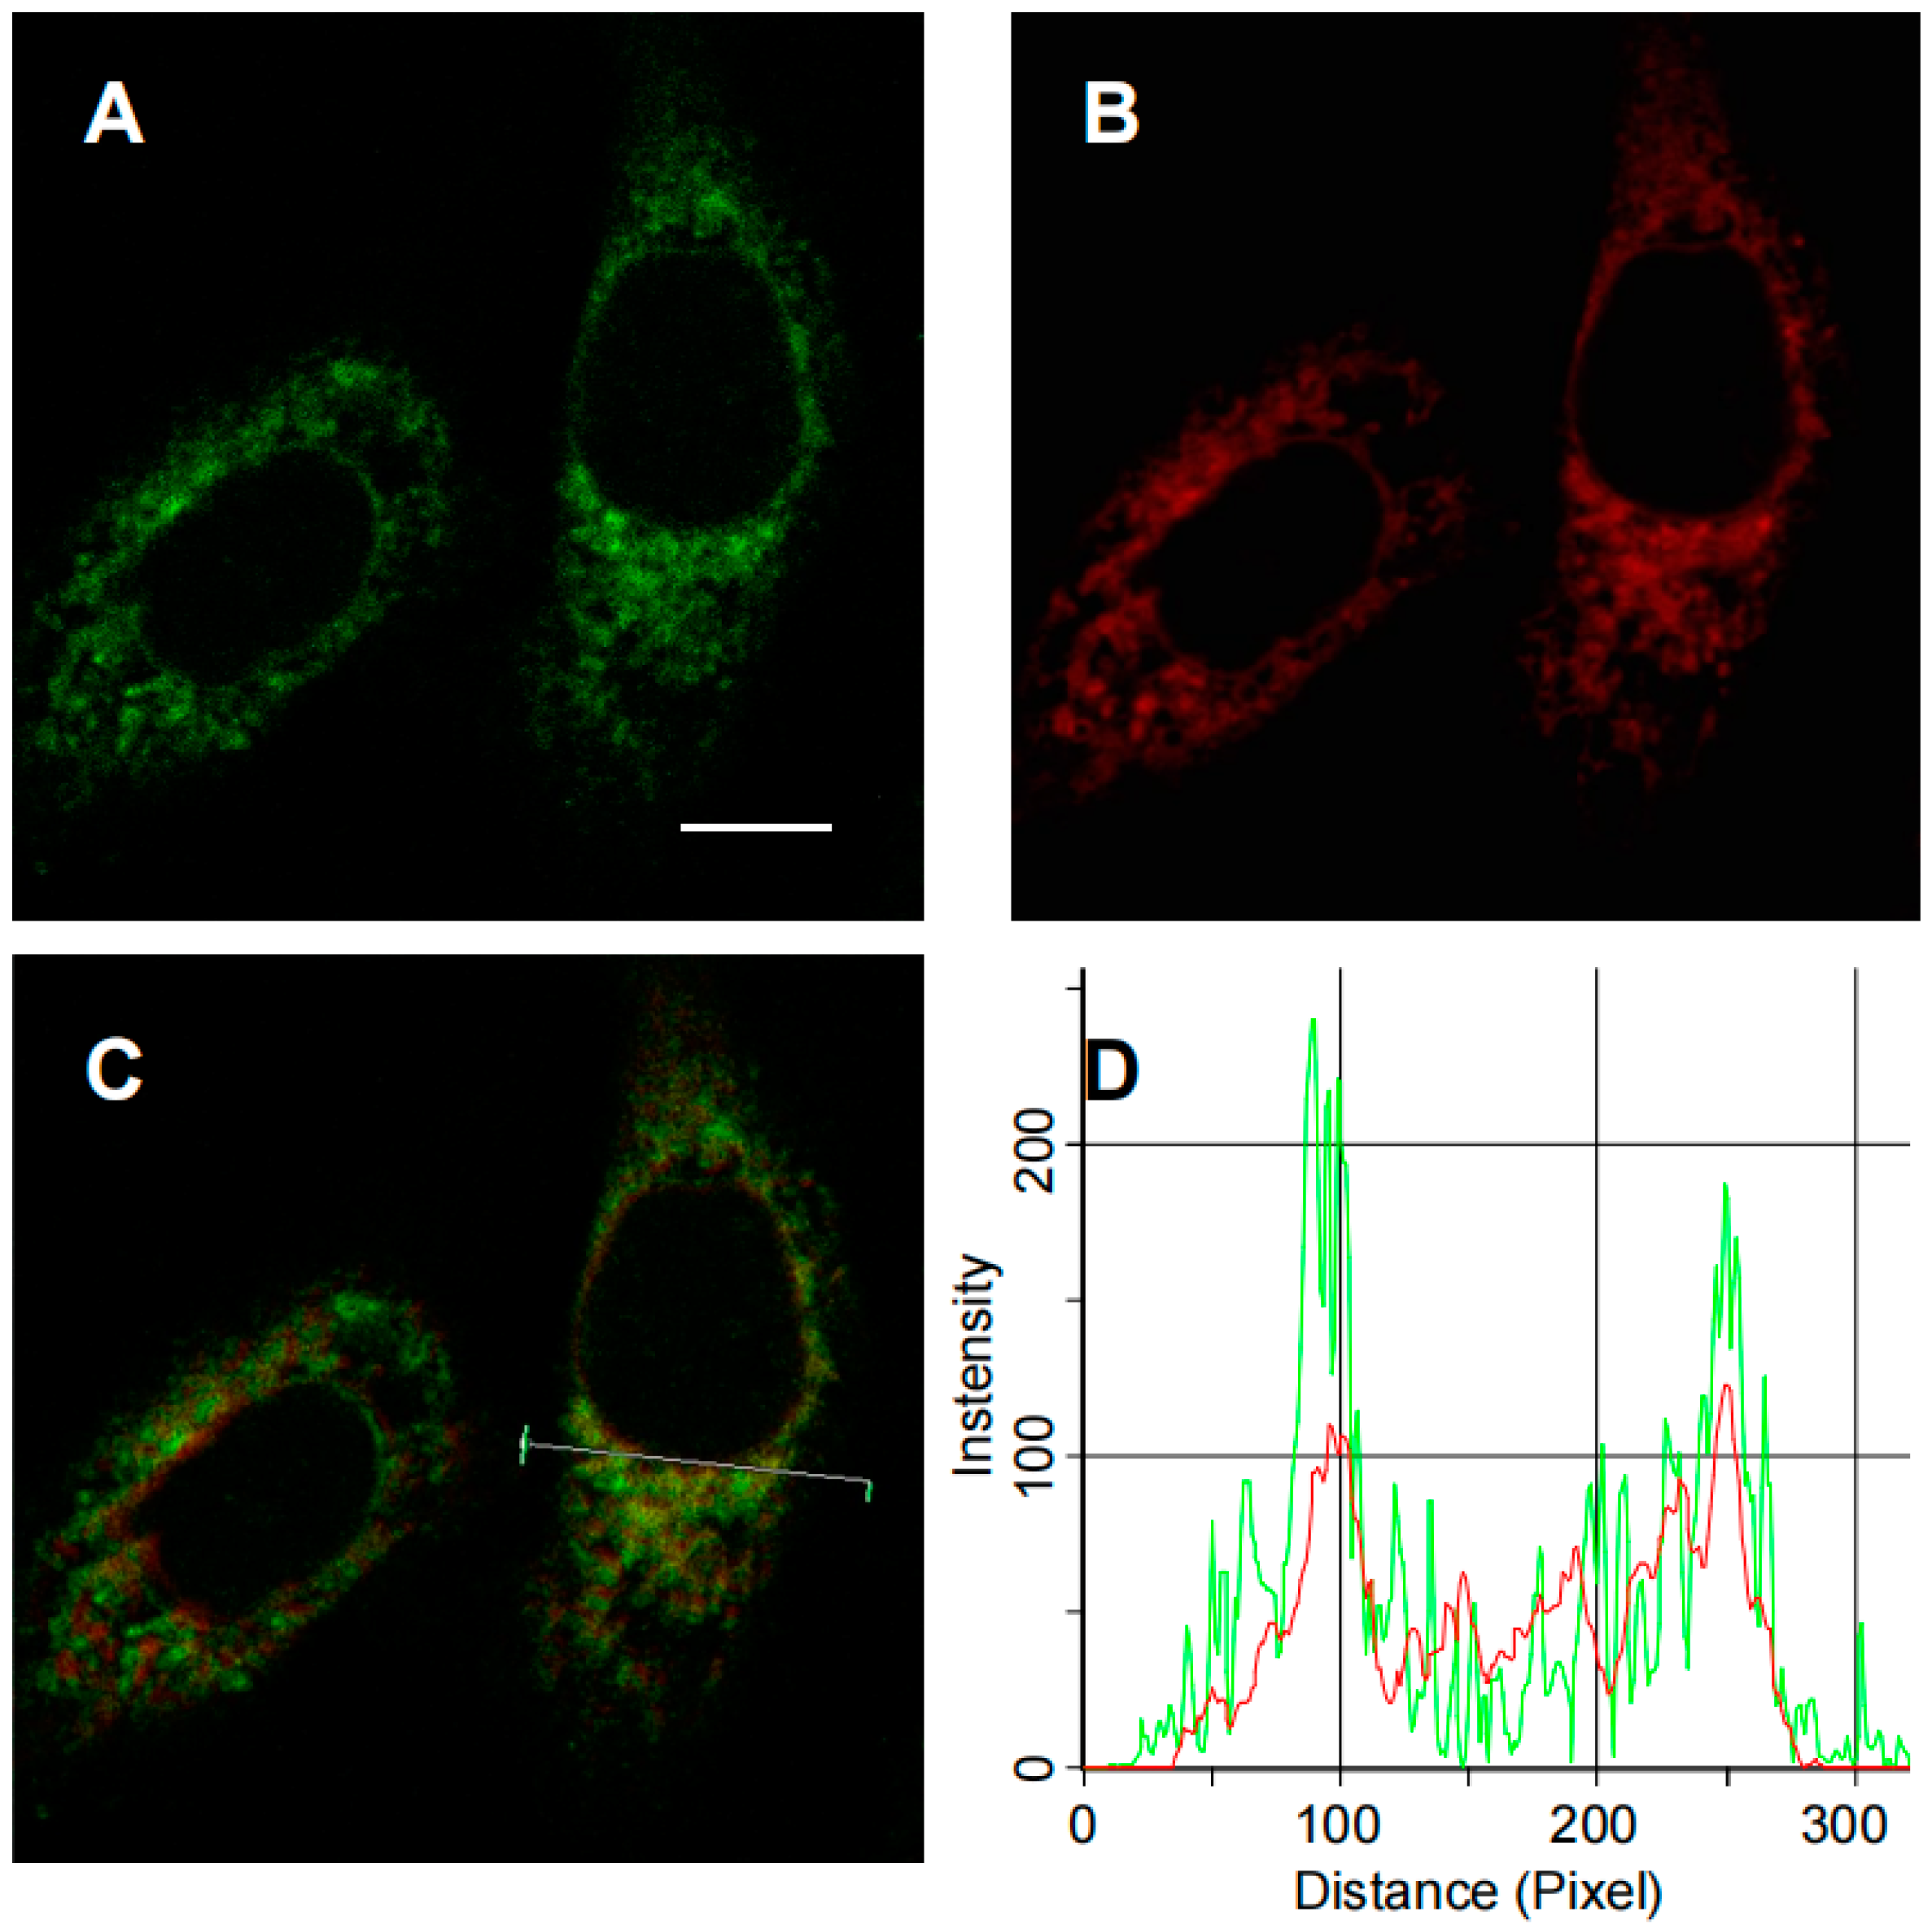
2.5. Colocalization Assay of ERNM toward ER
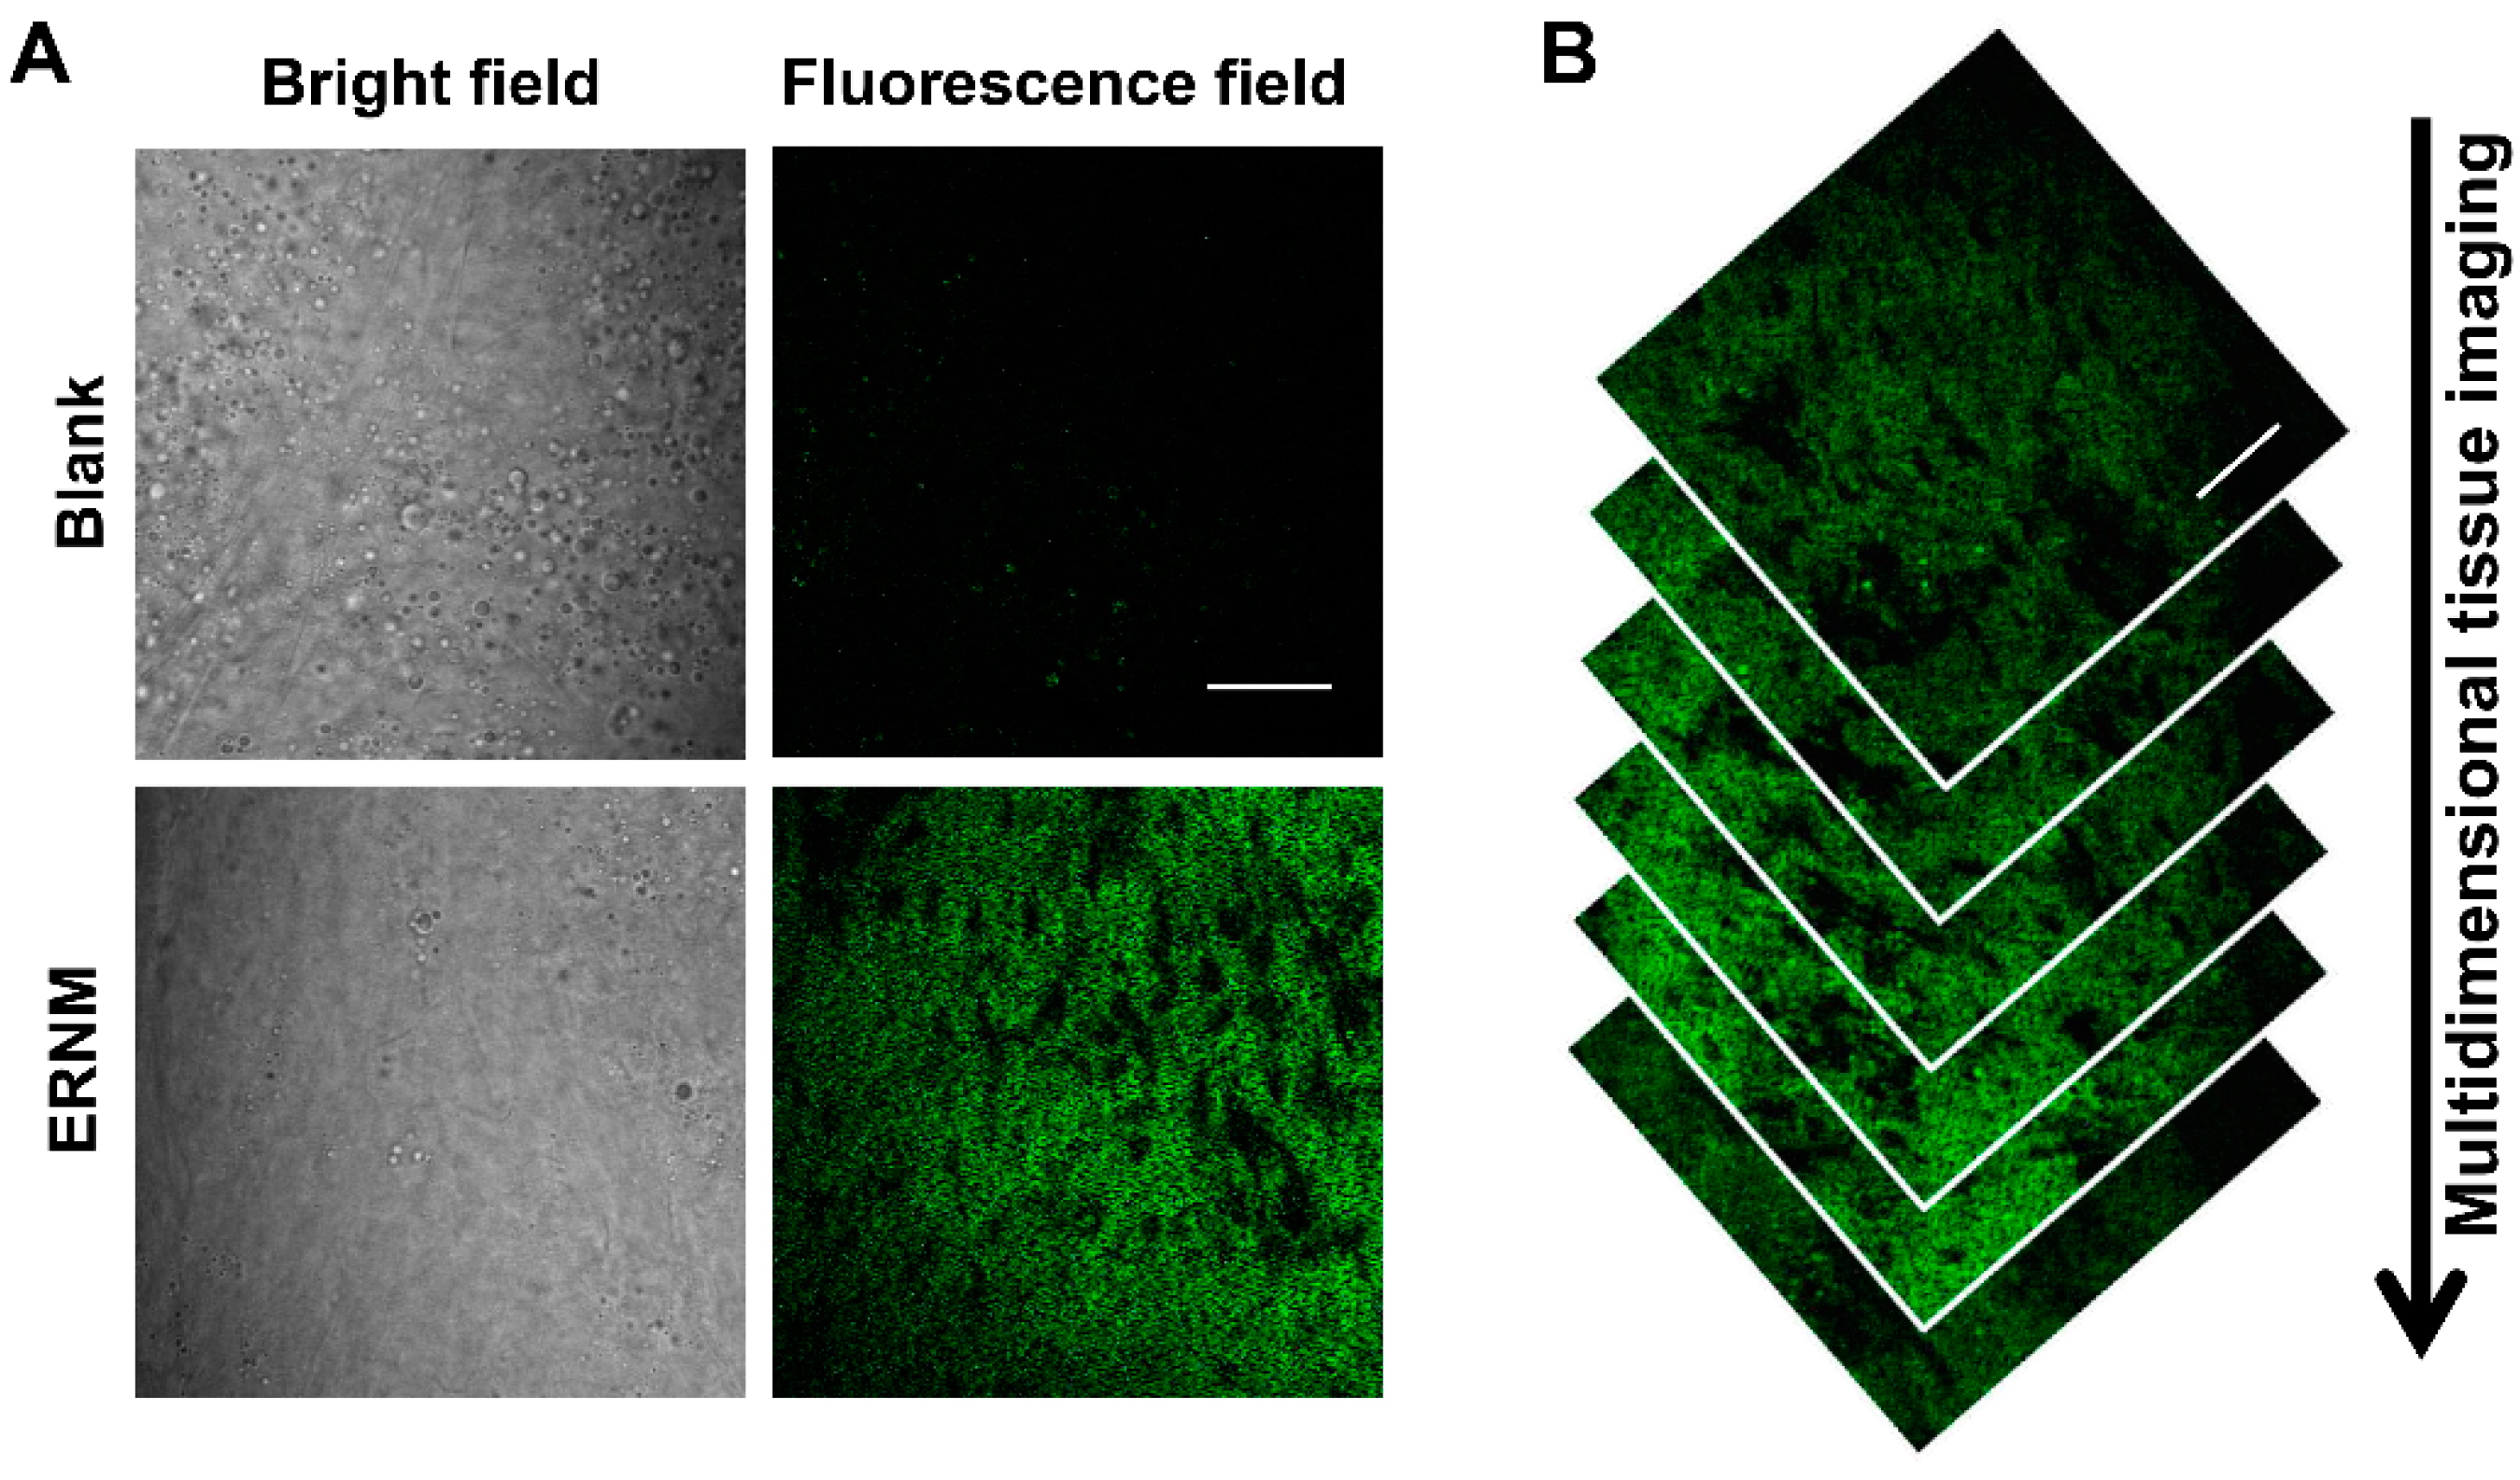
2.6. Bioimaging of CYP1A in Liver Slice
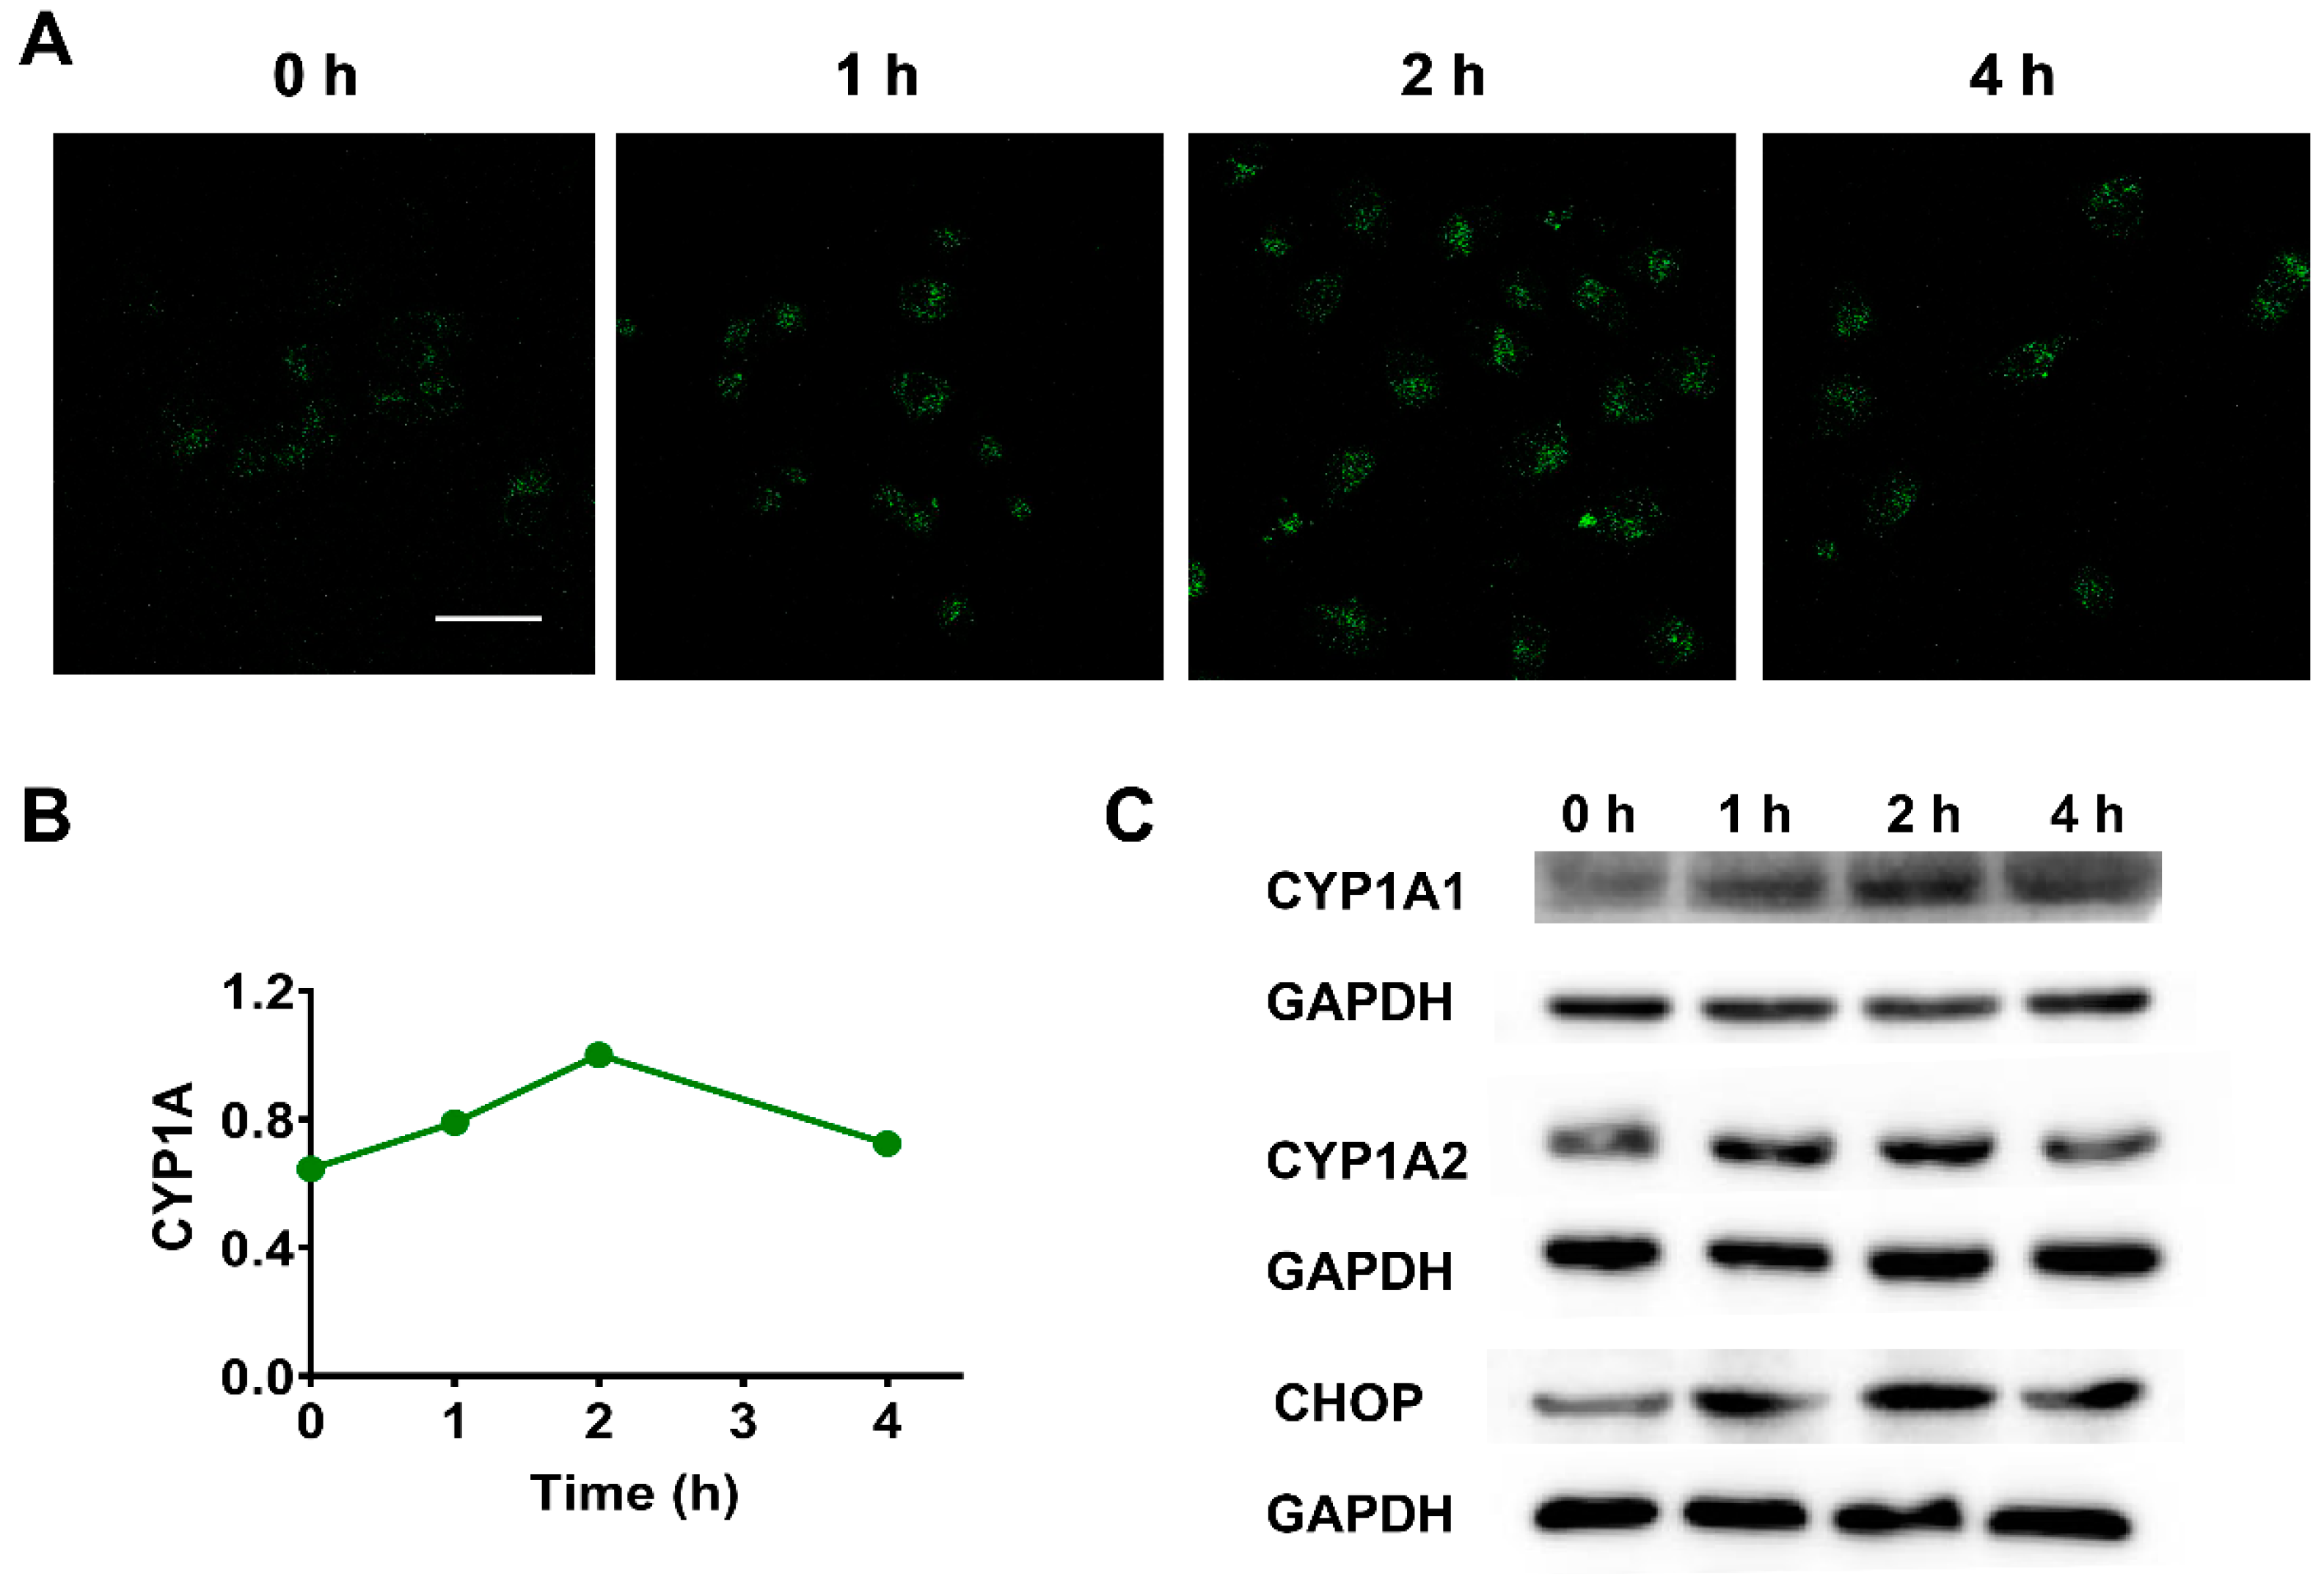
2.7. Bioimaging of CYP1A under ER Stress
3. Materials and Methods
3.1. Instruments and Reagents
3.2. Synthesis of Probe

3.3. The pH Effects on Fluorescence Signal of Probe Substrate ERNM and Probe Product ERNO
3.4. The Influence of Analytes on the Fluorescence Response of ERNM
3.5. In Vitro Assay for CYP Activity
3.6. Fluorescence Response of ERNM toward CYP1A and Various Human CYPs
3.7. Inhibition Assay Using Selective Chemical Inhibitors for Different CYP Subtypes
3.8. Enzyme Kinetic Analysis
3.9. Cell Culture and Imaging
3.10. Preparation of Liver Slices and Imaging
4. Conclusions
Supplementary Materials
Author Contributions
Funding
Institutional Review Board Statement
Informed Consent Statement
Data Availability Statement
Conflicts of Interest
Sample Availability
References
- Wei, P.; Zhang, J.; Egan-Hafley, M.; Liang, S.; Moore, D.D. The nuclear receptor CAR mediates specific xenobiotic induction of drug metabolism. Nature 2000, 407, 920–923. [Google Scholar] [CrossRef] [PubMed]
- Guengerich, F.P. Roles of cytochrome P450 enzymes in pharmacology and toxicology: Past, present, and future. Adv. Pharmacol. 2022, 95, 1–47. [Google Scholar] [CrossRef] [PubMed]
- Yuan, J.; Lu, W.Q.; Zou, Y.L.; Wei, W.; Zhang, C.; Xie, H.; Chen, X.M. Influence of aroclor 1254 on benzo(a)pyrene-induced DNA breakage, oxidative DNA damage, and cytochrome P4501A activity in human hepatoma cell line. Environ. Toxicol. 2009, 24, 327–333. [Google Scholar] [CrossRef] [PubMed]
- Klomp, F.; Wenzel, C.; Drozdzik, M.; Oswald, S. Drug-Drug Interactions Involving Intestinal and Hepatic CYP1A Enzymes. Pharmaceutics 2020, 12, 1201. [Google Scholar] [CrossRef] [PubMed]
- Lu, J.; Shang, X.; Zhong, W.; Xu, Y.; Shi, R.; Wang, X. New insights of CYP1A in endogenous metabolism: A focus on single nucleotide polymorphisms and diseases. Acta Pharm. Sin. B 2020, 10, 91–104. [Google Scholar] [CrossRef]
- Melchini, A.; Catania, S.; Stancanelli, R.; Tommasini, S.; Costa, C. Interaction of a functionalized complex of the flavonoid hesperetin with the AhR pathway and CYP1A1 expression: Involvement in its protective effects against benzo[a]pyrene-induced oxidative stress in human skin. Cell Biol. Toxicol. 2011, 27, 371–379. [Google Scholar] [CrossRef]
- Furue, M.; Uchi, H.; Mitoma, C.; Hashimoto-Hachiya, A.; Chiba, T.; Ito, T.; Nakahara, T.; Tsuji, G. Antioxidants for Healthy Skin: The Emerging Role of Aryl Hydrocarbon Receptors and Nuclear Factor-Erythroid 2-Related Factor-2. Nutrients 2017, 9, 223. [Google Scholar] [CrossRef]
- Hotamisligil, G.S. Endoplasmic reticulum stress and the inflammatory basis of metabolic disease. Cell 2010, 140, 900–917. [Google Scholar] [CrossRef] [Green Version]
- Lemmer, I.L.; Willemsen, N.; Hilal, N.; Bartelt, A. A guide to understanding endoplasmic reticulum stress in metabolic disorders. Mol. Metab. 2021, 47, 101169. [Google Scholar] [CrossRef]
- Puntarulo, S.; Cederbaum, A.I. Production of reactive oxygen species by microsomes enriched in specific human cytochrome P450 enzymes. Free Radic. Biol. Med. 1998, 24, 1324–1330. [Google Scholar] [CrossRef]
- Al-Dhfyan, A.; Alhoshani, A.; Korashy, H.M. Aryl hydrocarbon receptor/cytochrome P450 1A1 pathway mediates breast cancer stem cells expansion through PTEN inhibition and beta-catenin and Akt activation. Mol. Cancer 2017, 16, 14. [Google Scholar] [CrossRef] [PubMed] [Green Version]
- Liu, H.W.; Chen, L.; Xu, C.; Li, Z.; Zhang, H.; Zhang, X.B.; Tan, W. Recent progresses in small-molecule enzymatic fluorescent probes for cancer imaging. Chem. Soc. Rev. 2018, 47, 7140–7180. [Google Scholar] [CrossRef]
- Zhang, J.J.; Chai, X.Z.; He, X.P.; Kim, H.J.; Yoon, J.Y.; Tian, H. Fluorogenic probes for disease-relevant enzymes. Chem. Soc. Rev. 2019, 48, 683–722. [Google Scholar] [CrossRef] [PubMed]
- Ning, J.; Liu, T.; Dong, P.; Wang, W.; Ge, G.; Wang, B.; Yu, Z.; Shi, L.; Tian, X.; Huo, X.; et al. Molecular Design Strategy to Construct the Near-Infrared Fluorescent Probe for Selectively Sensing Human Cytochrome P450 2J2. J. Am. Chem. Soc. 2019, 141, 1126–1134. [Google Scholar] [CrossRef]
- Feng, L.; Tian, X.; Yao, D.; Yu, Z.; Huo, X.; Tian, Z.; Ning, J.; Cui, J.; James, T.D.; Ma, X. A practical strategy to develop isoform-selective near-infrared fluorescent probes for human cytochrome P450 enzymes. Acta Pharma. Sinica B 2021, 12, 1976–1986. [Google Scholar] [CrossRef]
- Feng, L.; Ning, J.; Tian, X.; Wang, C.; Yu, Z.; Huo, X.; Xie, T.; Zhang, B.; James, T.D.; Ma, X. Fluorescent probes for the detection and imaging of Cytochrome P450. Coord. Chem. Rev. 2021, 437, 213740. [Google Scholar] [CrossRef]
- Yan, F.; Cui, J.; Wang, C.; Tian, X.; Li, D.; Wang, Y.; Zhang, B.; Feng, L.; Huang, S.; Ma, X. Real-time quantification for sulfite using a turn-on NIR fluorescent probe equipped with a portable fluorescence detector. Chin. Chem. Lett. 2022, 33, 4219–4222. [Google Scholar] [CrossRef]
- Ning, J.; Wang, W.; Ge, G.; Chu, P.; Long, F.; Yang, Y.; Peng, Y.; Feng, L.; Ma, X.; James, T.D. Targeted Enzyme Activated Two-Photon Fluorescent Probes: A Case Study of CYP3A4 Using a Two-Dimensional Design Strategy. Angew Chem. Int. Ed. 2019, 58, 9959–9963. [Google Scholar] [CrossRef]
- Lu, Q.; Wu, C.J.; Liu, Z.Q.; Niu, G.L.; Yu, X.Q. Fluorescent AIE-Active Materials for Two-Photon Bioimaging Applications. Front. Chem. 2020, 8, 617463. [Google Scholar] [CrossRef]
- Noh, C.K.; Lim, C.S.; Lee, G.H.; Cho, M.K.; Lee, H.W.; Roh, J.; Kim, Y.B.; Lee, E.; Park, B.; Kim, H.M.; et al. A Diagnostic Method for Gastric Cancer Using Two-Photon Microscopy with Enzyme-Selective Fluorescent Probes: A Pilot Study. Front. Oncol. 2021, 11, 634219. [Google Scholar] [CrossRef]
- Ning, J.; Tian, Z.; Wang, J.; Wang, B.; Tian, X.; Yu, Z.; Huo, X.; Feng, L.; Cui, J.; James, T.D.; et al. Rational Design of a Two-Photon Fluorescent Probe for Human Cytochrome P450 3A and the Visualization of Mechanism-Based Inactivation. Angew Chem. Int. Ed. 2022, 61, e202113191. [Google Scholar] [CrossRef] [PubMed]
- Dai, Z.R.; Ge, G.B.; Feng, L.; Ning, J.; Hu, L.H.; Jin, Q.; Wang, D.D.; Lv, X.; Dou, T.Y.; Cui, J.N.; et al. A Highly Selective Ratiometric Two-Photon Fluorescent Probe for Human Cytochrome P450 1A. J. Am. Chem. Soc. 2015, 137, 14488–14495. [Google Scholar] [CrossRef] [PubMed]
- Dai, Z.R.; Feng, L.; Jin, Q.; Cheng, H.; Li, Y.; Ning, J.; Yu, Y.; Ge, G.B.; Cui, J.N.; Yang, L. A practical strategy to design and develop an isoform-specific fluorescent probe for a target enzyme: CYP1A1 as a case study. Chem. Sci. 2017, 8, 2795–2803. [Google Scholar] [CrossRef] [PubMed] [Green Version]
- Zhang, X.; Zhou, Y.; Gu, X.; Cheng, Y.; Hong, M.; Yan, L.; Ma, F.; Qi, Z. Synthesis of a selective ratiometric fluorescent probe based on Naphthalimide and its application in human cytochrome P450 1A. Talanta 2018, 186, 413–420. [Google Scholar] [CrossRef] [PubMed]


Disclaimer/Publisher’s Note: The statements, opinions and data contained in all publications are solely those of the individual author(s) and contributor(s) and not of MDPI and/or the editor(s). MDPI and/or the editor(s) disclaim responsibility for any injury to people or property resulting from any ideas, methods, instructions or products referred to in the content. |
© 2023 by the authors. Licensee MDPI, Basel, Switzerland. This article is an open access article distributed under the terms and conditions of the Creative Commons Attribution (CC BY) license (https://creativecommons.org/licenses/by/4.0/).
Share and Cite
Shi, C.; Wang, Y.; Tian, X.; Lv, X.; An, Y.; Ning, J.; Xin, X.; Dai, L.; Ma, X.; Feng, L. Endoplasmic Reticulum-Targeting Two-Photon Fluorescent Probe for CYP1A Activity and Its Imaging Application in Endoplasmic Reticulum Stress. Molecules 2023, 28, 3472. https://doi.org/10.3390/molecules28083472
Shi C, Wang Y, Tian X, Lv X, An Y, Ning J, Xin X, Dai L, Ma X, Feng L. Endoplasmic Reticulum-Targeting Two-Photon Fluorescent Probe for CYP1A Activity and Its Imaging Application in Endoplasmic Reticulum Stress. Molecules. 2023; 28(8):3472. https://doi.org/10.3390/molecules28083472
Chicago/Turabian StyleShi, Chao, Yan Wang, Xiangge Tian, Xia Lv, Yue An, Jing Ning, Xiulan Xin, Li Dai, Xiaochi Ma, and Lei Feng. 2023. "Endoplasmic Reticulum-Targeting Two-Photon Fluorescent Probe for CYP1A Activity and Its Imaging Application in Endoplasmic Reticulum Stress" Molecules 28, no. 8: 3472. https://doi.org/10.3390/molecules28083472