
Synthesis and Characterization of Carvedilol-Etched Halloysite Nanotubes Composites with Enhanced Drug Solubility and Dissolution Rate
 , ,
, ,  and
and
Abstract
:1. Introduction
2. Results and Discussion
2.1. Sample Characterization
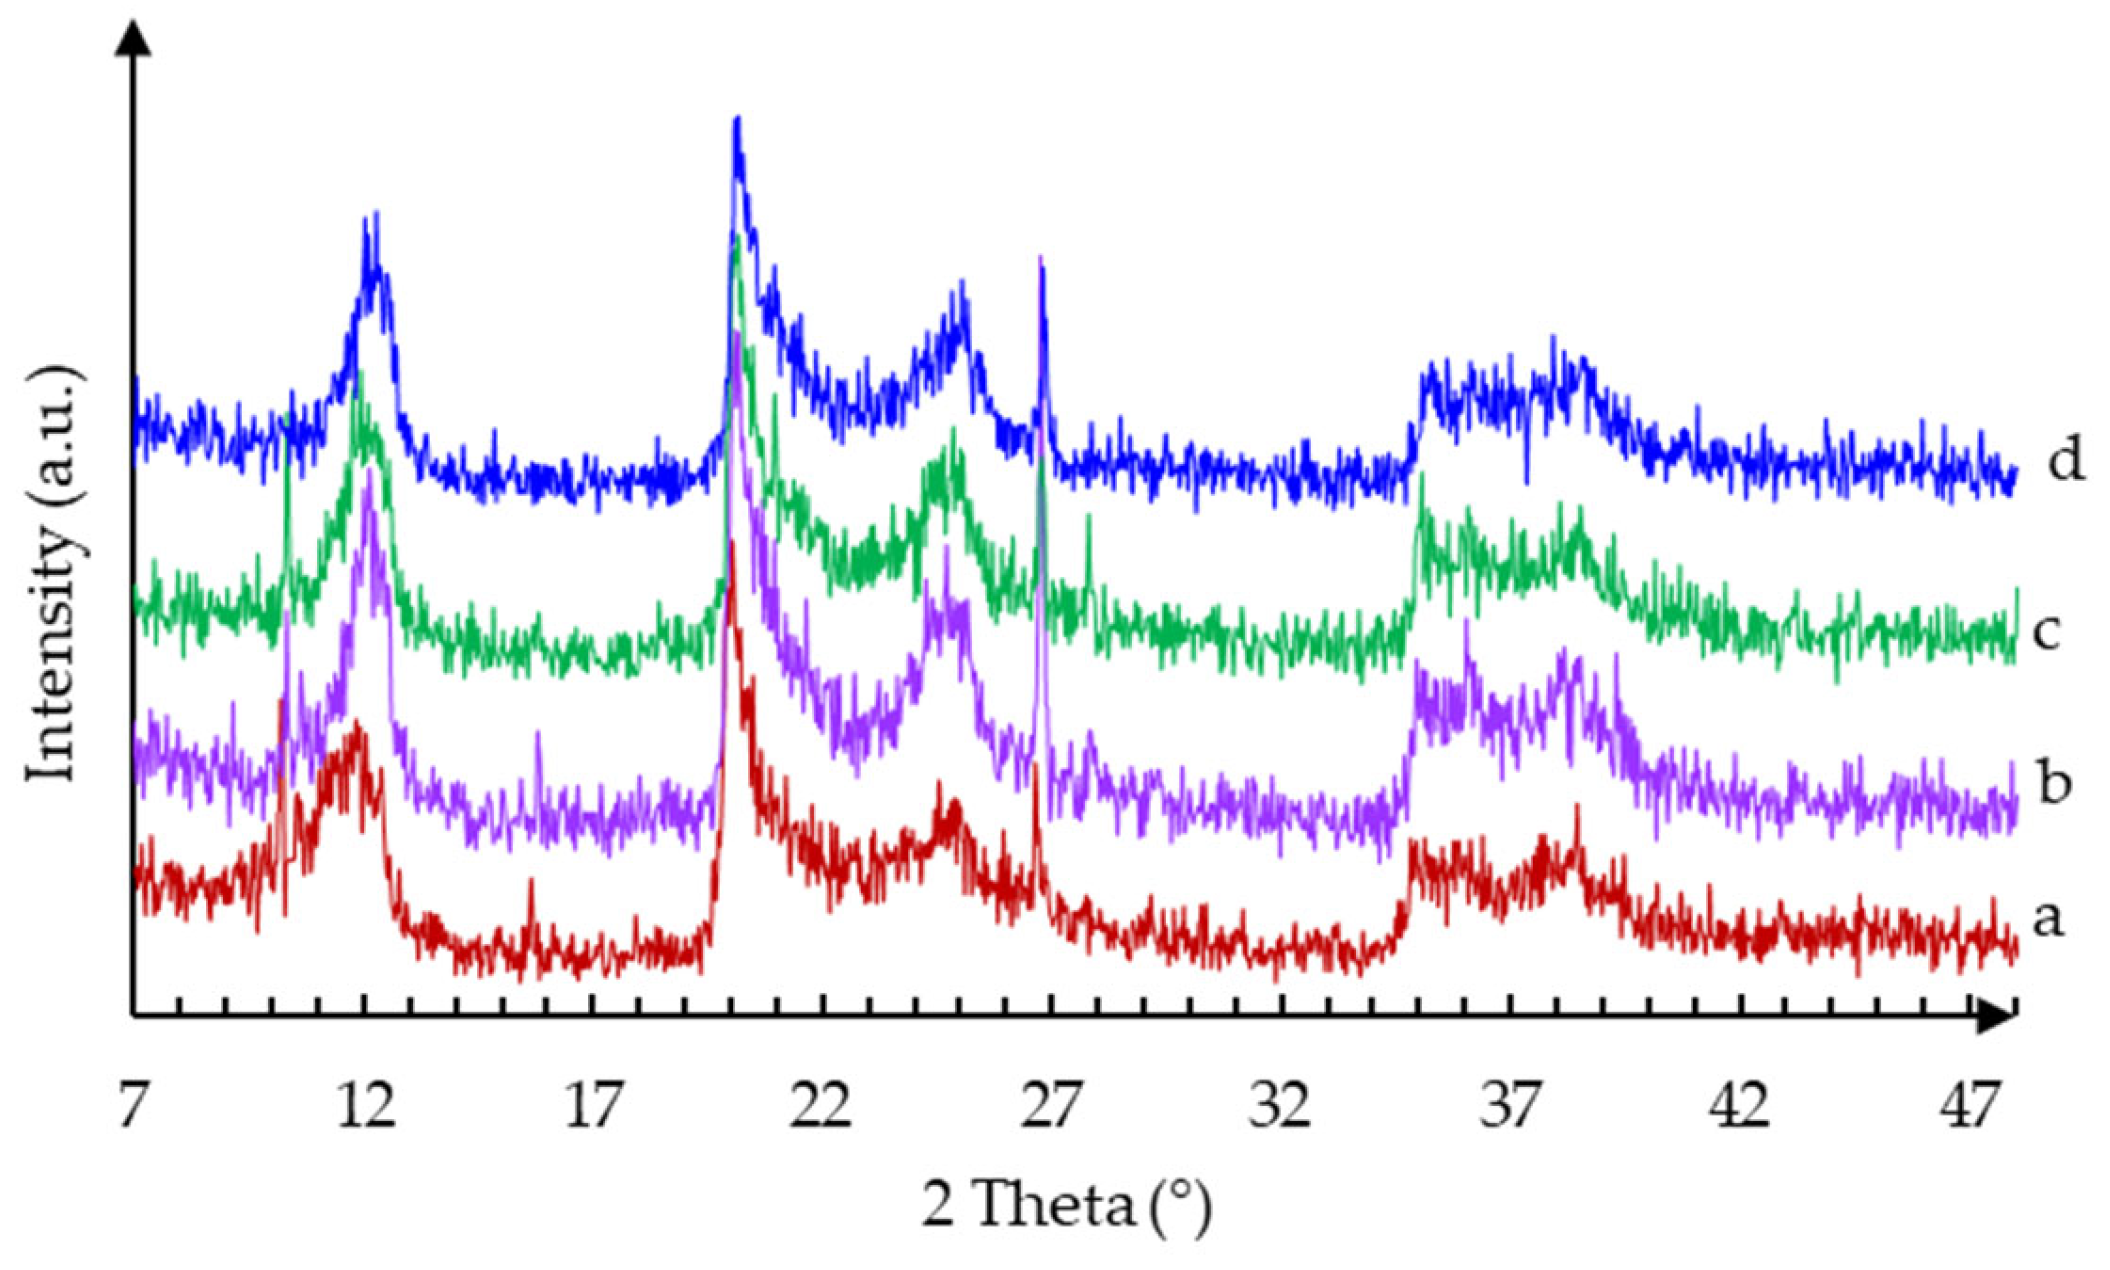
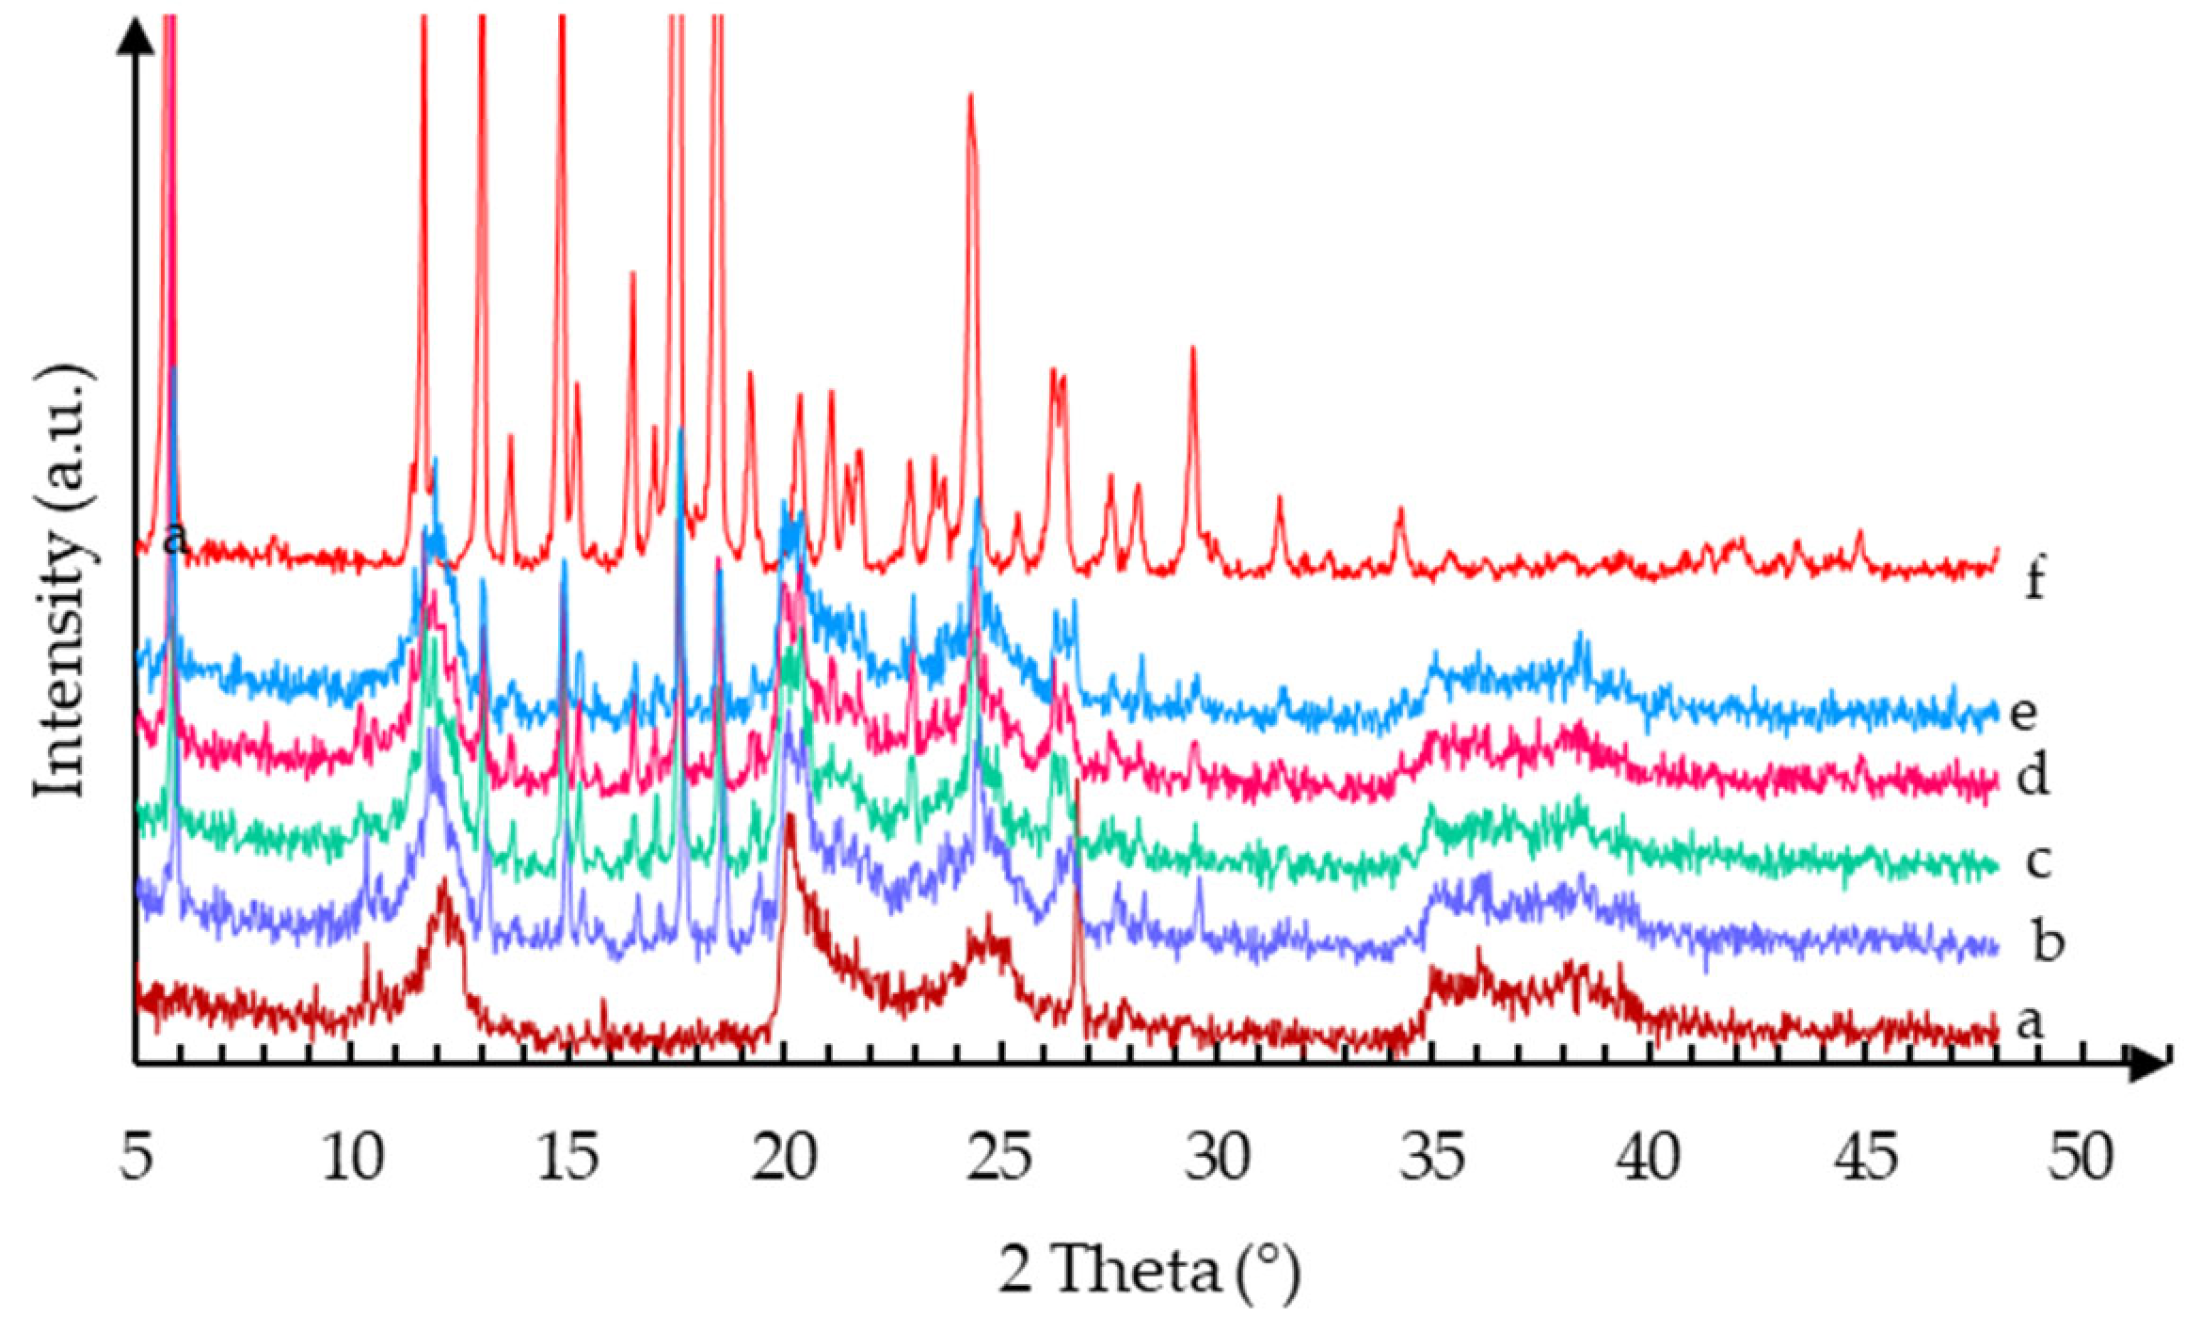
2.1.1. XRPD
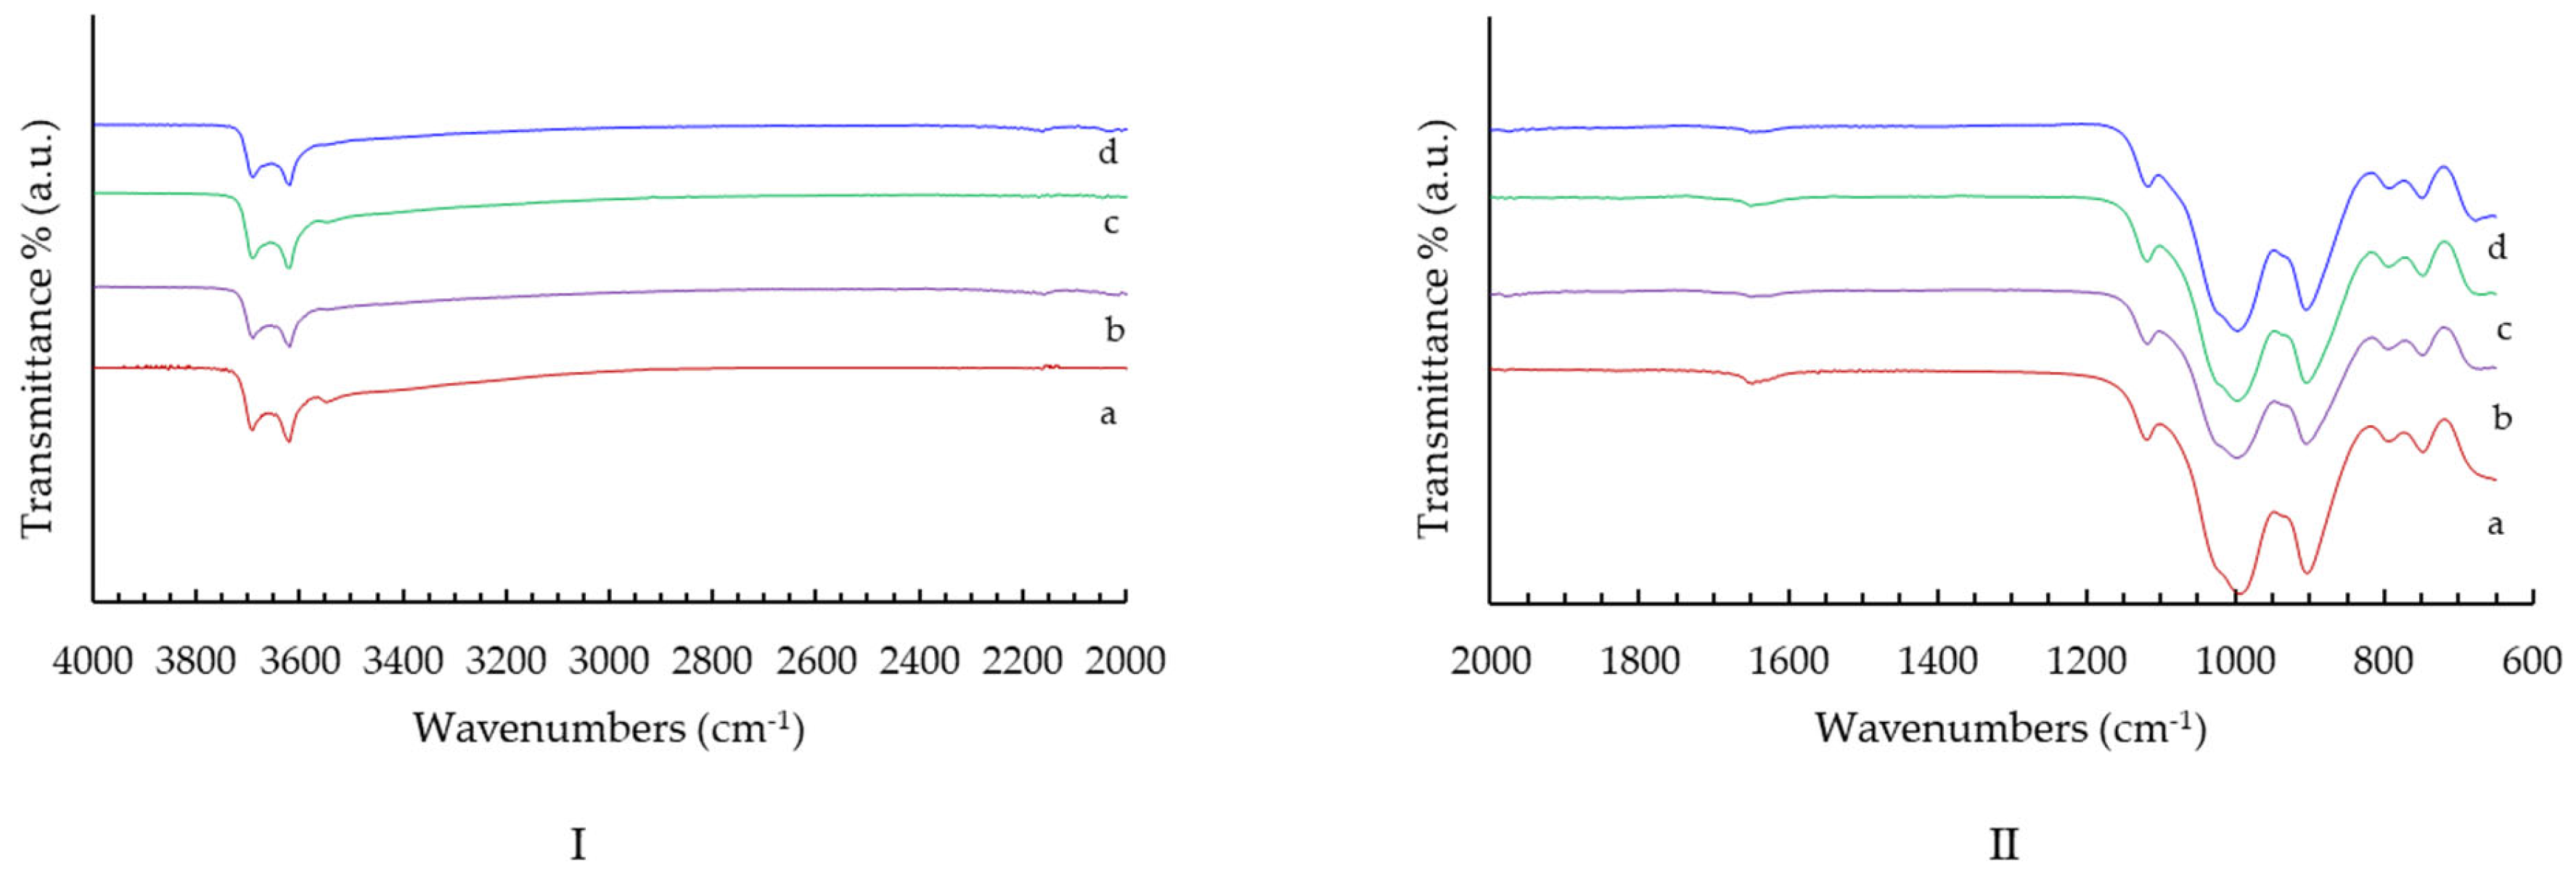
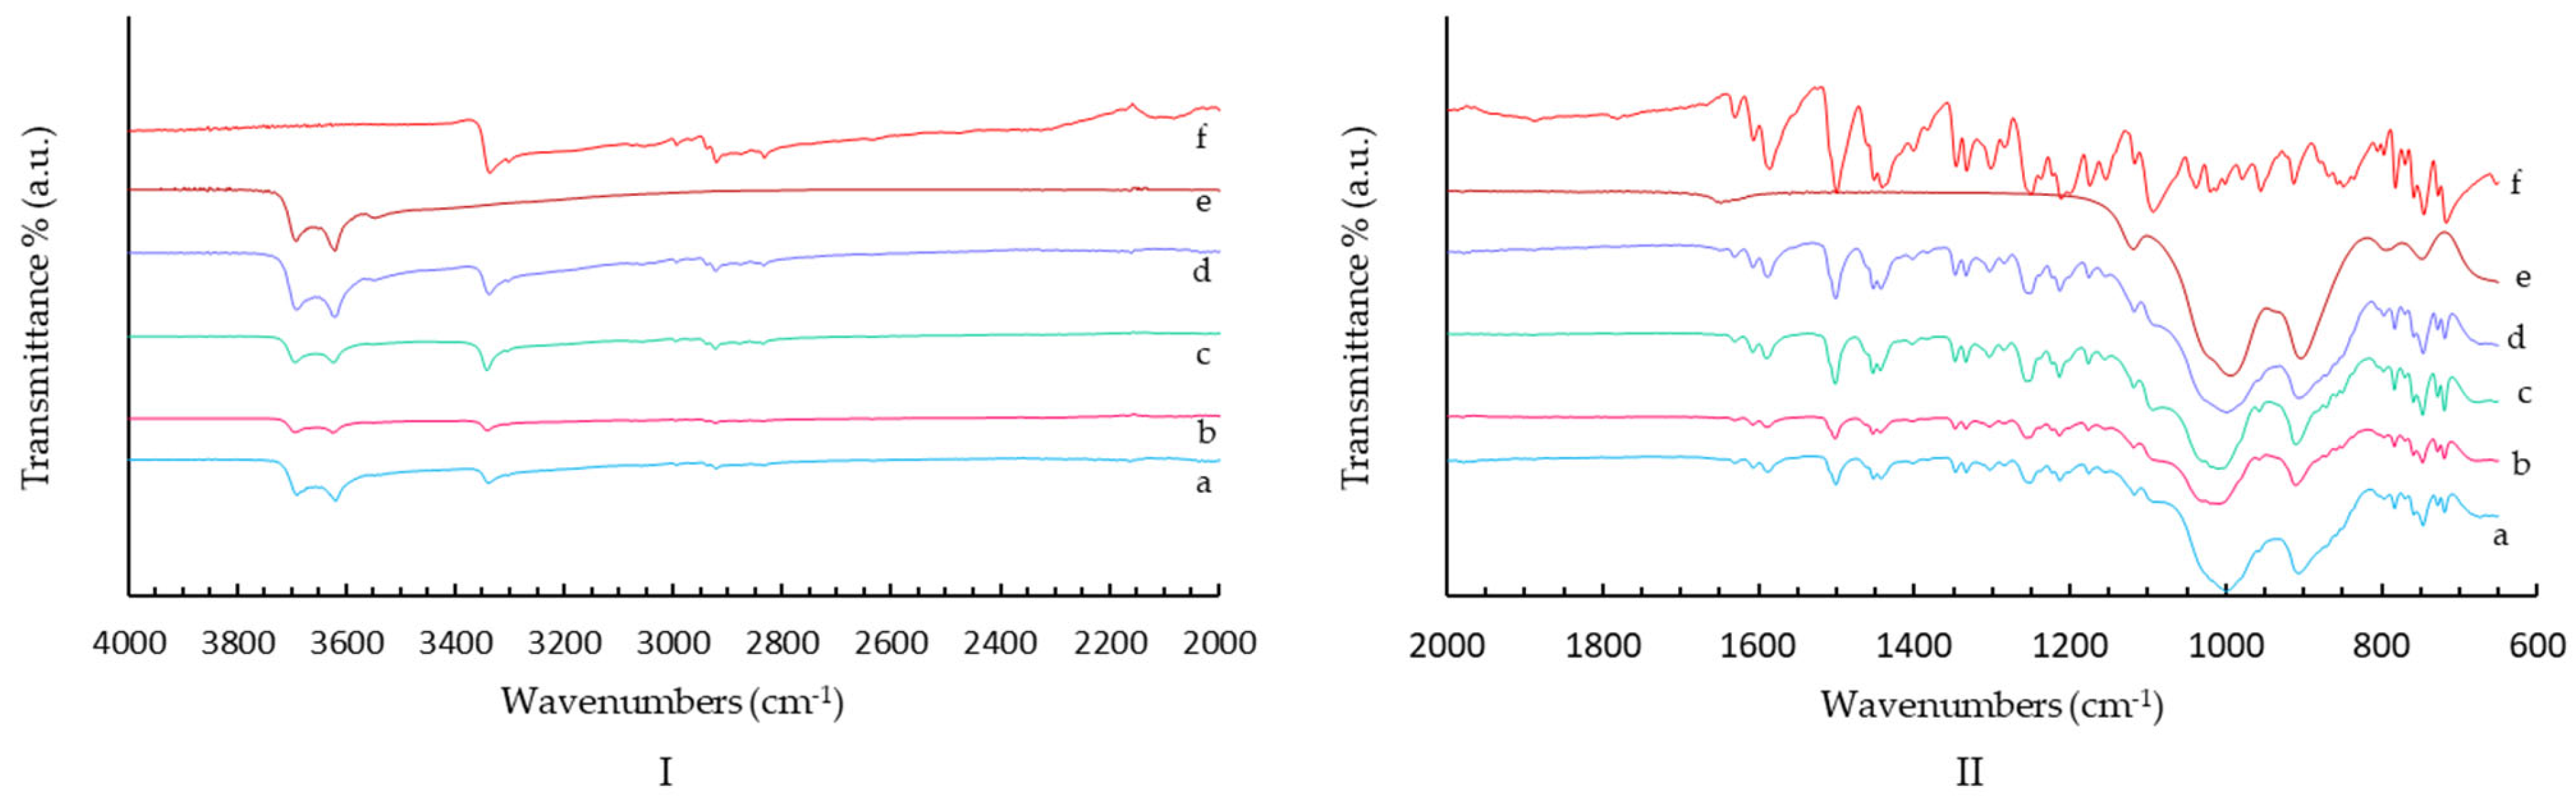
2.1.2. FT-IR Spectroscopy
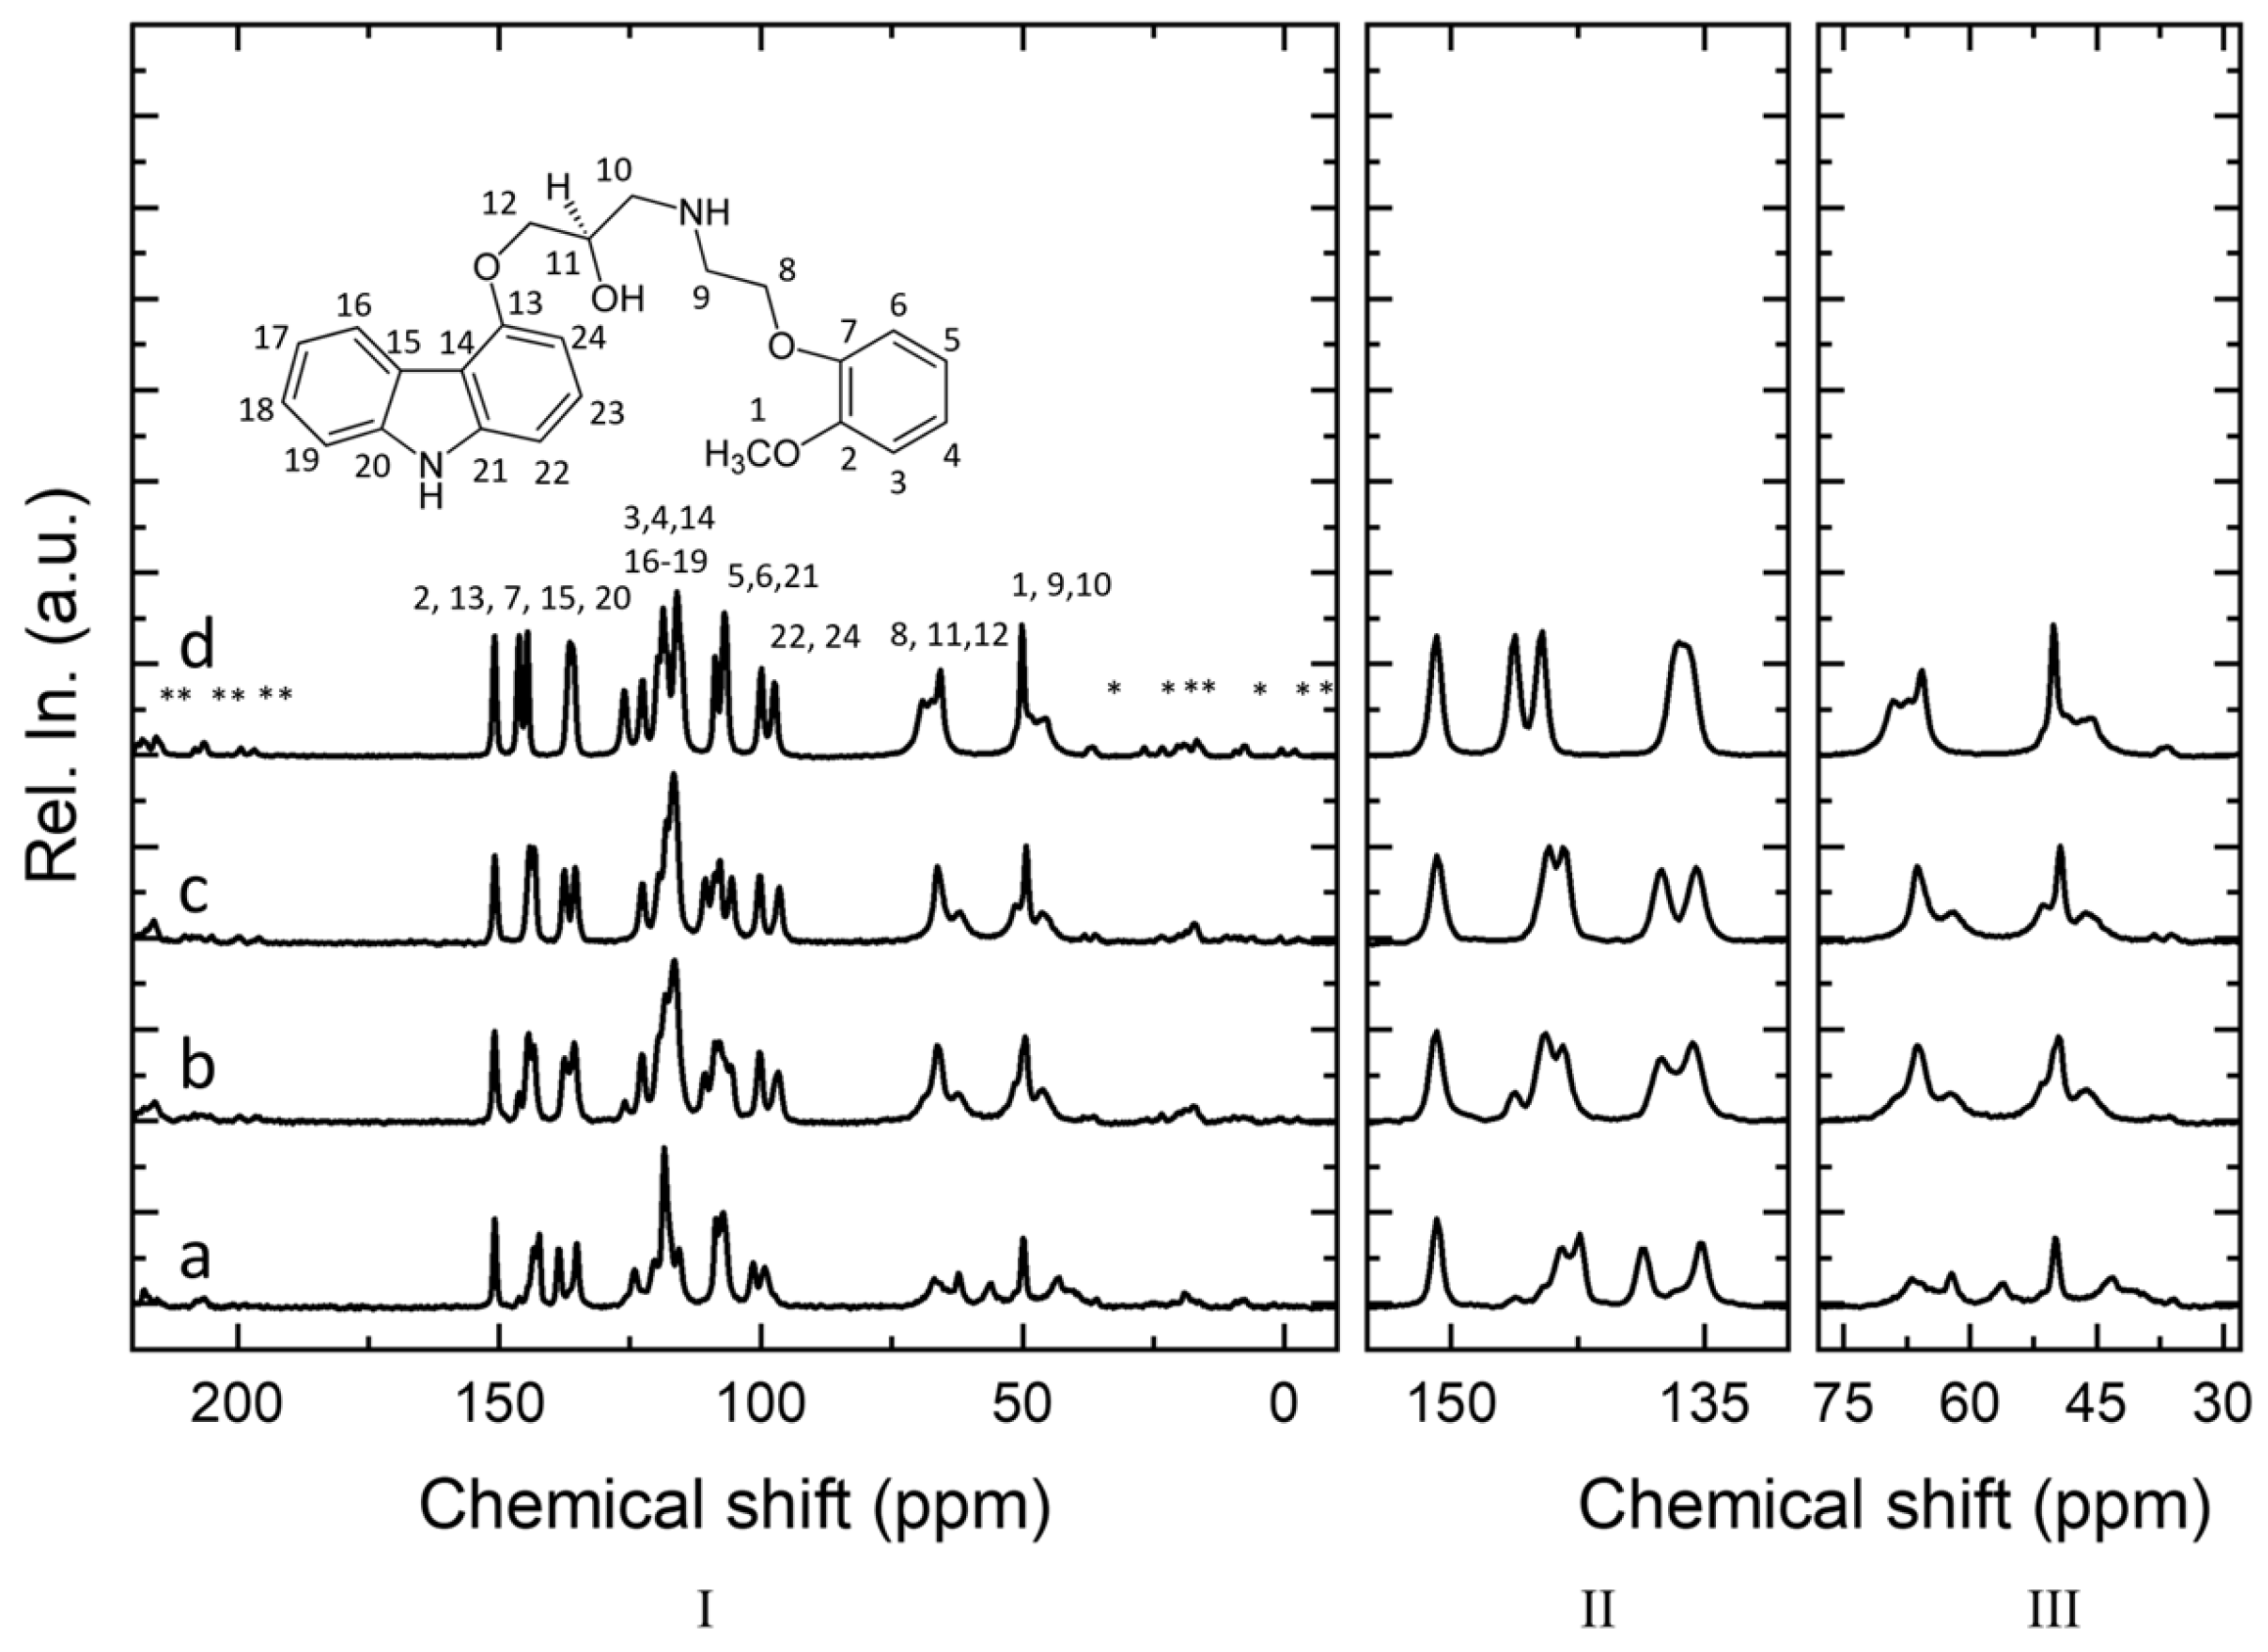
2.1.3. Solid-State NMR
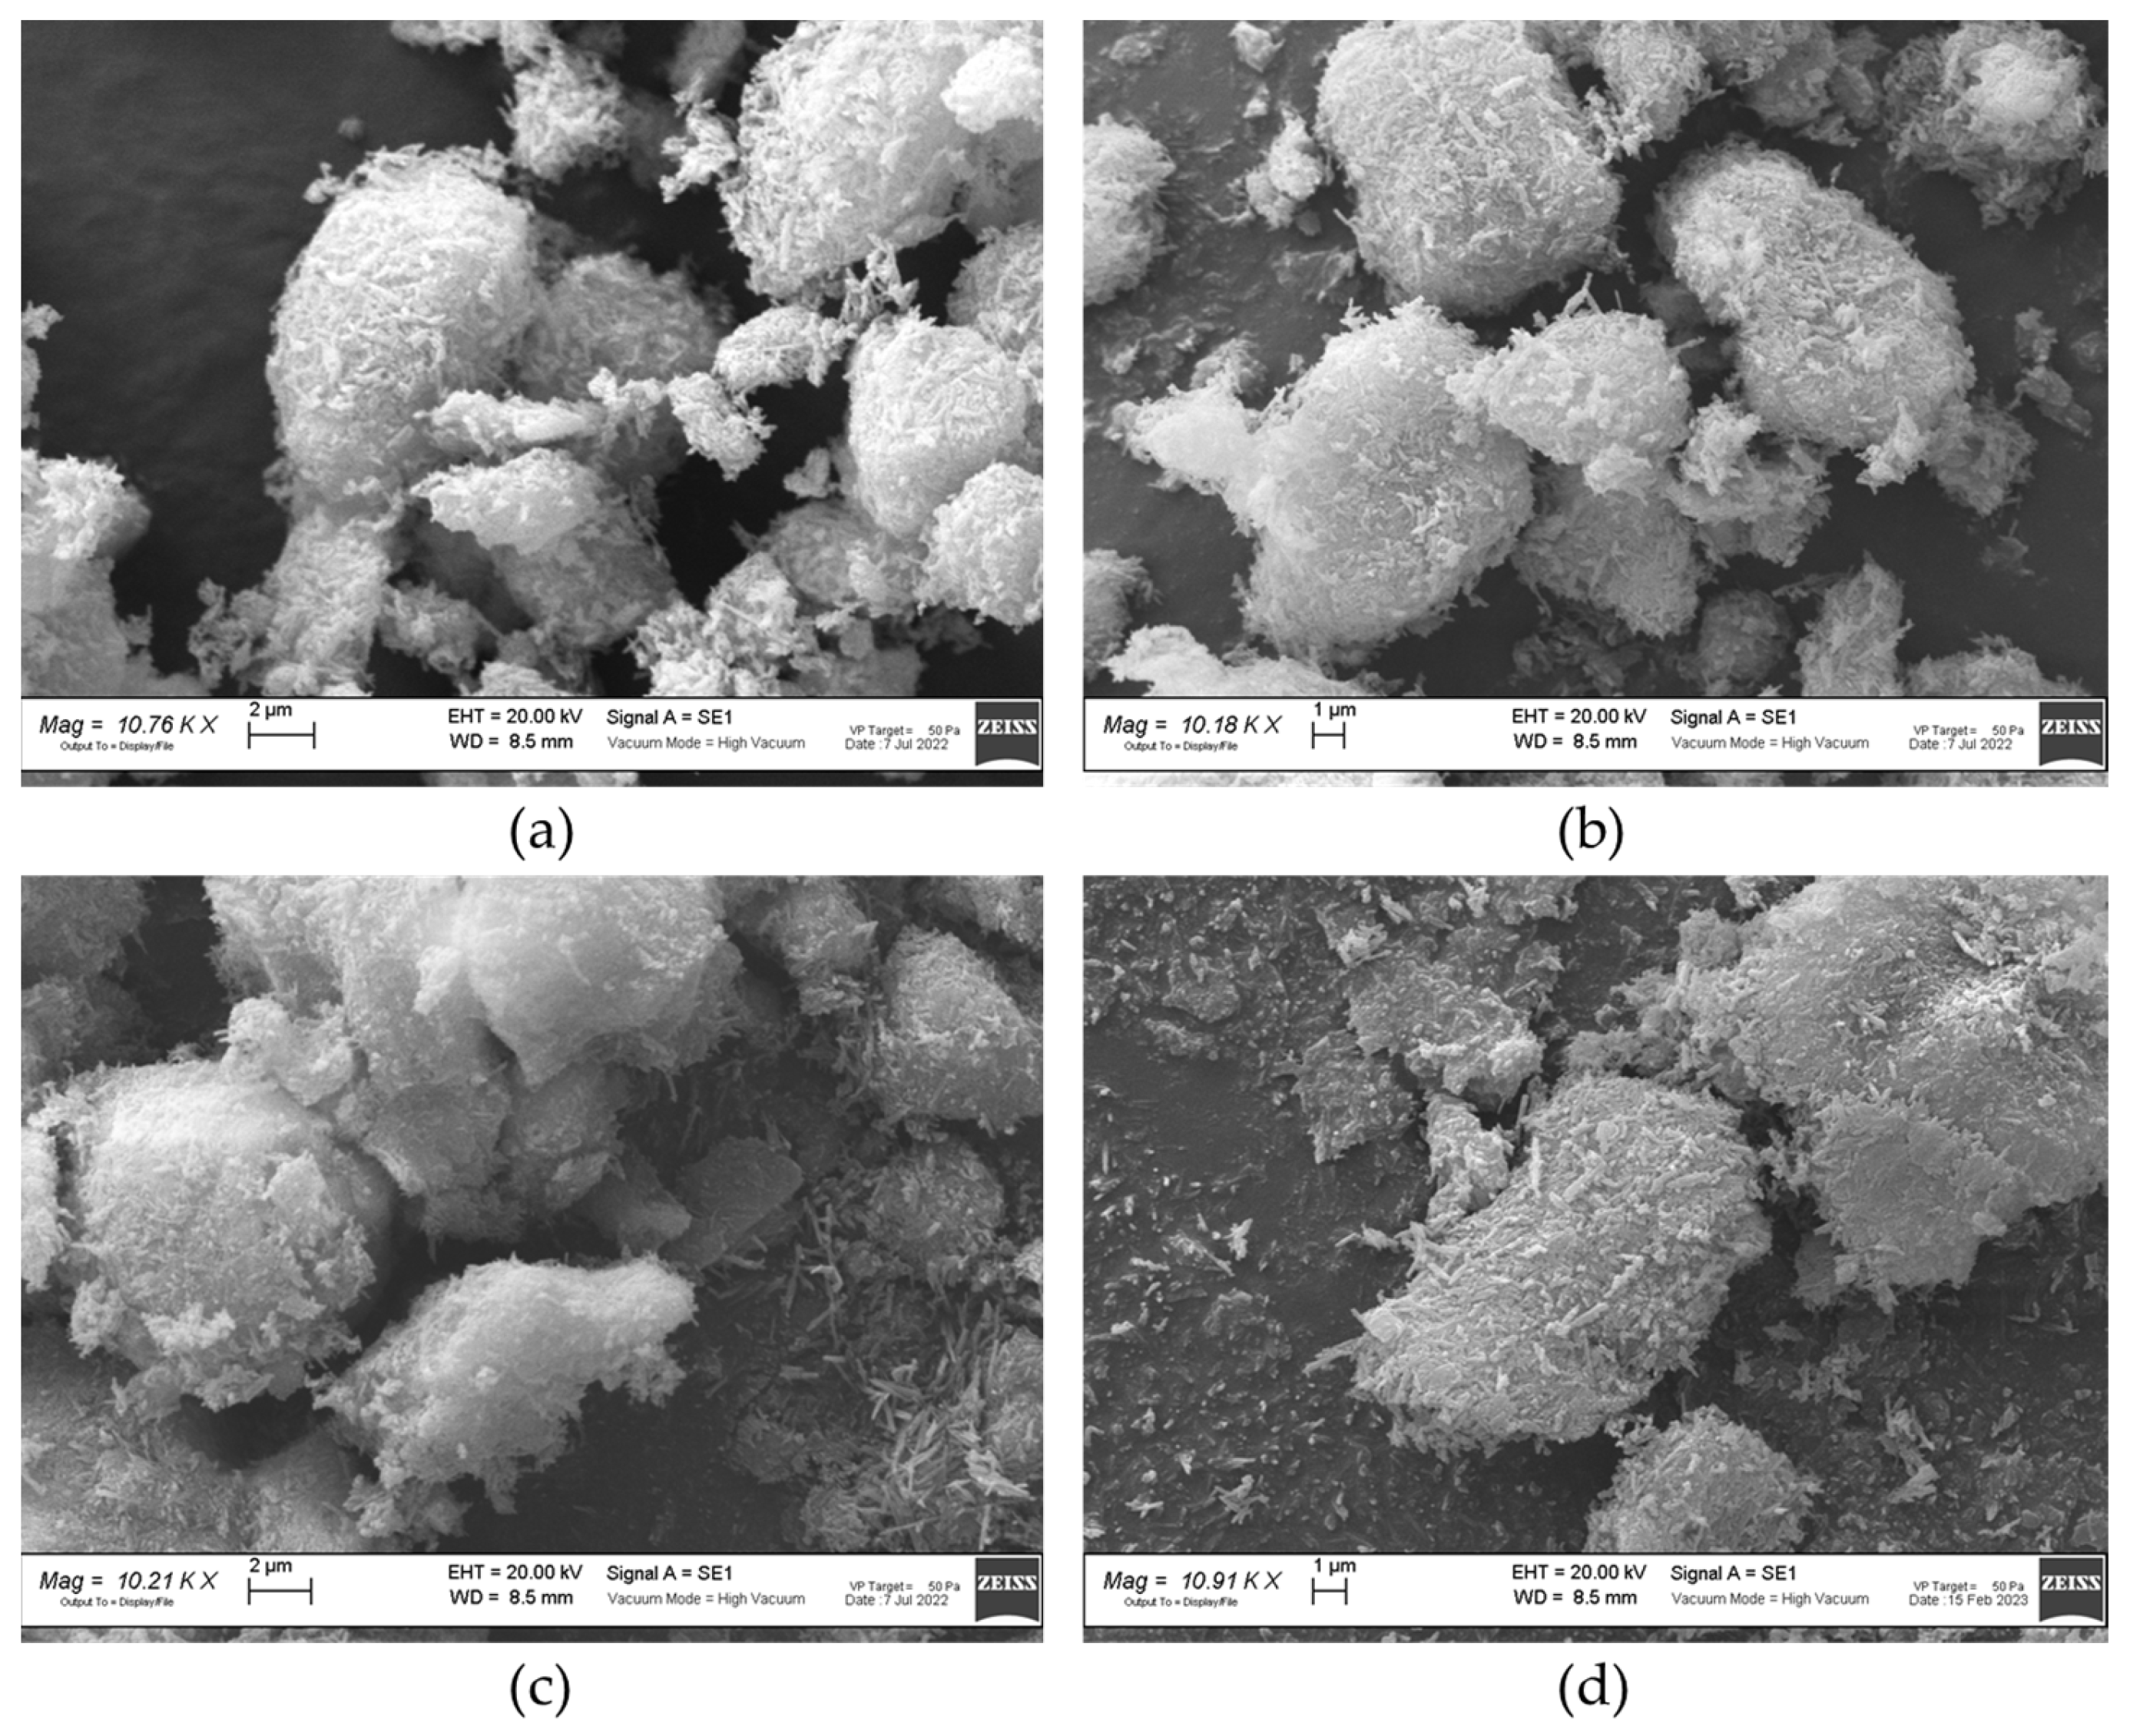
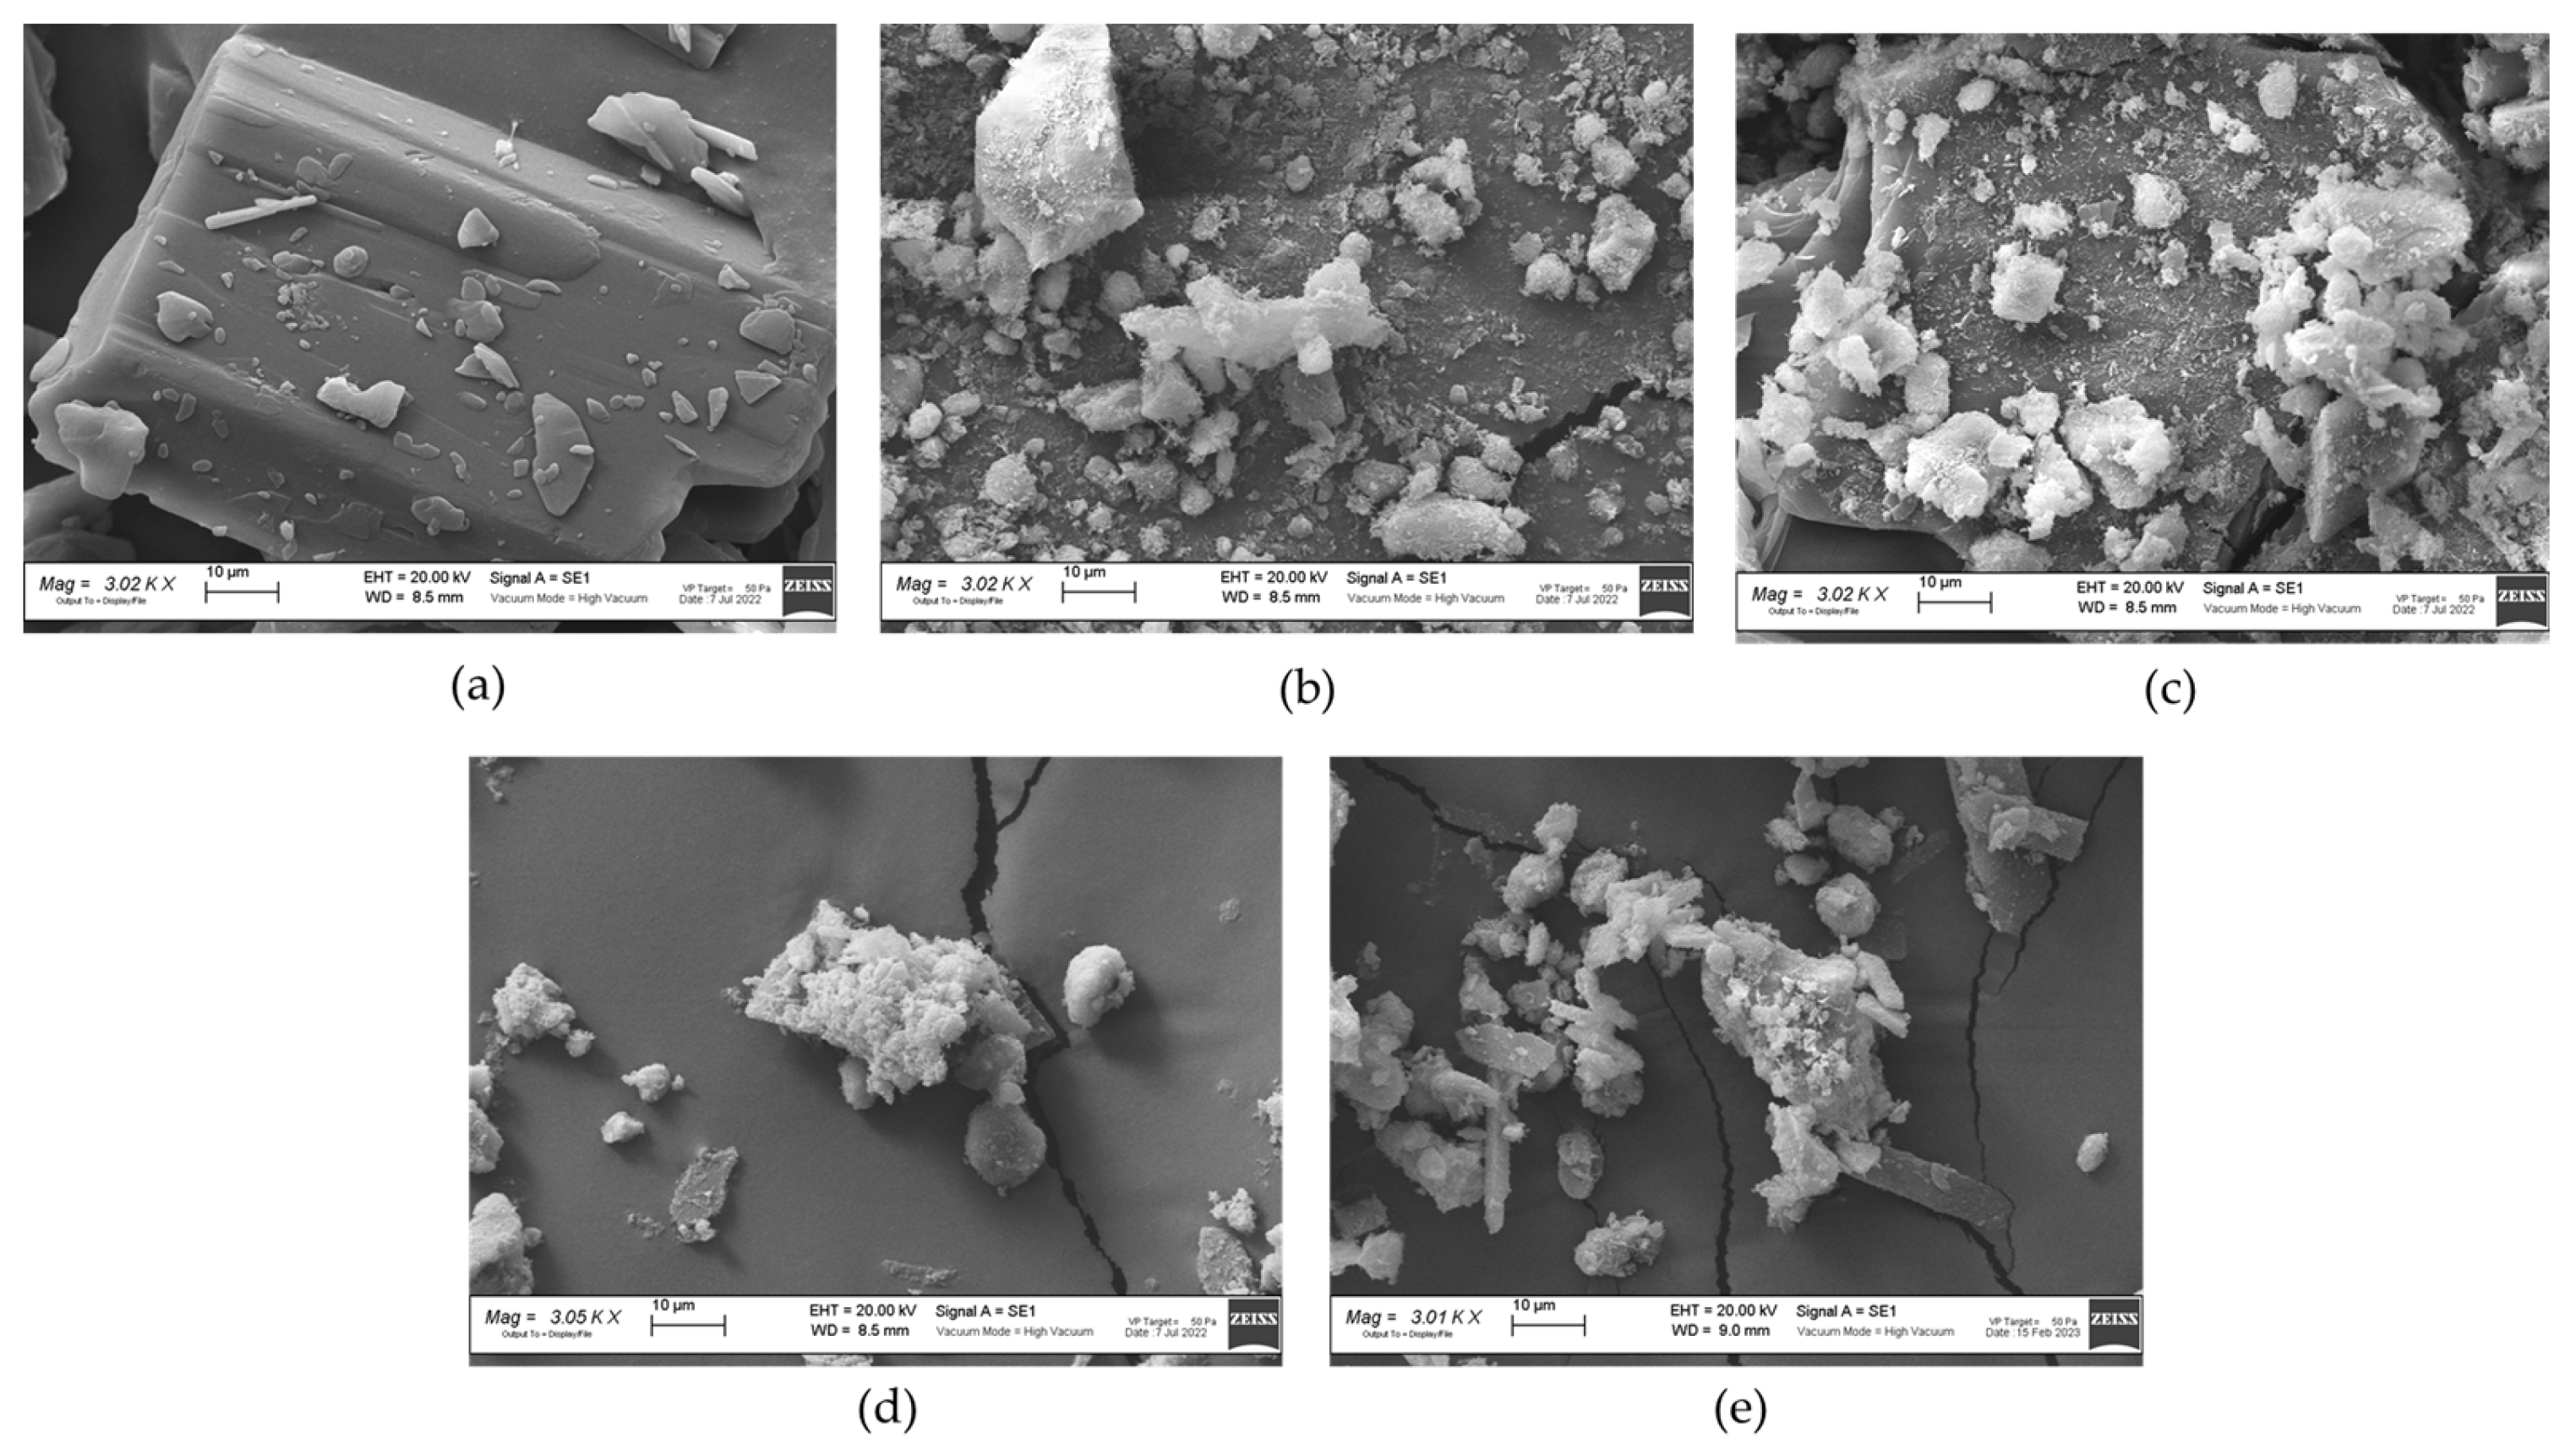
2.1.4. SEM
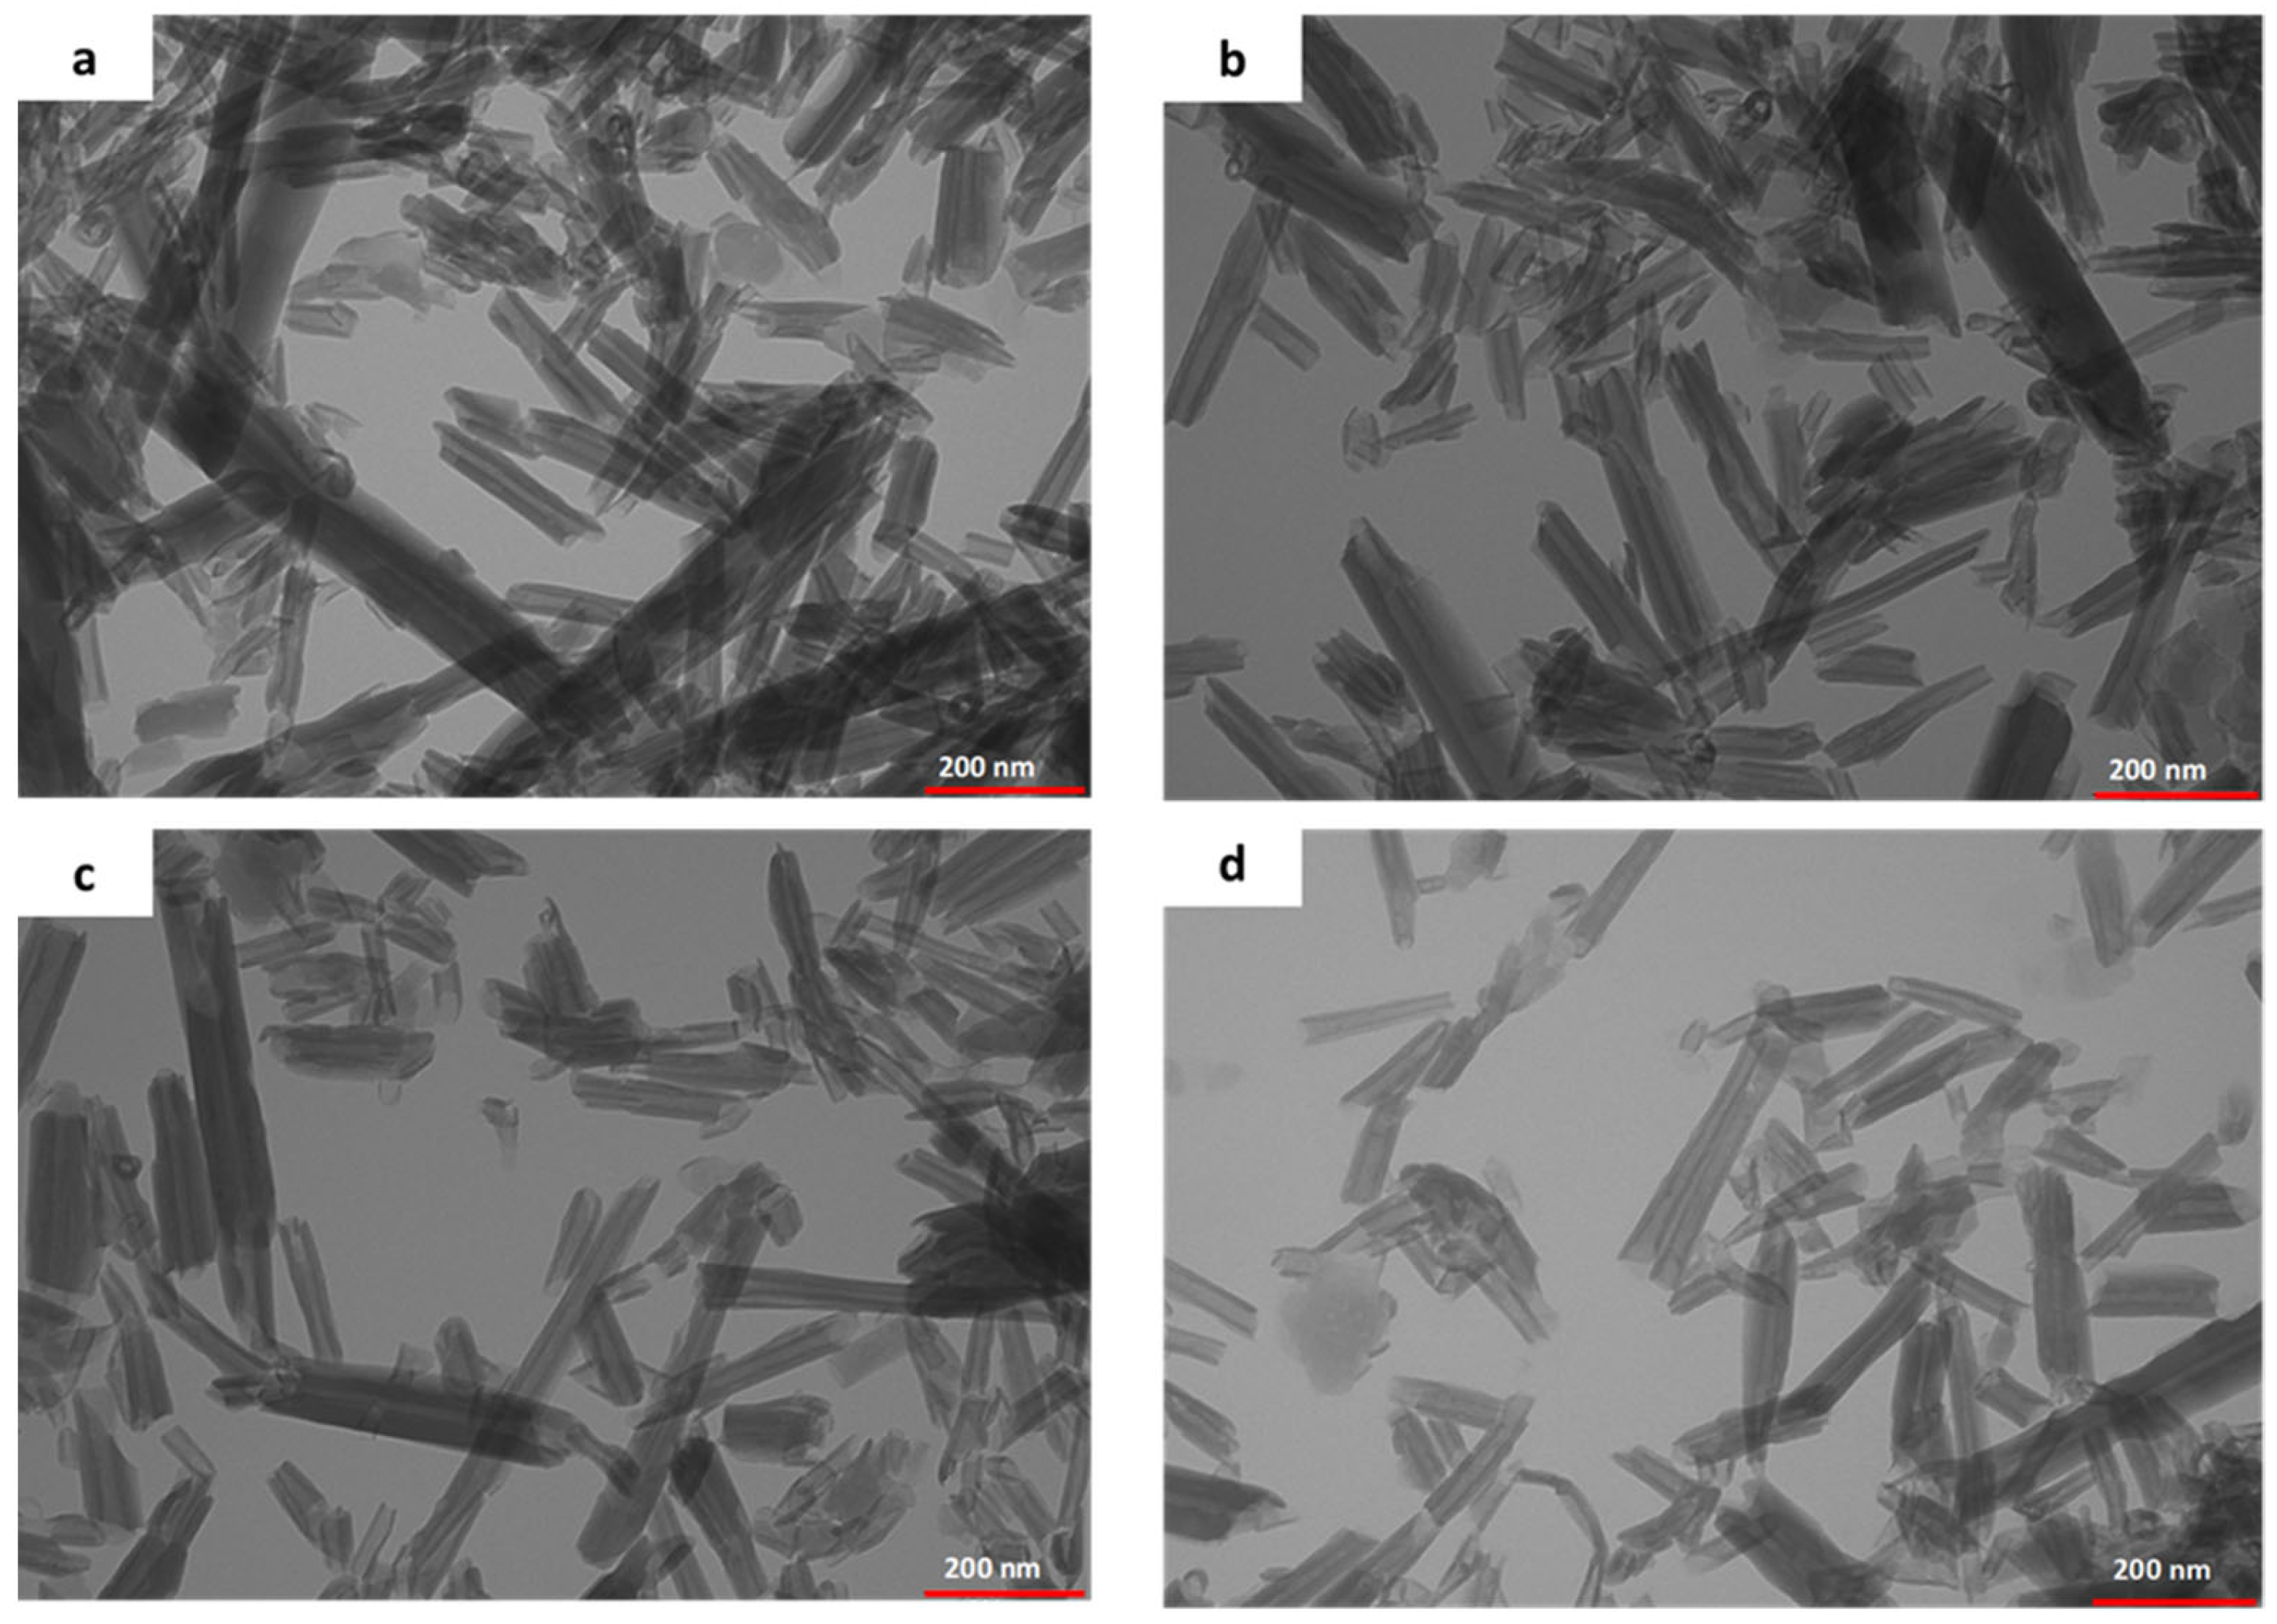
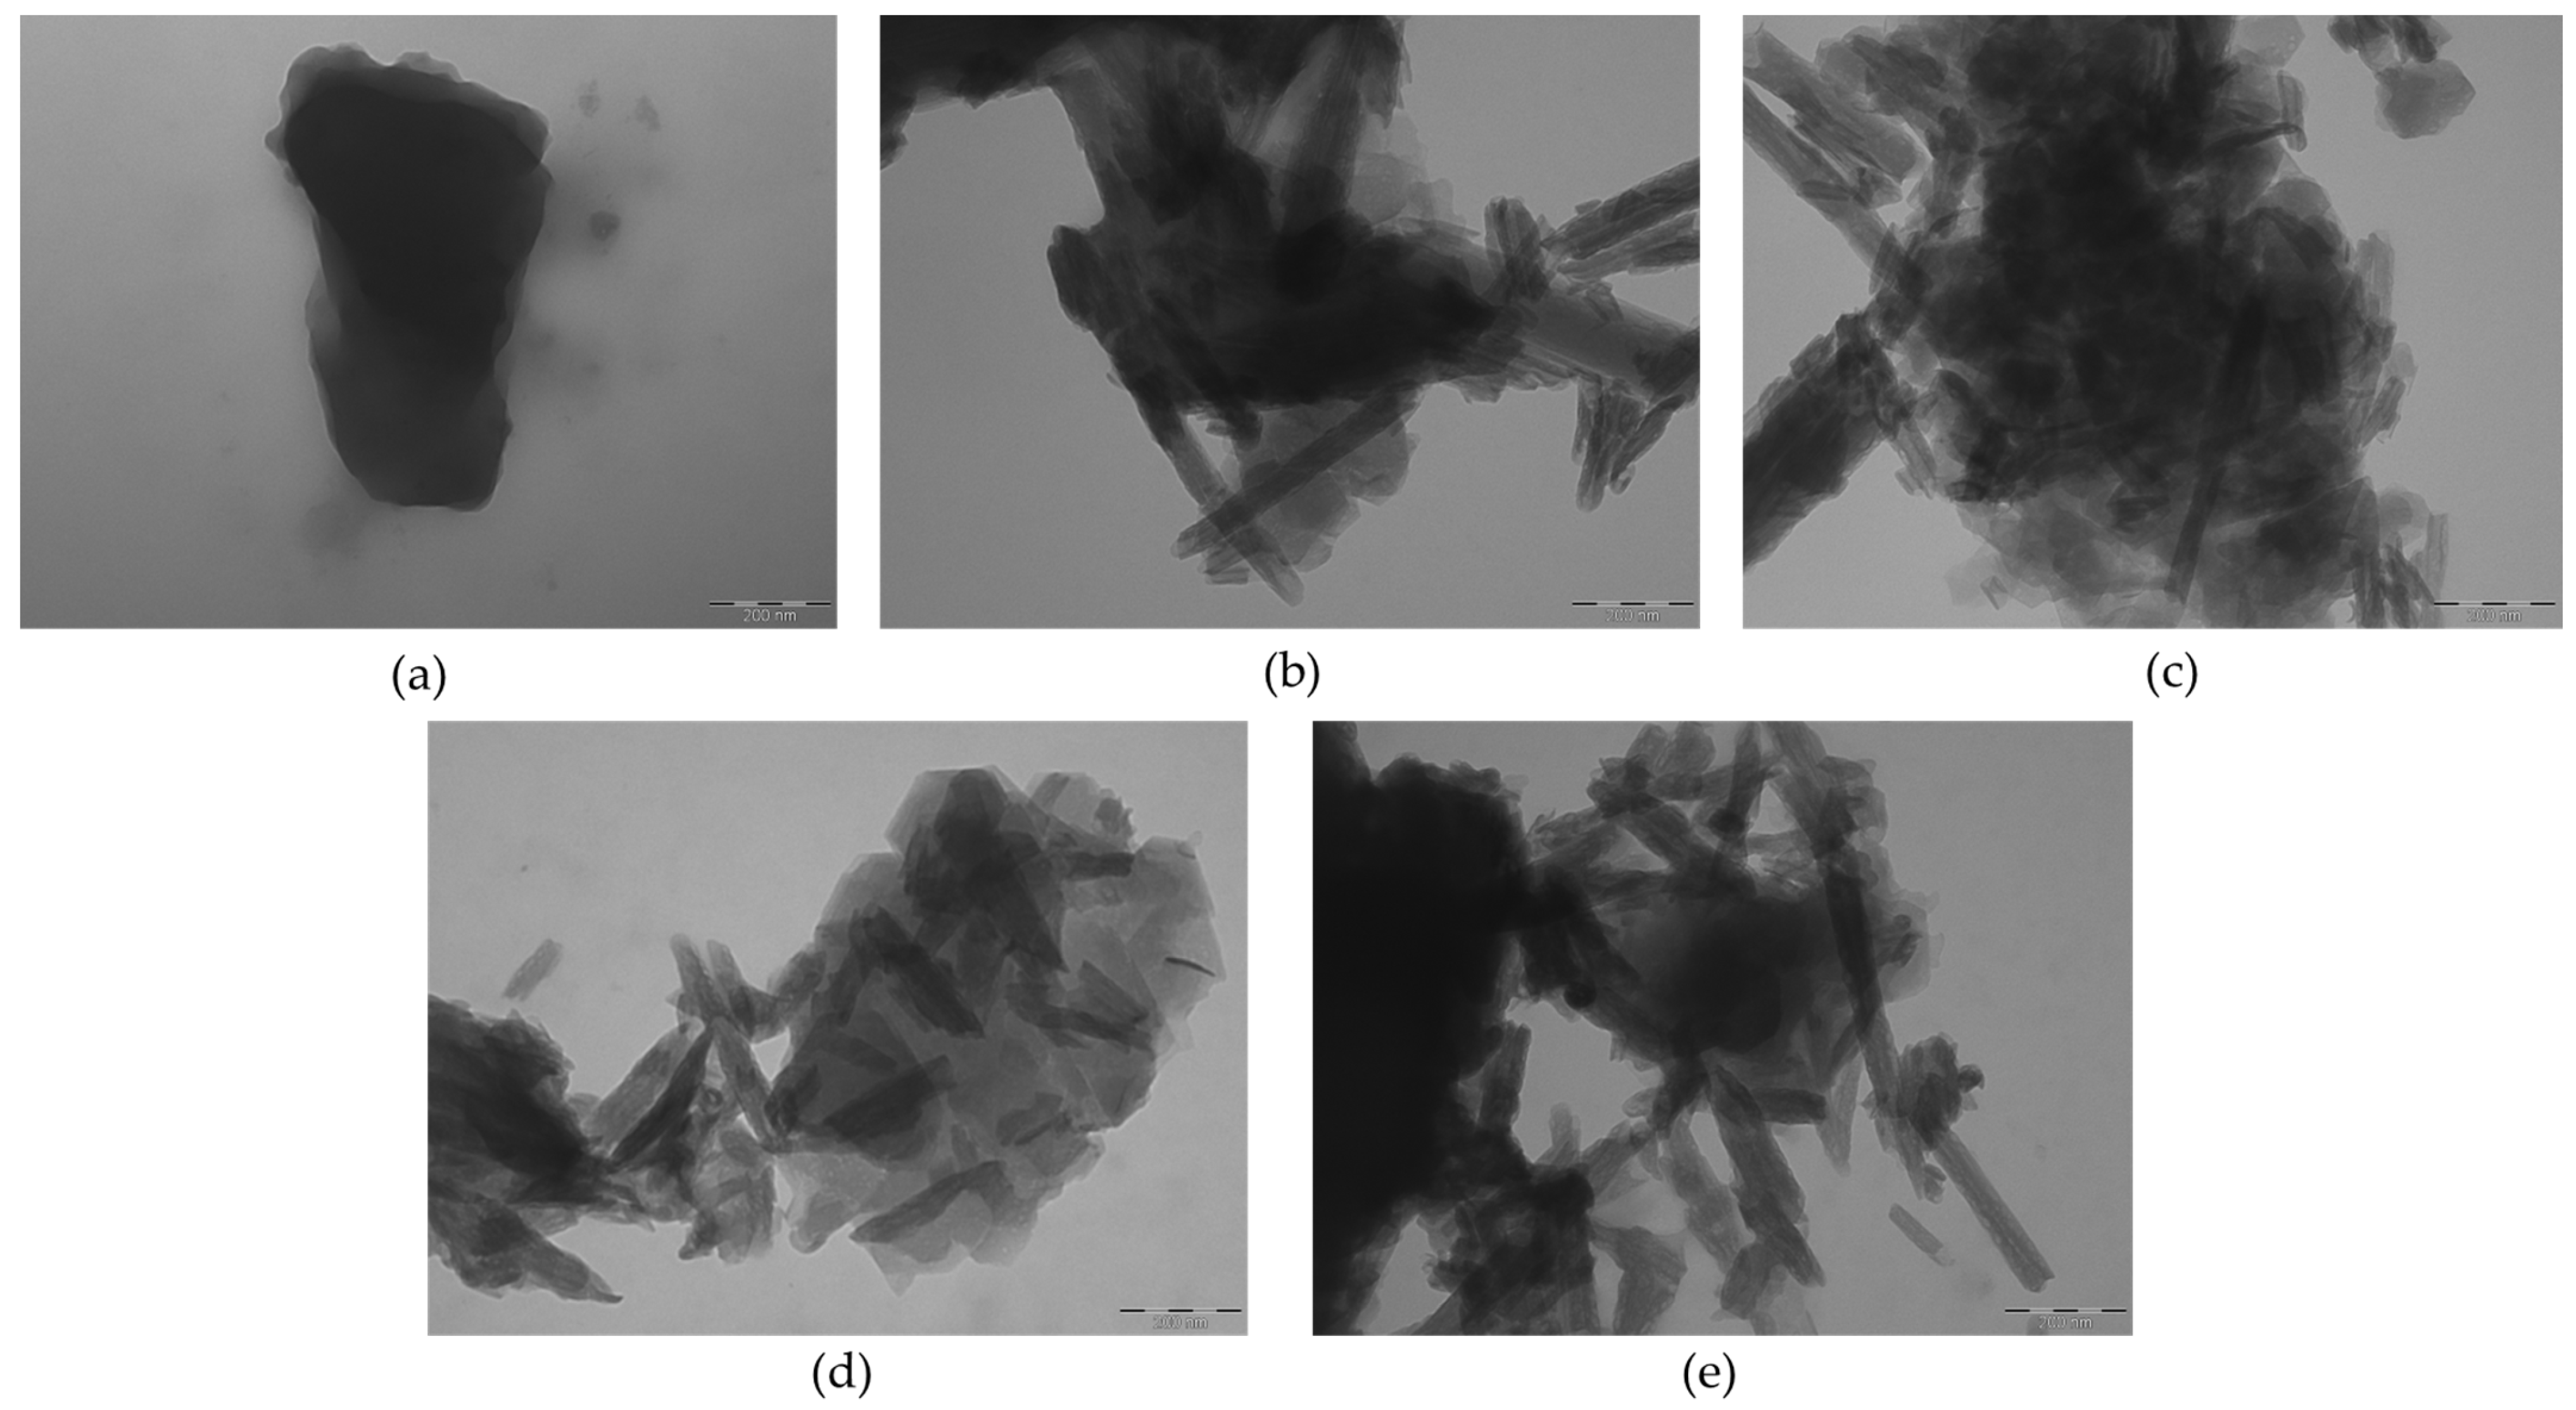
2.1.5. TEM
2.1.6. BET Analysis
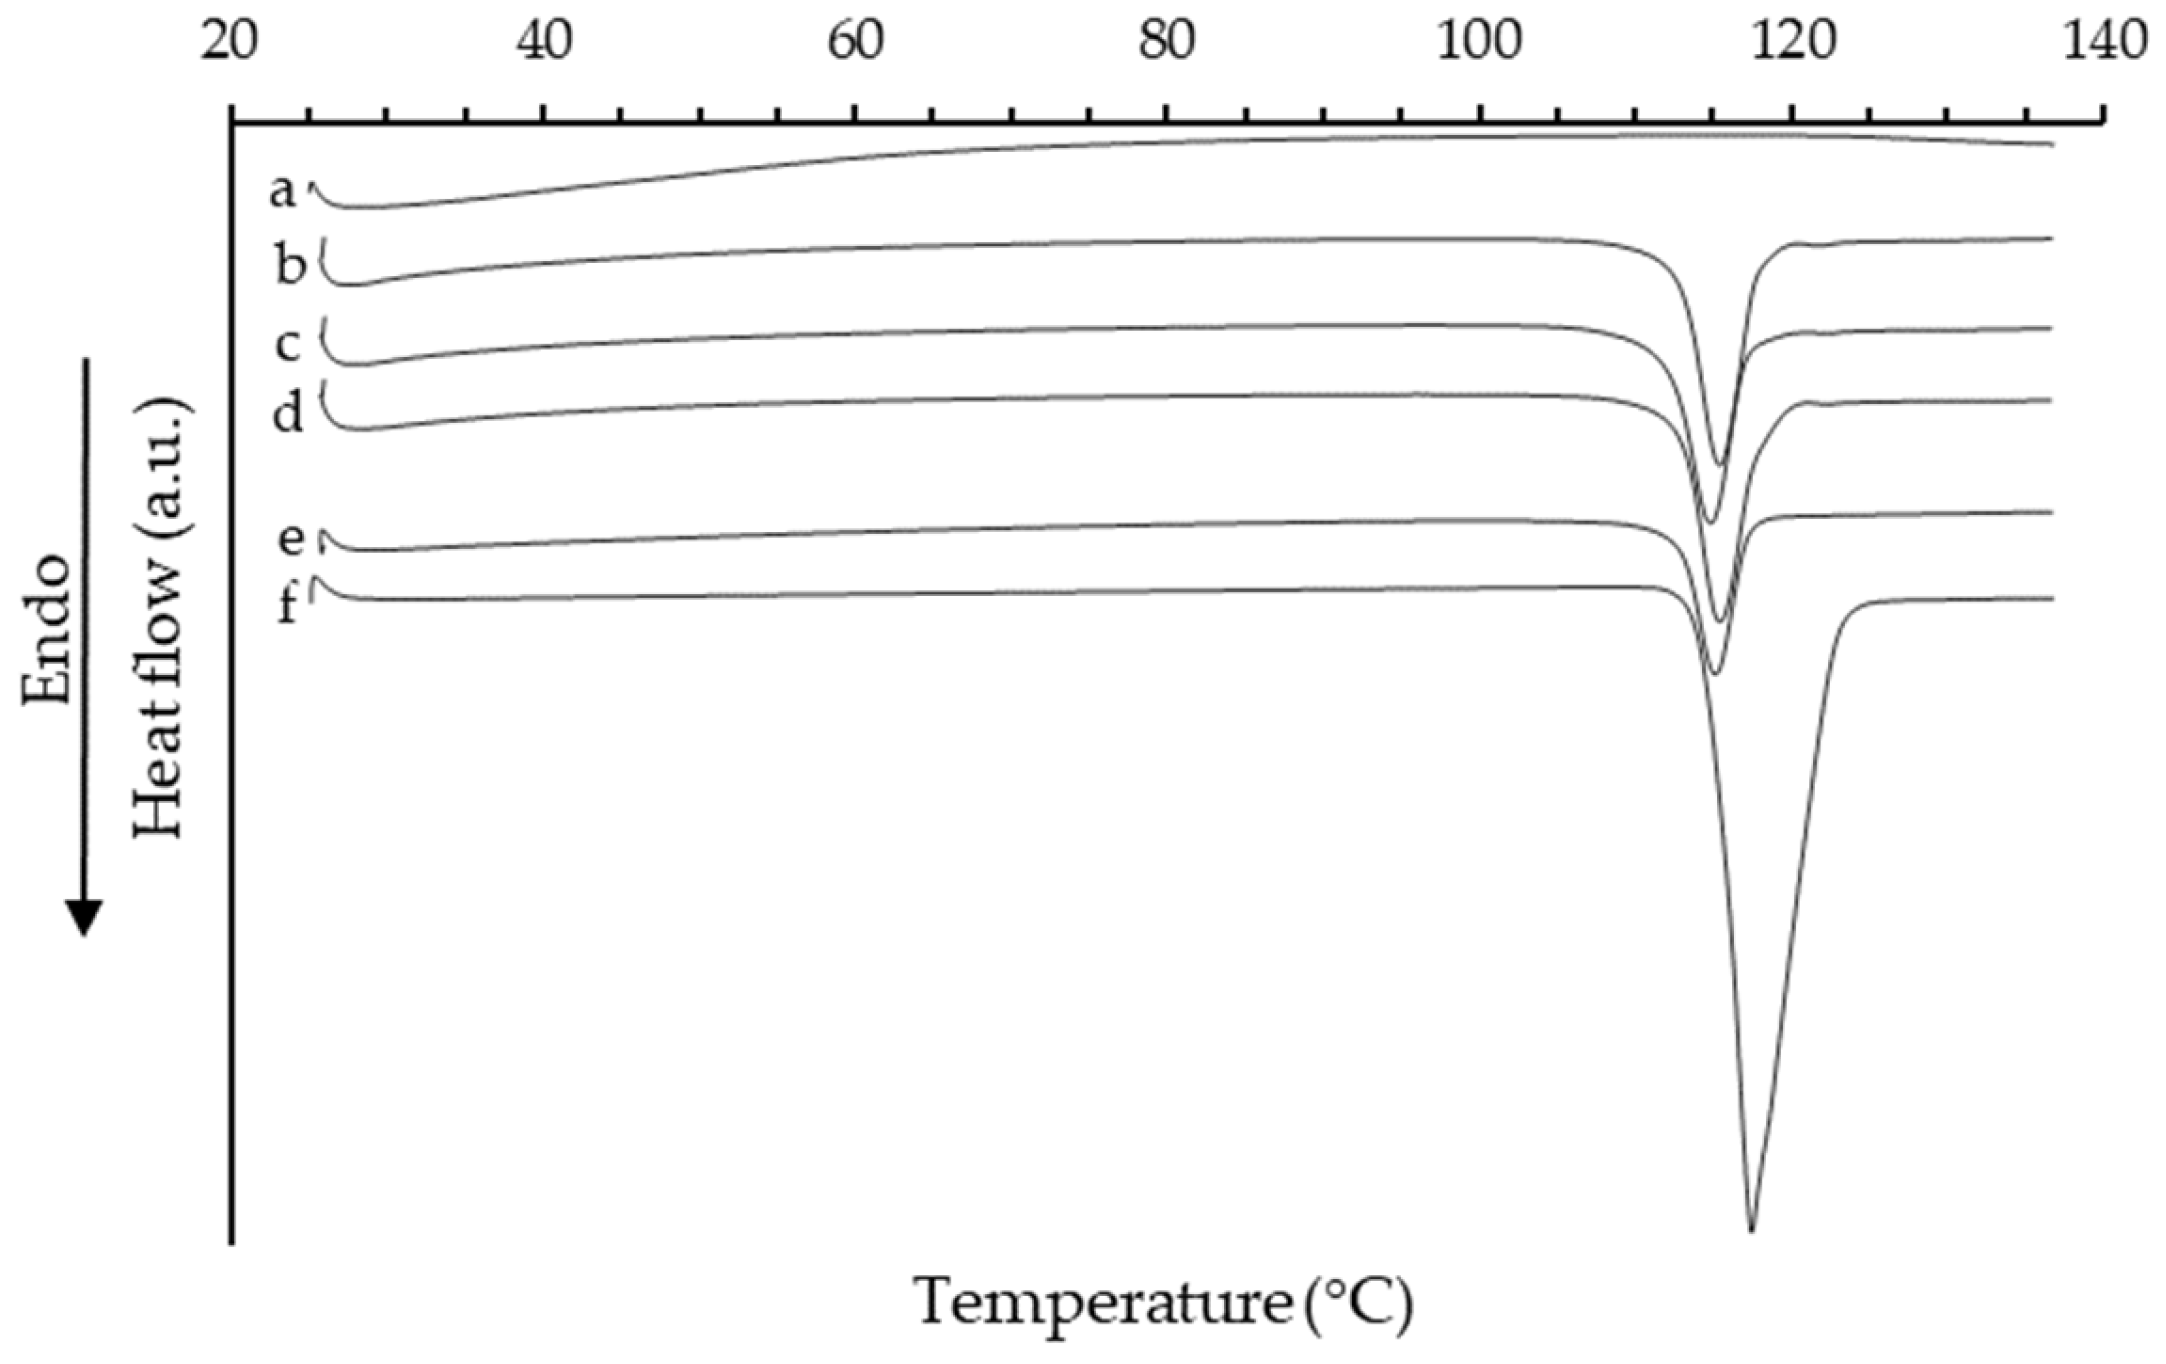
2.1.7. DSC
2.1.8. Carvedilol Content
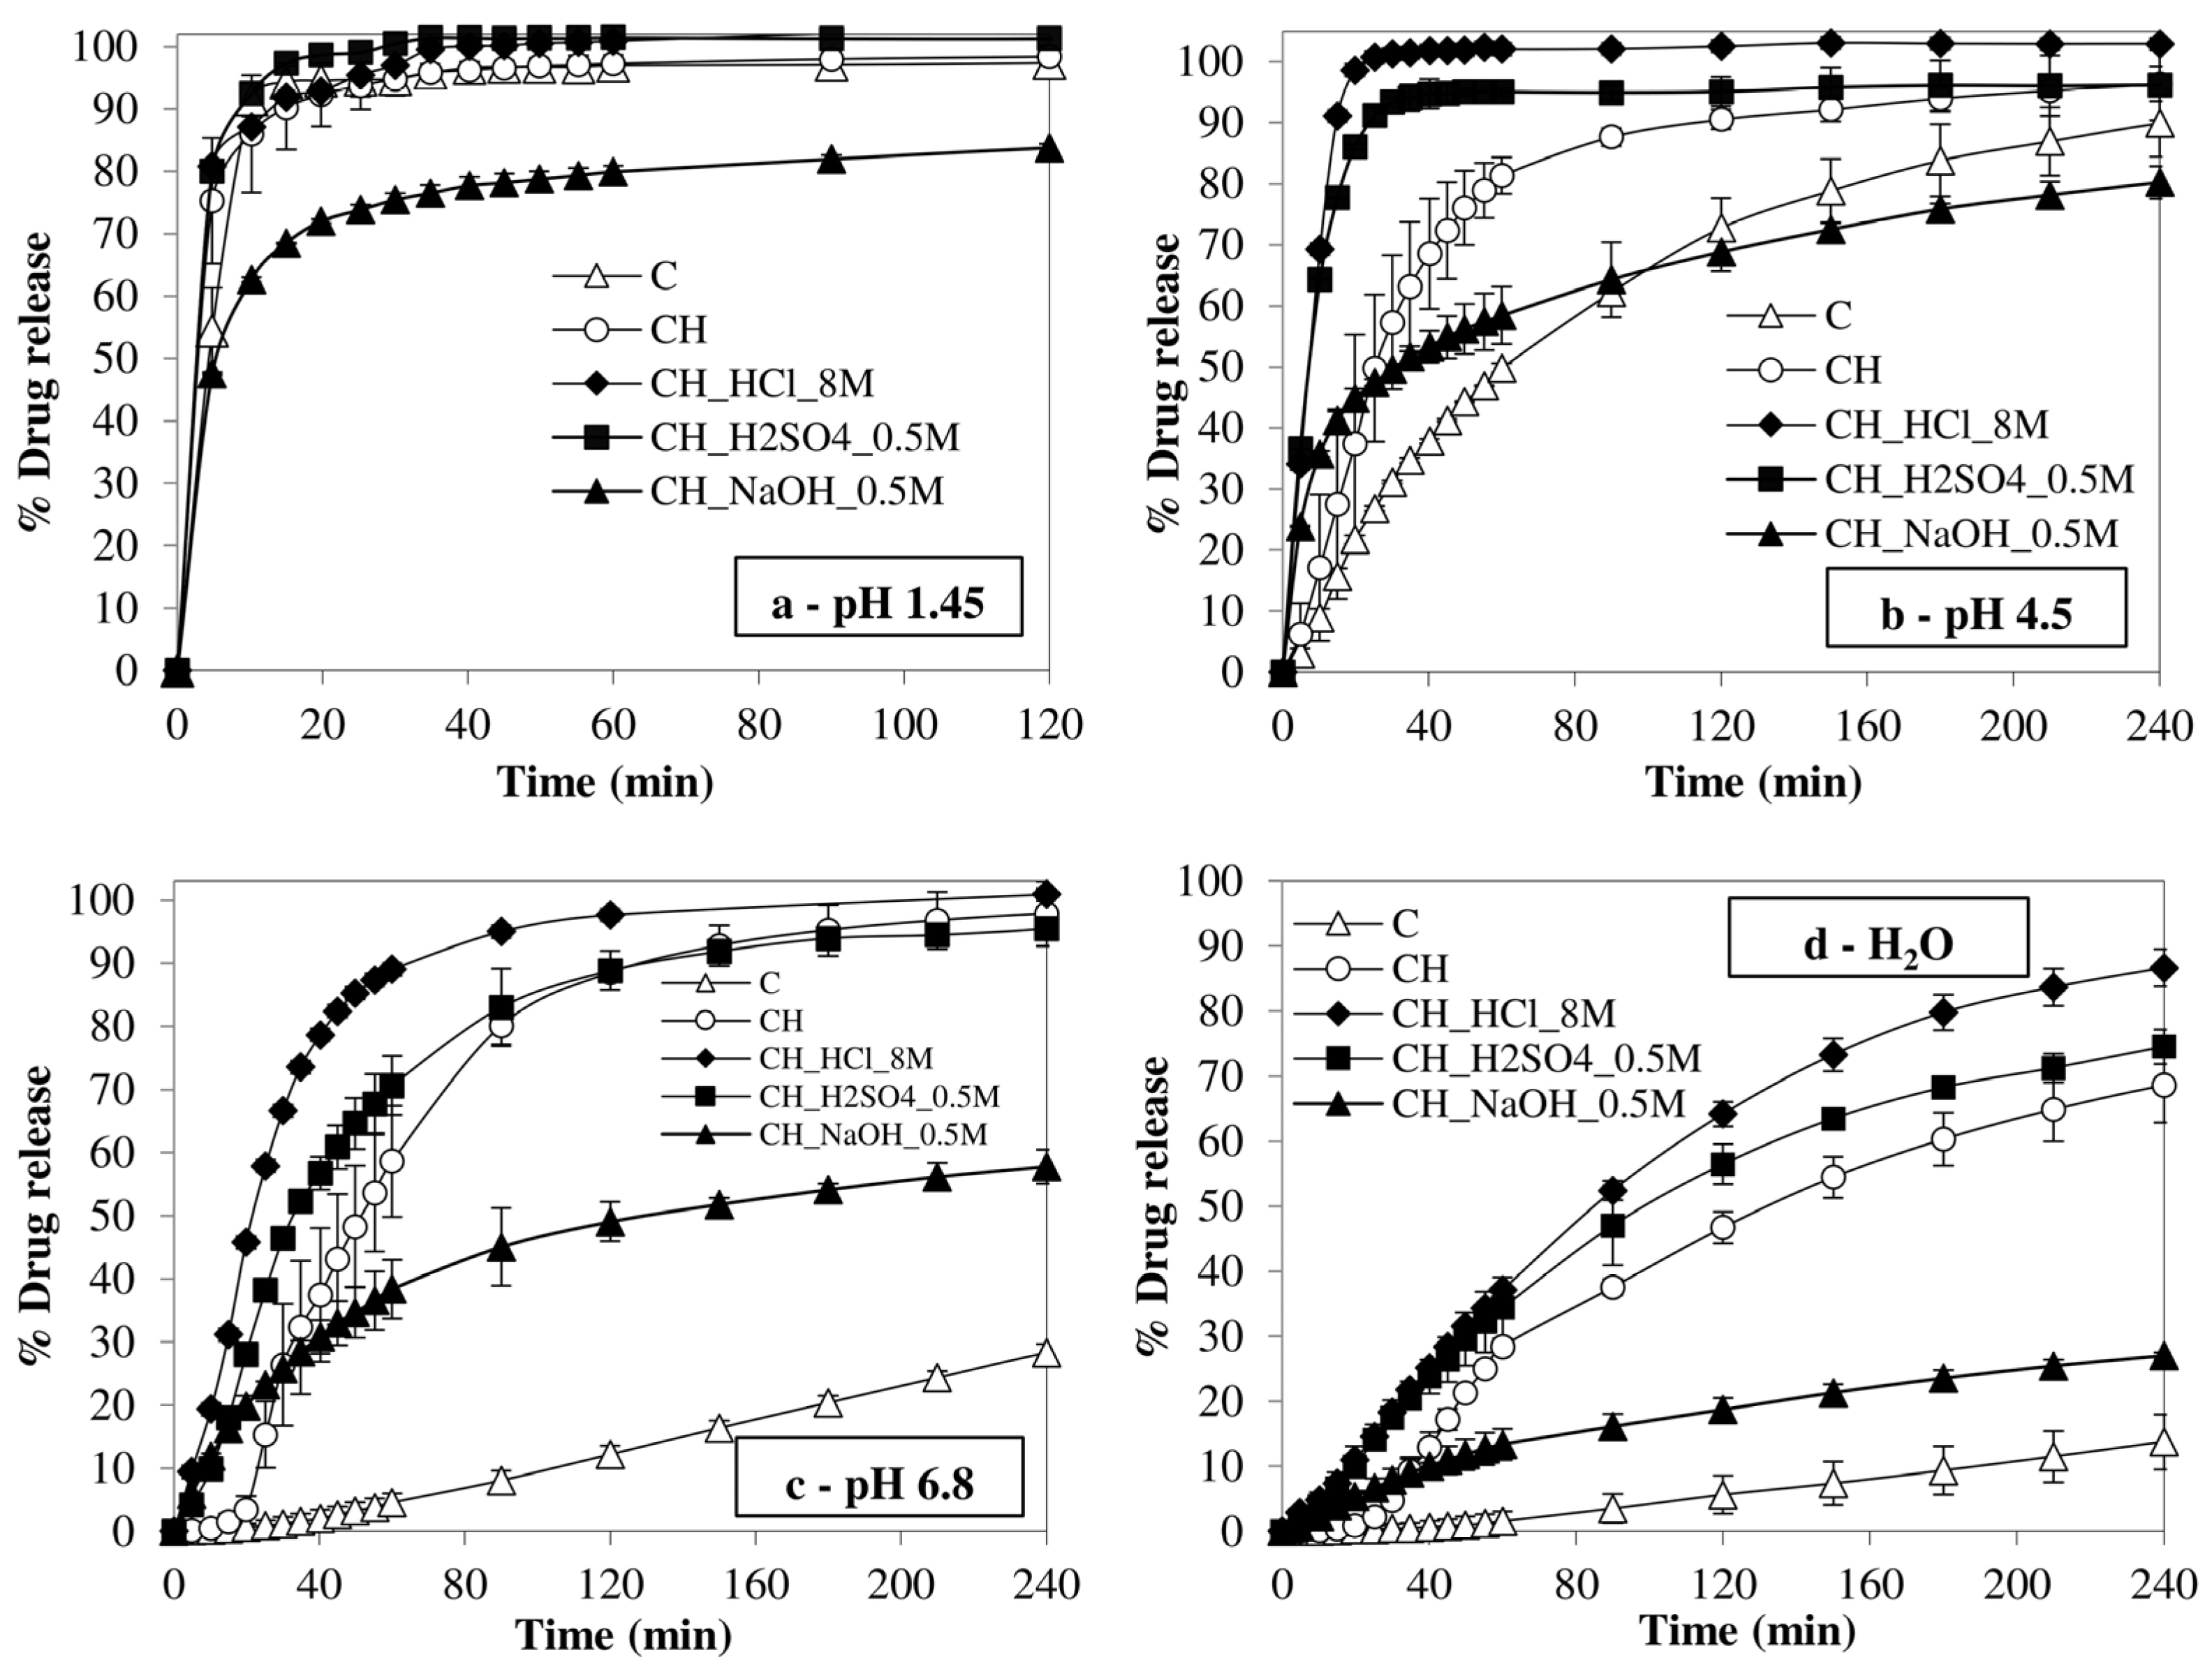
2.1.9. Dissolution Tests
2.1.10. Solubility
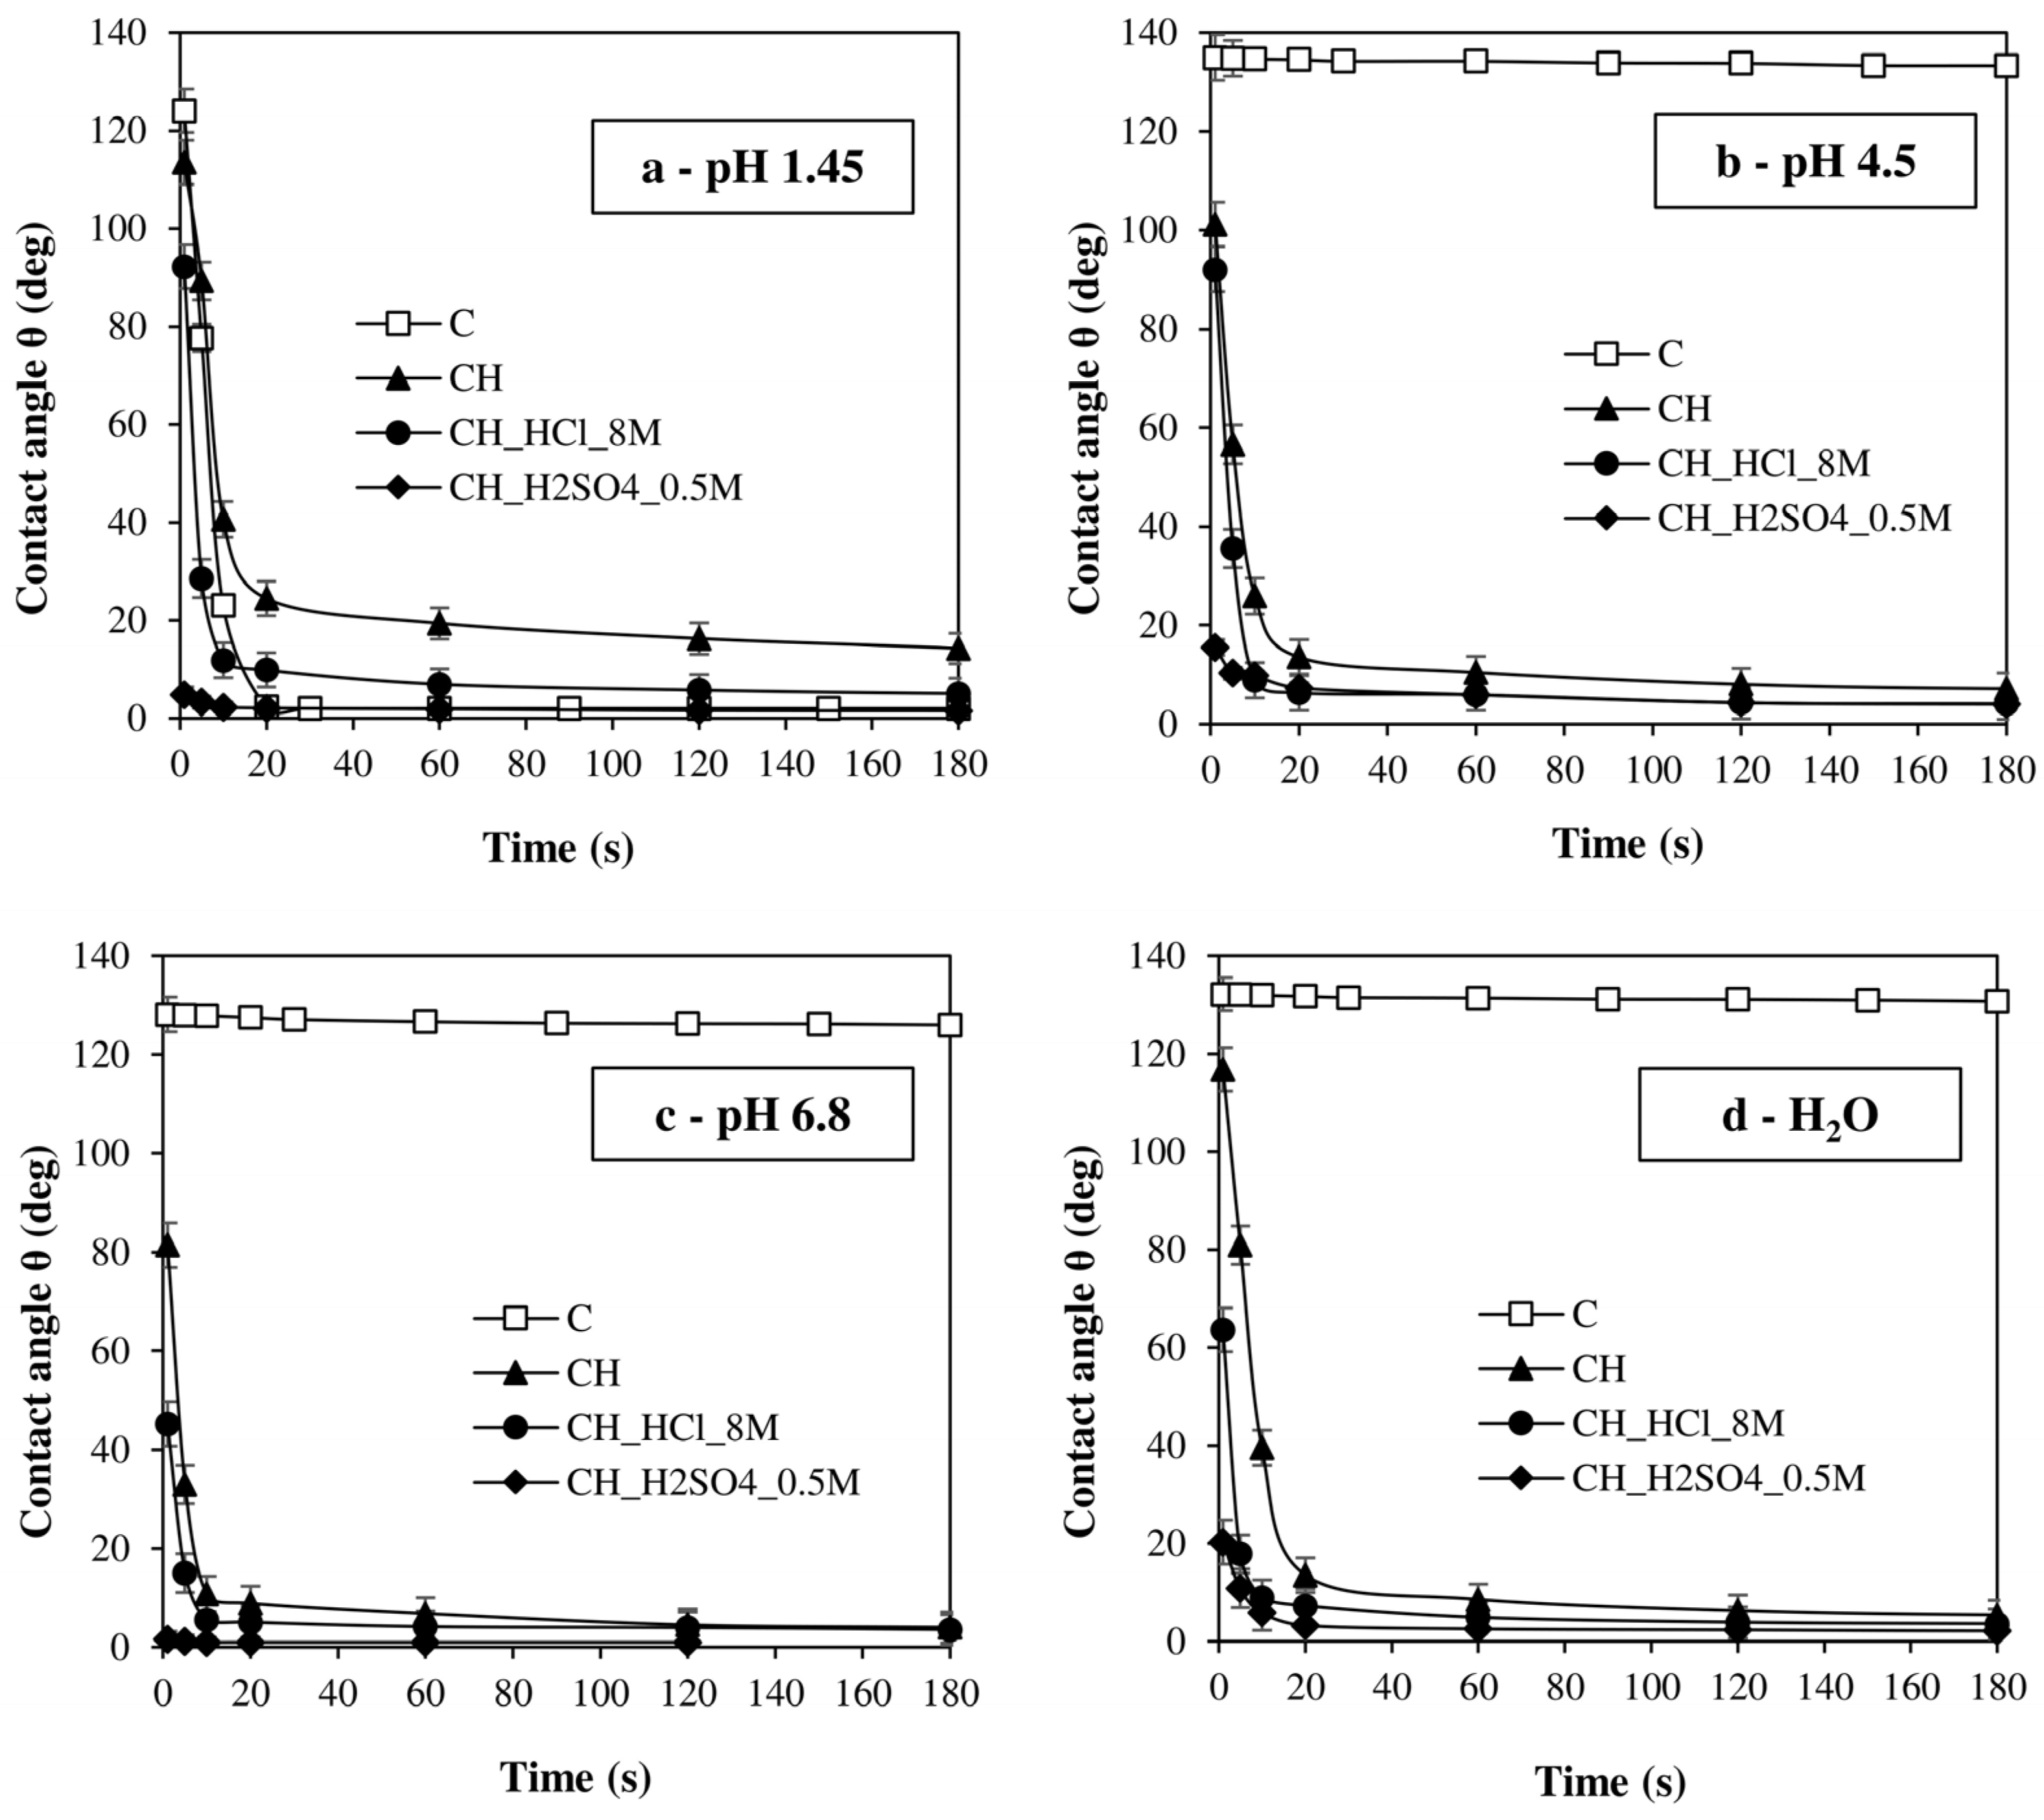
2.1.11. Contact Angle
3. Materials and Methods
3.1. Synthesis
3.1.1. Acid Activation of HNT with HCl
3.1.2. Acid Activation of HNT with H2SO4
3.1.3. Alkaline Activation of HNT with NaOH
3.1.4. Carvedilol Loading onto HNT
3.2. Characterization Techniques
3.3. Carvedilol Content and Dissolution Tests
- Hydrochloric solution pH 1.45 as required by USP guidelines;
- Phosphate buffer solution pH 4.5 (fed stomach condition);
- Phosphate buffer solution pH 6.8 (intestinal condition);
- Deionized water.
3.4. Solubility
3.5. Contact Angle
4. Conclusions
Supplementary Materials
Author Contributions
Funding
Institutional Review Board Statement
Informed Consent Statement
Data Availability Statement
Acknowledgments
Conflicts of Interest
References
- Good, D.J.; Rodríguez-Hornedo, N. Solubility Advantage of Pharmaceutical Cocrystals. Cryst. Growth Des. 2009, 9, 2252–2264. [Google Scholar] [CrossRef]
- Thayer, J.F.; Yamamoto, S.S.; Brosschot, J.F. The Relationship of Autonomic Imbalance, Heart Rate Variability and Cardiovascular Disease Risk Factors. Int. J. Cardiol. 2010, 141, 122–131. [Google Scholar] [CrossRef] [PubMed]
- Kumar, S.; Singh, P. Various Techniques for Solubility Enhancement: An Overview. Pharma Innov. 2016, 5, 23–28. [Google Scholar]
- Braga, D.; Grepioni, F.; Maini, L.; Polito, M. Crystal Polymorphism and Multiple Crystal Forms. In Molecular Networks; Hosseini, M.W., Ed.; Structure and Bonding; Springer: Berlin/Heidelberg, Germany, 2009; pp. 87–95. ISBN 978-3-642-01367-6. [Google Scholar]
- Lu, J.; Li, Z.; Jiang, X. Polymorphism of Pharmaceutical Molecules: Perspectives on Nucleation. Front. Chem. Sci. Eng. 2010, 4, 37–44. [Google Scholar] [CrossRef]
- DeMatos, L.L.; Williams, A.C.; Booth, S.W.; Petts, C.R.; Taylor, D.J.; Blagden, N. Solvent Influences on Metastable Polymorph Lifetimes: Real-Time Interconversions Using Energy Dispersive X-Ray Diffractometry. J. Pharm. Sci. 2007, 96, 1069–1078. [Google Scholar] [CrossRef] [PubMed]
- Karki, S.; Friscić, T.; Jones, W.; Motherwell, W.D.S. Screening for Pharmaceutical Cocrystal Hydrates via Neat and Liquid-Assisted Grinding. Mol. Pharm. 2007, 4, 347–354. [Google Scholar] [CrossRef]
- Pudipeddi, M.; Serajuddin, A.T.M. Trends in Solubility of Polymorphs. J. Pharm. Sci. 2005, 94, 929–939. [Google Scholar] [CrossRef]
- Braga, D.; Chelazzi, L.; Grepioni, F.; Dichiarante, E.; Chierotti, M.; Gobetto, R. Molecular Salts of Anesthetic Lidocaine with Dicarboxylic Acids: Solid-State Properties and a Combined Structural and Spectroscopic Study. Cryst. Growth Des. 2013, 13, 2564–2572. [Google Scholar] [CrossRef]
- Bruni, G.; Maietta, M.; Maggi, L.; Bini, M.; Capsoni, D.; Ferrari, S.; Boiocchi, M.; Berbenni, V.; Milanese, C.; Marini, A. Perphenazine–Fumaric Acid Salts with Improved Solubility: Preparation, Physico-Chemical Characterization and in Vitro Dissolution. CrystEngComm 2012, 14, 6035–6044. [Google Scholar] [CrossRef]
- Trask, A.V.; Haynes, D.A.; Motherwell, W.D.S.; Jones, W. Screening for Crystalline Salts via Mechanochemistry. Chem. Commun. 2006, 1, 51–53. [Google Scholar] [CrossRef]
- Bethune, S.J.; Huang, N.; Jayasankar, A.; Rodríguez-Hornedo, N. Understanding and Predicting the Effect of Cocrystal Components and PH on Cocrystal Solubility. Cryst. Growth Des. 2009, 9, 3976–3988. [Google Scholar] [CrossRef]
- Bruni, G.; Maietta, M.; Maggi, L.; Mustarelli, P.; Ferrara, C.; Berbenni, V.; Milanese, C.; Girella, A.; Marini, A. Preparation and Physicochemical Characterization of Acyclovir Cocrystals with Improved Dissolution Properties. J. Pharm. Sci. 2013, 102, 4079–4086. [Google Scholar] [CrossRef] [PubMed]
- Friščić, T.; Jones, W. Cocrystal Architecture and Properties: Design and Building of Chiral and Racemic Structures by Solid–Solid Reactions. Faraday Discuss. 2007, 136, 167–178. [Google Scholar] [CrossRef] [PubMed]
- Jirát, J.; Ondo, D.; Babor, M.; Ridvan, L.; Šoóš, M. Complex Methodology for Rational Design of Apremilast-Benzoic Acid Co-Crystallization Process. Int. J. Pharm. 2019, 570, 118639. [Google Scholar] [CrossRef] [PubMed]
- Loftsson, T. Drug Solubilization by Complexation. Int. J. Pharm. 2017, 531, 276–280. [Google Scholar] [CrossRef] [PubMed]
- Li, Q.; Li, X.; Zhao, C. Strategies to Obtain Encapsulation and Controlled Release of Small Hydrophilic Molecules. Front. Bioeng. Biotechnol. 2020, 8, 437. [Google Scholar] [CrossRef]
- Tran, T.T.D.; Tran, P.H.L. Nanoconjugation and Encapsulation Strategies for Improving Drug Delivery and Therapeutic Efficacy of Poorly Water-Soluble Drugs. Pharmaceutics 2019, 11, 325. [Google Scholar] [CrossRef] [Green Version]
- Yang, K.Y.; Hwang, D.H.; Yousaf, A.M.; Kim, D.-W.; Shin, Y.-J.; Bae, O.-N.; Kim, Y.-I.; Kim, J.O.; Yong, C.S.; Choi, H.-G. Silymarin-Loaded Solid Nanoparticles Provide Excellent Hepatic Protection: Physicochemical Characterization and in Vivo Evaluation. Int. J. Nanomed. 2013, 8, 3333–3343. [Google Scholar] [CrossRef] [Green Version]
- Massaro, M.; Colletti, C.G.; Lazzara, G.; Riela, S. The Use of Some Clay Minerals as Natural Resources for Drug Carrier Applications. J. Funct. Biomater. 2018, 9, 58. [Google Scholar] [CrossRef] [Green Version]
- Abdullayev, E.; Lvov, Y. Halloysite Clay Nanotubes as a Ceramic “Skeleton” for Functional Biopolymer Composites with Sustained Drug Release. J. Mater. Chem. B 2013, 1, 2894–2903. [Google Scholar] [CrossRef]
- Yu, L.; Wang, H.; Zhang, B.; Liu, J. Recent Advance of Halloysite Nanotubes Derived Composites in Water Treatment. Environ. Sci. Nano 2015, 3, 28–44. [Google Scholar] [CrossRef]
- Fizir, M.; Dramou, P.; Dahiru, N.S.; Ruya, W.; Huang, T.; He, H. Halloysite Nanotubes in Analytical Sciences and in Drug Delivery: A Review. Mikrochim Acta 2018, 185, 389. [Google Scholar] [CrossRef] [PubMed]
- Yuan, P.; Tan, D.; Annabi-Bergaya, F. Properties and Applications of Halloysite Nanotubes: Recent Research Advances and Future Prospects. Appl. Clay Sci. 2015, 112–113, 75–93. [Google Scholar] [CrossRef]
- Lvov, Y.; Aerov, A.; Fakhrullin, R. Clay Nanotube Encapsulation for Functional Biocomposites. Adv. Colloid Interface Sci. 2014, 207, 189–198. [Google Scholar] [CrossRef] [PubMed]
- Liu, T.; Zhang, J.; Ouyang, P.; Fu, L.; Yang, H. The Relation between Nanotube Diameter, Length and Surface Area and Pore Volume of Multi-Walled Spiral Halloysite Nanotubes: A Theoretical Study. Appl. Clay Sci. 2021, 215, 106303. [Google Scholar] [CrossRef]
- Peixoto, A.F.; Fernandes, A.C.; Pereira, C.; Pires, J.; Freire, C. Physicochemical Characterization of Organosilylated Halloysite Clay Nanotubes. Microporous Mesoporous Mater. 2016, 219, 145–154. [Google Scholar] [CrossRef]
- Yang, J.; Wu, Y.; Shen, Y.; Zhou, C.; Li, Y.-F.; He, R.-R.; Liu, M. Enhanced Therapeutic Efficacy of Doxorubicin for Breast Cancer Using Chitosan Oligosaccharide-Modified Halloysite Nanotubes. ACS Appl. Mater. Interfaces 2016, 8, 26578–26590. [Google Scholar] [CrossRef]
- Abdullayev, E.; Joshi, A.; Wei, W.; Zhao, Y.; Lvov, Y. Enlargement of Halloysite Clay Nanotube Lumen by Selective Etching of Aluminum Oxide. ACS Nano 2012, 6, 7216–7226. [Google Scholar] [CrossRef]
- White, R.D.; Bavykin, D.V.; Walsh, F.C. The Stability of Halloysite Nanotubes in Acidic and Alkaline Aqueous Suspensions. Nanotechnology 2012, 23, 065705. [Google Scholar] [CrossRef]
- Horváth, E.; Kristóf, J.; Kurdi, R.; Makó, É.; Khunová, V. Study of Urea Intercalation into Halloysite by Thermoanalytical and Spectroscopic Techniques. J. Therm. Anal. Calorim. 2011, 105, 53–59. [Google Scholar] [CrossRef]
- Nicolini, K.P.; Fukamachi, C.R.B.; Wypych, F.; Mangrich, A.S. Dehydrated Halloysite Intercalated Mechanochemically with Urea: Thermal Behavior and Structural Aspects. J. Colloid Interface Sci. 2009, 338, 474–479. [Google Scholar] [CrossRef]
- Yah, W.O.; Takahara, A.; Lvov, Y.M. Selective Modification of Halloysite Lumen with Octadecylphosphonic Acid: New Inorganic Tubular Micelle. J. Am. Chem. Soc. 2012, 134, 1853–1859. [Google Scholar] [CrossRef]
- Yah, W.O.; Xu, H.; Soejima, H.; Ma, W.; Lvov, Y.; Takahara, A. Biomimetic Dopamine Derivative for Selective Polymer Modification of Halloysite Nanotube Lumen. J. Am. Chem. Soc. 2012, 134, 12134–12137. [Google Scholar] [CrossRef]
- Ahmed, F.R.; Shoaib, M.H.; Azhar, M.; Um, S.H.; Yousuf, R.I.; Hashmi, S.; Dar, A. In-Vitro Assessment of Cytotoxicity of Halloysite Nanotubes against HepG2, HCT116 and Human Peripheral Blood Lymphocytes. Colloids Surf. B Biointerfaces 2015, 135, 50–55. [Google Scholar] [CrossRef]
- Capsoni, D.; Lucini, P.; Conti, D.M.; Bianchi, M.; Maraschi, F.; De Felice, B.; Bruni, G.; Abdolrahimi, M.; Peddis, D.; Parolini, M.; et al. Fe3O4-Halloysite Nanotube Composites as Sustainable Adsorbents: Efficiency in Ofloxacin Removal from Polluted Waters and Ecotoxicity. Nanomaterials 2022, 12, 4330. [Google Scholar] [CrossRef]
- Frishman, W.H. Carvedilol. N. Engl. J. Med. 1998, 339, 1759–1765. [Google Scholar] [CrossRef]
- Packer, M.; Bristow, M.R.; Cohn, J.N.; Colucci, W.S.; Fowler, M.B.; Gilbert, E.M.; Shusterman, N.H. The Effect of Carvedilol on Morbidity and Mortality in Patients with Chronic Heart Failure. U.S. Carvedilol Heart Failure Study Group. N. Engl. J. Med. 1996, 334, 1349–1355. [Google Scholar] [CrossRef]
- Loftsson, T.; Vogensen, S.B.; Desbos, C.; Jansook, P. Carvedilol: Solubilization and Cyclodextrin Complexation: A Technical Note. Aaps Pharmscitech 2008, 9, 425–430. [Google Scholar] [CrossRef]
- Sip, S.; Paczkowska-Walendowska, M.; Rosiak, N.; Miklaszewski, A.; Grabańska-Martyńska, K.; Samarzewska, K.; Cielecka-Piontek, J. Chitosan as Valuable Excipient for Oral and Topical Carvedilol Delivery Systems. Pharmaceuticals 2021, 14, 712. [Google Scholar] [CrossRef]
- Beattie, K.; Phadke, G.; Novakovic, J. Chapter Four—Carvedilol. In Profiles of Drug Substances, Excipients and Related Methodology; Brittain, H.G., Ed.; Profiles of Drug Substances, Excipients, and Related Methodology; Academic Press: Cambridge, MA, USA, 2013; Volume 38, pp. 113–157. [Google Scholar]
- Ha, E.-S.; Kim, J.-S.; Lee, S.-K.; Sim, W.-Y.; Jeong, J.-S.; Kim, M.-S. Equilibrium Solubility and Solute-Solvent Interactions of Carvedilol (Form I) in Twelve Mono Solvents and Its Application for Supercritical Antisolvent Precipitation. J. Mol. Liq. 2019, 294, 111622. [Google Scholar] [CrossRef]
- Shete, A.; Yadav, A.; Muppavarapu, S. Chitosan and Chitosan Chlorhydrate Based Various Approaches for Enhancement of Dissolution Rate of Carvedilol. Daru J. Fac. Pharm. Tehran Univ. Med Sci. 2012, 20, 93. [Google Scholar] [CrossRef] [PubMed] [Green Version]
- Liu, D.; Xu, H.; Tian, B.; Yuan, K.; Pan, H.; Ma, S.; Yang, X.; Pan, W. Fabrication of Carvedilol Nanosuspensions through the Anti-Solvent Precipitation-Ultrasonication Method for the Improvement of Dissolution Rate and Oral Bioavailability. Aaps Pharmscitech 2012, 13, 295–304. [Google Scholar] [CrossRef] [PubMed] [Green Version]
- Lee, J. Adipose Tissue Macrophages in the Development of Obesity-Induced Inflammation, Insulin Resistance and Type 2 Diabetes. Arch. Pharm. Res. 2013, 36, 208–222. [Google Scholar] [CrossRef] [Green Version]
- Eesam, S.; Bhandaru, J.S.; Naliganti, C.; Bobbala, R.K.; Akkinepally, R.R. Solubility Enhancement of Carvedilol Using Drug–Drug Cocrystallization with Hydrochlorothiazide. Future J. Pharm. Sci. 2020, 6, 77. [Google Scholar] [CrossRef]
- Levis, S.R.; Deasy, P.B. Characterisation of Halloysite for Use as a Microtubular Drug Delivery System. Int. J. Pharm. 2002, 243, 125–134. [Google Scholar] [CrossRef]
- Aytekin, M.T.; Hoşgün, H.L. Characterization Studies of Heat-Treated Halloysite Nanotubes. Chem. Pap. 2020, 74, 4547–4557. [Google Scholar] [CrossRef]
- Lvov, Y. Functional Polymer–Clay Nanotube Composites with Sustained Release of Chemical Agents. Prog. Polym. Sci. 2013, 38, 1690–1719. [Google Scholar] [CrossRef]
- Tian, X.; Wang, W.; Tian, N.; Zhou, C.; Yang, C.; Komarneni, S. Cr(VI) Reduction and Immobilization by Novel Carbonaceous Modified Magnetic Fe3O4/Halloysite Nanohybrid. J. Hazard. Mater. 2016, 309, 151–156. [Google Scholar] [CrossRef]
- Xie, Y.; Qian, D.; Wu, D.; Ma, X. Magnetic Halloysite Nanotubes/Iron Oxide Composites for the Adsorption of Dyes. Chem. Eng. J. 2011, 168, 959–963. [Google Scholar] [CrossRef]
- Prado, L.D.; Rocha, H.V.A.; Resende, J.A.L.C.; Ferreira, G.B.; de Figuereido Teixeira, A.M.R. An Insight into Carvedilol Solid Forms: Effect of Supramolecular Interactions on the Dissolution Profiles. CrystEngComm 2014, 16, 3168–3179. [Google Scholar] [CrossRef]
- Zheng, P.; Du, Y.; Chang, P.R.; Ma, X. Amylose–Halloysite–TiO2 Composites: Preparation, Characterization and Photodegradation. Appl. Surf. Sci. 2015, 329, 256–261. [Google Scholar] [CrossRef]
- Amjadi, M.; Samadi, A.; Manzoori, J.L. A Composite Prepared from Halloysite Nanotubes and Magnetite (Fe3O4) as a New Magnetic Sorbent for the Preconcentration of Cadmium(II) Prior to Its Determination by Flame Atomic Absorption Spectrometry. Microchim. Acta 2015, 182, 1627–1633. [Google Scholar] [CrossRef]
- Cheng, H.; Frost, R.L.; Yang, J.; Liu, Q.; He, J. Infrared and Infrared Emission Spectroscopic Study of Typical Chinese Kaolinite and Halloysite. Spectrochim. Acta Part A Mol. Biomol. Spectrosc. 2010, 77, 1014–1020. [Google Scholar] [CrossRef] [PubMed] [Green Version]
- Gadape, H.; Parikh, K. Quantitative Determination and Validation of Carvedilol in Pharmaceuticals Using Quantitative Nuclear Magnetic Resonance Spectroscopy. Anal. Methods 2011, 3, 2341–2347. [Google Scholar] [CrossRef]
- Wen, X.; Tan, F.; Jing, Z.; Liu, Z. Preparation and Study the 1:2 Inclusion Complex of Carvedilol with β-Cyclodextrin. J. Pharm. Biomed. Anal. 2004, 34, 517–523. [Google Scholar] [CrossRef]
- Zielińska-Pisklak, M.A.; Pisklak, D.M.; Wawer, I. 1H and 13C NMR Characteristics of β-Blockers. Magn. Reson. Chem. 2011, 49, 284–290. [Google Scholar] [CrossRef]
- Ravikumar, A.A.; Kulkarni, P.K.; Osmani, R.A.M.; Hani, U.; Ghazwani, M.; Fatease, A.A.; Alamri, A.H.; Gowda, D.V. Carvedilol Precipitation Inhibition by the Incorporation of Polymeric Precipitation Inhibitors Using a Stable Amorphous Solid Dispersion Approach: Formulation, Characterization, and In Vitro In Vivo Evaluation. Polymers 2022, 14, 4977. [Google Scholar] [CrossRef]
- Bruni, G.; Maggi, L.; Mustarelli, P.; Sakaj, M.; Friuli, V.; Ferrara, C.; Berbenni, V.; Girella, A.; Milanese, C.; Marini, A. Enhancing the Pharmaceutical Behavior of Nateglinide by Cocrystallization: Physicochemical Assessment of Cocrystal Formation and Informed Use of Differential Scanning Calorimetry for Its Quantitative Characterization. J. Pharm. Sci. 2019, 108, 1529–1539. [Google Scholar] [CrossRef]
- Bruni, G.; Monteforte, F.; Maggi, L.; Friuli, V.; Ferrara, C.; Mustarelli, P.; Girella, A.; Berbenni, V.; Capsoni, D.; Milanese, C.; et al. Probenecid and Benzamide: Cocrystal Prepared by a Green Method and Its Physico-Chemical and Pharmaceutical Characterization. J. Therm. Anal. Calorim. 2020, 140, 1859–1869. [Google Scholar] [CrossRef]
- Maggi, L.; Bruni, G.; Ferrara, C.; Puscalau, C.; Quinzeni, I.; Friuli, V.; Monteforte, F.; Capsoni, D. Zaltoprofen-Layered Double Hydroxide Hybrids to Enhance Zaltoprofen Solubility and Dissolution Rate. Appl. Clay Sci. 2023, 231, 106723. [Google Scholar] [CrossRef]
- He, H.; Ji, S.; Tao, Q.; Zhu, J.; Chen, T.; Liang, X.; Li, Z.; Dong, H. Transformation of Halloysite and Kaolinite into Beidellite under Hydrothermal Condition. Am. Mineral. 2017, 102, 997–1005. [Google Scholar] [CrossRef]
- Ferrara, C.; Tealdi, C.; Pedone, A.; Menziani, M.C.; Rossini, A.J.; Pintacuda, G.; Mustarelli, P. Local versus Average Structure in LaSrAl3O7: A NMR and DFT Investigation. J. Phys. Chem. C 2013, 117, 23451–23458. [Google Scholar] [CrossRef]
- MacKenzie, K.; Smith, M.E. Multinuclear Solid-State Nuclear Magnetic Resonance of Inorganic Materials, 1st ed.; Elsevier: Amsterdam, The Netherlands, 2012; ISBN 978-0-08-053710-8. [Google Scholar]
- Gao, M.; Lu, L.; Wang, X.; Lin, H.; Zhou, Q. Preparation of a Novel Breviscapine-Loaded Halloysite Nanotubes Complex for Controlled Release of Breviscapine. IOP Conf. Ser. Mater. Sci. Eng. 2017, 265, 012011. [Google Scholar] [CrossRef]
- Carvedilol Tablets/Official Monographs. In The United States Pharmacopoeia (USP40-NF35); United States Pharmacopeial Convention, Inc.: Rockville, MD, USA, 2017; pp. 3226–3228.
- Wang, Q.; Zhang, J.; Zheng, Y.; Wang, A. Adsorption and Release of Ofloxacin from Acid- and Heat-Treated Halloysite. Colloids Surf. B Biointerfaces 2014, 113, 51–58. [Google Scholar] [CrossRef]
- Surya, I.; Waesateh, K.; Masa, A.; Hayeemasae, N. Selectively Etched Halloysite Nanotubes as Performance Booster of Epoxidized Natural Rubber Composites. Polymers 2021, 13, 3536. [Google Scholar] [CrossRef] [PubMed]
- Wang, Q.; Zhang, J.; Wang, A. Alkali Activation of Halloysite for Adsorption and Release of Ofloxacin. Appl. Surf. Sci. 2013, 287, 54–61. [Google Scholar] [CrossRef]
- Li, Y.; Wang, T.; Wang, J.; Jiang, T.; Cheng, G.; Wang, S. Functional and Unmodified MWNTs for Delivery of the Water-Insoluble Drug Carvedilol—A Drug-Loading Mechanism. Appl. Surf. Sci. 2011, 257, 5663–5670. [Google Scholar] [CrossRef]
- Reagents: Solutions/Buffer Solutions 2017. In The United States Pharmacopeia (USP40-NF35); United States Pharmacopeial Convention, Inc.: Rockville, MD, USA, 2017; pp. 2409–2411.


| ALPHANUMERIC CODE | API | HNT |
|---|---|---|
| H | - | Commercial |
| H_HCl_2M | - | Etching with HCl 2M |
| H_HCl_4M | - | Etching with HCl 4M |
| H_HCl_6M | - | Etching with HCl 6M |
| H_HCl_8M | - | Etching with HCl 8M |
| H_HCl_12M | - | Etching with HCl 12M |
| H_H2SO4_0.5M | - | Etching with H2SO4 0.5M |
| H_H2SO4_1M | - | Etching with H2SO4 1M |
| H_NaOH_0.5M | - | Etching with NaOH 0.5M |
| C | Carvedilol | - |
| CH | Carvedilol | Commercial |
| CH_HCl_2M | Carvedilol | Etching with HCl 2M |
| CH_HCl_4M | Carvedilol | Etching with HCl 4M |
| CH_HCl_6M | Carvedilol | Etching with HCl 6M |
| CH_HCl_8M | Carvedilol | Etching with HCl 8M |
| CH_HCl_12M | Carvedilol | Etching with HCl 12M |
| CH_H2SO4_0.5M | Carvedilol | Etching with H2SO4 0.5M |
| CH_H2SO4_1M | Carvedilol | Etching with H2SO4 1M |
| CH_NaOH_0.5M | Carvedilol | Etching with NaOH 0.5M |
| CARVEDILOL–HNT PHYSICAL MIXTURES | ||
| CH_PM | Carvedilol | Commercial |
| CH_HCl_8M_PM | Carvedilol | Etching with HCl 8M |
| CH_H2SO4_0.5M_PM | Carvedilol | Etching with H2SO4 0.5M |
| Carbon | Bond | Carvedilol | CH_HCl_8M_PM (a) | CH_HCl_8M (b) |
|---|---|---|---|---|
| C1, C11 | C-O | 1097 cm−1 | 1097 cm−1 | 1087 cm−1 |
| C2, C7, C13 | Aromatic ring | 1444 cm−1 1499 cm−1 1606 cm−1 1630 cm−1 | 1444 cm−1 1499 cm−1 1606 cm−1 1630 cm−1 | 1443 cm−1 1501 cm−1 1608 cm−1 very weak |
| C9, C10 | Stretching C-N | 1211 cm−1 1250 cm−1 | 1211 cm−1 1250 cm−1 | 1214 cm−1 1256 cm−1 |
| Sample | Specific Surface Area (m2 g−1) |
|---|---|
| H | 58.20 |
| H_HCl_8M | 97.92 |
| H_H2SO4_0.5M | 79.68 |
| H_NaOH_0.5M | 71.87 |
| Sample | Tonset (°C) | ΔHfus (J g−1) | Carvedilol Content (wt%) |
|---|---|---|---|
| C | 115 | 117.60 | 100 |
| CH | 113 | 33.29 | 28.3 |
| CH_HCl_8M | 112 | 26.99 | 23.0 |
| CH_H2SO4_0.5M | 113 | 29.19 | 24.8 |
| CH_NaOH_0.5M | 113 | 22.10 | 18.8 |
| Sample | Carvedilol Content (wt%) |
|---|---|
| CH | 37.6 |
| CH_HCl_8M | 30.2 |
| CH_H2SO4_0.5M | 35.3 |
| CH_NaOH_0.5M | 30.6 |
| Equilibrium Solubility at 21 °C (mg/L) | ||||
|---|---|---|---|---|
| Fluids | C | CH | CH_HCl_8M | CH_H2SO4_0.5M |
| Deionized water | 5.4 ± 0.1 | 14.2 ± 1.2 | 29.6 ± 1.6 | 260.5 ± 4.2 |
| pH 6.8 buffer | 17.7 ± 0.6 | 31.2 ± 2.8 | 42.4 ± 2.3 | 32.1 ± 0.9 |
Disclaimer/Publisher’s Note: The statements, opinions and data contained in all publications are solely those of the individual author(s) and contributor(s) and not of MDPI and/or the editor(s). MDPI and/or the editor(s) disclaim responsibility for any injury to people or property resulting from any ideas, methods, instructions or products referred to in the content. |
© 2023 by the authors. Licensee MDPI, Basel, Switzerland. This article is an open access article distributed under the terms and conditions of the Creative Commons Attribution (CC BY) license (https://creativecommons.org/licenses/by/4.0/).
Share and Cite
Maggi, L.; Urru, C.; Friuli, V.; Ferrara, C.; Conti, D.M.; Bruni, G.; Capsoni, D. Synthesis and Characterization of Carvedilol-Etched Halloysite Nanotubes Composites with Enhanced Drug Solubility and Dissolution Rate. Molecules 2023, 28, 3405. https://doi.org/10.3390/molecules28083405
Maggi L, Urru C, Friuli V, Ferrara C, Conti DM, Bruni G, Capsoni D. Synthesis and Characterization of Carvedilol-Etched Halloysite Nanotubes Composites with Enhanced Drug Solubility and Dissolution Rate. Molecules. 2023; 28(8):3405. https://doi.org/10.3390/molecules28083405
Chicago/Turabian StyleMaggi, Lauretta, Claudia Urru, Valeria Friuli, Chiara Ferrara, Debora Maria Conti, Giovanna Bruni, and Doretta Capsoni. 2023. "Synthesis and Characterization of Carvedilol-Etched Halloysite Nanotubes Composites with Enhanced Drug Solubility and Dissolution Rate" Molecules 28, no. 8: 3405. https://doi.org/10.3390/molecules28083405