

Quantitative Detection of Natural Rubber Content in Eucommia ulmoides by Portable Pyrolysis-Membrane Inlet Mass Spectrometry
 and
and 
Abstract
:1. Introduction
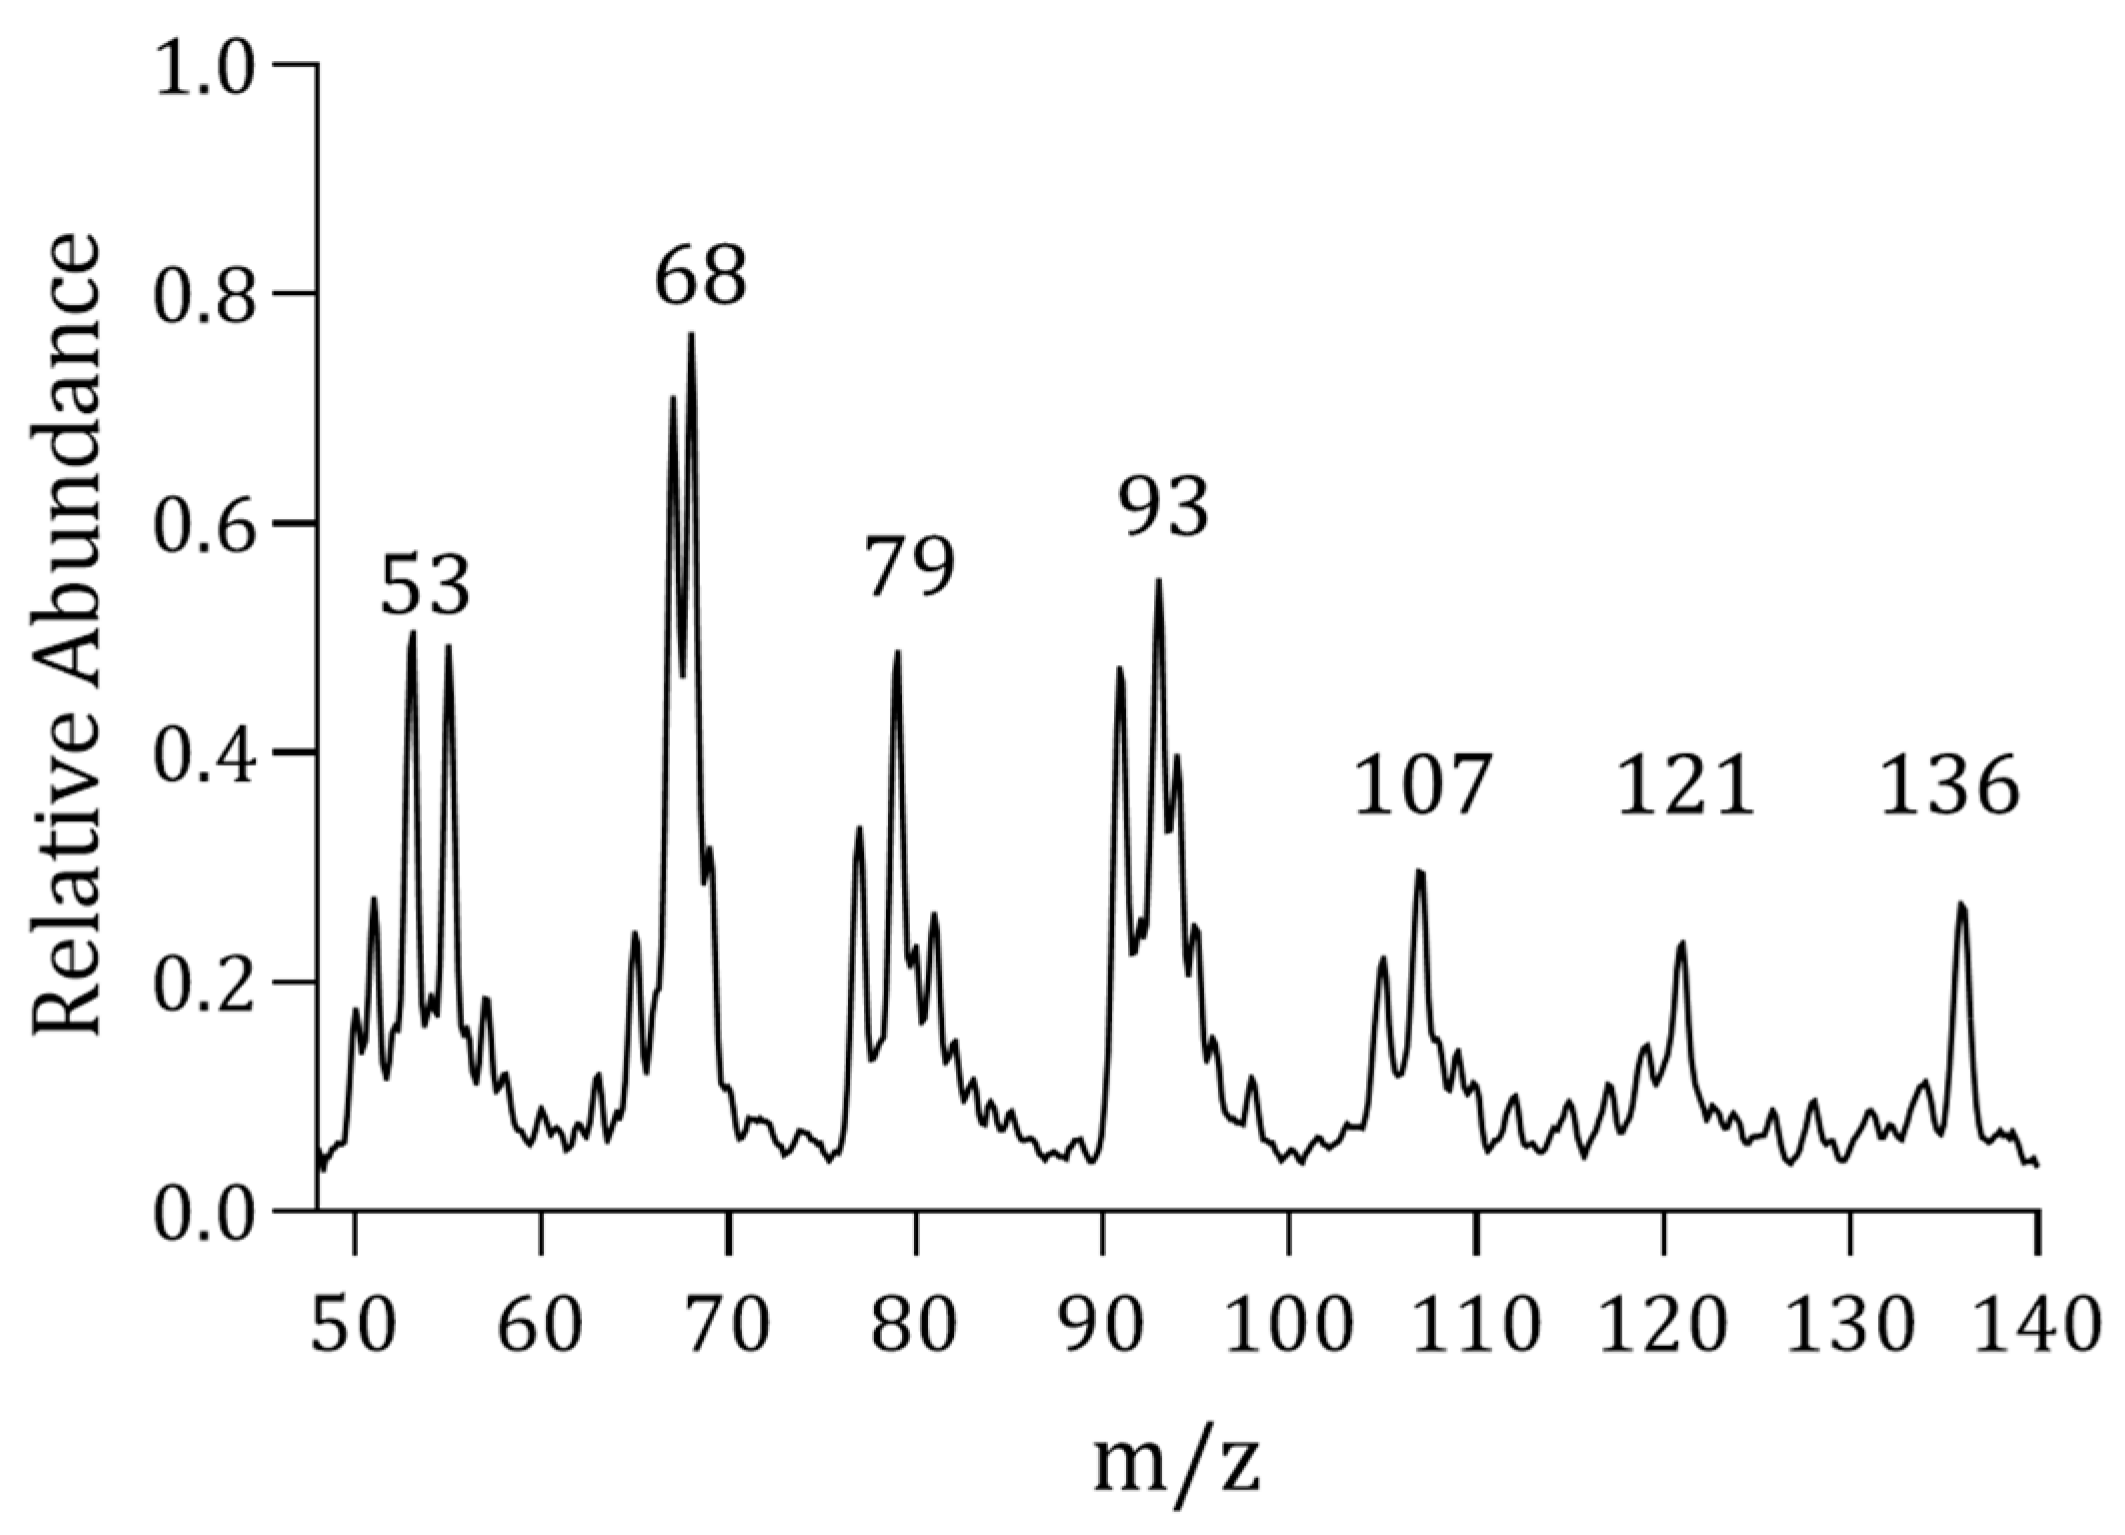
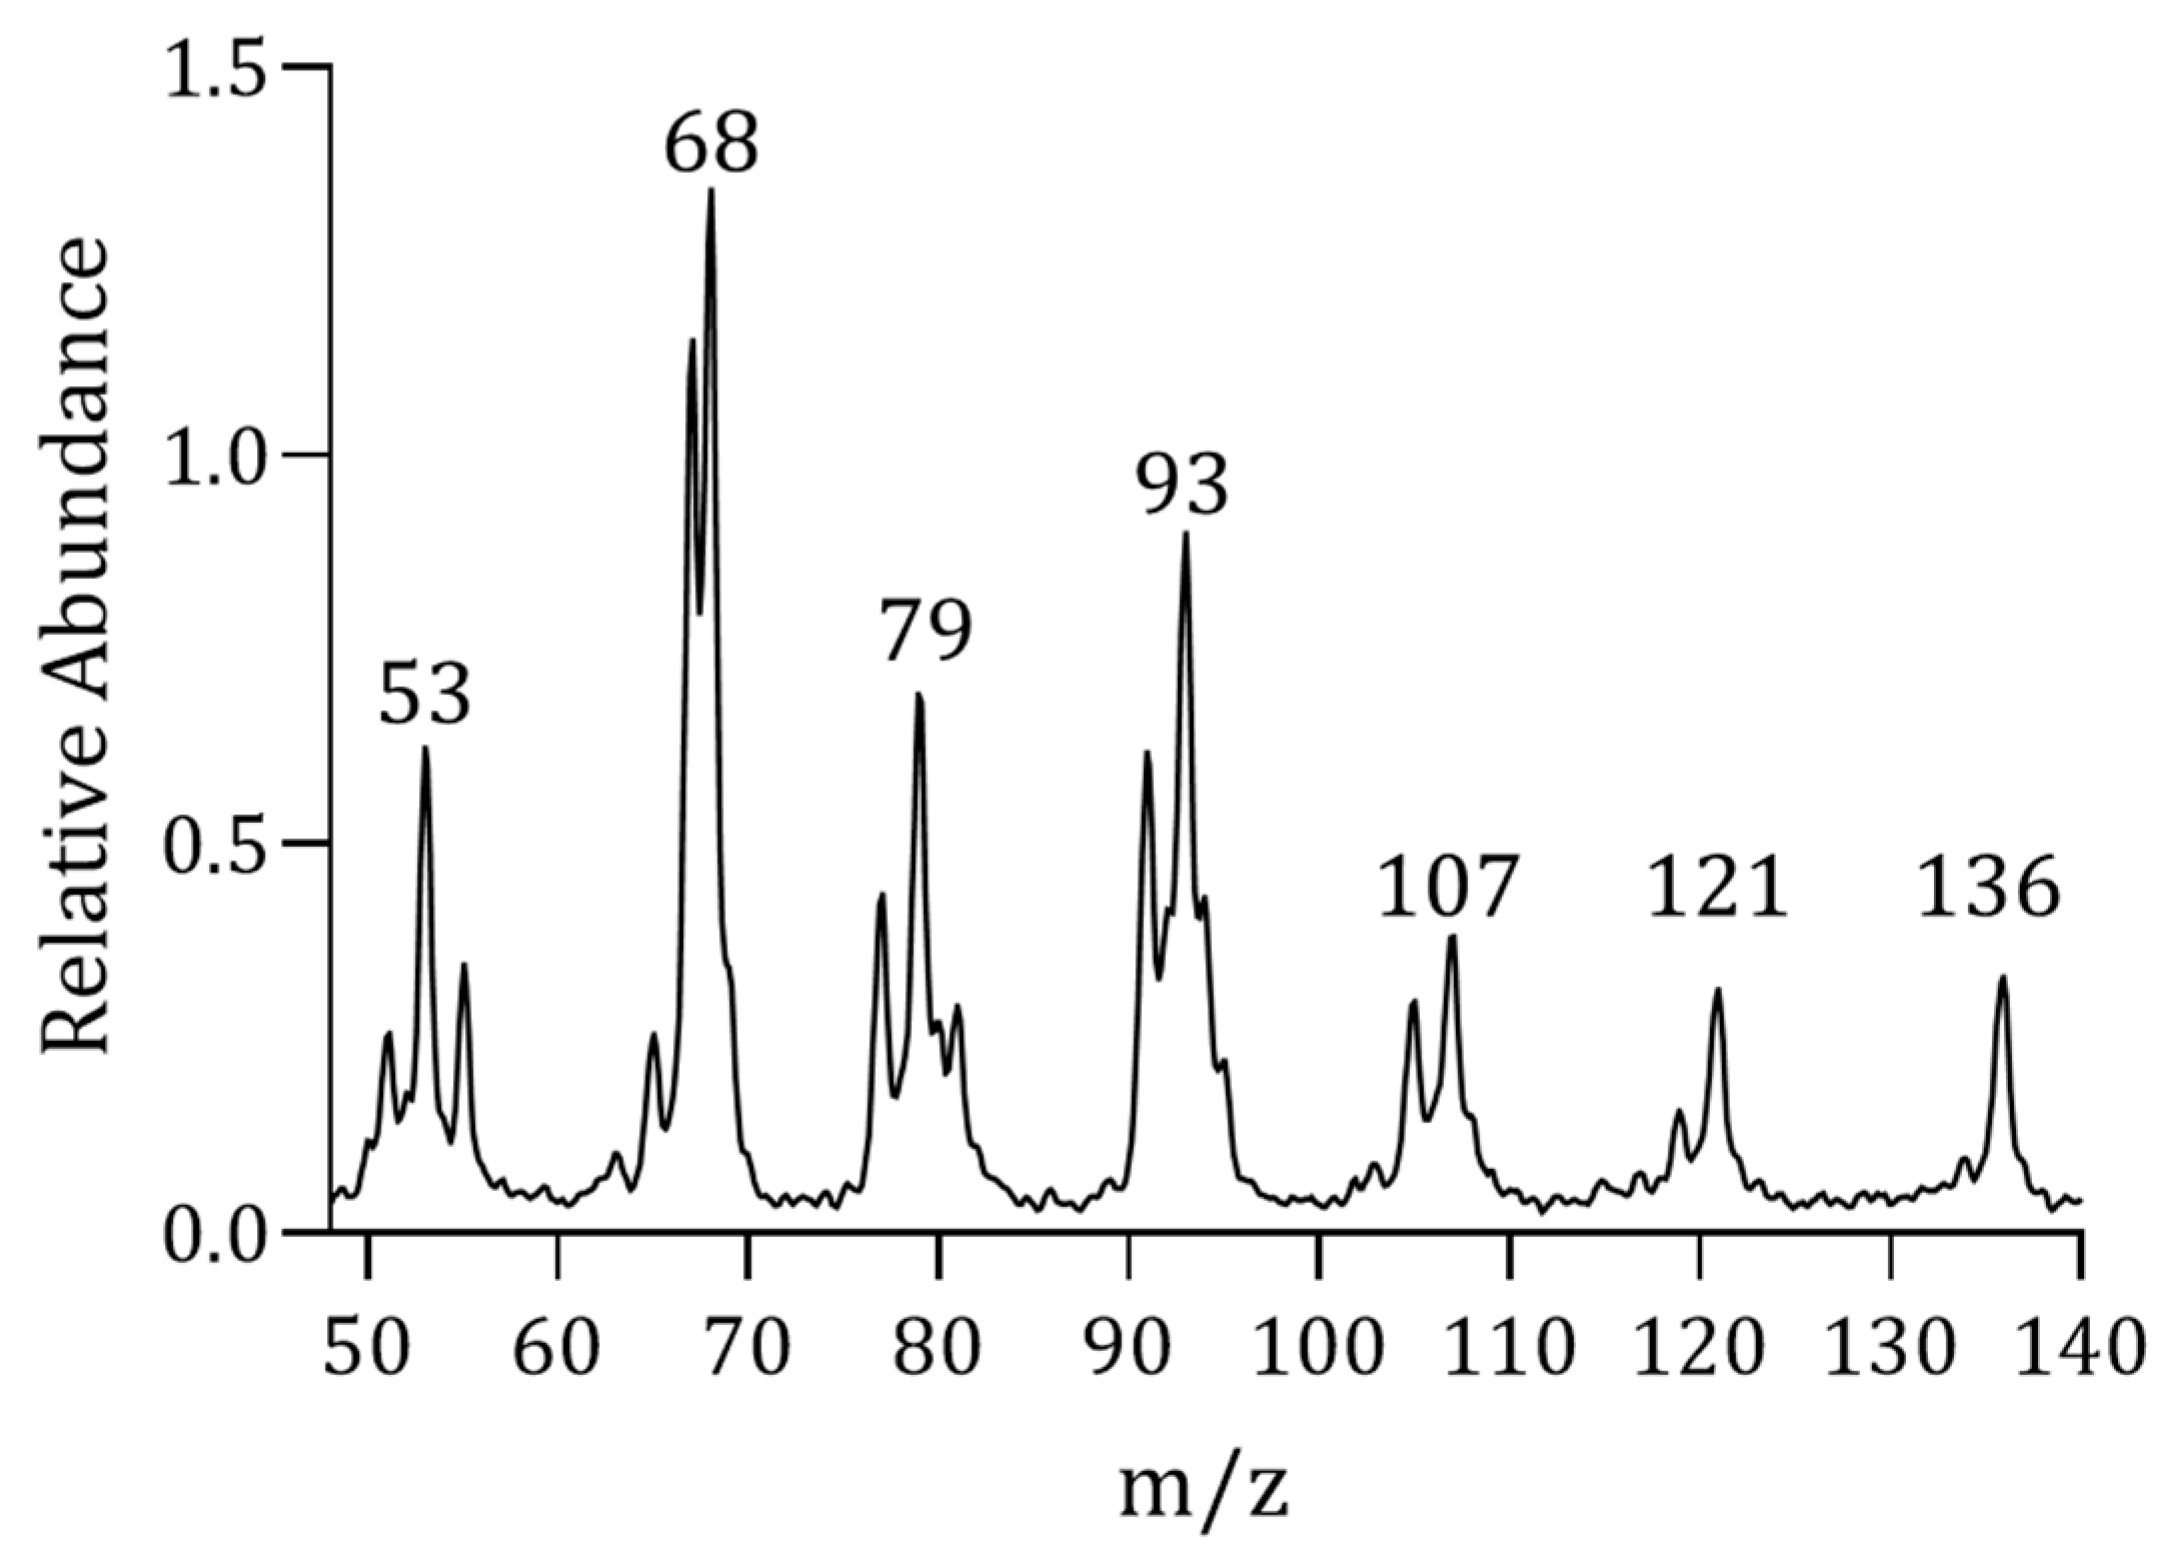
2. Results
2.1. Selection of PY-MIMS Calibration Curve Type
2.2. PY-GC Calibration Curve Establishment
2.3. Determination of Rubber Content in EU Samples
2.4. Determination of Limit of Detection and Recovery Rate
3. Materials and Methods
3.1. Experimental Reagents and Plant Materials
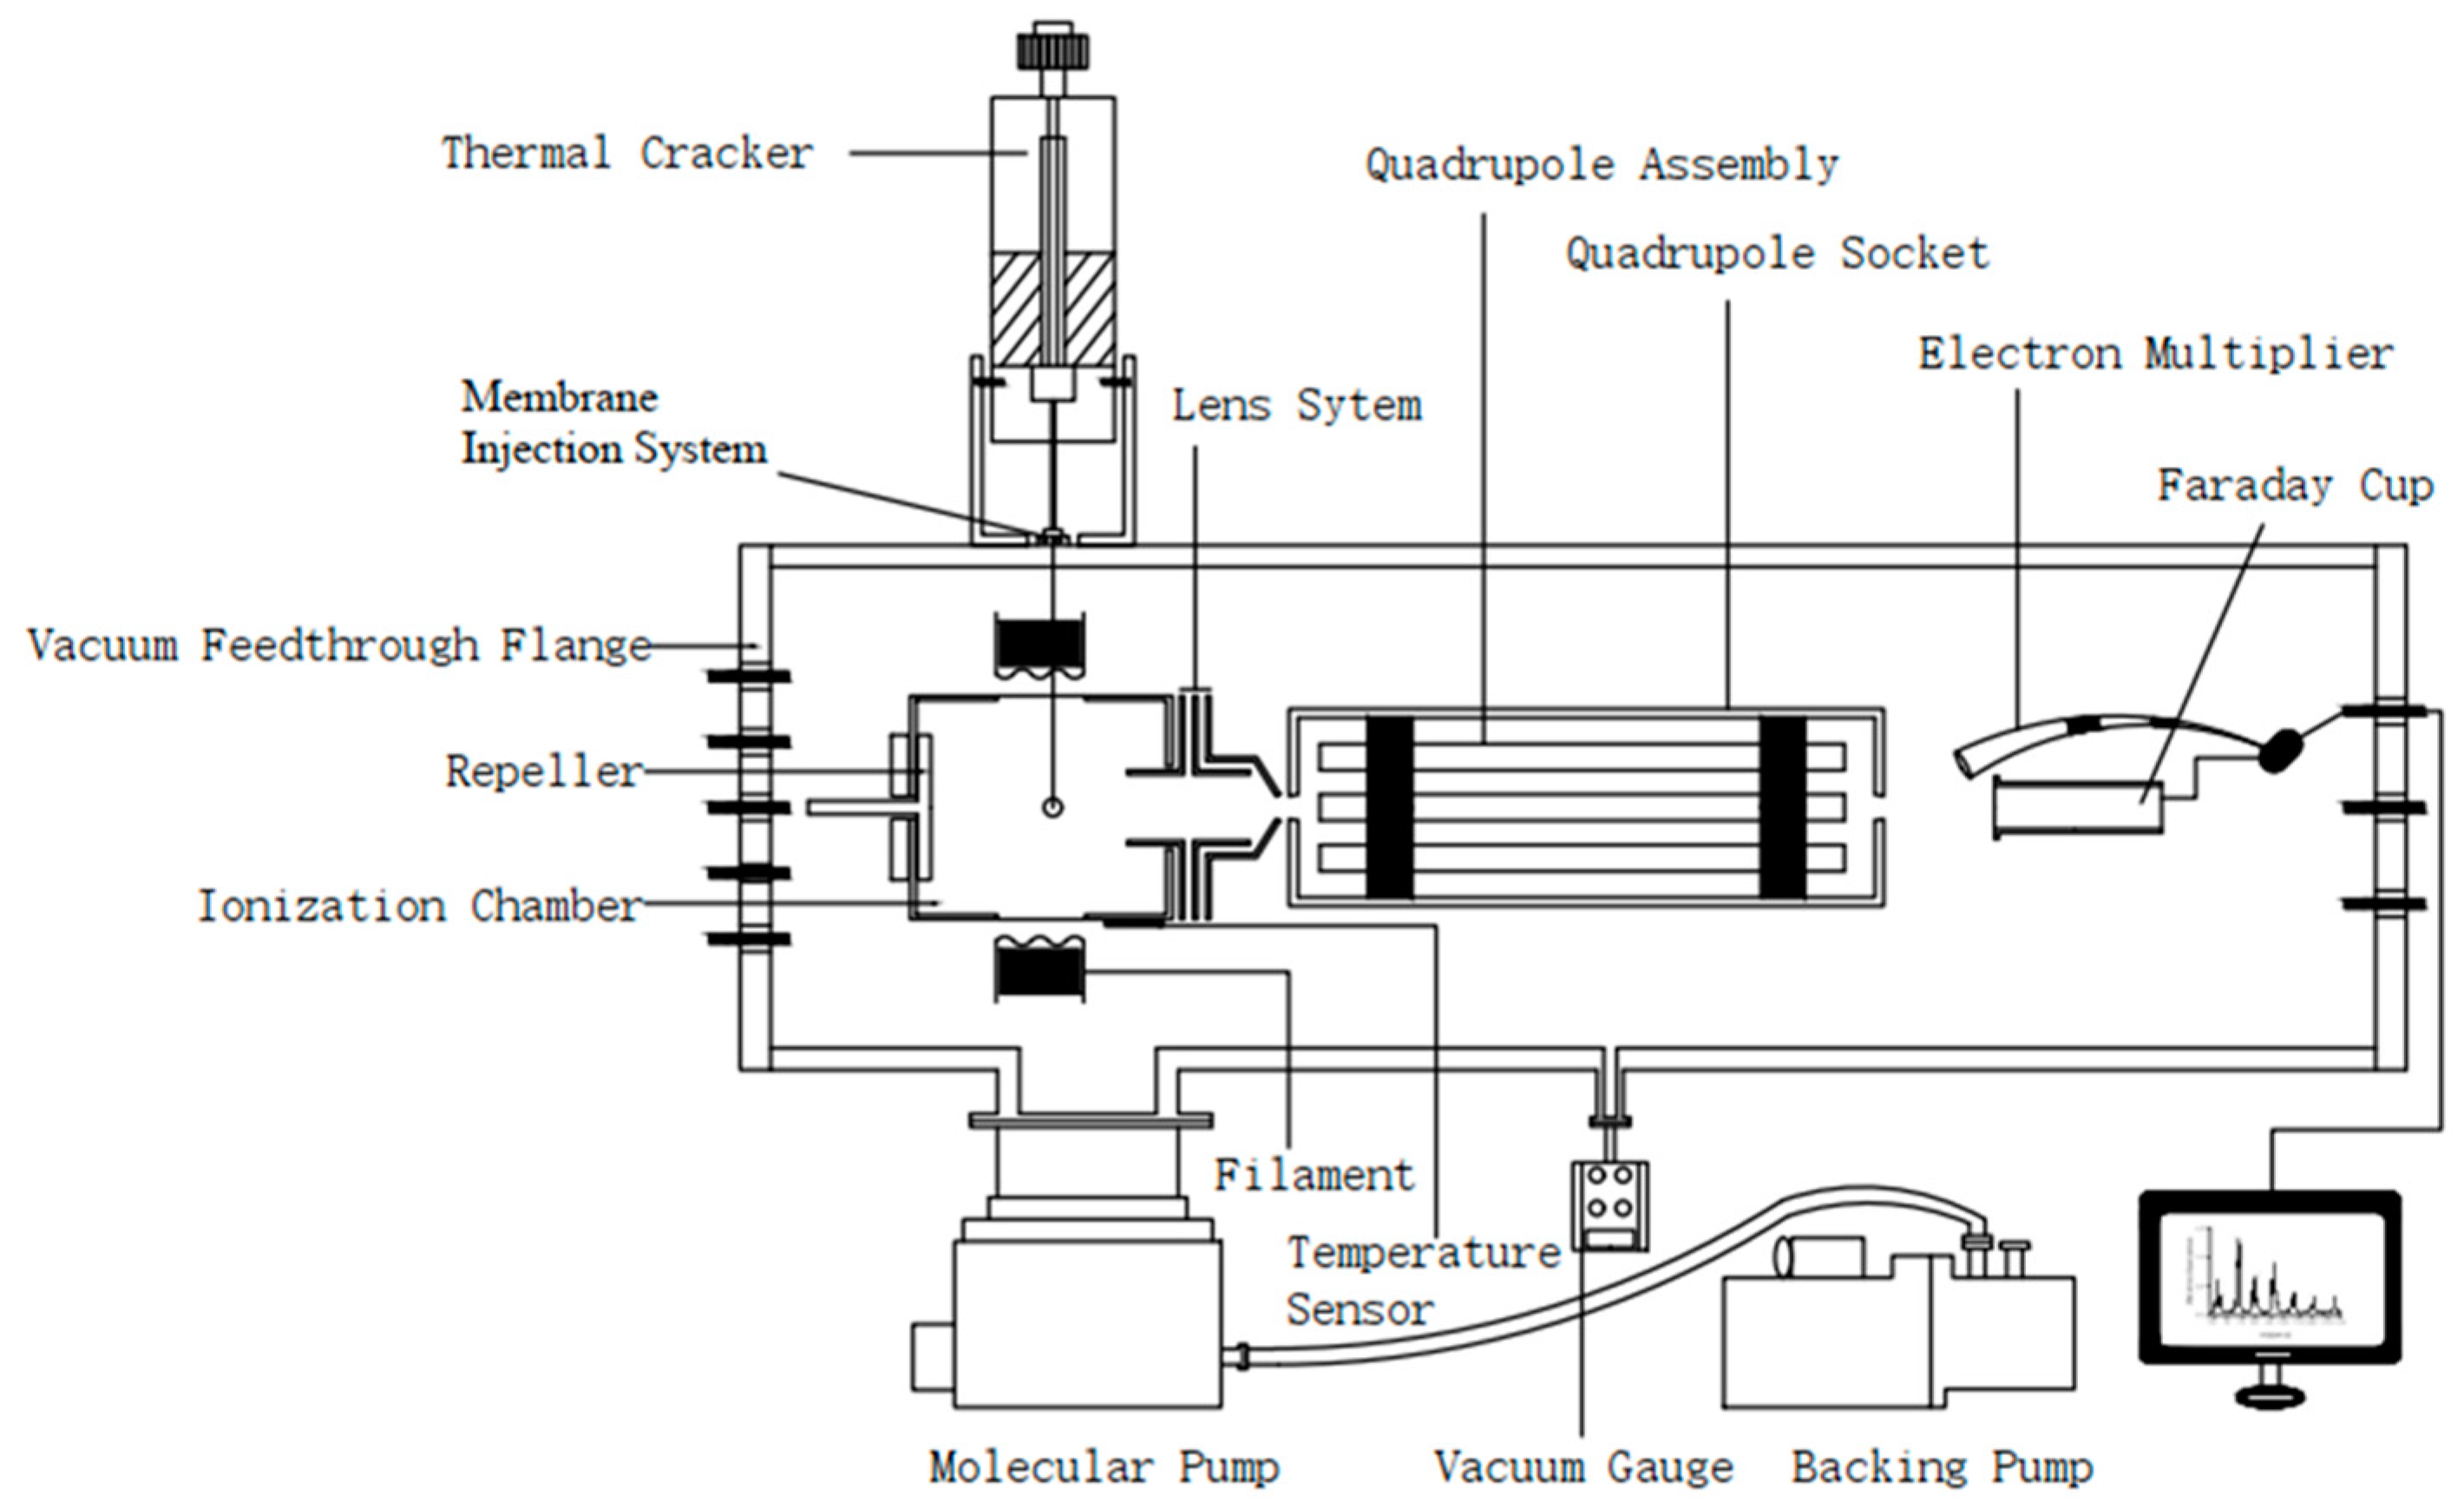
3.2. Experimental Equipment and Conditions
3.3. PY-MIMS Detection Principle
3.4. PY-MIMS Detection Steps
3.4.1. Preparation of EUG Reference Material by Soxhlet Extraction
3.4.2. Plotting the PY-MIMS Calibration Curve
3.5. PY-GC Detection
4. Conclusions
Supplementary Materials
Author Contributions
Funding
Institutional Review Board Statement
Informed Consent Statement
Data Availability Statement
Acknowledgments
Conflicts of Interest
Sample Availability
References
- Cornish, K. Similarities and differences in rubber biochemistry among plant species. Phytochemistry. 2001, 57, 1123–1134. [Google Scholar] [CrossRef] [PubMed]
- Yamashita, S.; Takahashi, S. Molecular mechanisms of natural rubber biosynthesis. Annu. Rev. Biochem. 2020, 89, 821–851. [Google Scholar] [CrossRef] [PubMed]
- Cherian, S.; Ryu, S.B.; Cornish, K. Natural rubber biosynthesis in plants, the rubber transferase complex, and metabolic engineering progress and prospects. Plant Biotechnol. J. 2019, 17, 2041–2061. [Google Scholar] [CrossRef] [PubMed] [Green Version]
- Wei, X.; Peng, P.; Peng, F.; Dong, J. Natural polymer Eucommia ulmoides rubber: A novel material. J. Agric. Food Chem. 2021, 69, 3797–3821. [Google Scholar] [CrossRef]
- Cirad-Persyst-Upr, B.-F. Development of Innovative Alternative Crops for the Production of Natural Rubber. Book of Abstracts, 7th ed.; CIRAD: Paris, France, 2019. [Google Scholar]
- Palu, S.; Tardan, E.; Pioch, D.; Brancheriau, L.; Boutahar, N.; Dorget, M. Development of Guayule (Parthenium argentatum A. Gray) in the South of France after the EU-PEARLS Project; AAIC: Amsterdam, The Netherlands, 2019. [Google Scholar]
- Munt, O.; Arias, M.; Hernandez, M.; Ritter, E.; Gronover, C.S.; Prüfer, D. Fertilizer and planting strategies to increase biomass and improve root morphology in the natural rubber producer Taraxacum brevicorniculatum. Ind. Crops Prod. 2012, 36, 289–293. [Google Scholar] [CrossRef]
- Li, Y.; Wei, H.; Yang, J.; Du, K.; Li, J.; Zhang, Y.; Qiu, T.; Liu, Z.; Ren, Y.; Song, L. High-quality de novo assembly of the Eucommia ulmoides haploid genome provides new insights into evolution and rubber biosynthesis. Hortic. Res. 2020, 7, 183. [Google Scholar] [CrossRef]
- Zhu, M.-Q.; Sun, R.-C. Eucommia ulmoides Oliver: A potential feedstock for bioactive products. J. Agric. Food Chem. 2018, 66, 5433–5438. [Google Scholar] [CrossRef]
- Wu, D.; Yu, D.; Zhang, Y.; Dong, J.; Li, D.; Wang, D. Metabolite Profiles, Bioactivity, and HPLC Fingerprint of Different Varieties of Eucommia ulmoides Oliv.: Towards the Utilization of Medicinal and Commercial Chinese Endemic Tree. Molecules 2018, 23, 1898. [Google Scholar] [CrossRef] [Green Version]
- Gong, M.; Su, C.; Fan, M.; Wang, P.; Cui, B.; Guo, Z.; Liang, S.; Yang, L.; Liu, X.; Dai, L.; et al. Mechanism by which Eucommia ulmoides leaves Regulate Nonalcoholic fatty liver disease based on system pharmacology. J. Ethnopharmacol. 2022, 282, 114603. [Google Scholar] [CrossRef]
- Xing, Y.-F.; He, D.; Wang, Y.; Zeng, W.; Zhang, C.; Lu, Y.; Su, N.; Kong, Y.-H.; Xing, X.-H. Chemical constituents, biological functions and pharmacological effects for comprehensive utilization of Eucommia ulmoides Oliver. Food Sci. Hum. Wellness 2019, 8, 177–188. [Google Scholar] [CrossRef]
- Li, D.; Yang, C.; Huang, Y.; Li, L.; Han, W.; Kang, H.; Yang, F.; Fang, Q. Novel Green resource material: Eucommia Ulmoides Gum. Resour. Chem. Mater. 2022, 1, 114–128. [Google Scholar] [CrossRef]
- Yan, R. Prospects and research progress on Eucommia ulmoides gum. Prog. Chem. 1995, 7, 65. [Google Scholar]
- Meeks, J.; Crook, R.; Pardo, C., Jr.; Clark, F. Determing Rubber Hydrocarbon in Rubber-Bearing Plants. Anal. Chem. 1953, 25, 1535–1538. [Google Scholar] [CrossRef]
- Gowans, W.J.; Clark, F.E. Determination of Rubber Hydrocarbon by Modified Bromination Method. Anal. Chem. 1952, 24, 529–533. [Google Scholar] [CrossRef]
- Nurthen, E.J.; McCleary, B.V.; Milthorpe, P.L.; Whitworth, J.W. Modified soxhlet procedure for the quantification of resin and rubber content of guayule. Anal. Chem. 1986, 58, 448–453. [Google Scholar] [CrossRef]
- Salvucci, M.E.; Coffelt, T.A.; Cornish, K. Improved methods for extraction and quantification of resin and rubber from guayule. Ind. Crops Prod. 2009, 30, 9–16. [Google Scholar] [CrossRef]
- Fanning, R.; Bekkedahl, N. Quantitative determination of natural rubber hydrocarbon by refractive index measurements. Anal. Chem. 1951, 23, 1653–1656. [Google Scholar] [CrossRef]
- Takeno, S.; Bamba, T.; Nakazawa, Y.; Fukusaki, E.; Okazawa, A.; Kobayashi, A. Quantification of trans-1, 4-polyisoprene in Eucommia ulmoides by fourier transform infrared spectroscopy and pyrolysis-gas chromatography/mass spectrometry. J. Biosci. Bioeng. 2008, 105, 355–359. [Google Scholar] [CrossRef]
- Liu, G.; Zhang, X.; Zhang, T.; Zhang, J.; Zhang, P.; Wang, W. Determination of the content of Eucommia ulmoides gum by variable temperature Fourier Transform Infrared Spectrum. Polym. Test. 2017, 63, 582–586. [Google Scholar] [CrossRef]
- Takeno, S.; Bamba, T.; Nakazawa, Y.; Fukusaki, E.; Okazawa, A.; Kobayashi, A. A high-throughput and solvent-free method for measurement of natural polyisoprene content in leaves by Fourier transform near infrared spectroscopy. J. Biosci. Bioeng. 2008, 106, 537–540. [Google Scholar] [CrossRef]
- Suchat, S.; Pioch, D.; Palu, S.; Tardan, E.; Van Loo, E.N.; Davrieux, F. Fast determination of the resin and rubber content in Parthenium argentatum biomass using near infrared spectroscopy. Ind. Crops Prod. 2013, 45, 44–51. [Google Scholar] [CrossRef]
- Chen, Y.; Gao, S.-K.; Dong, Y.-Y.; Ma, X.; Li, J.-R.; Guo, M.-M.; Zhang, J.-C. Fast Determination of the Rubber Content in Taraxacum kok-saghyz Fresh Biomass Using Portable Near-Infrared Spectroscopy and Pyrolysis–Gas Chromatography. J. Anal. Test. 2022, 1–8. [Google Scholar] [CrossRef]
- Guo, T.; Liu, Y.; Wei, Y.; Ma, X.; Fan, Q.; Ni, J.; Yin, Z.; Liu, J.; Wang, S.; Dong, Y. Simultaneous qualitation and quantitation of natural trans-1, 4-polyisoprene from Eucommia ulmoides Oliver by gel permeation chromatography (GPC). J. Chromatogr. B 2015, 1004, 17–22. [Google Scholar] [CrossRef]
- Hayman, E.; Yokoyama, H.; Bai, K. Stimulation of plant growth and gutta content in Eucommia ulmoides Oliv. by 2-diethylaminoethyl-3, 4-dichlorophenylether [DCPTA]. Plant Growth Regul. 1994, 14, 79–82. [Google Scholar] [CrossRef]
- Takeno, S.; Bamba, T.; Nakazawa, Y.; Fukusaki, E.; Okazawa, A.; Kobayashi, A. High-throughput and highly sensitive analysis method for polyisoprene in plants by pyrolysis-gas chromatography/mass spectrometry. Biosci. Biotechnol. Biochem. 2010, 74, 13–17. [Google Scholar] [CrossRef] [Green Version]
- Lu, W.; Qing, Z.; Qiang, M.; Yi-Yang, D. Determination of natural rubber content in Taraxacum kok-saghyzby pyrolysis gas chromatography-mass spectrometry. China Pet. Process. Petrochem. Technol. 2020, 22, 43. [Google Scholar]
- Hoch, G.; Kok, B. A mass spectrometer inlet system for sampling gases dissolved in liquid phases. Arch. Biochem. Biophys. 1963, 101, 160–170. [Google Scholar] [CrossRef] [PubMed]
- Ketola, R.A.; Lauritsen, F.R. Membrane Inlet Mass Spectrometry (MIMS) in Historical Perspective. In The Encyclopedia of Mass Spectrometry; Elsevier: Amsterdam, The Netherlands, 2016; pp. 143–148. [Google Scholar]
- Hu, W.; Lauritsen, F.R.; Allard, S. Identification and quantification of chloramines, bromamines and bromochloramine by Membrane Introduction Mass Spectrometry (MIMS). Sci. Total Environ. 2021, 751, 142303. [Google Scholar] [CrossRef]
- Eschenbach, W.; Lewicka-Szczebak, D.; Stange, C.F.; Dyckmans, J.; Well, R. Measuring 15N abundance and concentration of aqueous nitrate, nitrite, and ammonium by membrane inlet quadrupole mass spectrometry. Anal. Chem. 2017, 89, 6076–6081. [Google Scholar] [CrossRef]
- Burlacot, A.; Richaud, P.; Gosset, A.; Li-Beisson, Y.; Peltier, G. Algal photosynthesis converts nitric oxide into nitrous oxide. Proc. Natl. Acad. Sci. USA 2020, 117, 2704–2709. [Google Scholar] [CrossRef] [Green Version]
- Vreeken, R.; Houriet, R. Membrane interface for the direct coupling of pyrolysis and mass spectrometry. Anal. Chim. Acta 1995, 313, 237–241. [Google Scholar] [CrossRef]
- Hendricker, A.D.; Basile, F.; Voorhees, K.J. A study of protein oxidative products using a pyrolysis-membrane inlet quadrupole ion trap mass spectrometer with air as the buffer gas. J. Anal. Appl. Pyrolysis 1998, 46, 65–82. [Google Scholar] [CrossRef]
- Zhang, X.; Zhang, H.; Yu, K.; Li, N.; Liu, Y.; Liu, X.; Zhang, H.; Yang, B.; Wu, W.; Gao, J.; et al. Rapid Monitoring Approach for Microplastics Using Portable Pyrolysis-Mass Spectrometry. Anal. Chem. 2020, 92, 4656–4662. [Google Scholar] [CrossRef] [PubMed]
- Miller, J.V.; Maskrey, J.R.; Chan, K.; Unice, K.M. Pyrolysis-Gas Chromatography-Mass Spectrometry (Py-GC-MS) Quantification of Tire and Road Wear Particles (TRWP) in Environmental Matrices: Assessing the Importance of Microstructure in Instrument Calibration Protocols. Anal. Lett. 2021, 55, 1004–1016. [Google Scholar] [CrossRef]
- Sabatini, F.; Corsi, I.; Ceccarini, A.; Brillanti, M.; Colombini, M.P.; Bonaduce, I. Pyrolysis gas chromatography mass spectrometry: A promising tool for disclosing metal-free tanning agents used in leather industry. J. Anal. Appl. Pyrolysis 2023, 169, 105803. [Google Scholar] [CrossRef]
- Li, Q.; Lai, Y.; Li, P.; Liu, X.; Yao, Z.; Liu, J.; Yu, S. Evaluating the Occurrence of Polystyrene Nanoparticles in Environmental Waters by Agglomeration with Alkylated Ferroferric Oxide Followed by Micropore Membrane Filtration Collection and Py-GC/MS Analysis. Environ. Sci. Technol. 2022, 56, 8255–8265. [Google Scholar] [CrossRef]
- Zhang, X.; Shi, K.; Liu, Y.; Chen, Y.; Yu, K.; Wang, Y.; Zhang, H.; Jiang, J. Rapid and efficient method for assessing nanoplastics by an electromagnetic heating pyrolysis mass spectrometry. J. Hazard. Mater. 2021, 419, 126506. [Google Scholar] [CrossRef]


| EU Variety | PY-GC Determined Rubber Content Mass Fraction ± SD, % | Confidence Interval, 95% | PY-MIMS Determined Rubber Content Mass Fraction ± SD, % | Confidence Interval, 95% | Relative Error *, % |
|---|---|---|---|---|---|
| YA | 1.510 ± 0.080 | 1.510 ± 0.198 | 1.462 ± 0.152 | 1.462 ± 0.464 | −3.178 |
| EA | 2.560 ± 0.116 | 2.560 ± 0.289 | 2.425 ± 0.201 | 2.425 ± 0.611 | −5.308 |
| HA | 2.089 ± 0.118 | 2.089 ± 0.293 | 2.121 ± 0.109 | 2.121 ± 0.333 | 1.526 |
| SA | 2.867 ± 0.387 | 2.867 ± 0.961 | 2.915 ± 0.141 | 2.915 ± 0.430 | 1.660 |
| WA | 2.613 ± 0.160 | 2.613 ± 0.398 | 2.755 ± 0.277 | 2.755 ± 0.844 | 5.416 |
| YB | 6.603 ± 0.564 | 6.603 ± 1.401 | 6.358 ± 0.283 | 6.358 ± 0.861 | −3.714 |
| EB | 8.230 ± 0.209 | 8.230 ± 0.519 | 8.021 ± 0.392 | 8.021 ± 1.193 | −2.533 |
| HB | 4.905 ± 0.292 | 4.905 ± 0.725 | 5.016 ± 0.285 | 5.016 ± 0.867 | 2.262 |
| SB | 4.679 ± 0.265 | 4.679 ± 0.657 | 4.508 ± 0.227 | 4.508 ± 0.692 | −3.659 |
| WB | 4.752 ± 0.206 | 4.752 ± 0.512 | 4.561 ± 0.250 | 4.561 ± 0.761 | −4.001 |
| EUG Spiked Amount, mg | Quantity Recovered, mg | Confidence Interval, 95% | Recovery, % | RSD, % |
|---|---|---|---|---|
| 0.05 | 0.049 ± 0.005 | 0.049 ± 0.007 | 97.84 | 9.84 |
| 0.15 | 0.157 ± 0.005 | 0.157 ± 0.007 | 104.93 | 3.33 |
| 0.25 | 0.238 ± 0.011 | 0.238 ± 0.016 | 95.04 | 4.72 |
Disclaimer/Publisher’s Note: The statements, opinions and data contained in all publications are solely those of the individual author(s) and contributor(s) and not of MDPI and/or the editor(s). MDPI and/or the editor(s) disclaim responsibility for any injury to people or property resulting from any ideas, methods, instructions or products referred to in the content. |
© 2023 by the authors. Licensee MDPI, Basel, Switzerland. This article is an open access article distributed under the terms and conditions of the Creative Commons Attribution (CC BY) license (https://creativecommons.org/licenses/by/4.0/).
Share and Cite
Guo, M.; Zhang, M.; Gao, S.; Wang, L.; Zhang, J.; Huang, Z.; Dong, Y. Quantitative Detection of Natural Rubber Content in Eucommia ulmoides by Portable Pyrolysis-Membrane Inlet Mass Spectrometry. Molecules 2023, 28, 3330. https://doi.org/10.3390/molecules28083330
Guo M, Zhang M, Gao S, Wang L, Zhang J, Huang Z, Dong Y. Quantitative Detection of Natural Rubber Content in Eucommia ulmoides by Portable Pyrolysis-Membrane Inlet Mass Spectrometry. Molecules. 2023; 28(8):3330. https://doi.org/10.3390/molecules28083330
Chicago/Turabian StyleGuo, Minmin, Mingjian Zhang, Shunkai Gao, Lu Wang, Jichuan Zhang, Zejian Huang, and Yiyang Dong. 2023. "Quantitative Detection of Natural Rubber Content in Eucommia ulmoides by Portable Pyrolysis-Membrane Inlet Mass Spectrometry" Molecules 28, no. 8: 3330. https://doi.org/10.3390/molecules28083330