
The Use of Infrared Spectroscopy for the Quantification of Bioactive Compounds in Food: A Review


Abstract
:1. Introduction
1.1. Infrared Spectroscopy
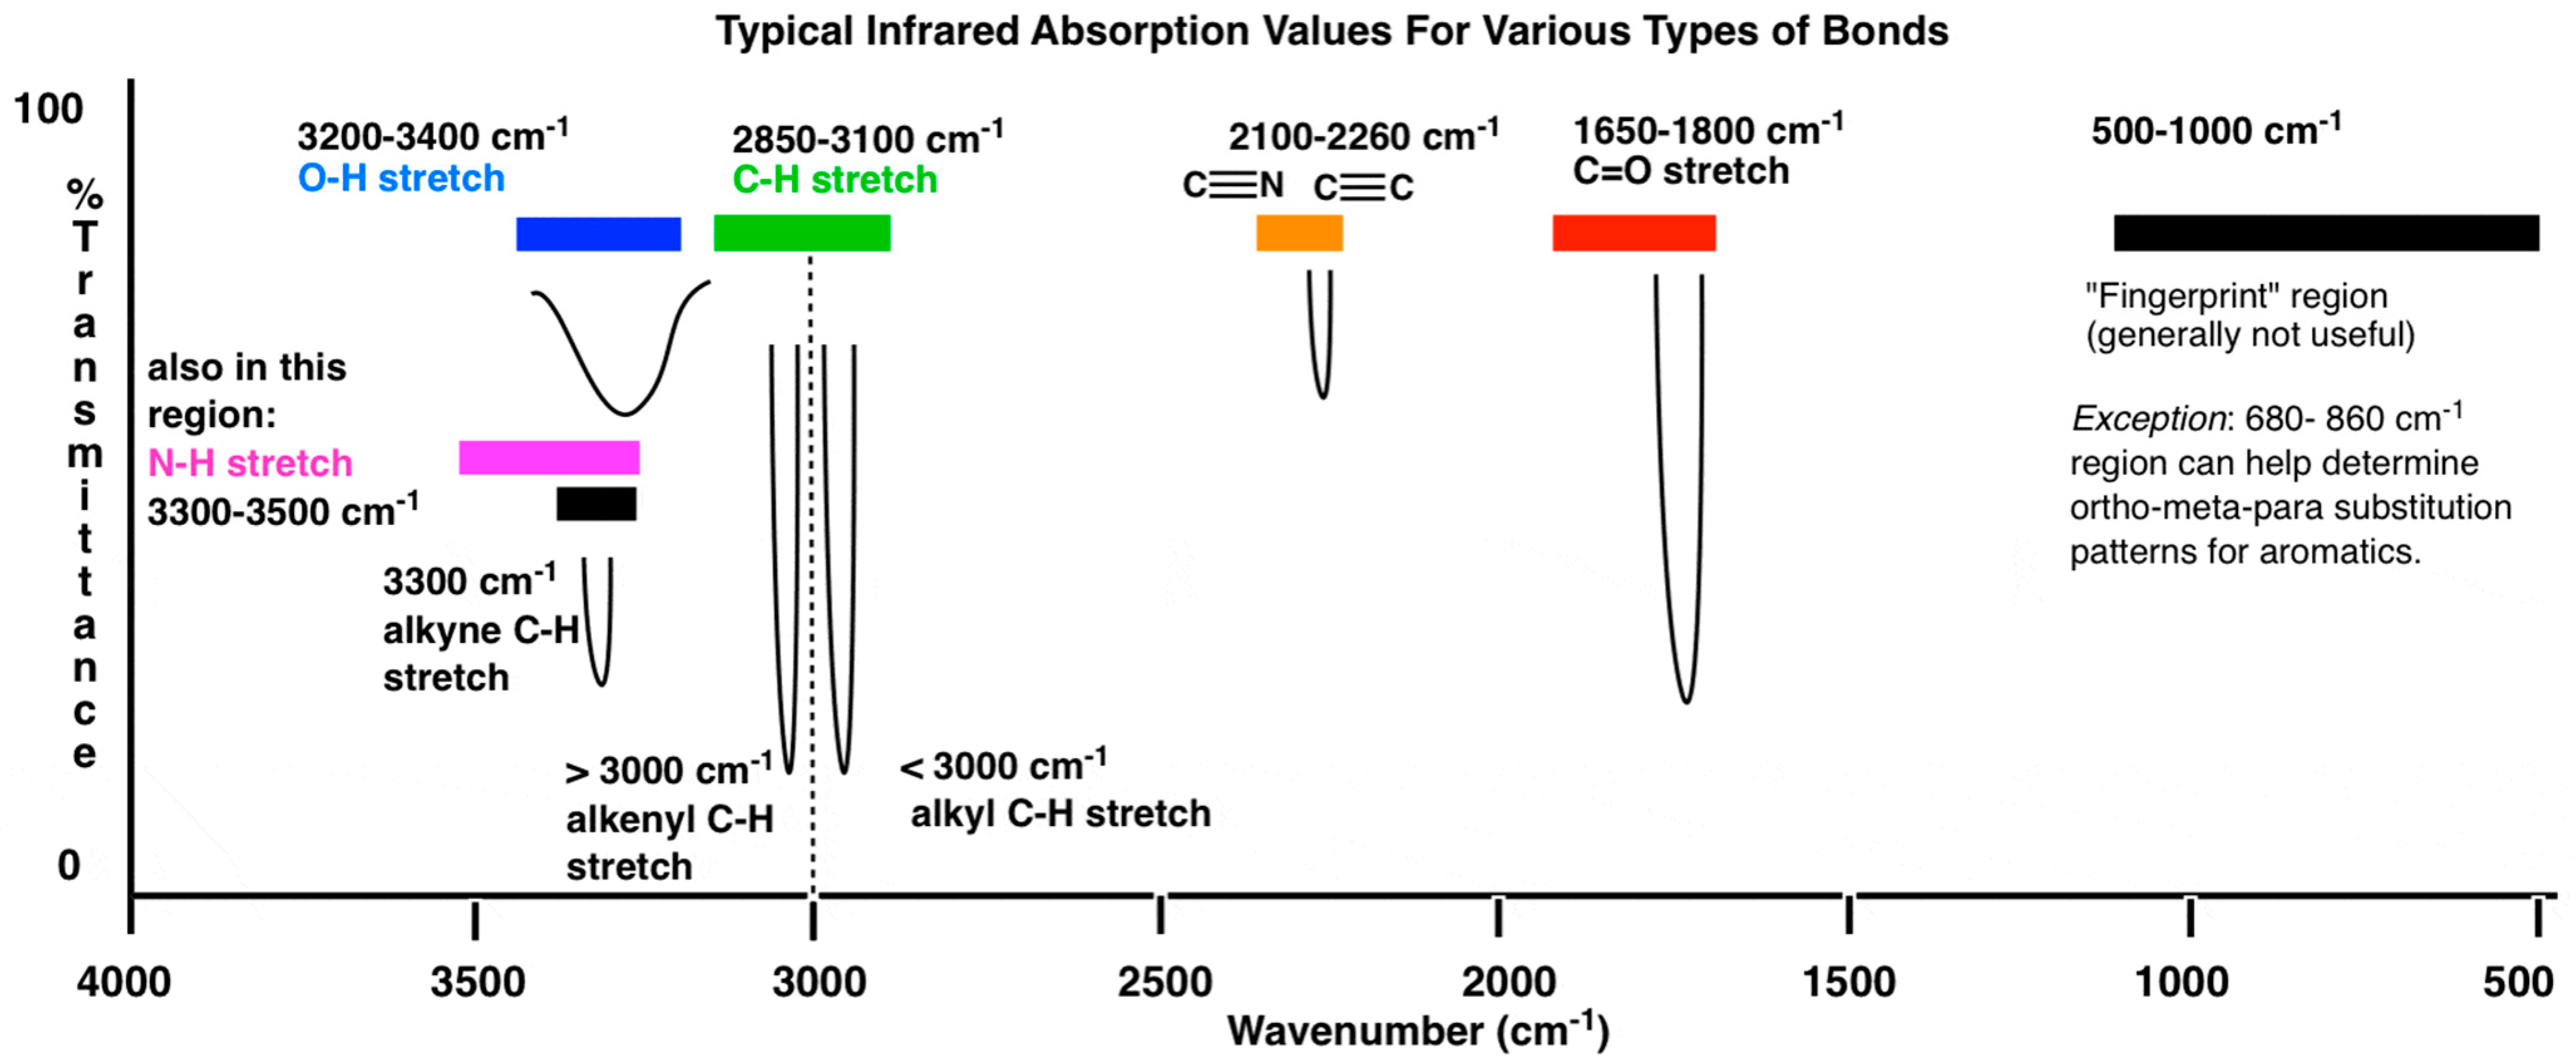
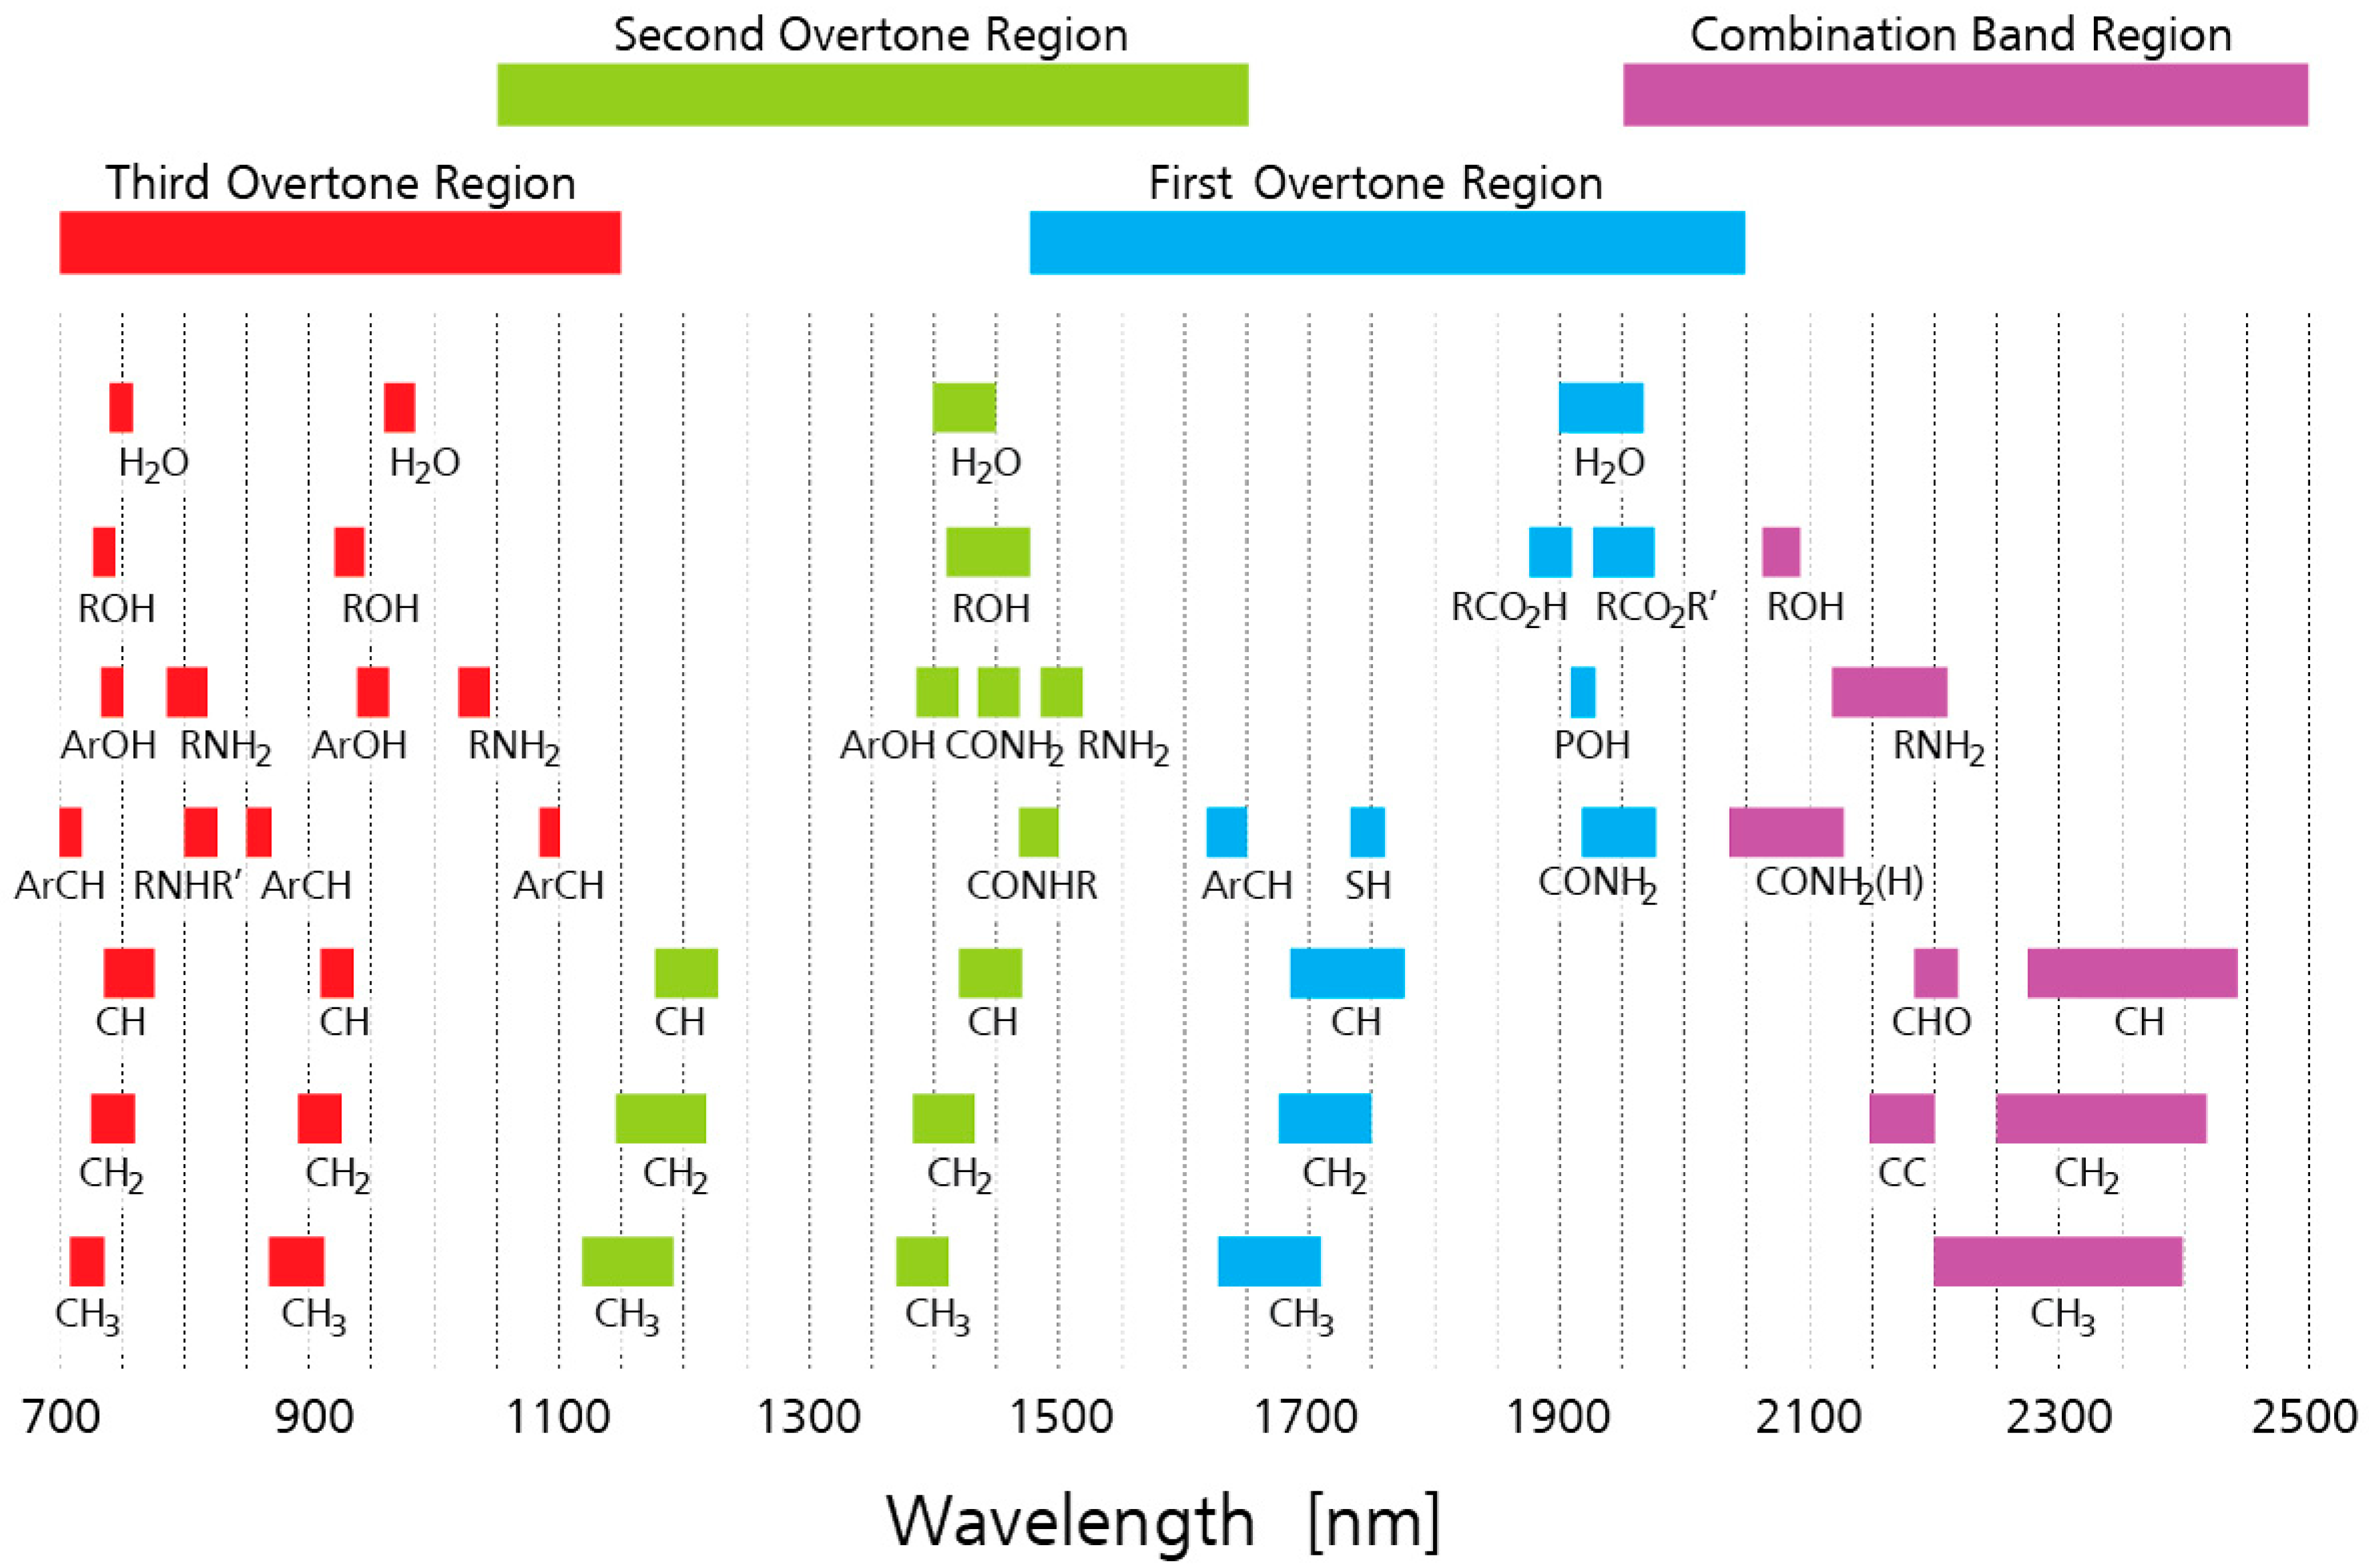
1.2. Key Absorbance Peaks in the MIR and NIR Regions

| Bond | Compound/Functional Group | Wavenumbers (cm−1) 1 |
|---|---|---|
| O-H stretch | Water, alcohol | 3600–3200 |
| C-H stretch | Alkene | 3100–3000 |
| C-H stretch | Aromatic ring | 3060–3020 |
| C-H stretch | CH2/CH3 | 2960–2860 |
| C=O stretch | Carboxylic acid | ~1750 |
| C=O stretch | Ester | 1750–1715 |
| C=O stretch (amide I) | Amide | 1700–1600 |
| C=C stretch | Alkene | 1666–1640 |
| C=C stretch | Aromatic ring | 1625–1590, 1590–1575, 1525–1470, 1465–1430 |
| -C-H deformation vibration (asymmetric and symmetric) | Methoxy group | 1470–1435 |
| O-H deformation | Phenol | 1390–1330 |
| C-O-H deformation | Phenol | 1382–1317 |
| C-O vibration | Alkyl-aryl ether | 1310–1210, 1120–1020 |
| C-O stretch | Phenol | 1260–1180 |
| C-C stretch | Phenyl carbon | 1225–1075 |
| C-O stretch | Ester, alcohol | 1230–1030 |
| -C-H rocking vibration | Methoxy group | 1200–1185 |
| C-O stretching vibration | Phenol | 1150–1040 |
| C-H out-of-plane deformation | Aromatic ring | 900–700 |
| O-H out-of-plane deformation | Aromatic ring | ~720 |
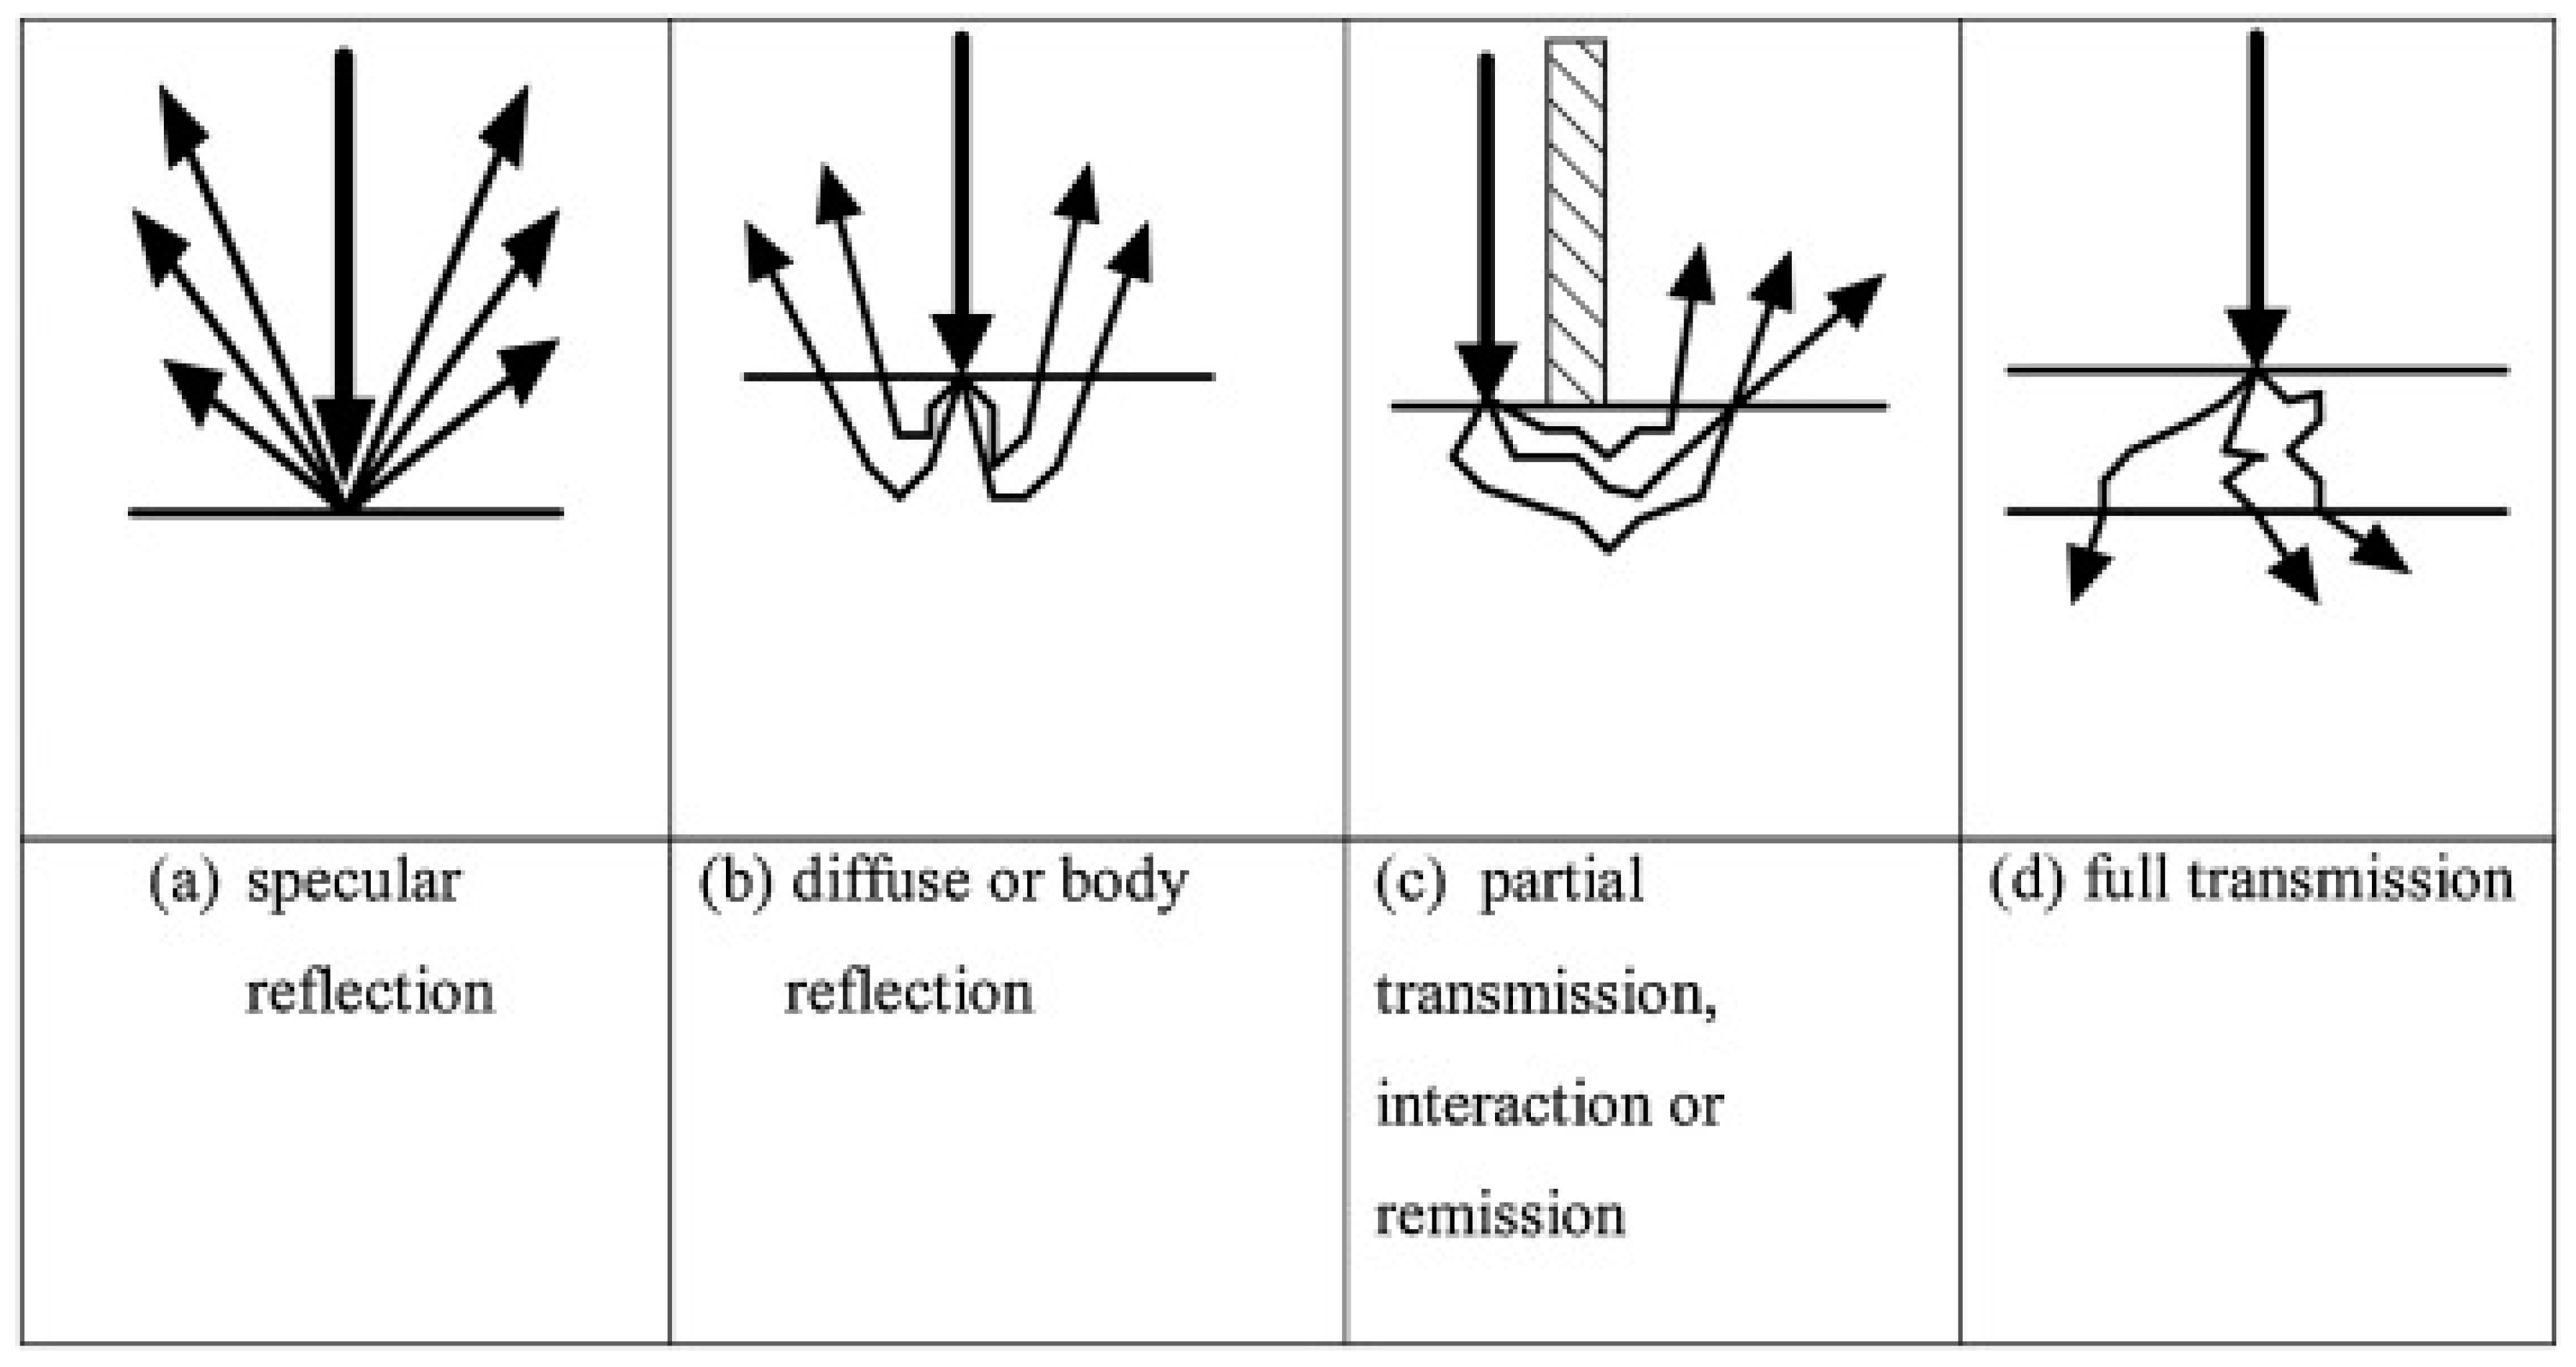
1.3. Sample Presentation
1.4. Data Processing
1.4.1. Spectral Pre-Processing
1.4.2. Data Analysis Methods
2. Bioactive Compounds and Their Significance in Functional Foods
2.1. Functional Foods
2.2. Definition of Bioactive Compounds
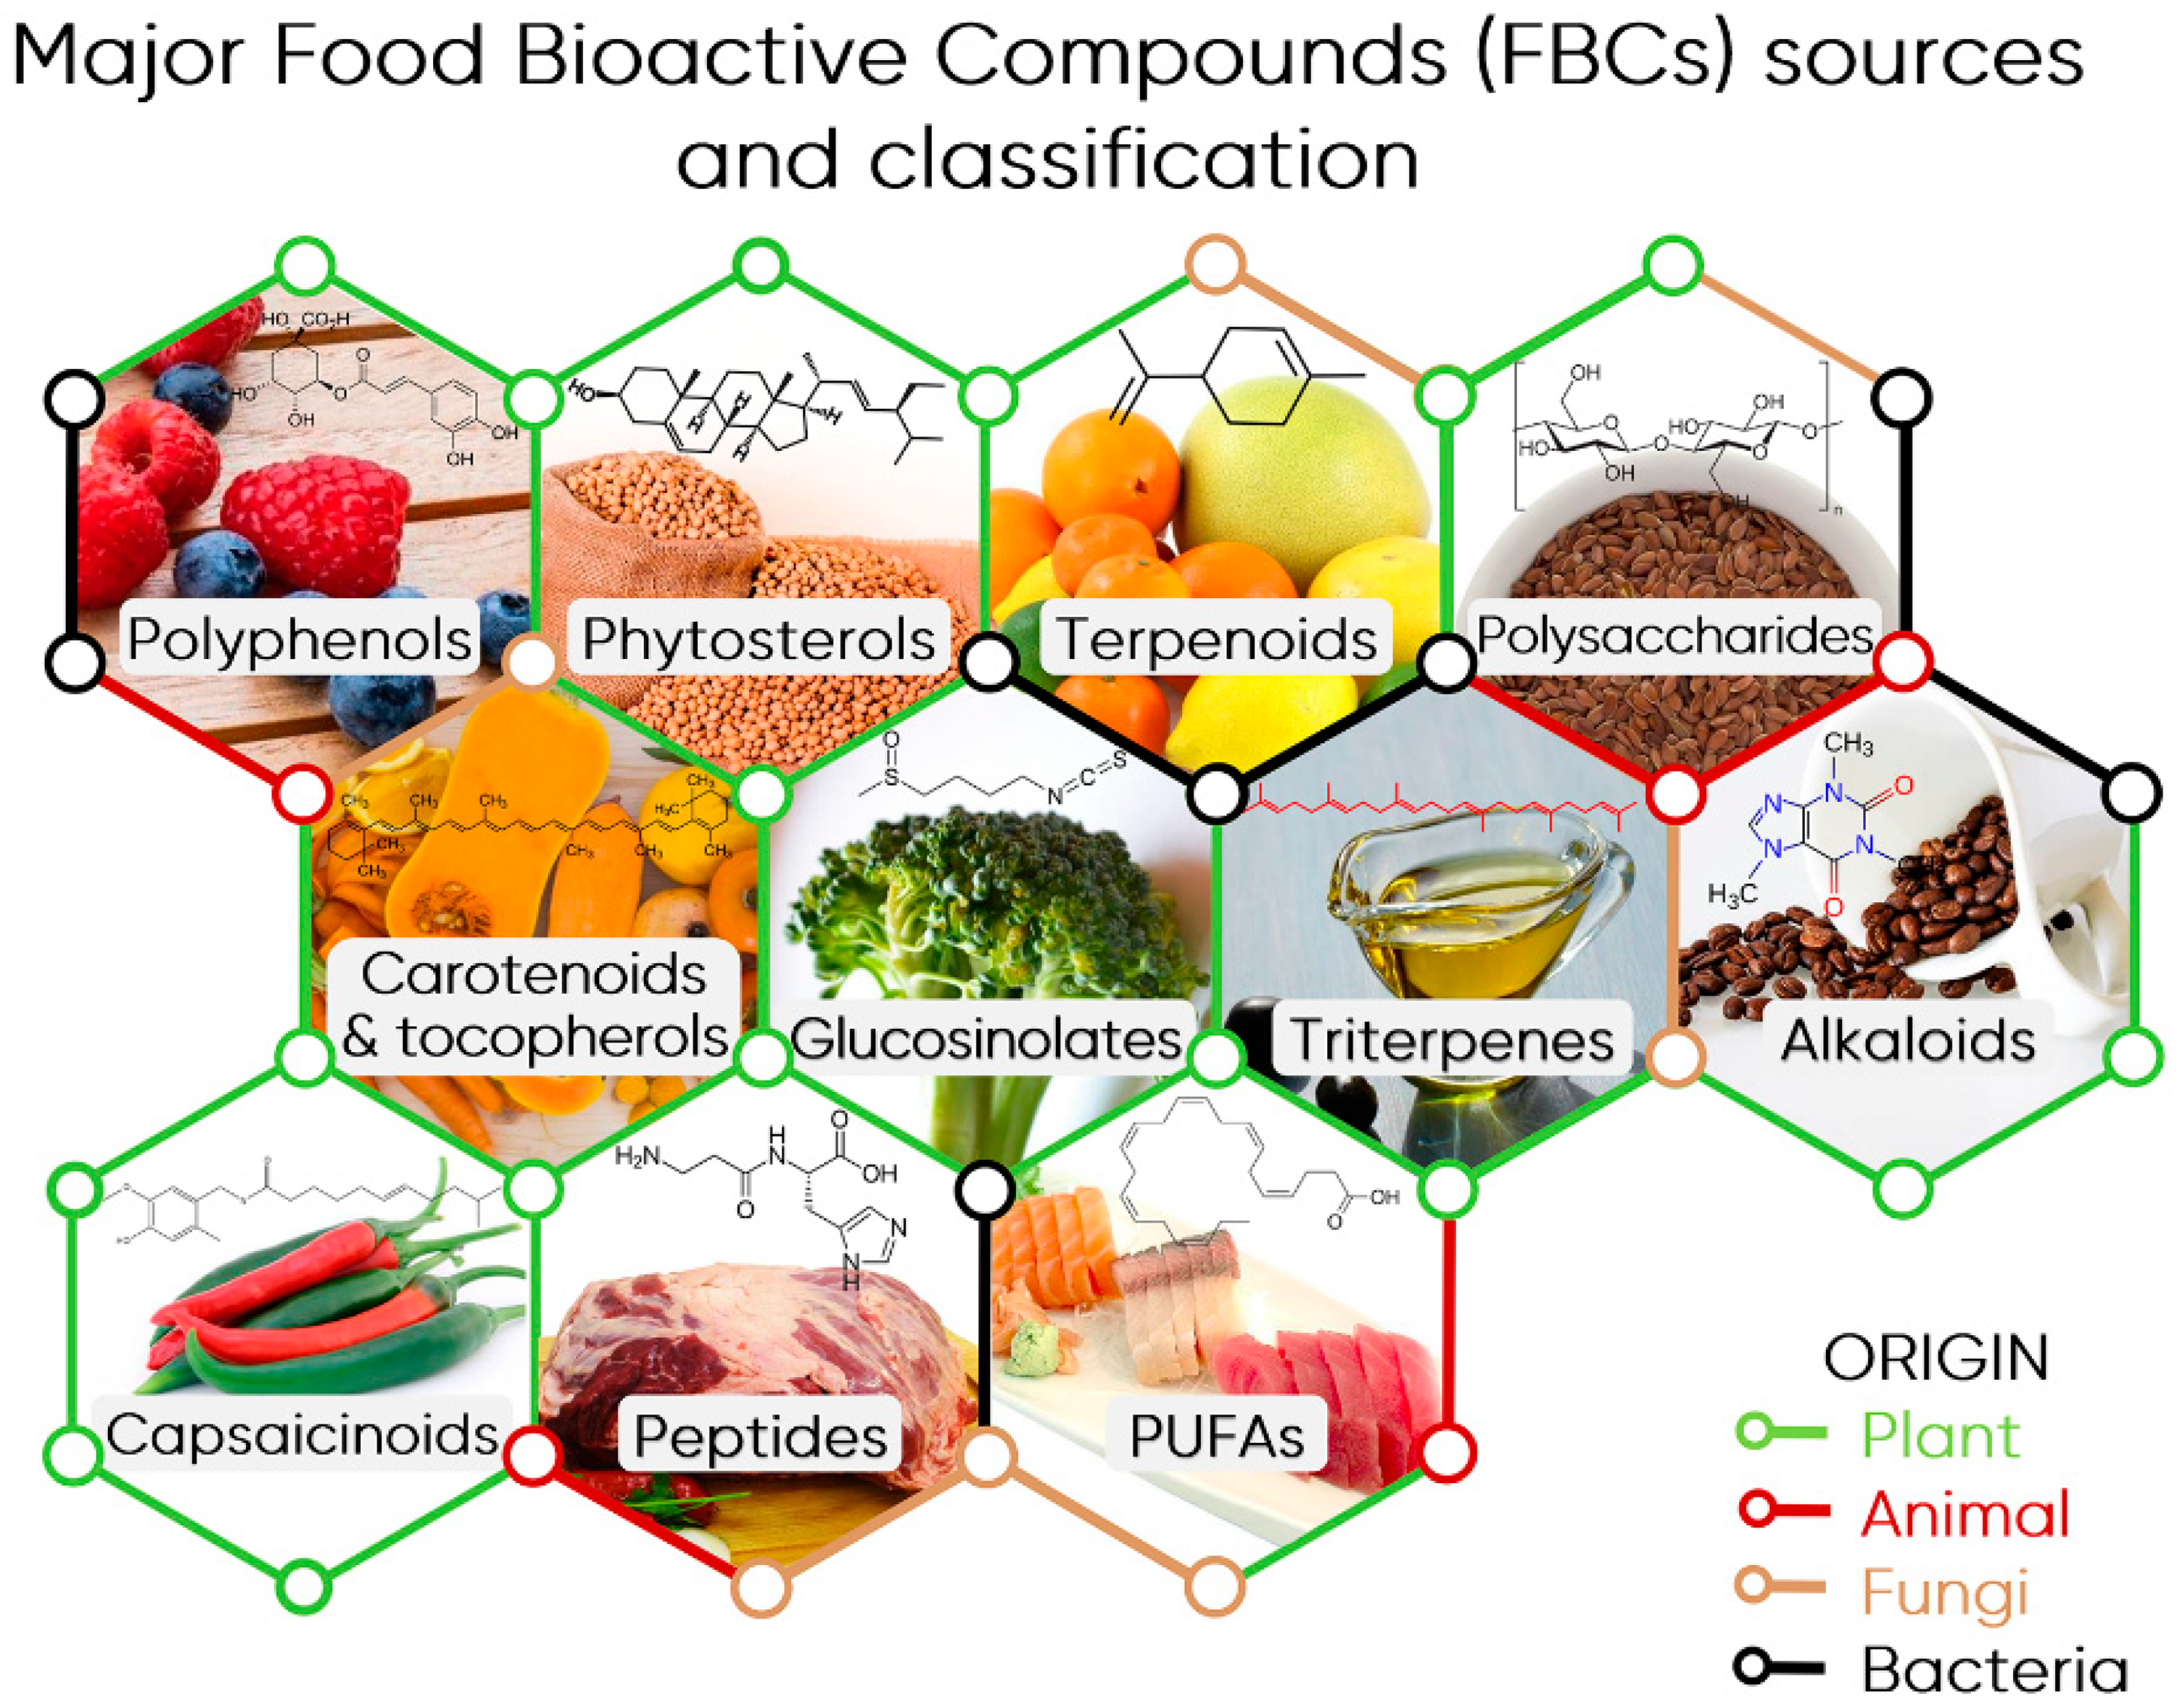
2.3. Classes of Bioactive Compounds
2.4. Current Analytical Methods
2.5. Previous Work and Aims
3. Methods
- Any of the following: near infrared OR mid infrared OR spectroscopy;
- AND food;
- AND bioactive OR phenolic OR antioxidant OR anthocyanin;
- AND quantification OR determination OR measurement.
- Original studies published in the last 5 years (between 2016 and 2020);
- Quantified a compound or group of compounds with recognised health-benefiting effects, above that expected from basic nutritional needs;
- The matrix was a food or potential food product.
4. Scientific Effort (2016–2020)
4.1. General Trends
4.1.1. Publications by Year
4.1.2. Matrix Type
4.1.3. Optical Geometry
4.1.4. Sample Size and Test Sets
4.1.5. Chemometric Techniques
4.2. Trends by Analyte Class
4.2.1. Polyphenols
4.2.2. Anthocyanins
4.2.3. Carotenoids
4.2.4. Ascorbic Acid
4.2.5. Other Analytes
4.3. Future Directions
5. Conclusions
Author Contributions
Funding
Institutional Review Board Statement
Informed Consent Statement
Data Availability Statement
Acknowledgments
Conflicts of Interest
References
- Almeida, M.; Torrance, K.; Datta, A. Measurement of optical properties of foods in near-and mid-infrared radiation. Int. J. Food Prop. 2006, 9, 651–664. [Google Scholar] [CrossRef]
- Burks, C.S.; Dowell, F.E.; Xie, F. Measuring fig quality using near-infrared spectroscopy. J. Stored Prod. Res. 2000, 36, 289–296. [Google Scholar] [CrossRef] [PubMed]
- Bureau, S.; Cozzolino, D.; Clark, C.J. Contributions of Fourier-transform mid infrared (FT-MIR) spectroscopy to the study of fruit and vegetables: A review. Postharvest Biol. Technol. 2019, 148, 1–14. [Google Scholar] [CrossRef]
- Walsh, K.B.; Blasco, J.; Zude-Sasse, M.; Sun, X. Visible-NIR ‘point’ spectroscopy in postharvest fruit and vegetable assessment: The science behind three decades of commercial use. Postharvest Biol. Technol. 2020, 168, 111246. [Google Scholar] [CrossRef]
- Johnson, J.B.; Naiker, M. Seeing red: A review of the use of near-infrared spectroscopy (NIRS) in entomology. Appl. Spectrosc. Rev. 2019, 55, 810–839. [Google Scholar] [CrossRef]
- Velasco, L.; Schierholt, A.; Becker, H.C. Performance of near-infrared reflectance spectroscopy (NIRS) in routine analysis of C18 unsaturated fatty acids in intact rapeseed. Lipid Fett 1998, 100, 44–48. [Google Scholar] [CrossRef]
- Bokobza, L. Near Infrared Spectroscopy. J. Near Infrared Spectrosc. 1998, 6, 3–17. [Google Scholar] [CrossRef]
- Dufour, E. Principles of infrared spectroscopy. In Infrared Spectroscopy for Food Quality Analysis and Control; Sun, D.-W., Ed.; Academic Press: Burlington, MA, USA, 2009; pp. 1–27. [Google Scholar]
- Abbas, O.; Compère, G.; Larondelle, Y.; Pompeu, D.; Rogez, H.; Baeten, V. Phenolic compound explorer: A mid-infrared spectroscopy database. Vib. Spectrosc. 2017, 92, 111–118. [Google Scholar] [CrossRef]
- Mecozzi, M.; Sturchio, E. Computer Assisted Examination of Infrared and Near Infrared Spectra to Assess Structural and Molecular Changes in Biological Samples Exposed to Pollutants: A Case of Study. J. Imaging 2017, 3, 11. [Google Scholar] [CrossRef] [Green Version]
- Clark, C.J.; McGlone, V.A.; Jordan, R.B. Detection of Brownheart in ‘Braeburn’ apple by transmission NIR spectroscopy. Postharvest Biol. Technol. 2003, 28, 87–96. [Google Scholar] [CrossRef]
- Fraser, D.G.; Jordan, R.B.; Künnemeyer, R.; McGlone, V.A. Light distribution inside mandarin fruit during internal quality assessment by NIR spectroscopy. Postharvest Biol. Technol. 2003, 27, 185–196. [Google Scholar] [CrossRef]
- Ncama, K.; Tesfay, S.Z.; Fawole, O.A.; Opara, U.L.; Magwaza, L.S. Non-destructive prediction of ‘Marsh’ grapefruit susceptibility to postharvest rind pitting disorder using reflectance Vis/NIR spectroscopy. Sci. Hortic. 2018, 231, 265–271. [Google Scholar] [CrossRef]
- Kumar, S.; Singh, R.; Dhanani, T. Rapid Estimation of Bioactive Phytochemicals in Vegetables and Fruits Using Near Infrared Reflectance Spectroscopy. In Fruit and Vegetable Phytochemicals, 2nd ed.; Yahia, E.M., Ed.; John Wiley & Sons: Hoboken, NJ, USA, 2017; pp. 781–802. [Google Scholar]
- Yang, Y.; Xu-zhen, C.; Gui-xing, R. Application of Near-Infrared Reflectance Spectroscopy to the Evaluation of D-chiro-lnositol, Vitexin, and Isovitexin Contents in Mung Bean. Agric. Sci. China 2011, 10, 1986–1991. [Google Scholar] [CrossRef]
- Caporaso, N.; Whitworth, M.B.; Fisk, I.D. Near-Infrared spectroscopy and hyperspectral imaging for non-destructive quality assessment of cereal grains. Appl. Spectrosc. Rev. 2018, 53, 667–687. [Google Scholar] [CrossRef] [Green Version]
- Wilson, R.H.; Tapp, H.S. Mid-infrared spectroscopy for food analysis: Recent new applications and relevant developments in sample presentation methods. TrAC Trends Anal. Chem. 1999, 18, 85–93. [Google Scholar] [CrossRef]
- Kawano, S. Sampling and sample presentation. In Near-Infrared Spectroscopy: Principles, Instruments, Applications; Siesler, H.W., Ozaki, Y., Kawata, S., Heise, H.M., Eds.; John Wiley & Sons: Weinheim, Germany, 2008. [Google Scholar]
- Gautam, R.; Vanga, S.; Ariese, F.; Umapathy, S. Review of multidimensional data processing approaches for Raman and infrared spectroscopy. EPJ Tech. Instrum. 2015, 2, 8. [Google Scholar] [CrossRef] [Green Version]
- Rinnan, Å. Pre-processing in vibrational spectroscopy—When, why and how. Anal. Methods 2014, 6, 7124–7129. [Google Scholar] [CrossRef]
- Schoot, M.; Kapper, C.; van Kollenburg, G.H.; Postma, G.J.; van Kessel, G.; Buydens, L.M.C.; Jansen, J.J. Investigating the need for preprocessing of near-infrared spectroscopic data as a function of sample size. Chemom. Intell. Lab. Syst. 2020, 204, 104105. [Google Scholar] [CrossRef]
- Dotto, A.C.; Dalmolin, R.S.D.; ten Caten, A.; Grunwald, S. A systematic study on the application of scatter-corrective and spectral-derivative preprocessing for multivariate prediction of soil organic carbon by Vis-NIR spectra. Geoderma 2018, 314, 262–274. [Google Scholar] [CrossRef]
- Mishra, P.; Biancolillo, A.; Roger, J.M.; Marini, F.; Rutledge, D.N. New data preprocessing trends based on ensemble of multiple preprocessing techniques. TrAC Trends Anal. Chem. 2020, 132, 116045. [Google Scholar] [CrossRef]
- Lee, L.C.; Liong, C.-Y.; Jemain, A.A. A contemporary review on Data Preprocessing (DP) practice strategy in ATR-FTIR spectrum. Chemom. Intell. Lab. Syst. 2017, 163, 64–75. [Google Scholar] [CrossRef]
- Rodriguez-Otero, J.L.; Hermida, M.; Cepeda, A. Determination of Fat, Protein, and Total Solids in Cheese by Near-Infrared Reflectance Spectroscopy. J. AOAC Int. 1995, 78, 802–806. [Google Scholar] [CrossRef] [PubMed]
- Orman, B.A.; Schumann, R.A. Comparison of near-infrared spectroscopy calibration methods for the prediction of protein, oil, and starch in maize grain. J. Agric. Food Chem. 1991, 39, 883–886. [Google Scholar] [CrossRef]
- Terhoeven-Urselmans, T.; Schmidt, H.; Joergensen, R.G.; Ludwig, B. Usefulness of near-infrared spectroscopy to determine biological and chemical soil properties: Importance of sample pre-treatment. Soil Biol. Biochem. 2008, 40, 1178–1188. [Google Scholar] [CrossRef]
- Mehmood, T.; Ahmed, B. The diversity in the applications of partial least squares: An overview. J. Chemom. 2016, 30, 4–17. [Google Scholar] [CrossRef]
- Cobaleda-Velasco, M.; Almaraz-Abarca, N.; Alanis-Bañuelos, R.E.; Uribe-Soto, J.N.; González-Valdez, L.S.; Muñoz-Hernández, G.; Zaca-Morán, O.; Rojas-López, M. Rapid determination of phenolics, flavonoids, and antioxidant properties of Physalis ixocarpa Brot. ex Hornem. and Physalis angulata L. by infrared spectroscopy and partial least squares. Anal. Lett. 2018, 51, 523–536. [Google Scholar] [CrossRef]
- de Oliveira, G.A.; Bureau, S.; Renard, C.M.-G.C.; Pereira-Netto, A.B.; de Castilhos, F. Comparison of NIRS approach for prediction of internal quality traits in three fruit species. Food Chem. 2014, 143, 223–230. [Google Scholar] [CrossRef]
- Hu, Y.; Pan, Z.J.; Liao, W.; Li, J.; Gruget, P.; Kitts, D.D.; Lu, X. Determination of antioxidant capacity and phenolic content of chocolate by attenuated total reflectance-Fourier transformed-infrared spectroscopy. Food Chem. 2016, 202, 254–261. [Google Scholar] [CrossRef]
- Gabriëls, S.H.E.J.; Mishra, P.; Mensink, M.G.J.; Spoelstra, P.; Woltering, E.J. Non-destructive measurement of internal browning in mangoes using visible and near-infrared spectroscopy supported by artificial neural network analysis. Postharvest Biol. Technol. 2020, 166, 111206. [Google Scholar] [CrossRef]
- Sharabiani, V.R.; Nazarloo, A.S.; Taghinezhad, E. Prediction of Protein Content of Winter Wheat by Canopy of Near Infrared Spectroscopy (NIRS), Using Partial Least Squares Regression (PLSR) and Artificial Neural Network (ANN) Models. Yüzüncü Yıl Üniversitesi Tarım Bilim. Derg. 2019, 29, 43–51. [Google Scholar] [CrossRef] [Green Version]
- Le, B.T. Application of deep learning and near infrared spectroscopy in cereal analysis. Vib. Spectrosc. 2020, 106, 103009. [Google Scholar] [CrossRef]
- Rajalakshmi, G.; Gopal, A. Performance evaluation of preprocessing techniques for near-infrared spectroscopy signals. Microprocess. Microsyst. 2020, 79, 103372. [Google Scholar] [CrossRef]
- Ludwig, B.; Murugan, R.; Parama, V.R.R.; Vohland, M. Accuracy of Estimating Soil Properties with Mid-Infrared Spectroscopy: Implications of Different Chemometric Approaches and Software Packages Related to Calibration Sample Size. Soil Sci. Soc. Am. J. 2019, 83, 1542–1552. [Google Scholar] [CrossRef] [Green Version]
- Ni, W.; Nørgaard, L.; Mørup, M. Non-linear calibration models for near infrared spectroscopy. Anal. Chim. Acta 2014, 813, 1–14. [Google Scholar] [CrossRef]
- Urala, N.; Lähteenmäki, L. Consumers’ changing attitudes towards functional foods. Food Qual. Prefer. 2007, 18, 1–12. [Google Scholar] [CrossRef]
- Granato, D.; Nunes, D.S.; Barba, F.J. An integrated strategy between food chemistry, biology, nutrition, pharmacology, and statistics in the development of functional foods: A proposal. Trends Food Sci. Technol. 2017, 62, 13–22. [Google Scholar] [CrossRef]
- Johnson, J.B.; Walsh, K.B.; Mani, J.S.; Bhattarai, S.; Naiker, M. More than Protein: The Potential for Rapid Assessment of Bioactive Compounds in Australian Crops. In Proceedings of the Developing Northern Australia Conference, Rockhampton, Australia, 23–25 November 2020. [Google Scholar]
- Netzel, M.; Fanning, K.; Netzel, G.; Zabaras, D.; Karagianis, G.; Treloar, T.; Russell, D.; Stanley, R. Urinary excretion of antioxidants in healthy humans following Queen Garnet plum juice ingestion: A new plum variety rich in antioxidant compounds. J. Food Biochem. 2012, 36, 159–170. [Google Scholar] [CrossRef]
- Santhakumar, A.B.; Kundur, A.R.; Fanning, K.; Netzel, M.; Stanley, R.; Singh, I. Consumption of anthocyanin-rich Queen Garnet plum juice reduces platelet activation related thrombogenesis in healthy volunteers. J. Funct. Foods 2015, 12, 11–22. [Google Scholar] [CrossRef]
- Bochenek, H.F.; Santhakumar, A.B.; Francis, N.; Blanchard, C.L.; Chinkwo, K.A. Anti-cancer effects of chickpea extracts. In Proceedings of the 69th Australasian Grain Science Conference, Melbourne, Australia, 27–29 August 2019. [Google Scholar]
- Di Pasquale, J.; Adinolfi, F.; Capitanio, F. Analysis of consumer attitudes and consumers’ willingness to pay for functional foods. Int. J. Food Syst. Dyn. 2011, 2, 181–193. [Google Scholar] [CrossRef]
- Barreiro-Hurlé, J.; Colombo, S.; Cantos-Villar, E. Is there a market for functional wines? Consumer preferences and willingness to pay for resveratrol-enriched red wine. Food Qual. Prefer. 2008, 19, 360–371. [Google Scholar] [CrossRef]
- Hirogaki, M. Estimating consumers’ willingness to pay for health food claims: A conjoint analysis. Int. J. Innov. Manag. Technol. 2013, 4, 541. [Google Scholar] [CrossRef]
- Markosyan, A.; McCluskey, J.J.; Wahl, T.I. Consumer Response to Information about a Functional Food Product: Apples Enriched with Antioxidants. Can. J. Agric. Econ. Rev. Can. D’agroeconomie 2009, 57, 325–341. [Google Scholar] [CrossRef]
- Miškolci, S. Consumer preferences and willingness to pay for the health aspects of food. Acta Univ. Agric. Silvic. Mendel. Brun. 2014, 59, 167–176. [Google Scholar] [CrossRef] [Green Version]
- López-Barrios, L.; Gutiérrez-Uribe, J.A.; Serna-Saldívar, S.O. Bioactive peptides and hydrolysates from pulses and their potential use as functional ingredients. J. Food Sci. 2014, 79, R273–R283. [Google Scholar] [CrossRef]
- Vioque, J.; Alaiz, M.; Girón-Calle, J. Nutritional and functional properties of Vicia faba protein isolates and related fractions. Food Chem. 2012, 132, 67–72. [Google Scholar] [CrossRef]
- Zhang, Z.-L.; Zhou, M.-L.; Tang, Y.; Li, F.-L.; Tang, Y.-X.; Shao, J.-R.; Xue, W.-T.; Wu, Y.-M. Bioactive compounds in functional buckwheat food. Food Res. Int. 2012, 49, 389–395. [Google Scholar] [CrossRef]
- Boukid, F.; Folloni, S.; Sforza, S.; Vittadini, E.; Prandi, B. Current Trends in Ancient Grains-Based Foodstuffs: Insights into Nutritional Aspects and Technological Applications. Compr. Rev. Food Sci. Food Saf. 2018, 17, 123–136. [Google Scholar] [CrossRef] [Green Version]
- Cooper, R. Re-discovering ancient wheat varieties as functional foods. J. Tradit. Complement. Med. 2015, 5, 138–143. [Google Scholar] [CrossRef] [Green Version]
- Singh, B.; Singh, J.P.; Shevkani, K.; Singh, N.; Kaur, A. Bioactive constituents in pulses and their health benefits. J. Food Sci. Technol. 2017, 54, 858–870. [Google Scholar] [CrossRef] [Green Version]
- Fanning, K.; Edwards, D.; Netzel, M.; Stanley, R.; Netzel, G.; Russell, D.; Topp, B. Increasing anthocyanin content in Queen Garnet plum and correlations with in-field measures. In Proceedings of the X International Symposium on Plum and Prune Genetics, Breeding and Pomology, Davis, CA, USA, 20–26 May 2013; pp. 97–104. [Google Scholar]
- Xiang, J.; Zhang, M.; Apea-Bah, F.B.; Beta, T. Hydroxycinnamic acid amide (HCAA) derivatives, flavonoid C-glycosides, phenolic acids and antioxidant properties of foxtail millet. Food Chem. 2019, 295, 214–223. [Google Scholar] [CrossRef]
- de Lima Yamaguchi, K.K.; Pereira, L.F.R.; Lamarão, C.V.; Lima, E.S.; da Veiga-Junior, V.F. Amazon acai: Chemistry and biological activities: A review. Food Chem. 2015, 179, 137–151. [Google Scholar] [CrossRef] [PubMed]
- Guaadaoui, A.; Benaicha, S.; Elmajdoub, N.; Bellaoui, M.; Hamal, A. What is a bioactive compound? A combined definition for a preliminary consensus. Int. J. Nutr. Food Sci. 2014, 3, 174–179. [Google Scholar] [CrossRef]
- Biesalski, H.-K.; Dragsted, L.O.; Elmadfa, I.; Grossklaus, R.; Müller, M.; Schrenk, D.; Walter, P.; Weber, P. Bioactive compounds: Definition and assessment of activity. Nutrition 2009, 25, 1202–1205. [Google Scholar] [CrossRef]
- Kalra, E.K. Nutraceutical—Definition and introduction. AAPS PharmSci 2003, 5, 27–28. [Google Scholar] [CrossRef] [PubMed] [Green Version]
- Hamzalıoğlu, A.; Gökmen, V. Chapter 18—Interaction between Bioactive Carbonyl Compounds and Asparagine and Impact on Acrylamide. In Acrylamide in Food; Gökmen, V., Ed.; Academic Press: Cambridge, MA, USA, 2016; pp. 355–376. [Google Scholar]
- Mani, J.S.; Johnson, J.B.; Hosking, H.; Ashwath, N.; Walsh, K.B.; Neilsen, P.M.; Broszczak, D.A.; Naiker, M. Antioxidative and therapeutic potential of selected Australian plants: A review. J. Ethnopharmacol. 2021, 268, 113580. [Google Scholar] [CrossRef]
- Câmara, J.S.; Albuquerque, B.R.; Aguiar, J.; Corrêa, R.C.G.; Gonçalves, J.L.; Granato, D.; Pereira, J.A.M.; Barros, L.; Ferreira, I.C.F.R. Food Bioactive Compounds and Emerging Techniques for Their Extraction: Polyphenols as a Case Study. Foods 2021, 10, 37. [Google Scholar] [CrossRef]
- Pellegrini, N.; Vitaglione, P.; Granato, D.; Fogliano, V. Twenty-five years of total antioxidant capacity measurement of foods and biological fluids: Merits and limitations. J. Sci. Food Agric. 2020, 100, 5064–5078. [Google Scholar] [CrossRef]
- Pompella, A.; Sies, H.; Wacker, R.; Brouns, F.; Grune, T.; Biesalski, H.K.; Frank, J. The use of total antioxidant capacity as surrogate marker for food quality and its effect on health is to be discouraged. Nutrition 2014, 30, 791–793. [Google Scholar] [CrossRef]
- Fraga, C.G.; Oteiza, P.I.; Galleano, M. In vitro measurements and interpretation of total antioxidant capacity. Biochim. Biophys. Acta (BBA) Gen. Subj. 2014, 1840, 931–934. [Google Scholar] [CrossRef]
- Hermsdorff, H.H.M.; Puchau, B.; Volp, A.C.P.; Barbosa, K.B.F.; Bressan, J.; Zulet, M.Á.; Martínez, J.A. Dietary total antioxidant capacity is inversely related to central adiposity as well as to metabolic and oxidative stress markers in healthy young adults. Nutr. Metab. 2011, 8, 59. [Google Scholar] [CrossRef] [Green Version]
- Wang, Y.; Yang, M.; Lee, S.-G.; Davis, C.G.; Koo, S.I.; Fernandez, M.L.; Volek, J.S.; Chun, O.K. Diets high in total antioxidant capacity improve risk biomarkers of cardiovascular disease: A 9-month observational study among overweight/obese postmenopausal women. Eur. J. Nutr. 2014, 53, 1363–1369. [Google Scholar] [CrossRef] [PubMed]
- Kobayashi, S.; Murakami, K.; Sasaki, S.; Uenishi, K.; Yamasaki, M.; Hayabuchi, H.; Goda, T.; Oka, J.; Baba, K.; Ohki, K.; et al. Dietary total antioxidant capacity from different assays in relation to serum C-reactive protein among young Japanese women. Nutr. J. 2012, 11, 91. [Google Scholar] [CrossRef] [PubMed] [Green Version]
- Detopoulou, P.; Panagiotakos, D.B.; Chrysohoou, C.; Fragopoulou, E.; Nomikos, T.; Antonopoulou, S.; Pitsavos, C.; Stefanadis, C. Dietary antioxidant capacity and concentration of adiponectin in apparently healthy adults: The ATTICA study. Eur. J. Clin. Nutr. 2010, 64, 161–168. [Google Scholar] [CrossRef] [PubMed] [Green Version]
- Agudo, A.; Cabrera, L.; Amiano, P.; Ardanaz, E.; Barricarte, A.; Berenguer, T.; Chirlaque, M.D.; Dorronsoro, M.; Jakszyn, P.; Larrañaga, N.; et al. Fruit and vegetable intakes, dietary antioxidant nutrients, and total mortality in Spanish adults: Findings from the Spanish cohort of the European Prospective Investigation into Cancer and Nutrition (EPIC-Spain). Am. J. Clin. Nutr. 2007, 85, 1634–1642. [Google Scholar] [CrossRef] [Green Version]
- Bastide, N.; Dartois, L.; Dyevre, V.; Dossus, L.; Fagherazzi, G.; Serafini, M.; Boutron-Ruault, M.-C. Dietary antioxidant capacity and all-cause and cause-specific mortality in the E3N/EPIC cohort study. Eur. J. Nutr. 2017, 56, 1233–1243. [Google Scholar] [CrossRef]
- Rautiainen, S.; Levitan, E.B.; Orsini, N.; Åkesson, A.; Morgenstern, R.; Mittleman, M.A.; Wolk, A. Total Antioxidant Capacity from Diet and Risk of Myocardial Infarction: A Prospective Cohort of Women. Am. J. Med. 2012, 125, 974–980. [Google Scholar] [CrossRef]
- Rautiainen, S.; Levitan, E.B.; Mittleman, M.A.; Wolk, A. Total Antioxidant Capacity of Diet and Risk of Heart Failure: A Population-based Prospective Cohort of Women. Am. J. Med. 2013, 126, 494–500. [Google Scholar] [CrossRef]
- Rautiainen, S.; Larsson, S.; Virtamo, J.; Wolk, A. Total Antioxidant Capacity of Diet and Risk of Stroke. Stroke 2012, 43, 335–340. [Google Scholar] [CrossRef] [Green Version]
- Del Rio, D.; Agnoli, C.; Pellegrini, N.; Krogh, V.; Brighenti, F.; Mazzeo, T.; Masala, G.; Bendinelli, B.; Berrino, F.; Sieri, S.; et al. Total Antioxidant Capacity of the Diet Is Associated with Lower Risk of Ischemic Stroke in a Large Italian Cohort. J. Nutr. 2010, 141, 118–123. [Google Scholar] [CrossRef] [Green Version]
- Colarusso, L.; Serafini, M.; Lagerros, Y.T.; Nyren, O.; La Vecchia, C.; Rossi, M.; Ye, W.; Tavani, A.; Adami, H.-O.; Grotta, A.; et al. Dietary antioxidant capacity and risk for stroke in a prospective cohort study of Swedish men and women. Nutrition 2017, 33, 234–239. [Google Scholar] [CrossRef]
- Kukula-Koch, W.; Koch, W.; Czernicka, L.; Głowniak, K.; Asakawa, Y.; Umeyama, A.; Marzec, Z.; Kuzuhara, T. MAO-A Inhibitory Potential of Terpene Constituents from Ginger Rhizomes—A Bioactivity Guided Fractionation. Molecules 2018, 23, 1301. [Google Scholar] [CrossRef] [PubMed] [Green Version]
- da Silva, A.P.G.; Spricigo, P.C.; Purgatto, E.; de Alencar, S.M.; Jacomino, A.P. Plinia trunciflora and Plinia cauliflora: Two species rich in bioactive compounds, terpenes, and minerals. J. Food Meas. Charact. 2019, 13, 921–931. [Google Scholar] [CrossRef]
- Xiang, J.; Apea-Bah, F.B.; Ndolo, V.U.; Katundu, M.C.; Beta, T. Profile of phenolic compounds and antioxidant activity of finger millet varieties. Food Chem. 2019, 275, 361–368. [Google Scholar] [CrossRef]
- Netzel, M.; Netzel, G.; Tian, Q.; Schwartz, S.; Konczak, I. Sources of Antioxidant Activity in Australian Native Fruits. Identification and Quantification of Anthocyanins. J. Agric. Food Chem. 2006, 54, 9820–9826. [Google Scholar] [CrossRef] [PubMed]
- Baysal, I.; Ekizoglu, M.; Ertas, A.; Temiz, B.; Agalar, H.G.; Yabanoglu-Ciftci, S.; Temel, H.; Ucar, G.; Turkmenoglu, F.P. Identification of Phenolic Compounds by LC-MS/MS and Evaluation of Bioactive Properties of Two Edible Halophytes: Limonium effusum and L. sinuatum. Molecules 2021, 26, 4040. [Google Scholar] [CrossRef]
- White, R. Chromatography/Fourier Transform Infrared Spectroscopy and Its Applications, 1st ed.; CRC Press: Boca Raton, FL, USA, 1990. [Google Scholar]
- Cordella, C.; Moussa, I.; Martel, A.-C.; Sbirrazzuoli, N.; Lizzani-Cuvelier, L. Recent Developments in Food Characterization and Adulteration Detection: Technique-Oriented Perspectives. J. Agric. Food Chem. 2002, 50, 1751–1764. [Google Scholar] [CrossRef] [PubMed]
- Salerno, T.M.G.; Donato, P.; Frison, G.; Zamengo, L.; Mondello, L. Gas Chromatography—Fourier Transform Infrared Spectroscopy for Unambiguous Determination of Illicit Drugs: A Proof of Concept. Front. Chem. 2020, 8, 624. [Google Scholar] [CrossRef]
- Frison, G.; Zancanaro, F.; Frasson, S.; Quadretti, L.; Agnati, M.; Vlassich, F.; Gagliardi, G.; Salerno, T.M.G.; Donato, P.; Mondello, L. Analytical Characterization of 3-MeO-PCP and 3-MMC in Seized Products and Biosamples: The Role of LC-HRAM-Orbitrap-MS and Solid Deposition GC-FTIR. Front. Chem. 2021, 8, 618339. [Google Scholar] [CrossRef]
- Salerno, T.M.G.; Coppolino, C.; Donato, P.; Mondello, L. The online coupling of liquid chromatography to Fourier transform infrared spectroscopy using a solute-deposition interface: A proof of concept. Anal. Bioanal. Chem. 2022, 414, 703–712. [Google Scholar] [CrossRef]
- Dos Santos, W.N.L.; da Silva Sauthier, M.C.; dos Santos, A.M.P.; de Andrade Santana, D.; Azevedo, R.S.A.; da Cruz Caldas, J. Simultaneous determination of 13 phenolic bioactive compounds in guava (Psidium guajava L.) by HPLC-PAD with evaluation using PCA and Neural Network Analysis (NNA). Microchem. J. 2017, 133, 583–592. [Google Scholar] [CrossRef]
- Johnson, J.; Collins, T.; Walsh, K.; Naiker, M. Solvent extractions and spectrophotometric protocols for measuring the total anthocyanin, phenols and antioxidant content in plums. Chem. Pap. 2020, 74, 4481–4492. [Google Scholar] [CrossRef]
- Johnson, J.; Mani, J.; Ashwath, N.; Naiker, M. Potential for Fourier transform infrared (FTIR) spectroscopy toward predicting antioxidant and phenolic contents in powdered plant matrices. Spectrochim. Acta Part A Mol. Biomol. Spectrosc. 2020, 233, 118228. [Google Scholar] [CrossRef]
- Mahesar, S.A.; Lucarini, M.; Durazzo, A.; Santini, A.; Lampe, A.I.; Kiefer, J. Application of Infrared Spectroscopy for Functional Compounds Evaluation in Olive Oil: A Current Snapshot. J. Spectrosc. 2019, 2019, 5319024. [Google Scholar] [CrossRef] [Green Version]
- Aleixandre-Tudo, J.L.; Nieuwoudt, H.; Aleixandre, J.L.; du Toit, W. Chemometric compositional analysis of phenolic compounds in fermenting samples and wines using different infrared spectroscopy techniques. Talanta 2018, 176, 526–536. [Google Scholar] [CrossRef]
- Cozzolino, D. Infrared Spectroscopy as a Versatile Analytical Tool for the Quantitative Determination of Antioxidants in Agricultural Products, Foods and Plants. Antioxidants 2015, 4, 482–497. [Google Scholar] [CrossRef] [PubMed]
- Lu, X.; Rasco, B.A. Determination of Antioxidant Content and Antioxidant Activity in Foods using Infrared Spectroscopy and Chemometrics: A Review. Crit. Rev. Food Sci. Nutr. 2012, 52, 853–875. [Google Scholar] [CrossRef] [PubMed]
- Ignat, I.; Volf, I.; Popa, V.I. A critical review of methods for characterisation of polyphenolic compounds in fruits and vegetables. Food Chem. 2011, 126, 1821–1835. [Google Scholar] [CrossRef]
- McGoverin, C.M.; Weeranantanaphan, J.; Downey, G.; Manley, M. Review: The Application of near Infrared Spectroscopy to the Measurement of Bioactive Compounds in Food Commodities. J. Near Infrared Spectrosc. 2010, 18, 87–111. [Google Scholar] [CrossRef]
- Pallone, J.A.L.; dos Santos Caramês, E.T.; Alamar, P.D. Green analytical chemistry applied in food analysis: Alternative techniques. Curr. Opin. Food Sci. 2018, 22, 115–121. [Google Scholar] [CrossRef]
- Júnior, L.C.C.; de Almeida Teixeira, G.H.; Nardini, V.; Walsh, K.B. Quality evaluation of intact açaí and juçara fruit by means of near infrared spectroscopy. Postharvest Biol. Technol. 2016, 112, 64–74. [Google Scholar] [CrossRef] [Green Version]
- Gardana, C.; Scialpi, A.; Fachechi, C.; Simonetti, P. Near-Infrared Spectroscopy and Chemometrics for the Routine Detection of Bilberry Extract Adulteration and Quantitative Determination of the Anthocyanins. J. Spectrosc. 2018, 2018, 4751247. [Google Scholar] [CrossRef] [Green Version]
- Toledo-Martín, E.M.; García-García, M.D.C.; Font, R.; Moreno-Rojas, J.M.; Salinas-Navarro, M.; Gómez, P.; del Río-Celestino, M. Quantification of Total Phenolic and Carotenoid Content in Blackberries (Rubus fructicosus L.) Using Near Infrared Spectroscopy (NIRS) and Multivariate Analysis. Molecules 2018, 23, 3191. [Google Scholar] [CrossRef] [PubMed] [Green Version]
- Tzanova, M.; Atanassova, S.; Atanasov, V.; Grozeva, N. Content of Polyphenolic Compounds and Antioxidant Potential of Some Bulgarian Red Grape Varieties and Red Wines, Determined by HPLC, UV, and NIR Spectroscopy. Agriculture 2020, 10, 193. [Google Scholar] [CrossRef]
- Xiao, H.; Li, A.; Li, M.; Sun, Y.; Tu, K.; Wang, S.; Pan, L. Quality assessment and discrimination of intact white and red grapes from Vitis vinifera L. at five ripening stages by visible and near-infrared spectroscopy. Sci. Hortic. 2018, 233, 99–107. [Google Scholar] [CrossRef]
- Diago, M.P.; Fernández-Novales, J.; Fernandes, A.M.; Melo-Pinto, P.; Tardaguila, J. Use of Visible and Short-Wave Near-Infrared Hyperspectral Imaging To Fingerprint Anthocyanins in Intact Grape Berries. J. Agric. Food Chem. 2016, 64, 7658–7666. [Google Scholar] [CrossRef]
- Martínez-Sandoval, J.R.; Nogales-Bueno, J.; Rodríguez-Pulido, F.J.; Hernández-Hierro, J.M.; Segovia-Quintero, M.A.; Martínez-Rosas, M.E.; Heredia, F.J. Screening of anthocyanins in single red grapes using a non-destructive method based on the near infrared hyperspectral technology and chemometrics. J. Sci. Food Agric. 2016, 96, 1643–1647. [Google Scholar] [CrossRef]
- Jara-Palacios, M.J.; Rodríguez-Pulido, F.J.; Hernanz, D.; Escudero-Gilete, M.L.; Heredia, F.J. Determination of phenolic substances of seeds, skins and stems from white grape marc by near-infrared hyperspectral imaging. Aust. J. Grape Wine Res. 2016, 22, 11–15. [Google Scholar] [CrossRef]
- Zhang, N.; Liu, X.; Jin, X.; Li, C.; Wu, X.; Yang, S.; Ning, J.; Yanne, P. Determination of total iron-reactive phenolics, anthocyanins and tannins in wine grapes of skins and seeds based on near-infrared hyperspectral imaging. Food Chem. 2017, 237, 811–817. [Google Scholar] [CrossRef]
- Alamar, P.D.; Caramês, E.T.S.; Poppi, R.J.; Pallone, J.A.L. Quality evaluation of frozen guava and yellow passion fruit pulps by NIR spectroscopy and chemometrics. Food Res. Int. 2016, 85, 209–214. [Google Scholar] [CrossRef]
- Arslan, M.; Xiaobo, Z.; Shi, J.; Tahir, H.E.; Zareef, M.; Rakha, A.; Bilal, M. In situ prediction of phenolic compounds in puff dried Ziziphus jujuba Mill. using hand-held spectral analytical system. Food Chem. 2020, 331, 127361. [Google Scholar] [CrossRef]
- Cozzolino, D.; Phan, A.D.T.; Netzel, M.E.; Smyth, H.; Sultanbawa, Y. The use of vibrational spectroscopy to predict vitamin C in Kakadu plum powders (Terminalia ferdinandiana Exell, Combretaceae). J. Sci. Food Agric. 2020, 101, 3208–3213. [Google Scholar] [CrossRef]
- Rodríguez-Pulido, F.J.; Gil-Vicente, M.; Gordillo, B.; Heredia, F.J.; González-Miret, M.L. Measurement of ripening of raspberries (Rubus idaeus L) by near infrared and colorimetric imaging techniques. J. Food Sci. Technol. 2017, 54, 2797–2803. [Google Scholar] [CrossRef] [PubMed]
- Alenazi, M.M.; Shafiq, M.; Alsadon, A.A.; Alhelal, I.M.; Alhamdan, A.M.; Solieman, T.H.I.; Ibrahim, A.A.; Shady, M.R.; Saad, M.A.O. Non-destructive assessment of flesh firmness and dietary antioxidants of greenhouse-grown tomato (Solanum lycopersicum L.) at different fruit maturity stages. Saudi J. Biol. Sci. 2020, 27, 2839–2846. [Google Scholar] [CrossRef] [PubMed]
- Tilahun, S.; Park, D.S.; Seo, M.H.; Hwang, I.G.; Kim, S.H.; Choi, H.R.; Jeong, C.S. Prediction of lycopene and β-carotene in tomatoes by portable chroma-meter and VIS/NIR spectra. Postharvest Biol. Technol. 2018, 136, 50–56. [Google Scholar] [CrossRef]
- Ding, X.; Guo, Y.; Ni, Y.; Kokot, S. A novel NIR spectroscopic method for rapid analyses of lycopene, total acid, sugar, phenols and antioxidant activity in dehydrated tomato samples. Vib. Spectrosc. 2016, 82, 1–9. [Google Scholar] [CrossRef]
- Viegas, T.R.; Mata, A.L.M.L.; Duarte, M.M.L.; Lima, K.M.G. Determination of quality attributes in wax jambu fruit using NIRS and PLS. Food Chem. 2016, 190, 1–4. [Google Scholar] [CrossRef] [Green Version]
- Rady, A.M.; Sugiharto, S.; Adedeji, A.A. Evaluation of carrot quality using visible near infrared spectroscopy and multivariate analysis. J. Food Res. 2018, 7, 80–93. [Google Scholar] [CrossRef]
- de Oliveira, I.R.N.; Roque, J.V.; Maia, M.P.; Stringheta, P.C.; Teófilo, R.F. New strategy for determination of anthocyanins, polyphenols and antioxidant capacity of Brassica oleracea liquid extract using infrared spectroscopies and multivariate regression. Spectrochim. Acta Part A Mol. Biomol. Spectrosc. 2018, 194, 172–180. [Google Scholar] [CrossRef]
- López-Maestresalas, A.; Pérez, C.; Tierno, R.; Arazuri, S.; De Galarreta, J.I.R.; Jarén, C. Prediction of main potato compounds by NIRS. Chem. Eng. Trans. 2017, 58, 385–390. [Google Scholar] [CrossRef]
- Tschannerl, J.; Ren, J.; Jack, F.; Krause, J.; Zhao, H.; Huang, W.; Marshall, S. Potential of UV and SWIR hyperspectral imaging for determination of levels of phenolic flavour compounds in peated barley malt. Food Chem. 2019, 270, 105–112. [Google Scholar] [CrossRef] [Green Version]
- Wiedemair, V.; Huck, C.W. Evaluation of the performance of three hand-held near-infrared spectrometer through investigation of total antioxidant capacity in gluten-free grains. Talanta 2018, 189, 233–240. [Google Scholar] [CrossRef] [PubMed]
- Carbas, B.; Machado, N.; Oppolzer, D.; Queiroz, M.; Brites, C.; Rosa, E.A.S.; Barros, A.I.R.N.A. Prediction of Phytochemical Composition, In Vitro Antioxidant Activity and Individual Phenolic Compounds of Common Beans Using MIR and NIR Spectroscopy. Food Bioprocess Technol. 2020, 13, 962–977. [Google Scholar] [CrossRef]
- Meenu, M.; Kamboj, U.; Sharma, A.; Guha, P.; Mishra, S. Green method for determination of phenolic compounds in mung bean (Vigna radiata L.) based on near-infrared spectroscopy and chemometrics. Int. J. Food Sci. Technol. 2016, 51, 2520–2527. [Google Scholar] [CrossRef]
- Macavilca, E.A.; Condezo-Hoyos, L. Assessment of total antioxidant capacity of altiplano colored quinoa (Chenopodium quinoa willd) by visible and near-infrared diffuse reflectance spectroscopy and chemometrics. LWT 2020, 134, 110182. [Google Scholar] [CrossRef]
- Amanah, H.Z.; Joshi, R.; Masithoh, R.E.; Choung, M.-G.; Kim, K.-H.; Kim, G.; Cho, B.-K. Nondestructive measurement of anthocyanin in intact soybean seed using Fourier Transform Near-Infrared (FT-NIR) and Fourier Transform Infrared (FT-IR) spectroscopy. Infrared Phys. Technol. 2020, 111, 103477. [Google Scholar] [CrossRef]
- Cayuela, J.A.; García, J.F. Nondestructive measurement of squalene in olive oil by near infrared spectroscopy. LWT 2018, 88, 103–108. [Google Scholar] [CrossRef] [Green Version]
- Cayuela, J.A.; García, J.F. Sorting olive oil based on alpha-tocopherol and total tocopherol content using near-infra-red spectroscopy (NIRS) analysis. J. Food Eng. 2017, 202, 79–88. [Google Scholar] [CrossRef] [Green Version]
- Mora-Ruiz, M.E.; Reboredo-Rodríguez, P.; Salvador, M.D.; González-Barreiro, C.; Cancho-Grande, B.; Simal-Gándara, J.; Fregapane, G. Assessment of polar phenolic compounds of virgin olive oil by NIR and mid-IR spectroscopy and their impact on quality. Eur. J. Lipid Sci. Technol. 2017, 119, 1600099. [Google Scholar] [CrossRef]
- Trapani, S.; Migliorini, M.; Cecchi, L.; Giovenzana, V.; Beghi, R.; Canuti, V.; Fia, G.; Zanoni, B. Feasibility of filter-based NIR spectroscopy for the routine measurement of olive oil fruit ripening indices. Eur. J. Lipid Sci. Technol. 2017, 119, 1600239. [Google Scholar] [CrossRef]
- Park, J.-R.; Kang, H.-H.; Cho, J.-K.; Moon, K.-D.; Kim, Y.-J. Feasibility of rapid piperine quantification in whole and black pepper using near infrared spectroscopy and chemometrics. J. Food Sci. 2020, 85, 3094–3101. [Google Scholar] [CrossRef]
- Wang, Y.-J.; Li, T.-H.; Li, L.-Q.; Ning, J.-M.; Zhang, Z.-Z. Evaluating taste-related attributes of black tea by micro-NIRS. J. Food Eng. 2021, 290, 110181. [Google Scholar] [CrossRef]
- Zareef, M.; Chen, Q.; Ouyang, Q.; Arslan, M.; Hassan, M.M.; Ahmad, W.; Viswadevarayalu, A.; Wang, P.; Ancheng, W. Rapid screening of phenolic compounds in congou black tea (Camellia sinensis) during in vitro fermentation process using portable spectral analytical system coupled chemometrics. J. Food Process. Preserv. 2019, 43, e13996. [Google Scholar] [CrossRef]
- Hernández-Hernández, C.; Fernández-Cabanás, V.M.; Rodríguez-Gutiérrez, G.; Bermúdez-Oria, A.; Morales-Sillero, A. Viability of near infrared spectroscopy for a rapid analysis of the bioactive compounds in intact cocoa bean husk. Food Control 2021, 120, 107526. [Google Scholar] [CrossRef]
- Sunoj, S.; Igathinathane, C.; Visvanathan, R. Nondestructive determination of cocoa bean quality using FT-NIR spectroscopy. Comput. Electron. Agric. 2016, 124, 234–242. [Google Scholar] [CrossRef]
- Nogales-Bueno, J.; Baca-Bocanegra, B.; Romero-Molina, L.; Martínez-López, A.; Rato, A.E.; Heredia, F.J.; Hernández-Hierro, J.M.; Escudero-Gilete, M.L.; González-Miret, M.L. Control of the extractable content of bioactive compounds in coffee beans by near infrared hyperspectral imaging. LWT 2020, 134, 110201. [Google Scholar] [CrossRef]
- Yan, H.; Li, P.-H.; Zhou, G.-S.; Wang, Y.-J.; Bao, B.-H.; Wu, Q.-N.; Huang, S.-L. Rapid and practical qualitative and quantitative evaluation of non-fumigated ginger and sulfur-fumigated ginger via Fourier-transform infrared spectroscopy and chemometric methods. Food Chem. 2021, 341, 128241. [Google Scholar] [CrossRef]
- Caramês, E.T.S.; Alamar, P.D.; Poppi, R.J.; Pallone, J.A.L. Quality control of cashew apple and guava nectar by near infrared spectroscopy. J. Food Compos. Anal. 2017, 56, 41–46. [Google Scholar] [CrossRef]
- Shan, J.; Wang, X.; Han, S.; Kondo, N. Application of Curve Fitting and Wavelength Selection Methods for Determination of Chlorogenic Acid Concentration in Coffee Aqueous Solution by Vis/NIR Spectroscopy. Food Anal. Methods 2017, 10, 999–1006. [Google Scholar] [CrossRef]
- Caramês, E.T.S.; Alamar, P.D.; Poppi, R.J.; Pallone, J.A.L. Rapid Assessment of Total Phenolic and Anthocyanin Contents in Grape Juice Using Infrared Spectroscopy and Multivariate Calibration. Food Anal. Methods 2017, 10, 1609–1615. [Google Scholar] [CrossRef]
- Santana, M.C.D.; Ferreira, M.M.C.; Pallone, J.A.L. Control of ascorbic acid in fortified powdered soft drinks using near-infrared spectroscopy (NIRS) and multivariate analysis. J. Food Sci. Technol. 2020, 57, 1233–1241. [Google Scholar] [CrossRef]
- Tahir, H.E.; Xiaobo, Z.; Tinting, S.; Jiyong, S.; Mariod, A.A. Near-Infrared (NIR) Spectroscopy for Rapid Measurement of Antioxidant Properties and Discrimination of Sudanese Honeys from Different Botanical Origin. Food Anal. Methods 2016, 9, 2631–2641. [Google Scholar] [CrossRef]
- Betances-Salcedo, E.; Revilla, I.; Vivar-Quintana, A.M.; González-Martín, M.I. Flavonoid and Antioxidant Capacity of Propolis Prediction Using Near Infrared Spectroscopy. Sensors 2017, 17, 1647. [Google Scholar] [CrossRef] [PubMed] [Green Version]
- Kokalj Ladan, M.; Straus, J.; Tavčar Benković, E.; Kreft, S. FT-IR-based method for rutin, quercetin and quercitrin quantification in different buckwheat (Fagopyrum) species. Sci. Rep. 2017, 7, 7226. [Google Scholar] [CrossRef] [PubMed] [Green Version]
- Uncu, O.; Ozen, B.; Tokatli, F. Use of FTIR and UV–visible spectroscopy in determination of chemical characteristics of olive oils. Talanta 2019, 201, 65–73. [Google Scholar] [CrossRef] [PubMed]
- Hirri, A.; Bassbasi, M.; Souhassou, S.; Kzaiber, F.; Oussama, A. Prediction of Polyphenol Fraction in Virgin Olive Oil Using Mid-Infrared Attenuated Total Reflectance Attenuated Total Reflectance Accessory–Mid-Infrared Coupled with Partial Least Squares Regression. Int. J. Food Prop. 2016, 19, 1504–1512. [Google Scholar] [CrossRef]
- Carvalho, D.G.; Ranzan, L.; Trierweiler, L.F.; Trierweiler, J.O. Determination of the concentration of total phenolic compounds in aged cachaça using two-dimensional fluorescence and mid-infrared spectroscopy. Food Chem. 2020, 329, 127142. [Google Scholar] [CrossRef]
- Ristic, R.; Cozzolino, D.; Jeffery, D.W.; Gambetta, J.M.; Bastian, S.E.P. Prediction of Phenolic Composition of Shiraz Wines Using Attenuated Total Reflectance Mid-Infrared (ATR-MIR) Spectroscopy. Am. J. Enol. Vitic. 2016, 67, 460–465. [Google Scholar] [CrossRef]
- Canal, C.; Ozen, B. Monitoring of Wine Process and Prediction of Its Parameters with Mid-Infrared Spectroscopy. J. Food Process Eng. 2017, 40, e12280. [Google Scholar] [CrossRef] [Green Version]
- Sen, I.; Ozturk, B.; Tokatli, F.; Ozen, B. Combination of visible and mid-infrared spectra for the prediction of chemical parameters of wines. Talanta 2016, 161, 130–137. [Google Scholar] [CrossRef] [Green Version]
- Tahir, H.E.; Xiaobo, Z.; Zhihua, L.; Jiyong, S.; Zhai, X.; Wang, S.; Mariod, A.A. Rapid prediction of phenolic compounds and antioxidant activity of Sudanese honey using Raman and Fourier transform infrared (FT-IR) spectroscopy. Food Chem. 2017, 226, 202–211. [Google Scholar] [CrossRef]
- Beć, K.B.; Grabska, J.; Huck, C.W. NIR spectroscopy of natural medicines supported by novel instrumentation and methods for data analysis and interpretation. J. Pharm. Biomed. Anal. 2021, 193, 113686. [Google Scholar] [CrossRef] [PubMed]
- Anderson, N.T.; Walsh, K.B.; Flynn, J.R.; Walsh, J.P. Achieving robustness across season, location and cultivar for a NIRS model for intact mango fruit dry matter content. II. Local PLS and nonlinear models. Postharvest Biol. Technol. 2021, 171, 111358. [Google Scholar] [CrossRef]
- Johnson, J.B.; Broszczak, D.A.; Mani, J.S.; Anesi, J.; Naiker, M. A cut above the rest: Oxidative stress in chronic wounds and the potential role of polyphenols as therapeutics. J. Pharm. Pharmacol. 2022, 74, 485–502. [Google Scholar] [CrossRef]
- Rasouli, H.; Farzaei, M.H.; Khodarahmi, R. Polyphenols and their benefits: A review. Int. J. Food Prop. 2017, 20, 1700–1741. [Google Scholar] [CrossRef] [Green Version]
- Alves-Santos, A.M.; Sugizaki, C.S.A.; Lima, G.C.; Naves, M.M.V. Prebiotic effect of dietary polyphenols: A systematic review. J. Funct. Foods 2020, 74, 104169. [Google Scholar] [CrossRef]
- Koch, W. Dietary Polyphenols—Important Non-Nutrients in the Prevention of Chronic Noncommunicable Diseases. A Systematic Review. Nutrients 2019, 11, 1039. [Google Scholar] [CrossRef] [PubMed] [Green Version]
- Cassidy, L.; Fernandez, F.; Johnson, J.B.; Naiker, M.; Owoola, A.G.; Broszczak, D.A. Oxidative Stress in Alzheimer’s Disease: A Review on Emergent Natural Polyphenolic Therapeutics. Complement. Ther. Med. 2020, 49, 102294. [Google Scholar] [CrossRef]
- Rasines-Perea, Z.; Teissedre, P.-L. Grape Polyphenols’ Effects in Human Cardiovascular Diseases and Diabetes. Molecules 2017, 22, 68. [Google Scholar] [CrossRef]
- Arbeláez, L.F.G.; Pardo, A.C.; Fantinelli, J.C.; Schinella, G.R.; Mosca, S.M.; Ríos, J.-L. Cardioprotection and natural polyphenols: An update of clinical and experimental studies. Food Funct. 2018, 9, 6129–6145. [Google Scholar] [CrossRef]
- Costa, C.; Tsatsakis, A.; Mamoulakis, C.; Teodoro, M.; Briguglio, G.; Caruso, E.; Tsoukalas, D.; Margina, D.; Dardiotis, E.; Kouretas, D.; et al. Current evidence on the effect of dietary polyphenols intake on chronic diseases. Food Chem. Toxicol. 2017, 110, 286–299. [Google Scholar] [CrossRef]
- Sanches-Silva, A.; Testai, L.; Nabavi, S.F.; Battino, M.; Devi, K.P.; Tejada, S.; Sureda, A.; Xu, S.; Yousefi, B.; Majidinia, M.; et al. Therapeutic potential of polyphenols in cardiovascular diseases: Regulation of mTOR signaling pathway. Pharmacol. Res. 2020, 152, 104626. [Google Scholar] [CrossRef] [PubMed]
- Ed Nignpense, B.; Chinkwo, K.A.; Blanchard, C.L.; Santhakumar, A.B. Polyphenols: Modulators of Platelet Function and Platelet Microparticle Generation? Int. J. Mol. Sci. 2020, 21, 146. [Google Scholar] [CrossRef] [PubMed] [Green Version]
- Ferrer-Gallego, R.; Rodríguez-Pulido, F.J.; Toci, A.T.; García-Estevez, I. Phenolic Composition, Quality and Authenticity of Grapes and Wines by Vibrational Spectroscopy. Food Rev. Int. 2020, 38, 884–912. [Google Scholar] [CrossRef]
- Martín-Tornero, E.; de Jorge Páscoa, R.N.M.; Espinosa-Mansilla, A.; Martín-Merás, I.D.; Lopes, J.A. Comparative quantification of chlorophyll and polyphenol levels in grapevine leaves sampled from different geographical locations. Sci. Rep. 2020, 10, 6246. [Google Scholar] [CrossRef] [PubMed] [Green Version]
- Lu, Y.; Saeys, W.; Kim, M.; Peng, Y.; Lu, R. Hyperspectral imaging technology for quality and safety evaluation of horticultural products: A review and celebration of the past 20-year progress. Postharvest Biol. Technol. 2020, 170, 111318. [Google Scholar] [CrossRef]
- Caporaso, N.; ElMasry, G.; Gou, P. Chapter 13—Hyperspectral imaging techniques for noncontact sensing of food quality. In Innovative Food Analysis; Galanakis, C.M., Ed.; Academic Press: Cambridge, MA, USA, 2021; pp. 345–379. [Google Scholar]
- Wang, B.; Sun, J.; Xia, L.; Liu, J.; Wang, Z.; Li, P.; Guo, Y.; Sun, X. The Applications of Hyperspectral Imaging Technology for Agricultural Products Quality Analysis: A Review. Food Rev. Int. 2021, 37, 1–20. [Google Scholar] [CrossRef]
- Khan, A.; Munir, M.T.; Yu, W.; Young, B.R. A Review Towards Hyperspectral Imaging for Real-Time Quality Control of Food Products with an Illustrative Case Study of Milk Powder Production. Food Bioprocess Technol. 2020, 13, 739–752. [Google Scholar] [CrossRef]
- Temiz, H.T.; Ulaş, B. A Review of Recent Studies Employing Hyperspectral Imaging for the Determination of Food Adulteration. Photochem 2021, 1, 125–146. [Google Scholar] [CrossRef]
- Feng, L.; Wu, B.; Zhu, S.; He, Y.; Zhang, C. Application of Visible/Infrared Spectroscopy and Hyperspectral Imaging with Machine Learning Techniques for Identifying Food Varieties and Geographical Origins. Front. Nutr. 2021, 8, 680357. [Google Scholar] [CrossRef]
- Kiani, S.; van Ruth, S.M.; Minaei, S.; Ghasemi-Varnamkhasti, M. Hyperspectral imaging, a non-destructive technique in medicinal and aromatic plant products industry: Current status and potential future applications. Comput. Electron. Agric. 2018, 152, 9–18. [Google Scholar] [CrossRef]
- Torres, I.; Sánchez, M.-T.; Garrido-Varo, A.; Pérez-Marín, D. New Generation NIRS Sensors for Quality and Safety Assurance in Summer Squashes along the Food Supply Chain; SPIE: Bellingham, WA, USA, 2020; Volume 11421. [Google Scholar]
- Agbonkonkon, N.; Wojciechowski, G.; Abbott, D.A.; Gaucher, S.P.; Yim, D.R.; Thompson, A.W.; Leavell, M.D. Faster, reduced cost calibration method development methods for the analysis of fermentation product using near-infrared spectroscopy (NIRS). J. Ind. Microbiol. Biotechnol. 2021, 48, kuab033. [Google Scholar] [CrossRef] [PubMed]


| Food Matrix | Analyte(s) | Sample Size (cal/val) | Wavelength Range (nm) | Optical Geometry | Statistical Method | Test Set | Cross-Validation | R2CV | RMSECV | Notes | Reference |
|---|---|---|---|---|---|---|---|---|---|---|---|
| Fruit | |||||||||||
| Açaí and juçara | Total anthocyanin content | Variable (n = 374 total) | 1606–1793 | Reflectance | PLS | Independent populations R2p = 0.74–0.88; RMSEP = 5.09–6.76 g/kg | LOO | 0.89–0.91 | 2.50–2.91 (g/kg) | Fruit from two seasons and four localities | [98] |
| Bilberry (dried powder) | Anthocyanins | 38/27 | 1064–1640, 1833–2354 | Reflectance | PLS | Dependent test set (randomly selected samples) | LOO | 0.995 | 0.28 (% w/w) | NIR analysis could identify counterfeit bilberry samples | [99] |
| Blackberry | Total phenolics Total carotenoids | 90/30 | 400–2500 | Reflectance | PLS | None | n/s | 0.69 0.76 | 1.69 0.95 (mg/g) | [100] | |
| Grapes (red) | Trans-resveratrol Quercetin Total phenols | 15 | 900–1700 | Reflectance | PLS | None | LOO | 0.988 0.955 0.974 | 0.424 mg/kg 0.008 mg/kg 12.15 mmol/kg | Three locations; two seasons | [101] |
| Grapes (red and white) | Total phenolics | 203/67 | 400–1100 900–2500 | Reflectance | PLS, SVM | Dependent test population | n/s | 0.872–0.914 0.697–0.726 | 0.15–0.22 0.28–0.31 (mg/g) | Two cultivars from one season and location; SVM gave better results than PLS | [102] |
| Grapes (red) | Total anthocyanins Total 3-O-glucoside anthocyanins Total 3-O-(6-acetyl)glucoside anthocyanins Total 3-O-(6-p-coumaroyl)glucoside anthocyanins Malvidin 3-O-glucoside Malvidin 3-O-(6-acetyl)glucoside Malvidin 3-O-(6-p-coumaroyl)glucoside Petunidin 3-O-glucoside Petunidin 3-O-(6-acetyl)glucoside Petunidin 3-O-(6-p-coumaroyl)glucoside Delphinidin 3-O-glucoside Delphinidin 3-O-(6-acetyl)glucoside Delphinidin 3-O-(6-p-coumaroyl) glucoside Peonidin 3-O-glucoside Peonidin 3-O-(6-acetyl)glucoside Peonidin 3-O-(6-p-coumaroyl)glucoside Cyanidin 3-O-glucoside Cyanidin 3-O-(6-acetyl)glucoside Cyanidin 3-O-(6-p-coumaroyl)glucoside | 60/20 | 380–1028 | Reflectance (hyperspectral imaging) | MPLS | Dependent test set (stratified samples) | Six-fold cross-validation | 0.91 0.92 0.90 0.83 0.87 0.90 0.80 0.93 0.57 0.91 0.91 0.92 0.88 0.80 0.75 0.88 0.77 0.86 | 189.05 155.94 4.12 23.09 73.93 4.13 13.32 29.44 0.98 2.04 48.41 3.28 30.35 0.31 3.81 16.43 0.16 1.78 (mg/L) | Eight different cultivars from two sites | [103] |
| Grapes (red) | Nonacylated anthocyanins Total anthocyanins | 47/- | 950–1650 | Reflectance (hyperspectral imaging of single grapes) | PLS | Dependent test population | LOO | 0.72 0.72 | 0.78 0.70 (mg/grape) | Fruit from two dates and two vineyards within one season | [104] |
| Grape pomace (marc) | Catechin Epicatechin Proanthocyanidin B1 Proanthocyanidin B2 Proanthocyanidin B3 Proanthocyanidin B4 Proanthocyanidin trimer 1 Proanthocyanidin trimer 2 Proanthocyanidin tetramer 1 Proanthocyanidin tetramer 2 Proanthcyanidin B2-3-O-gallate Galloyl proanthocyanidin Total flavanols Gallic acid Protocatechuic acid Caffeic acid Caftaric acid Cis-coutaric acid Trans-coutaric acid Total phenolic acids Quercetin 3-O-rutinoside Quercetin 3-O-glucuronide Quercetin 3-O-glucoside Quercetin pentoside Kaempferol 3-O-galactoside Kaempferol 3-O-glucuronide Kaempferol 3-O-glucoside Quercetin Kaempferol Total flavonols | 12/- | 950–1650 | Reflectance (hyperspectral imaging) | PLS | None | LOO | 0.80 0.96 0.65 0.75 0.50 0.63 0.65 0.86 0.65 0.53 0.89 0.58 0.78 0.75 0.82 0.92 0.91 0.83 0.95 0.87 0.63 0.81 0.64 0.15 0.98 0.93 0.98 0.72 0.97 0.70 | 14.00 4.72 20.53 1.86 3.43 3.01 3.12 7.68 11.62 2.66 6.29 7.27 66.63 5.58 2.70 0.36 2.56 0.15 0.19 9.61 1.82 4.36 5.95 0.04 0.11 0.07 0.41 0.19 0.02 14.27 (mg/100 g) | Fruit from one variety, season and location | [105] |
| Grape skins (red) | Total iron-reactive phenolics Anthocyanins Tannins | 40/20 | 977–1625 | Reflectance (hyperspectral imaging) | PCR, PLS, SVR | Dependent test set | Segment validation | 0.907 0.879 0.896 | 0.178 0.144 0.107 (mg/L) | Five cultivars from four dates in one growing season | [106] |
| Grape seeds (red) | Total iron-reactive phenolics Tannins | 40/20 | 977–1625 | Reflectance (hyperspectral imaging) | PCR, PLS, SVR | Dependent test set | Segment validation | 0.879 0.924 | 0.240 0.519 (mg/L) | Five cultivars from four dates in one growing season | [106] |
| Guava (frozen pulp) | Ascorbic acid | 50 | 1000–1892, 2007–2227 | Transflectance | PLS | Dependent test set (randomly selected samples) | LOO | 0.85 | 6.14 mg/100 g (test set) | Samples from two Brazilian marketplaces | [107] |
| Jujube | Gallic acid Caffeic acid L-epicatechin Phloridzin Cianidanol | 52/26 | 900–1700 | Transmittance | Si-ACO-PLS | Dependent test population | n/s | 0.879 0.887 0.906 0.858 0.836 | 3.06 6.04 16.30 0.84 16.01 (µg/g) | Samples from five regions | [108] |
| Kakadu plum (powder) | Ascorbic acid | 80/5 | 866–2532 | Diffuse reflectance | PLS | Independent (commercially sourced samples) R2p = 0.73; RMSEP = 4733 mg/100 g | n/s | 0.93 | 1839 mg/100 g | [109] | |
| Marsh grapefruit | β-Carotene Total carotenoids | 240 | 850–2500 400–850 | Reflectance | PLS | Independent (samples from a separate orchard) | Test set validation | 0.99 0.92 (test set) | 0.00 2.69 (µg/g) (test set) | Fruit from one season and two locations | [13] |
| Raspberries | Total phenols Total anthocyanins TAC (FRAP) | 168 | 950–1650 | Reflectance (hyperspectral imaging) | PLS | None | n/s | 0.70 0.63 0.61 | 127 12 39 (mg/100 g) | [110] | |
| Tomato | Total phenolics Lycopene Total flavonoid β-Carotene | 50 | 285–1200 | Reflectance | PLS | None | LOO? | 0.834 0.864 0.790 0.708 | 1.80 1.03 1.82 1.14 (µg/g) | [111] | |
| Tomato | Lycopene β-Carotene | 180/60 | 500–1100 | Transmittance | PLS | Semi-independent (separate harvest in same season) R2p = 0.85, 0.77; RMSEP = 1.79, 1.00 mg/kg | LOO | 0.89 0.88 | 1.56 0.63 (mg/kg) | [112] | |
| Tomato (dehydrated and ground) | Lycopene Phenols TAC (DPPH) TAC (FRAP) TAC (ABTS) | 61/31 | 800–2500 | Reflectance | PLS, RBF-NN | Dependent test set | n/s | 0.882 0.910 0.882 0.876 0.937 | 1.61 80 0.70 0.97 0.86 (mg/100 g) | RBF-NN generally performed better than PLS regression | [113] |
| Wax jambu | Total phenolics Total anthocyanins | 50/35 | 1000–2400 | Diffuse reflectance | PLS | Dependent test set (Kennard-Stone selection) | n/s | 0.94 0.98 | 22.18 9.0 (mg/100 g) | [114] | |
| Vegetables | |||||||||||
| Carrot | Ascorbic acid β-Carotene | 24/6? | 420–1100 | Reflectance | PLS | Dependent test set | Four-fold cross-validation | 0.98 0.98 | 0.04 µg/g 0.10 µg/100 g | Roots sampled over an 8-week storage period | [115] |
| Red cabbage (EtOH extract) | Total anthocyanins Monomeric anthocyanins Total polyphenols | 1 (with 33 serial dilutions) | 1000–2500 | Transmittance | PLS | 9 dilutions prepared from new cabbage extract | Segment validation | 0.98 0.98 0.96 | 16.4 mg/L 20.2 mg/L 42.7 mg/L | [116] | |
| Potato | Total phenolics Antioxidant capacity (DPPH) | 160/68 | 1100–2300 | Reflectance | PLS | Dependent test set | Venetian blind cross-validation | 0.84 0.67 | 1.20 1.21 (mg/g) | Included white, red, yellow and purple-fleshed cultivars | [117] |
| Grains/pulses | |||||||||||
| Barley malt | Total phenolics | 10 | 1000–2500 | Reflectance (hyperspectral imaging) | SVM, SVR | Dependent test set (5% of total pixels) | n/s | 0.85 | 1 ppm | [118] | |
| Buckwheat, oat, millet | Total phenolics | 77 | 1596–2396 1128–2162 740–1070 | Reflectance | PLS | Test set used but no information provided on its origins or size | LOO (for most models) | 0.921 0.951 0.823 | 1.46 1.11 1.98 (mg/g) | Compared three handheld instruments (microPhazir RX, MicroNIR 2200, SCiO) | [119] |
| Common bean (flour) | Total phenols Ortho-diphenols Flavonoids Gallic acid Catechin Myricetin-3-glucoside Quercetin-3-6″-manolyl-glucoside Kaempferol-3-glucoside Kaempferol-3-6″-manolyl-glucoside Kaempferol | 42/- | 1000–2500 | Reflectance | PLS | Spectra randomly selected from dataset (1/3 of total spectra) | LOO | 0.91 0.85 0.90 0.96 0.48 0.97 0.90 0.85 0.93 0.87 | RPDs: 5.20 4.84 5.18 10.25 2.38 10.25 7.52 6.27 9.32 6.51 | 21 varieties; two seasons | [120] |
| Mungbean | Catechin Chlorogenic acid Caffeic acid p-coumaric acid t-ferulic acid Vitexin Isovitexin Myricetin Quercetin Kaempferol | 42/18 | 1600–2500 | Reflectance (from whole grains) | PLS | Dependent test set | Segment validation | 0.996 0.998 0.992 0.989 0.998 0.997 0.997 0.994 0.989 0.998 | 0.603 0.590 1.78 1.8 0.519 0.238 0.23 1.82 1.67 0.5 (%) | [121] | |
| Quinoa (whole seed) | Total free phenolics Total betalains TAC (DPPH) | 38/- | 400–2500 | Reflectance | PLS | None | Segment validation | n/s n/s 0.73 | n/s n/s 8.6 (mmol/kg) | For TAC in ground seed; R2CV = 0.66; RMSECV = 9.6 mmol/kg | [122] |
| Soybean | Total anthocyanins Cyanidin-3-glucoside Delphinidin-3-glucoside | 70 | 1000–2500 | Reflectance | PLS | Subset of spectra of samples included in calibration set | n/s | 0.88 0.90 0.88 | 0.13 0.12 0.03 (mg/g) | [123] | |
| Oils | |||||||||||
| Olive oil | Squalene | 118/59 | 1100–2300 | Transmittance | PLS | Dependent test set | LOO? | 0.83 | 2.31 (g/kg) (pred) | Poorer results obtained using Vis–NIRS data | [124] |
| Olive oil | Total tocopherols α-Tocopherol β-Tocopherol γ-Tocopherol | 197/91 189/93 197/102 195/101 | 350–2500 | Transmittance, transflectance | PLS | Dependent test set | LOO? | 0.89 0.92 0.54 0.85 | 43.83 33.90 0.59 4.54 (mg/kg) (SEC) | Vis–NIRS gave slightly better results than NIRS in most cases | [125] |
| Olive oil | Tyrosol Tyrosol secoiridoids Hydroxytyrosol Hydroxytyrosol secoiridoids Total phenolics | 75/18 | 800–2500 | Transmittance | PLS | None | LOO | 0.55 0.84 0.55 0.82 0.82 | 5.27 41.5 4.84 43.1 76.7 (mg/kg) | [126] | |
| Olives (as paste) | Total phenolics Oleuropein | 291/53 147/53 | 1400–2400 | Reflectance | PLS | Dependent test set | LOO? | 0.71 0.73 (cal) | 0.08 6.6 (mg/kg) | Samples obtained across seven seasons | [127] |
| Aromatic plants | |||||||||||
| Black pepper (whole) | Piperine | 132/- | 950–1650 | Reflectance | PLS | None | Segment validation | 0.726 | 0.289g/100 g | For ground samples; R2CV = 0.850, RMSECV = 0.231g/100 g | [128] |
| Black tea | Caffeine Epigallocatechin gallate | 37/19 | 950–1650 | Reflectance | PLS, MLR | Dependent test set | LOO? | 0.933 0.782 | 3.65 3.32 (mg/g) | [129] | |
| Black tea | Cianidanol Ferulic acid Gallic acid Rutin Phloridzin L-epicatechin | 84/56 (20 replicate samples at seven time points) | 899–1724 | Transmittance | CARS-PLS | Dependent test set | n/s | 0.956 0.928 0.911 0.825 0.881 0.969 | 9.66 0.21 4.22 0.77 6.85 20.1 (mg/100 g) | 20 tea samples collected at seven time points during fermentation process | [130] |
| Cocoa bean | Total phenols Catechin Epicatechin Epigallocatechin Theobromine | 74/- 76/- 75/- 72/- 75/- | 400–2498 | Reflectance | PLS | None | LOO? | 0.71 0.62 0.04 0.02 0.77 | 6.09 0.65 5.24 0.09 4.55 (mg/g) | [131] | |
| Cocoa bean | Total polyphenols | 72 | 800–2778 | Diffuse reflectance | PLS | None | LOO | 0.84 | 0.93 (mg/g) | Sample variation induced by different periods of storage and fermentation | [132] |
| Cocoa bean husk | Total phenols Catechin Epicatechin Epigallocatechin Theobromine | 77/- 80/- 79/- 78/- 78/- | 400–2498 | Reflectance | PLS | None | LOO? | 0.81 0.74 0.06 0.20 0.83 | 4.75 0.55 5.31 0.10 3.72 (mg/g) | [131] | |
| Coffee bean | Chlorogenic acid Total phenolics | 101/36 | 950–1650 | Reflectance (hyperspectral imaging) | MPLS | Dependent test set | n/s | 0.81 0.58 (cal) | 0.91 4.63 (mg/g) SEP = 15.6 and 17.6% | [133] | |
| Ginger | Zingerone 6-Gingerol 8-Gingerol 10-Gingerol 6-Shogaol | 58/22 | 1389–2500 | Reflectance | PLS | Dependent test set | LOO | 0.981 0.986 0.988 0.997 0.998 (cal) | 0.076 0.072 0.078 0.077 0.084 (mg/g) | [134] | |
| Beverages | |||||||||||
| Cashew apple nectar | Ascorbic acid | 49/16 | 1000–1903, 1971–2227 | Transflectance | PLS | Dependent test set (randomly selected samples) | n/s | 0.84 (cal) | 4.8 mg/100 g (test set) | Samples from two Brazilian marketplaces | [135] |
| Coffee aqueous solution | Chlorogenic acid | 86 | 401–1871 | Transmittance (1 mm path length) | PLS | None | LOO | 0.556 | 0.76 mg/mL | Key predictor wavelength was around 1450 nm (C-H vibration; second overtone) | [136] |
| Grape juice | Total phenolics Anthocyanins | 49/16 | 1000–2500 | Transflectance | PLS | Dependent test set (randomly selected samples) | Optimising no. of latent variables | 0.96 0.84 (cal) | 37 4.44 (mg/100 mL) (test set) | Slightly worse results for phenolic content compared to MIR | [137] |
| Guava nectar | Ascorbic acid | 41/13 | 1000–1899, 1983–2227 | Transflectance | PLS | Dependent test set (randomly selected samples) | n/s (LOO?) | 0.86 (cal) | 7.44 mg/100 g (test set) | Samples from two Brazilian marketplaces | [135] |
| Soft drink (grape and passionfruit) | Ascorbic acid | ~47/20 | 1000–2500 | Reflectance | PLS | Test set of 5 samples created by diluting one sample to specific concentrations | LOO | 0.70 0.76 | 0.67 0.56 mg/g | [138] | |
| Wine (red) | Trans-resveratrol Quercetin Total phenols | 20 | 900–1700 | Transmittance | PLS | None | LOO | 0.994 0.990 0.996 | 0.113 mg/L 0.073 mg/L 0.144 mM | Three locations; two seasons | [101] |
| Wine (red) | Gallic acid Catechin B1 (flavonol dimer) Polymeric phenols Caftaric acid Caffeic acid Coutaric acid p-coumaric acid Quercetin-3-glucoside Quercetin Kaempherol Delphinidin-3-glucoside Cyanidin-3-glucoside Petunidin-3-glucoside Peonidin-3-glucoside Malvidin-3-glucoside Delphinidin-3-acetylglucoside Cyanidin-3-acetylglucoside Petunidin-3-acetylglucoside Peonidin-3-acetylglucoside Malvidin-3-acetylglucoside Delphinidin-3-cumarylglucoside Petunidin-3-cumarylglucoside Peonidin-3-cumarylglucoside Malvidin-3-cumarylglucoside Polymeric pigments MCP tannins Anthocyanins | ~387/182 | 800–2500 | Transmittance | PLS using PRESS | Dependent test set | Segment validation | 0.86 0.83 0.76 0.88 0.86 0.87 0.84 0.87 0.88 0.84 0.85 0.92 0.86 0.9 0.85 0.87 0.88 0.91 0.92 0.91 0.85 0.86 0.85 0.86 0.84 0.86 0.92 0.87 | 3.01 5.85 4.94 135 8.8 0.82 2.63 0.61 10.3 1.65 0.15 2.32 0.05 2.16 1.73 16.5 0.65 0.34 0.89 0.65 7.15 0.19 0.57 0.84 4.27 5.71 204 53.1 (mg/L) | Wines comprised four cultivars from 13 vinifications over two seasons; more accurate at predicting phenolic content than ATR-MIR or transmission FT-IR. | [92] |
| Other foods | |||||||||||
| Honey | Phenolics Flavonoids Carotenoids Antioxidants (FRAP) | 105/45 | 1000–2500 | Reflectance | PLS | Dependent test set (randomly selected samples) | Segment validation | 0.884 0.903 0.922 0.922 | 14.5 1.01 0.035 0.43 (mg/100 g) | Six different floral varieties of honey | [139] |
| Propolis | Flavones and flavonols Flavanones and dihydroflavonols Antioxidant capacity (ABTS) | 70/29 | 1100–2000 | Reflectance (fibre-optic) on ground sample | MPLS | Dependent test set (randomly selected samples) | Segment validation | 0.63 0.68 0.87 (cal) | 29.4 9.5 112 (mg/g) | Samples sourced from Chile and Spain | [140] |
| Food Matrix | Analyte(s) | Sample Size (cal/val) | Wavelength Range (nm) | Optical Geometry/Presentation | Statistical Method | Test Set | Cross-Validation | R2CV | RMSECV | Notes | Reference |
|---|---|---|---|---|---|---|---|---|---|---|---|
| Fruit | |||||||||||
| Kakadu plum (powder) | Ascorbic acid | 80/5 | 4000–400 | ATR | PLS | Independent (commercially sourced samples) R2p = 0.65; RMSEP = 2367 mg/100 g | n/s | 0.91 | 1811 mg/100 g | [109] | |
| Vegetables | |||||||||||
| Red cabbage (EtOH extract) | Total anthocyanins Monomeric anthocyanins Total polyphenols | 1 (with 33 serial dilutions) | 4000–650 | ATR | PLS | 9 dilutions prepared from new cabbage extract | Segment validation | 0.98 0.98 0.96 | 18.1 mg/L 21.3 mg/L 44.4 mg/L | [116] | |
| Grains/pulses | |||||||||||
| Buckwheat (leaves and flowers) | Rutin Quercetin Quercitrin Sum of flavonoids | Not stated (total = 108) | 4000–500 | ATR (whole and ground dried samples) | PLS | Dependent test set | LOO | 0.99 0.99 0.95 0.98 | 3.63 0.06 2.48 4.80 (mg/g) | Used seven different species of buckwheat | [141] |
| Common bean (flour) | Total phenols Ortho-diphenols Flavonoids Gallic acid Catechin Quercetin-3-glucoside Quercetin-3-6″-manolyl-glucoside Kaempferol-3-glucoside Myricetin Kaempferol-3-6″-manolyl-glucoside Kaempferol | 42/- | 4000–400 | ATR (flour) | PLS | Spectra randomly selected from dataset (1/3 of total spectra) | LOO | 0.86 0.31 0.86 0.94 0.89 0.43 0.73 0.38 0.35 0.39 0.84 | RPDs: 4.36 1.54 4.30 10.12 9.47 1.91 4.25 1.23 1.81 1.79 7.03 | [120] | |
| Soybean | Total anthocyanins Cyanidin-3-glucoside Delphinidin-3-glucoside | 70/- | 4000–650 | ATR (whole seeds) | PLS | Spectra of samples included in calibration set | n/s | 0.86 0.88 0.87 | 0.15 0.13 0.03 (mg/g) | 70 different varieties | [123] |
| Oils | |||||||||||
| Olive oil | Fatty acid methyl esters Fatty acid ethyl esters Fatty acid alkyl esters Diacylglycerols: C34 1,2 C34 1,3 C36 1,2 C36 1,3 Pheophytin a Chlorophyll a Pheophytin b Total xanthophyll Lutein Chlorophyll b | 59/30 | 4000–650 | ATR | PLS | Dependent test set | LOO? | 0.87 0.85 0.87 0.62 0.83 0.79 0.77 0.72 0.75 0.71 0.61 0.75 0.72 | 41.63 27.43 60.10 (mg/kg) 1.07 1.26 4.29 4.02 (mg/kg) 2.42 0.32 0.10 0.41 0.71 0.21 (mg/kg) | Samples from two seasons; quite poor test set validation results for colour pigments; improved results from fusion of UV–Vis and IR spectra | [142] |
| Olive oil | Tyrosol Tyrosol secoiridoids Hydroxytyrosol Hydroxytyrosol secoiridoids Total phenolics | 75/18 | 4000–400 | ATR | PLS | None | LOO | 0.32 0.30 0.17 0.19 0.44 | 4.98 105.7 9.96 106.1 162.1 (mg/kg) | [126] | |
| Olive oil | Total phenolics | 70/30 | 4000–600 | ATR | PLS | Dependent test set | n/s | 0.998 | 0.072 g/L | [143] | |
| Beverages | |||||||||||
| Cachaça | Total phenolics | 32/16 | 4000–650 | ATR (liquid sample) | PLS | Ranked subset of samples (60% cal; 20% val; 20% test set) | n/s | 0.820 | 248 mg/L Much poorer results than fluorescence spectroscopy | For test set validation; R2p = 0.690 and RMSEP = 318 mg/L | [144] |
| Grape juice | Total phenolics Anthocyanins | 49/16 | 4000–400 | ATR | PLS | Dependent test set (randomly selected samples) | Optimising no. of latent variables | 0.90 0.81 (cal) | 21 4.22 mg/100 mL (test set) | Performed better than NIR for phenolic content | [137] |
| Shiraz wine | Total anthocyanins Total phenolics | 70/30 | 1700–950 | ATR (liquid sample) | PLS | Dependent test set | LOO | 0.61 0.60 | 32 mg/L 5.7 au | Wines from 24 different Australian locations | [145] |
| Wine (red) | Gallic acid Catechin B1 Polymeric phenols Caftaric acid Caffeic acid Coutaric acid p-Coumaric acid Quercetin-3-glucoside Quercetin Kaempherol Delphinidin-3-glucoside Cyanidin-3-glucoside Petunidin-3-glucoside Peonidin-3-glucoside Malvidin-3-glucoside Delphinidin-3-acetylglucoside Cyanidin-3-acetylglucoside Petunidin-3-acetylglucoside Peonidin-3-acetylglucoside Malvidin-3-acetylglucoside Delphinidin-3-cumarylglucoside Petunidin-3-cumarylglucoside Peonidin-3-cumarylglucoside Malvidin-3-cumarylglucoside Polymeric pigments MCP tannins Anthocyanins | ~387/182 | 4000–600 | ATR (liquid sample) | PLS using PRESS | Dependent test set | Segment validation | 0.83 0.78 0.8 0.85 0.85 0.86 0.85 0.81 0.85 0.69 0.82 0.88 0.76 0.86 0.84 0.85 0.86 0.85 0.88 0.89 0.89 0.85 0.85 0.85 0.85 0.85 0.89 0.86 | 3.42 7.26 4.99 128 9.76 1.07 3.14 0.63 13 2.56 0.34 2.96 0.06 2.57 1.47 20.7 1.44 0.48 1.19 1.03 6.49 0.41 0.79 0.91 3.98 5.5 261 47.2 (mg/L) | Wines comprised four cultivars from 13 vinifications over two seasons; slightly less accurate at phenolic content compared to FT-NIR | [92] |
| Wine (red) | Gallic acid Catechin B1 Polymeric phenols Caftaric acid Caffeic acid Coutaric acid p-coumaric acid Quercetin-3-glucoside Quercetin Kaempherol Delphinidin-3-glucoside Cyanidin-3-glucoside Petunidin-3-glucoside Peonidin-3-glucoside Malvidin-3-glucoside Delphinidin-3-acetylglucoside Cyanidin-3-acetylglucoside Petunidin-3-acetylglucoside Peonidin-3-acetylglucoside Malvidin-3-acetylglucoside Delphinidin-3-cumarylglucoside Petunidin-3-cumarylglucoside Peonidin-3-cumarylglucoside Malvidin-3-cumarylglucoside Polymeric pigments MCP tannins Anthocyanins | ~387/182 | 4000–600 | Transmission | PLS using PRESS | Dependent test set | Segment validation | 0.85 0.85 0.84 0.91 0.87 0.86 0.84 0.83 0.82 0.84 0.87 0.84 0.82 0.88 0.85 0.86 0.84 0.86 0.88 0.9 0.84 0.88 0.85 0.87 0.85 0.82 0.92 0.89 | 4.57 5.39 3.91 132 9.87 1.02 2.8 0.625 13 1.59 0.328 4.15 0.0645 4.1 2.1 24.2 1.28 0.513 1.24 1.12 8.85 0.463 0.831 1.01 4.7 7.49 224 56.5 (mg/L) | Wines comprised four cultivars from 13 vinifications over two seasons; slightly less accurate at phenolic content compared to FT-NIR | [92] |
| Wine (red, rose and white) | Total phenolics Total anthocyanins | 35/- | 4000–650 | ATR | PLS | Cross-validation only | LOO | 0.91 0.86 | 269.2 mg/L 1.79 mg/L | Seven wine samples (red, rose, white) each at five different time points | [146] |
| Wine (red and white) | Total polyphenols Malvidin-3-O-glucoside Peonidin-3-O-glucoside Petunidin-3-O-glucoside Delphinidin-3-O-glucoside Delphinidin-3-O-(6-acetyl)-glucoside Petunidin-3-O-(6-acetyl)-glucoside Peonidin-3-O-(6-acetyl)-glucoside Malvidin-3-O-(6-acetyl)-glucoside Delphinidin-3-O-(6-p-coumaroyl)-glucoside Malvidin-3-O-(6-p-coumaroyl)-glucoside o-coumaric acid | 51/21 | 4000–650 | ATR | PLS | Dependent test set | LOO | 0.75 0.53 0.56 0.67 0.71 0.27 0.29 0.31 0.41 0.45 0.69 0.63 | 249.1 6.87 0.38 1.1 0.73 0.15 0.24 0.22 2.59 0.12 0.65 0.33 (mg/L) | Samples from various locations across two seasons | [147] |
| Other foods | |||||||||||
| Chocolate | (+)-Catechin (+)-Epicatechin Total phenolics TAC (DPPH) TAC (ORAC) | 18/7 | 4000–550 | ATR | PLS | Semi-independent (7 randomly selected commercial chocolate brands) R2p = 0.86, 0.72, 0.88, 0.89, 0.90; RMSEP = 0.10, 0.57, 5.08, 13.07, 37.92 mg/g | Nine-fold cross-validation | 0.94 0.87 0.93 0.92 0.89 | 0.09 0.58 4.21 1.05 11.38 (mg/g) | 18 different types of chocolate containing 35–100% cacao | [31] |
| Honey | Catechin Syringic acid Vanillic acid Chlorogenic acid TAC (DPPH) | 64/36 | 3000–2800, 1800–700 | ATR | PLS | Dependent test set (ranked subset of samples) | LOO | 0.999 0.992 0.946 0.994 0.955 | 0.40 1.08 0.45 0.43 (µg/g) 1.63 (mg/100 g) | Models based on Raman spectra were slightly better than FTIR | [148] |
| Matrix Type | Number of Published Studies | |
|---|---|---|
| NIR | MIR | |
| Fruit | 18 | 1 |
| Vegetables | 3 | 1 |
| Grains/pulses | 6 | 3 |
| Oils | 4 | 3 |
| Aromatic plants | 7 | 0 |
| Beverages | 6 | 7 |
| Others | 2 | 2 |
| Total | 46 | 18 |
| Analyte Class | Number of Published Studies |
|---|---|
| Total polyphenol content ^ | 34 |
| Specific polyphenols ^ | 21 |
| Total anthocyanin content | 13 |
| Specific anthocyanins | 4 |
| Total carotenoid content | 2 |
| Specific carotenoids (β-carotene, lycopene) | 6 |
| Ascorbic acid (vitamin C) | 6 |
| Alkaloids (theobromine, caffeine, piperine) | 4 |
| Fatty acid esters and other bioactive hydrocarbons | 2 |
| Chlorophylls | 1 |
| Tocopherols | 1 |
| Total | 94 |
Disclaimer/Publisher’s Note: The statements, opinions and data contained in all publications are solely those of the individual author(s) and contributor(s) and not of MDPI and/or the editor(s). MDPI and/or the editor(s) disclaim responsibility for any injury to people or property resulting from any ideas, methods, instructions or products referred to in the content. |
© 2023 by the authors. Licensee MDPI, Basel, Switzerland. This article is an open access article distributed under the terms and conditions of the Creative Commons Attribution (CC BY) license (https://creativecommons.org/licenses/by/4.0/).
Share and Cite
Johnson, J.B.; Walsh, K.B.; Naiker, M.; Ameer, K. The Use of Infrared Spectroscopy for the Quantification of Bioactive Compounds in Food: A Review. Molecules 2023, 28, 3215. https://doi.org/10.3390/molecules28073215
Johnson JB, Walsh KB, Naiker M, Ameer K. The Use of Infrared Spectroscopy for the Quantification of Bioactive Compounds in Food: A Review. Molecules. 2023; 28(7):3215. https://doi.org/10.3390/molecules28073215
Chicago/Turabian StyleJohnson, Joel B., Kerry B. Walsh, Mani Naiker, and Kashif Ameer. 2023. "The Use of Infrared Spectroscopy for the Quantification of Bioactive Compounds in Food: A Review" Molecules 28, no. 7: 3215. https://doi.org/10.3390/molecules28073215