
Valorization of Pumpkin Peel as a Source of Bioactive Compounds: Optimization of Heat- and Ultrasound-Assisted Extraction

 , ,
, ,  , ,
, ,  , , ,
, , ,  and
and
Abstract
:1. Introduction
2. Results and Discussion
2.1. Optimized Responses and Conditions by RSM
2.1.1. Optimization of the Extraction for ‘TL’ Peel (P1)
2.1.2. Optimization of the Extraction for ‘Voutirato’ Peel (P2)
2.1.3. Optimization of the Extraction for ‘Leuka Melitis’ Peel (P3)
2.1.4. General Considerations
2.2. Evaluation of the Extracts Obtained at the Optimum Conditions
2.2.1. Phenolic Compound Profiles
2.2.2. Antioxidant Activity
2.2.3. Antibacterial and Antifungal Activity
2.2.4. Cytotoxicity
3. Materials and Methods
3.1. Sample Preparation
3.2. Pumpkin Peel Extraction Procedures
3.2.1. Heat-Assisted Extraction (HAE)
3.2.2. Ultrasound-Assisted Extraction (UAE)
3.3. Response Value Formats for Result Presentation
3.4. Experimental Design, Model Analysis, and Statistical Evaluation
3.5. Phenolic Compounds Analysis by HPLC-DAD-ESI/MS
3.6. Evaluation of Bioactive Properties
3.6.1. Antioxidant Activity
3.6.2. Antimicrobial Activity
3.6.3. Cytotoxic Activity
3.7. Statistical Analysis
4. Conclusions
Author Contributions
Funding
Institutional Review Board Statement
Informed Consent Statement
Data Availability Statement
Acknowledgments
Conflicts of Interest
Sample Availability
References
- ReferencesMunekata, P.E.S.; Pateiro, M.; Domínguez, R.; Nieto, G.; Kumar, M.; Dhama, K.; Lorenzo, J.M. Bioactive Compounds from Fruits as Preservatives. Foods 2023, 12, 343. [Google Scholar] [CrossRef]
- Brusselaers, J.; Van Der Linden, A. Bio-Waste in Europe—Turning Challenges into Opportunities; EEA Report; European Environment Agency: Copenhagen, Denmark, 2020. [Google Scholar]
- Leichtweis, M.G.; Molina, A.K.; Pires, T.C.S.; Dias, M.I.; Calhelha, R.; Bachari, K.; Ziani, B.E.C.; Oliveira, M.B.P.P.; Pereira, C.; Barros, L. Biological Activity of Pumpkin Byproducts: Antimicrobial and Antioxidant Properties. Molecules 2022, 27, 8366. [Google Scholar] [CrossRef] [PubMed]
- Hussain, A.; Kausar, T.; Sehar, S.; Sarwar, A.; Ashraf, A.H.; Jamil, M.A.; Noreen, S.; Rafique, A.; Iftikhar, K.; Quddoos, M.Y.; et al. A Comprehensive review of functional ingredients, especially bioactive compounds present in pumpkin peel, flesh and seeds, and their health benefits. Food Chem. Adv. 2022, 1, 100067. [Google Scholar] [CrossRef]
- Badr, S.E.A.; Shaaban, M.; Elkholy, Y.M.; Helal, M.H.; Hamza, A.S.; Masoud, M.S.; El Safty, M.M. Chemical composition and biological activity of ripe pumpkin fruits (Cucurbita pepo L.) cultivated in Egyptian habitats. Nat. Prod. Res. 2011, 25, 1524–1539. [Google Scholar] [CrossRef]
- Asif, M.; Ali, S.; Naqvi, R.; Sherazi, T.A.; Ahmad, M.; Fawad Zahoor, A.; Shahzad, S.A.; Hussain, Z.; Mahmood, H.; Mahmood, N. Antioxidant, Antibacterial and Antiproliferative Activities of Pumpkin (Cucurbit) Peel and Puree Extracts—An In Vitro Study. Pak. J. Pharm. Sci. 2017, 30, 1327–1334. [Google Scholar]
- Daiuto, E.R.; Vieites, R.L.; Pigoli, D.R.; de Carvalho, L.D. Alterações Nutricionais Em Casca E Polpa De Abóbora Decorrentes De Diferentes Métodos De Cozimento. Rev. Iberoam. Tecnol. Postcosecha 2012, 13, 196–203. [Google Scholar]
- Kim, M.Y.; Kim, E.J.; Kim, Y.N.; Choi, C.; Lee, B.H. Comparison of the chemical compositions and nutritive values of various pumpkin (Cucurbitaceae) species and parts. Nutr. Res. Pract. 2012, 6, 21–27. [Google Scholar] [CrossRef] [Green Version]
- Lama-Muñoz, A.; Contreras, M. del M. Extraction Systems and Analytical Techniques for Food Phenolic Compounds: A Review. Foods 2022, 11, 3671. [Google Scholar] [CrossRef]
- Jovanović, A.A.; Đorđević, V.B.; Zdunić, G.M.; Pljevljakušić, D.S.; Šavikin, K.P.; Gođevac, D.M.; Bugarski, B.M. Optimization of the extraction process of polyphenols from Thymus serpyllum L. herb using maceration, heat- and ultrasound-assisted techniques. Sep. Purif. Technol. 2017, 179, 369–380. [Google Scholar] [CrossRef] [Green Version]
- Leichtweis, M.G.; Oliveira, M.B.P.P.; Ferreira, I.C.F.R.; Pereira, C.; Barros, L. Sustainable recovery of preservative and bioactive compounds from food industry bioresidues. Antioxidants 2021, 10, 1827. [Google Scholar] [CrossRef]
- Backes, E.; Pereira, C.; Barros, L.; Prieto, M.A.; Genena, A.K.; Barreiro, M.F.; Ferreira, I.C.F.R. Recovery of bioactive anthocyanin pigments from Ficus carica L. peel by heat, microwave, and ultrasound based extraction techniques. Food Res. Int. 2018, 113, 197–209. [Google Scholar] [CrossRef] [PubMed] [Green Version]
- López, C.J.; Caleja, C.; Prieto, M.A.; Barreiro, M.F.; Barros, L.; Ferreira, I.C.F.R. Optimization and comparison of heat and ultrasound assisted extraction techniques to obtain anthocyanin compounds from Arbutus unedo L. Fruits. Food Chem. 2018, 264, 81–91. [Google Scholar] [CrossRef] [PubMed] [Green Version]
- Khuri, A.I.; Mukhopadhyay, S. Response surface methodology. Wiley Interdiscip. Rev. Comput. Stat. 2010, 2, 128–149. [Google Scholar] [CrossRef]
- Salami, A.; Asefi, N.; Kenari, R.E.; Gharekhani, M. Extraction of pumpkin peel extract using supercritical CO2 and subcritical water technology: Enhancing oxidative stability of canola oil. J. Food Sci. Technol. 2021, 58, 1101–1109. [Google Scholar] [CrossRef]
- Belwal, T.; Dhyani, P.; Bhatt, I.D.; Rawal, R.S.; Pande, V. Optimization extraction conditions for improving phenolic content and antioxidant activity in Berberis asiatica fruits using response surface methodology (RSM). Food Chem. 2016, 207, 115–124. [Google Scholar] [CrossRef]
- Chen, S.; Zeng, Z.; Hu, N.; Bai, B.; Wang, H.; Suo, Y. Simultaneous optimization of the ultrasound-assisted extraction for phenolic compounds content and antioxidant activity of Lycium ruthenicum Murr. fruit using response surface methodology. Food Chem. 2018, 242, 1–8. [Google Scholar] [CrossRef]
- Singh, J.; Singh, V.; Shukla, S.; K Rai, A. Phenolic Content and Antioxidant Capacity of Selected Cucurbit Fruits Extracted with Different Solvents. J. Nutr. Food Sci. 2016, 6, 1–8. [Google Scholar] [CrossRef]
- Da Porto, C.; Natolino, A. Extraction kinetic modelling of total polyphenols and total anthocyanins from saffron floral bio-residues: Comparison of extraction methods. Food Chem. 2018, 258, 137–143. [Google Scholar] [CrossRef]
- Quanhong, L.; Caili, F. Application of response surface methodology for extraction optimization of germinant pumpkin seeds protein. Food Chem. 2005, 92, 701–706. [Google Scholar] [CrossRef]
- Kulczyński, B.; Gramza-Michałowska, A.; Królczyk, J.B. Optimization of Extraction Conditions for the Antioxidant Potential of Different Pumpkin Varieties (Cucurbita maxima). Sustainability 2020, 12, 1305. [Google Scholar] [CrossRef] [Green Version]
- Sun, J.; Yin, G.; Du, P.; Chen, L. Optimization of extraction technique of polysaccharides from pumpkin by response surface method. J. Med. Plants Res. 2011, 5, 2218–2222. [Google Scholar]
- Altemimi, A.; Watson, D.G.; Kinsel, M.; Lightfoot, D.A. Simultaneous extraction, optimization, and analysis of flavonoids and polyphenols from peach and pumpkin extracts using a TLC-densitometric method. Chem. Cent. J. 2015, 9, 39. [Google Scholar] [CrossRef] [PubMed] [Green Version]
- Iswaldi, I.; Gómez-Caravaca, A.M.; Lozano-Sánchez, J.; Arráez-Román, D.; Segura-Carretero, A.; Fernández-Gutiérrez, A. Profiling of phenolic and other polar compounds in zucchini (Cucurbita pepo L.) by reverse-phase high-performance liquid chromatography coupled to quadrupole time-of-flight mass spectrometry. Food Res. Int. 2013, 50, 77–84. [Google Scholar] [CrossRef]
- Ncube, E.N.; Mhlongo, M.I.; Piater, L.A.; Steenkamp, P.A.; Dubery, I.A.; Madala, N.E. Analyses of chlorogenic acids and related cinnamic acid derivatives from Nicotiana tabacum tissues with the aid of UPLC-QTOF-MS/MS based on the in-source collision-induced dissociation method. Chem. Cent. J. 2014, 8, 66. [Google Scholar] [CrossRef] [PubMed] [Green Version]
- Mashiane, P.; Manhivi, V.E.; Shoko, T.; Slabbert, R.M.; Sultanbawa, Y.; Sivakumar, D. Cooking african pumpkin leaves (Momordica balsamina L.) by stir-frying improved bioactivity and bioaccessibility of metabolites—Metabolomic and chemometric approaches. Foods 2021, 10, 2890. [Google Scholar] [CrossRef] [PubMed]
- Kiat, V.V.; Siang, W.K.; Madhavan, P.; Chin, J.H.; Ahmad, M.; Akowuah, G.A. FT-IR profile and antiradical activity of dehulled kernels of apricot, almond and pumpkin. Res. J. Pharm. Biol. Chem. Sci. 2014, 5, 112–120. [Google Scholar]
- Rice-Evans, C.A.; Miller, N.J.; Paganga, G. Antioxidant properties of phenolic compounds. Trends Plant Sci. 1997, 2, 152–159. [Google Scholar] [CrossRef]
- Hussain, A.; Kausar, T.; Din, A.; Murtaza, A.; Jamil, M.A.; Noreen, S.; Iqbal, M.A. Antioxidant and Antimicrobial Properties of Pumpkin (Cucurbita maxima) Peel, Flesh and Seeds Powders. J. Biol. Agric. Healthc. 2021, 11, 42–51. [Google Scholar] [CrossRef]
- Roriz, C.L.; Barros, L.; Prieto, M.A.; Morales, P.; Ferreira, I.C.F.R. Floral parts of Gomphrena globosa L. as a novel alternative source of betacyanins: Optimization of the extraction using response surface methodology. Food Chem. 2017, 229, 223–234. [Google Scholar] [CrossRef] [Green Version]
- Leichtweis, M.G.; Pereira, C.; Prieto, M.A.; Barreiro, M.F.; Baraldi, I.J.; Barros, L.; Ferreira, I.C.F.R. Ultrasound as a rapid and low-cost extraction procedure to obtain anthocyanin-based colorants from Prunus spinosa L. fruit epicarp: Comparative study with conventional heat-based extraction. Molecules 2019, 24, 573. [Google Scholar] [CrossRef] [Green Version]
- Añibarro-Ortega, M.; Pinela, J.; Ćirić, A.; Martins, V.; Rocha, F.; Soković, M.D.; Barata, A.M.; Carvalho, A.M.; Barros, L.; Ferreira, I.C.F.R. Valorisation of table tomato crop by-products: Phenolic profiles and in vitro antioxidant and antimicrobial activities. Food Bioprod. Process. 2020, 124, 307–319. [Google Scholar] [CrossRef]
- Gunst, R.F.; Myers, R.H.; Montgomery, D.C. Response Surface Methodology: Process and Product Optimization using Designed Experiments; John Wiley & Sons, Inc.: Hoboken, NJ, USA, 1996. [Google Scholar]
- Bessada, S.M.F.; Barreira, J.C.M.; Barros, L.; Ferreira, I.C.F.R.; Oliveira, M.B.P.P. Phenolic profile and antioxidant activity of Coleostephus myconis (L.) Rchb. f.: An underexploited and highly disseminated species. Ind. Crops Prod. 2016, 89, 45–51. [Google Scholar] [CrossRef] [Green Version]
- Pereira, C.; Calhelha, R.C.; Barros, L.; Queiroz, M.J.R.P.; Ferreira, I.C.F.R. Synergisms in antioxidant and anti-hepatocellular carcinoma activities of artichoke, milk thistle and borututu syrups. Ind. Crops Prod. 2014, 52, 709–713. [Google Scholar] [CrossRef] [Green Version]
- Lockowandt, L.; Pinela, J.; Roriz, C.L.; Pereira, C.; Abreu, R.M.V.; Calhelha, R.C.; Alves, M.J.; Barros, L.; Bredol, M.; Ferreira, I.C.F.R. Chemical features and bioactivities of cornflower (Centaurea cyanus L.) capitula: The blue flowers and the unexplored non-edible part. Ind. Crops Prod. 2019, 128, 496–503. [Google Scholar] [CrossRef] [Green Version]
- Heleno, S.A.; Ferreira, I.C.F.R.; Esteves, A.P.; Ćirić, A.; Glamočlija, J.; Martins, A.; Soković, M.; Queiroz, M.J.R.P. Antimicrobial and demelanizing activity of Ganoderma lucidum extract, p-hydroxybenzoic and cinnamic acids and their synthetic acetylated glucuronide methyl esters. Food Chem. Toxicol. 2013, 58, 95–100. [Google Scholar] [CrossRef]
- Guimarães, R.; Barros, L.; Dueñas, M.; Calhelha, R.C.; Carvalho, A.M.; Santos-Buelga, C.; Queiroz, M.J.R.P.; Ferreira, I.C.F.R. Nutrients, phytochemicals and bioactivity of wild Roman chamomile: A comparison between the herb and its preparations. Food Chem. 2013, 136, 718–725. [Google Scholar] [CrossRef] [Green Version]


| Run | HAE | UAE | ||||
|---|---|---|---|---|---|---|
| X1 − t (min) | X2 − T (°C) | X3 − EtOH (%) | X1 − t (min) | X2 – P (% of W) 1 | X3 − EtOH (%) | |
| 1 | 67.5 | 30 | 0 | 32.5 | 20 | 0 |
| 2 | 120 | 55 | 100 | 60 | 20 | 50 |
| 3 | 67.5 | 55 | 50 | 5 | 80 | 50 |
| 4 | 67.5 | 55 | 50 | 5 | 50 | 0 |
| 5 | 67.5 | 80 | 0 | 60 | 50 | 0 |
| 6 | 67.5 | 80 | 100 | 32.5 | 50 | 50 |
| 7 | 15 | 80 | 50 | 32.5 | 50 | 50 |
| 8 | 15 | 55 | 100 | 32.5 | 80 | 0 |
| 9 | 67.5 | 55 | 50 | 32.5 | 50 | 50 |
| 10 | 15 | 30 | 50 | 32.5 | 50 | 50 |
| 11 | 67.5 | 30 | 100 | 60 | 80 | 50 |
| 12 | 120 | 55 | 0 | 5 | 50 | 100 |
| 13 | 67.5 | 55 | 50 | 32.5 | 20 | 100 |
| 14 | 120 | 30 | 50 | 5 | 20 | 50 |
| 15 | 120 | 80 | 50 | 32.5 | 50 | 50 |
| 16 | 67.5 | 55 | 50 | 60 | 50 | 100 |
| 17 | 15 | 55 | 0 | 32.5 | 80 | 100 |
| Run | P1 | P2 | P3 | |||||||||||||||
|---|---|---|---|---|---|---|---|---|---|---|---|---|---|---|---|---|---|---|
| HAE | UAE | HAE | UAE | HAE | UAE | |||||||||||||
| R1 | R2 | R3 | R1 | R2 | R3 | R1 | R2 | R3 | R1 | R2 | R3 | R1 | R2 | R3 | R1 | R2 | R3 | |
| DR | RP | TP | DR | RP | TP | DR | RP | TP | DR | RP | TP | DR | RP | TP | DR | RP | TP | |
| 1 | 1.3 | 118 | 132 | 1.1 | 25 | 163 | 1.4 | 244 | 120 | 1.4 | 147 | 131 | 0.9 | 34 | 105 | 0.9 | 215 | 91 |
| 2 | 0.7 | 169 | 126 | 0.9 | 38 | 178 | 0.7 | 101 | 77 | 1.3 | 100 | 90 | 0.4 | 202 | 107 | 0.8 | 157 | 100 |
| 3 | 1.3 | 329 | 142 | 1.6 | 206 | 142 | 1.3 | 304 | 131 | 1.9 | 495 | 107 | 0.9 | 1333 | 85 | 1.2 | 423 | 70 |
| 4 | 1.3 | 313 | 112 | 1.2 | 319 | 170 | 1.4 | 405 | 116 | 1.4 | 337 | 132 | 0.9 | 664 | 80 | 1.0 | 703 | 111 |
| 5 | 1.3 | 401 | 98 | 1.2 | 304 | 127 | 1.9 | 612 | 91 | 0.6 | 295 | 86 | 1.0 | 1013 | 94 | 0.9 | 607 | 64 |
| 6 | 0.8 | 830 | 163 | 1.1 | 191 | 127 | 0.9 | 351 | 127 | 1.3 | 341 | 97 | 0.4 | 561 | 125 | 0.9 | 461 | 81 |
| 7 | 1.3 | 924 | 124 | 1.0 | 856 | 139 | 1.4 | 345 | 88 | 1.2 | 420 | 96 | 0.9 | 608 | 115 | 0.8 | 484 | 81 |
| 8 | 0.6 | 274 | 108 | 1.5 | 323 | 143 | 0.7 | 348 | 99 | 1.5 | 340 | 97 | 0.3 | 455 | 107 | 1.0 | 762 | 108 |
| 9 | 1.2 | 345 | 103 | 1.1 | 262 | 133 | 1.3 | 416 | 96 | 1.3 | 316 | 99 | 0.9 | 550 | 78 | 0.9 | 736 | 75 |
| 10 | 1.1 | 85 | 98 | 1.1 | 93 | 144 | 1.3 | 128 | 113 | 1.2 | 159 | 86 | 0.8 | 148 | 83 | 0.7 | 235 | 75 |
| 11 | 0.5 | 131 | 128 | 1.2 | 35 | 133 | 0.6 | 143 | 124 | 1.4 | 103 | 99 | 0.2 | 82 | 134 | 0.9 | 173 | 73 |
| 12 | 1.3 | 401 | 104 | 0.2 | 317 | 180 | 1.4 | 504 | 101 | 0.5 | 346 | 117 | 0.9 | 551 | 87 | 0.2 | 348 | 113 |
| 13 | 1.3 | 334 | 107 | 0.3 | 316 | 144 | 1.4 | 388 | 89 | 0.4 | 369 | 147 | 0.9 | 498 | 68 | 0.1 | - | 113 |
| 14 | 1.1 | 261 | 138 | 0.9 | 197 | 134 | 1.3 | 263 | 113 | 1.2 | 377 | 97 | 1.0 | 477 | 64 | 0.6 | 621 | 274 |
| 15 | 1.3 | 416 | 121 | 1.4 | 575 | 106 | 1.5 | 470 | 97 | 1.3 | 408 | 57 | 1.1 | 741 | 76 | 0.7 | 628 | 74 |
| 16 | 1.3 | 366 | 117 | 0.3 | 267 | 153 | 1.3 | 359 | 104 | 0.7 | 502 | 126 | 1.0 | 597 | 70 | 0.1 | - | 181 |
| 17 | 1.3 | 332 | 48 | 0.5 | 117 | 96 | 1.3 | - | 132 | 0.7 | 267 | 100 | 0.9 | 1066 | 65 | 0.7 | 1528 | 37 |
| P1 | MAC | Equation | ||
| Dry residue (DR) | R1 = | 1.27 + 0.0714X1 + 0.0171X2 − 0.3232X3 + 0.0027X1X2 − 0.0666X1X3 + 0.0169X2X3 − 0.0396X12 − 0.0245X22 − 0.2882X32 | (1) | |
| Reducing power (RP) | R2 = | 337.4 + 247X1 − 83X2 + 110.5X3 − 171X1X2 + 104X1X3 − 226.5X2X3 + 43.05X12 + 41.05X22 − 10.45X32 | (2) | |
| Total phenols (TP) | R3 = | 111.24 + 1.21X1 + 13.861X2 + 17.97X3 + 10.83X1X2 + 17.25X1X3 + 9.69X2X3 + 18.86X12 − 14.93X22 − 4.85X32 | (3) | |
| UAE | ||||
| Dry residue (DR) | R1 = | 1.14 − 0.0537X1 − 0.2023X2 − 0.4659X3 − 0.0954X1X2 + 0.0077X1X3 − 0.0401X2X3 − 0.0343X12 − 0.0716X22 − 0.3612X32 | (4) | |
| P2 | MAC | |||
| Dry residue (DR) | R1 = | 1.34 + 0.0675X1 + 0.0255X2 − 0.33147X3 + 0.0179X1X2 + 0.0811X1X3 − 0.0129X2X3 − 0.01273X12 + 0.0232X22 − 0.3211X32 | (5) | |
| Reducing power (RP) | R2 = | 332.03 + 125X1 + 31.68X2 − 85.07X3 − 2.5X1X2 − 40X1X3 − 121.86X2X3 | (6) | |
| UAE | ||||
| Dry residue (DR) | R1 = | 1.25 − 0.1139X1 − 0.1471X2 − 0.3450X3 − 0.1515X1X2 + 0.2518X1X3 − 0.0328X2X3 − 0.0114X12 + 0.1861X22 − 0.4336X32 | (7) | |
| P3 | MAC | |||
| Dry residue (DR) | R1 = | 0.9179 + 0.0555X1 + 0.0473X2 − 0.3145X3 − 0.0138X1X2 + 0.0462X1X3 + 0.0145X2X3 − 0.0140X12 + 0.0308X22 − 0.3241X32 | (8) | |
| Total phenols (TP) | R3 = | 76.08 − 6.04X1 + 4.46X2 + 15.20X3 + 12.93X1X2 + 0.5X1X3 − 5.4X2X3 + 6.68X12 − 16.33X22 + 31.75X32 | (9) | |
| UAE | ||||
| Dry residue (DR) | R1 = | 0.7940 − 0.0405X1 + 0.1595X2 − 0.3463X3 − 0.1440X1X2 − 0.0025X1X3 + 0.1160X2X3 − 0.02X12 + 0.1240X22 − 0.2350X32 | (10) | |
| Total phenols (TP) | R3 = | 4.35 − 0.2536X1 − 0.4320X2 + 0.0063X3 + 0.2625X1X2 + 0.0095X1X3 − 0.5298X2X3 + 0.1029X12 + 0.2490X22 + 0.0042X32 | (11) | |
| Sample | Criteria | Heat-Assisted Extraction (HAE) | Ultrasound-Assisted Extraction (UAE) | ||||||||
|---|---|---|---|---|---|---|---|---|---|---|---|
| Optimal Variable Conditions | Optimum Response | Optimal Variable Conditions | Optimum Response | ||||||||
| X1: t (min) | X2: T (°C) | X3: EtOH (%) | X1: t (min) | X2: P (W) | X3: EtOH (%) | ||||||
| P1 | Individual optimal variable conditions | ||||||||||
| R1 | 40 | 70 | 19 | 1.4 | g/100 g dw | 18 | 400 | 16 | 1.6 | g/100 g dw | |
| R2 | 30 | 31 | 29 | 27 | µg/mL | - | - | - | - | µg/mL | |
| R3 | 62 | 80 | 97 | 165 | mg/g dw | - | - | - | - | mg/g dw | |
| Global optimal variable conditions | |||||||||||
| R1 | 75 | 30 | 24 | 1.3 | g/100 g dw | - | - | - | - | g/100 g dw | |
| R2 | 158 | µg/mL | - | µg/mL | |||||||
| R3 | 136 | mg/g dw | - | mg/g dw | |||||||
| P2 | Individual optimal variable conditions | ||||||||||
| R1 | 120 | 73 | 24 | 1.5 | g/100 g dw | 7 | 380 | 17 | 1.9 | g/100 g dw | |
| R2 | 15 | 30 | 2 | 100 | µg/mL | - | - | - | - | µg/mL | |
| R3 | - | - | - | - | mg/g dw | - | - | - | - | mg/g dw | |
| Global optimal variable conditions | |||||||||||
| R1 | 15 | 30 | 10 | 1.4 | g/100 g dw | - | - | - | - | g/100 g dw | |
| R2 | 112 | µg/mL | - | µg/mL | |||||||
| R3 | - | mg/g dw | - | mg/g dw | |||||||
| P3 | Individual optimal variable conditions | ||||||||||
| R1 | 98 | 79 | 27 | 1.1 | g/100 g dw | 9 | 395 | 31 | 1.3 | g/100 g dw | |
| R2 | - | - | - | - | µg/mL | - | - | - | - | µg/mL | |
| R3 | 68 | 30 | 100 | 135 | mg/g dw | >29 | >100 | >100 | >307 | >mg/g dw | |
| >Global optimal variable conditions | |||||||||||
| R1 | 67 | 30 | 0 | 0.9 | g/100 g dw | 5 | 400 | 0 | 1.1 | g/100 g dw | |
| R2 | - | µg/mL | - | µg/mL | |||||||
| R3 | 106 | mg/g dw | 120 | mg/g dw | |||||||
| Sample P1 with HAE | |||
|---|---|---|---|
| Temperature vs. Time | Solvent vs. Time | Solvent vs. Temperature | |
| R1 − DR |  |  |  |
| R2 − RP |  |  |  |
| R3 − TP |  |  |  |
| Desirability |  |  |  |
| Sample P1 with UAE | |||
|---|---|---|---|
| Power vs. Time | Power vs. Solvent | Time vs. Solvent | |
| R1 − DR |  |  |  |
| Sample P2 with HAE | |||
|---|---|---|---|
| Temp. vs. Time | Solvent vs. Time | Solvent vs. Temperature | |
| R1 − DR |  |  |  |
| R2 − RP |  |  |  |
| Desirability |  |  |  |
| Sample P2 with UAE | |||
|---|---|---|---|
| Power vs. Time | Solvent vs. Power | Solvent vs. Time | |
| R1 − DR |  |  |  |
| Sample P3 with HAE | |||
|---|---|---|---|
| Temp. vs. Time | Solvent vs. Time | Solvent vs. Temperature | |
| R1 − DR |  |  |  |
| R3 − TP |  |  |  |
| Desirability |  |  |  |
| Sample P3 with UAE | |||
|---|---|---|---|
| Power vs. Time | Solvent vs. Power | Time vs. Solvent | |
| R1 − DR |  |  |  |
| R3 − TP |  |  |  |
| Desirability |  |  |  |
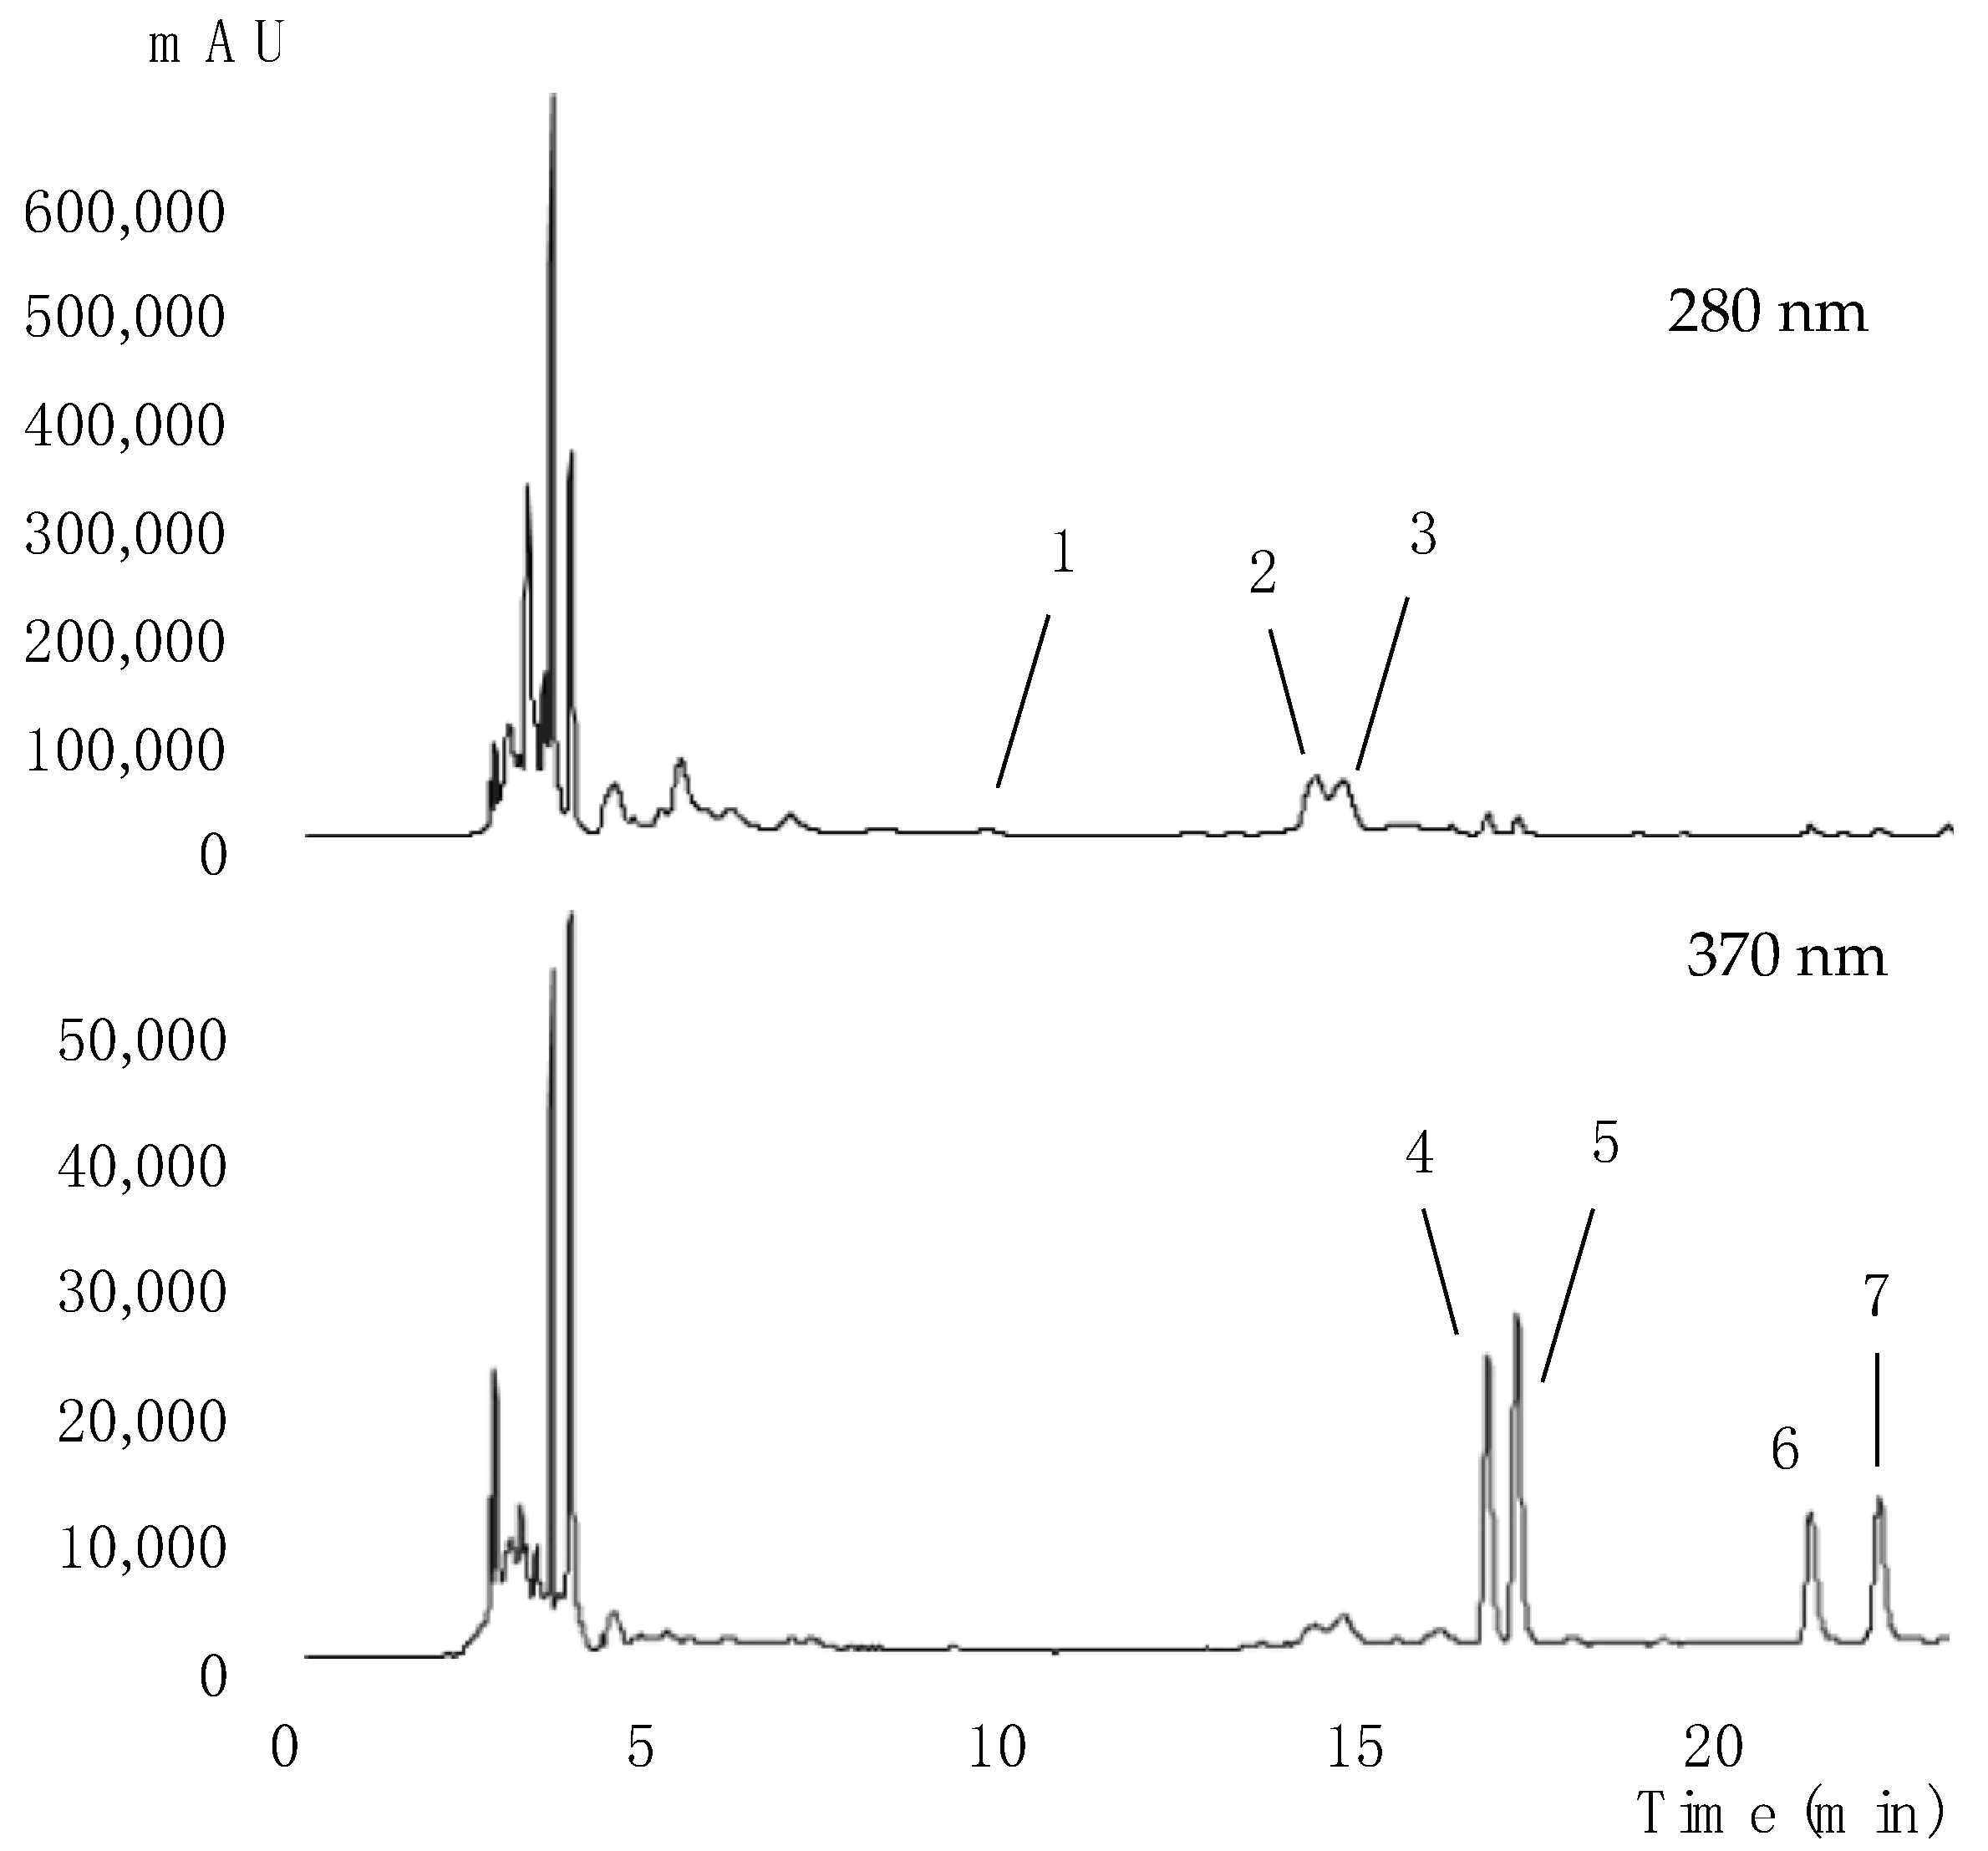
| Peak | Rt (min) | λmax (nm) | [M-H]− (m/z) | MS2 (m/z) | Tentative Identification |
|---|---|---|---|---|---|
| 1 | 7.69 | 280 | 289 | 245(100),205(45) | (-)-Epicatechin |
| 2 | 14.11 | 324 | 337 | 191(5),173(100),135(5) | cis-4-O-p-Coumaroylquinic acid |
| 3 | 14.49 | 325 | 337 | 191(5),173(100),135(5) | trans-4-O-p-Coumaroylquinic acid |
| 4 | 16.51 | 354 | 739 | 285(100) | Kaempferol-O-dideoxyhexosyl-hexoside |
| 5 | 16.93 | 354 | 769 | 315(100) | Isorhamnetin-O-dideoxyhexosyl-hexoside |
| 6 | 21.03 | 348 | 593 | 285(100) | Kaempferol-O-deoxyhexosyl-hexoside |
| 7 | 21.98 | 365 | 623 | 315(100) | Isorhamnetin-O-deoxyhexosyl-hexoside |
| Peak | P1 | P2 | P3 |
|---|---|---|---|
| 1 | 0.244 ± 0.007 a | 0.210 ± 0.005 b | 0.091 ± 0.004 c |
| 2 | 0.355 ± 0.003 b | 0.52 ± 0.02 a | 0.0583 ± 0.0003 c |
| 3 | 0.371 ± 0.004 a | 0.36 ± 0.02 a | 0.0367 ± 0.0003 b |
| 4 | 0.5204 ± 0.0006 a | 0.42085 ± 0.00007 c | 0.444589 ± 0.000009 b |
| 5 | 0.5302 ± 0.0003 a | 0.4800 ± 0.0003 b | 0.45000 ± 0.00006 c |
| 6 | 0.5005 ± 0.0005 a | 0.41053 ± 0.00004 b | n.d. |
| 7 | 0.5044 ± 0.0002 a | 0.42703 ± 0.00009 c | 0.4442 ± 0.0002 b |
| Total flavan-3-ols | 0.244 ± 0.007 a | 0.210 ± 0.005 b | 0.091 ± 0.004 c |
| Total phenolic acids | 0.7261 ± 0.0006 b | 0.876 ± 0.005 a | 0.09495 ± 0.00009 c |
| Total flavonoids | 2.05548 ± 0.00001 a | 1.7384 ± 0.0004 b | 1.3388 ± 0.0002 c |
| Total phenolic compounds | 3.026 ± 0.008 a | 2.824 ± 0.001 b | 1.525 ± 0.004 c |
| Sample | TBARS (IC50 1) | OxHLIA (IC50 1) Δt = 60 min |
|---|---|---|
| P1 | 850 ± 40 c | 61 ± 1 b |
| P2 | 1600 ± 88 b | 62 ± 1 b |
| P3 | 2510 ± 147 a | 540 ± 15 a |
| Trolox * | 139 ± 5 d | 21.8 ± 0.2 c |
| P1 | P2 | P3 | Streptomycin * | Methicilin * | Ampicillin * | Ketoconazole * | ||||||||
|---|---|---|---|---|---|---|---|---|---|---|---|---|---|---|
| MIC | MBC/MFC | MIC | MBC/MFC | MIC | MBC/MFC | MIC | MBC | MIC | MBC | MIC | MBC | MIC | MFC | |
| Enterobacter cloacae | 10 | >10 | 10 | >10 | >10 | >10 | 0.007 | 0.007 | n.t. | n.t | 0.15 | 0.15 | n.t. | n.t. |
| Escherichia coli | 5 | >10 | 5 | >10 | >10 | >10 | 0.01 | 0.01 | n.t. | n.t. | 0.15 | 0.15 | n.t. | n.t. |
| Pseudomonas aeruginosa | >10 | >10 | 10 | >10 | 10 | >10 | 0.06 | 0.06 | n.t. | n.t. | 0.63 | 0.63 | n.t. | n.t. |
| Salmonella enterica | 5 | >10 | 2.5 | >10 | >10 | >10 | 0.007 | 0.007 | n.t. | n.t. | 0.15 | 0.15 | n.t. | n.t. |
| Yersinia enterocolitica | 10 | >10 | 5 | >10 | 2.5 | >10 | 0.007 | 0.007 | n.t. | n.t. | 0.15 | 0.15 | n.t. | n.t. |
| Bacillus cereus | >10 | >10 | >10 | >10 | >10 | >10 | 0.007 | 0.007 | n.t. | n.t. | n.t. | n.t. | n.t. | n.t. |
| Listeria monocytogenes | 10 | >10 | 5 | >10 | 5 | >10 | 0.007 | 0.007 | n.t. | n.t. | 0.15 | 0.15 | n.t. | n.t. |
| Staphylococcus aureus | 10 | >10 | 10 | >10 | 10 | >10 | 0.007 | 0.007 | 0.007 | 0.007 | 0.15 | 0.15 | n.t. | n.t. |
| Aspergillus brasiliensis | 10 | >10 | 10 | >10 | 10 | >10 | n.t. | n.t. | n.t. | n.t. | n.t. | n.t. | 0.06 | 0.125 |
| Aspergillus fumigatus | >10 | >10 | >10 | >10 | >10 | >10 | n.t. | n.t. | n.t. | n.t. | n.t. | n.t. | 0.5 | 1 |
Disclaimer/Publisher’s Note: The statements, opinions and data contained in all publications are solely those of the individual author(s) and contributor(s) and not of MDPI and/or the editor(s). MDPI and/or the editor(s) disclaim responsibility for any injury to people or property resulting from any ideas, methods, instructions or products referred to in the content. |
© 2023 by the authors. Licensee MDPI, Basel, Switzerland. This article is an open access article distributed under the terms and conditions of the Creative Commons Attribution (CC BY) license (https://creativecommons.org/licenses/by/4.0/).
Share and Cite
Leichtweis, M.G.; Molina, A.K.; Petropoulos, S.A.; Carocho, M.; Pires, T.C.S.P.; Dias, M.I.; Calhelha, R.; Oliveira, M.B.P.P.; Pereira, C.; Barros, L. Valorization of Pumpkin Peel as a Source of Bioactive Compounds: Optimization of Heat- and Ultrasound-Assisted Extraction. Molecules 2023, 28, 3168. https://doi.org/10.3390/molecules28073168
Leichtweis MG, Molina AK, Petropoulos SA, Carocho M, Pires TCSP, Dias MI, Calhelha R, Oliveira MBPP, Pereira C, Barros L. Valorization of Pumpkin Peel as a Source of Bioactive Compounds: Optimization of Heat- and Ultrasound-Assisted Extraction. Molecules. 2023; 28(7):3168. https://doi.org/10.3390/molecules28073168
Chicago/Turabian StyleLeichtweis, Maria G., Adriana K. Molina, Spyridon A. Petropoulos, Márcio Carocho, Tânia C. S. P. Pires, Maria Inês Dias, Ricardo Calhelha, M. Beatriz P. P. Oliveira, Carla Pereira, and Lillian Barros. 2023. "Valorization of Pumpkin Peel as a Source of Bioactive Compounds: Optimization of Heat- and Ultrasound-Assisted Extraction" Molecules 28, no. 7: 3168. https://doi.org/10.3390/molecules28073168