
A PET Fluorescent Probe for Dynamic Pd2+ Tracking with Imaging Applications in the Nanofiber and Living Cells

Abstract
:
1. Introduction
2. Results
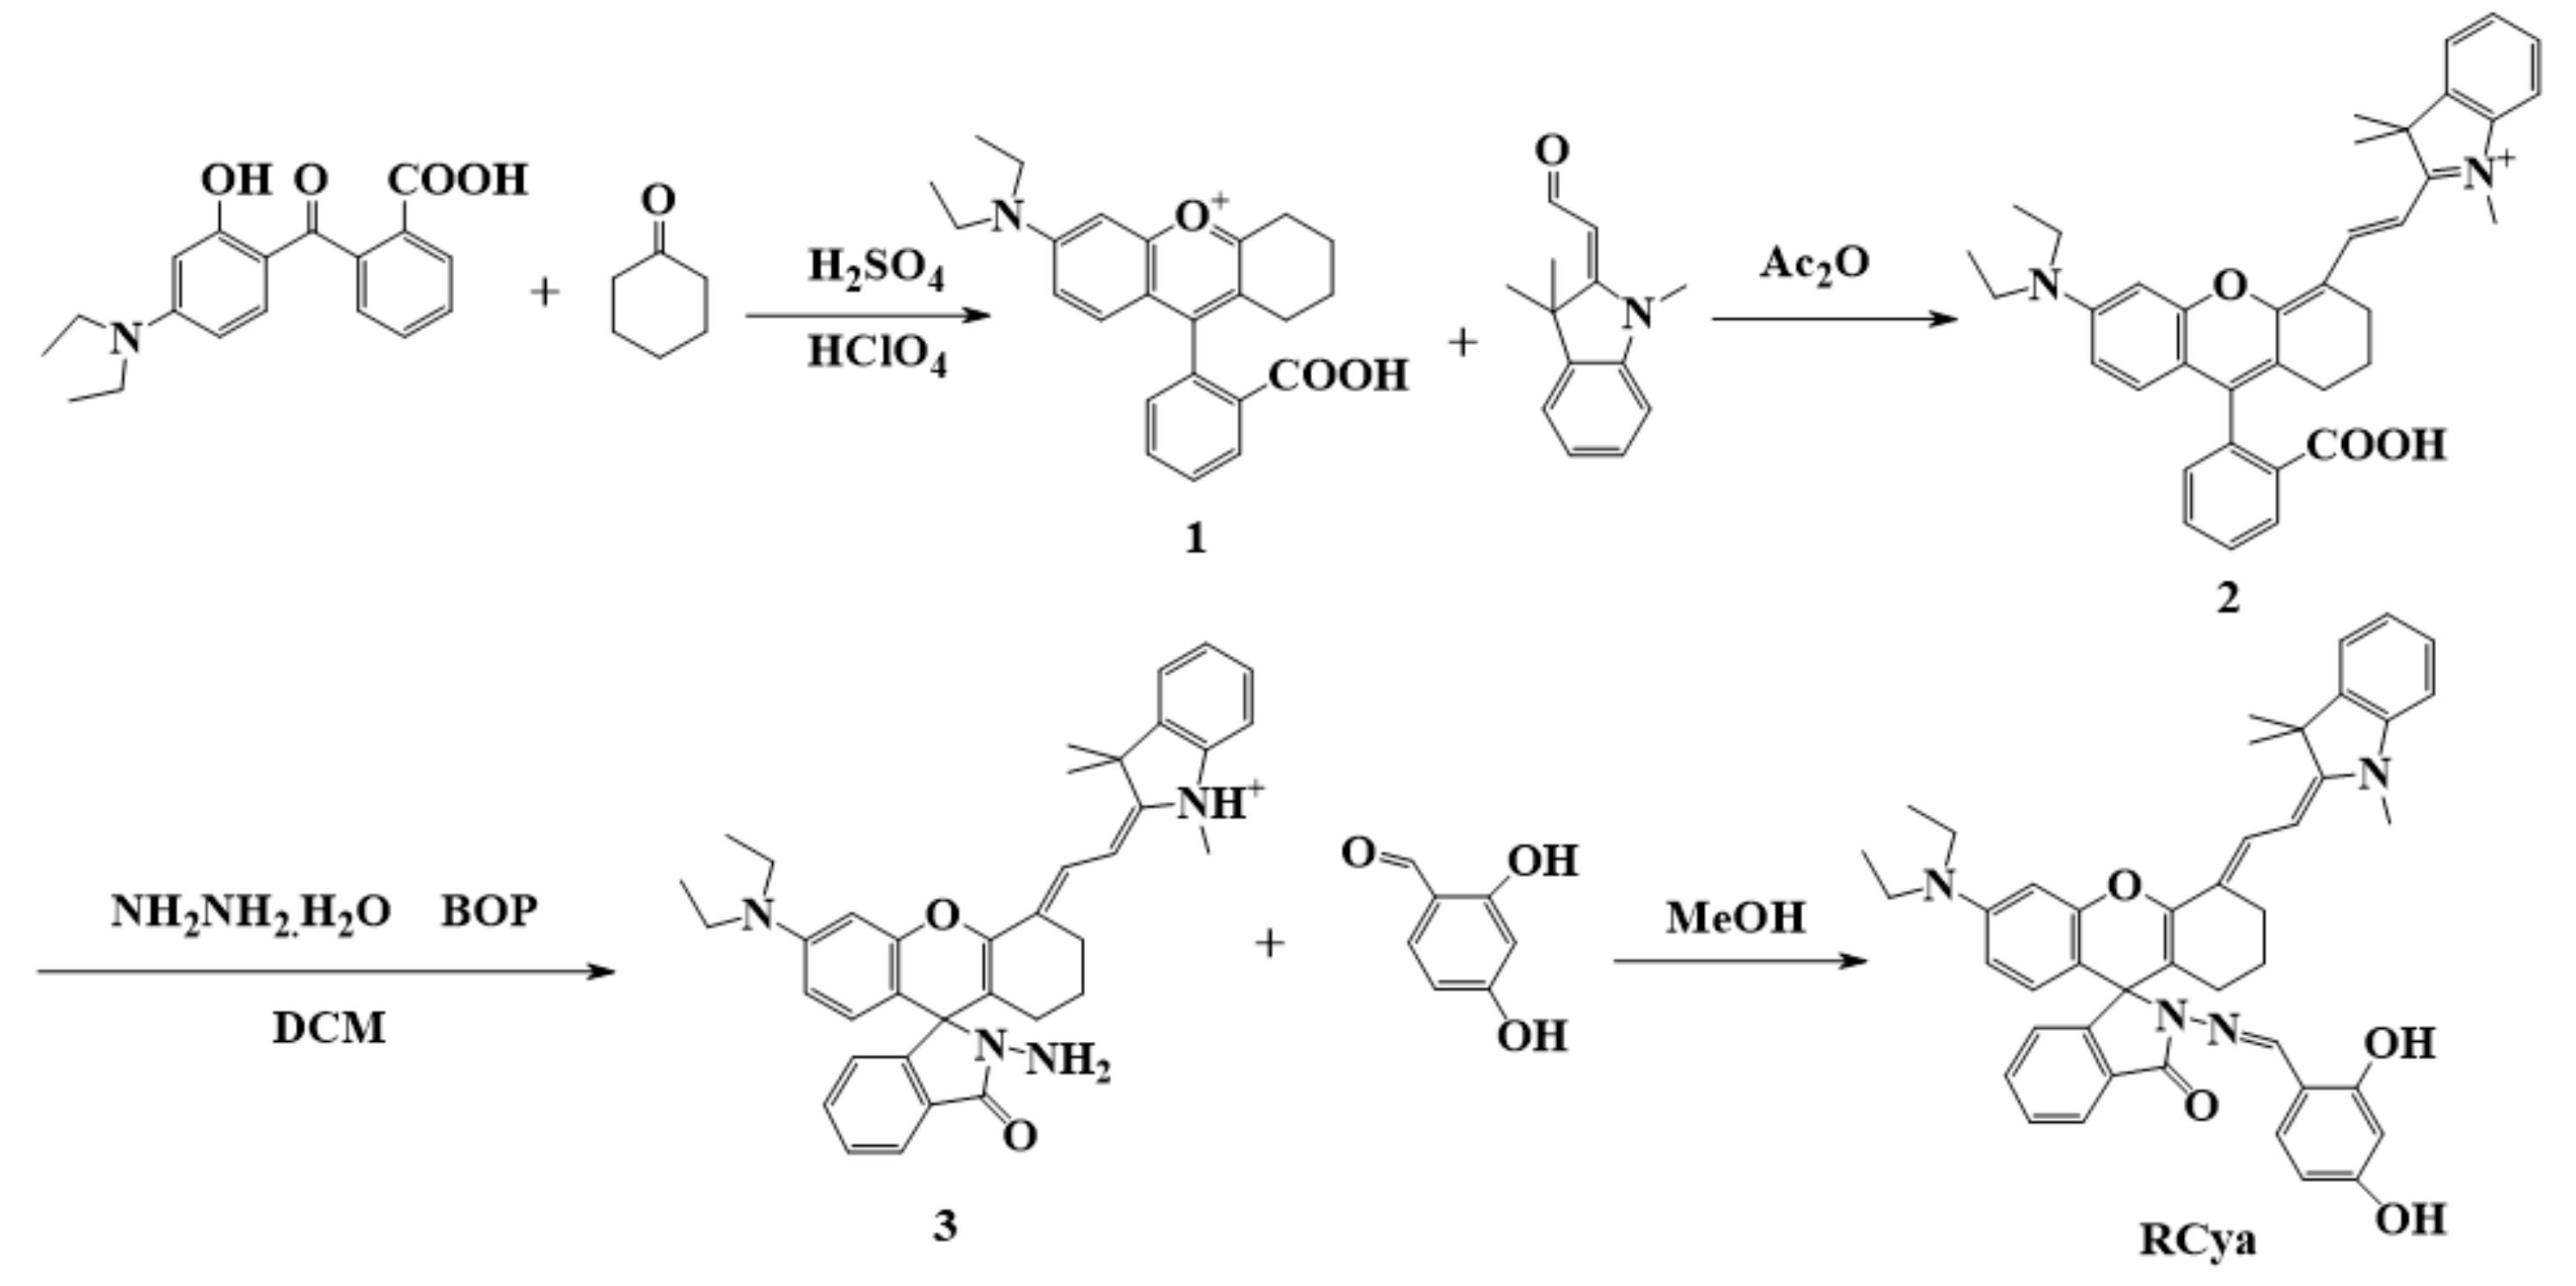
2.1. Structural Characterization
2.2. Spectroscopic Properties
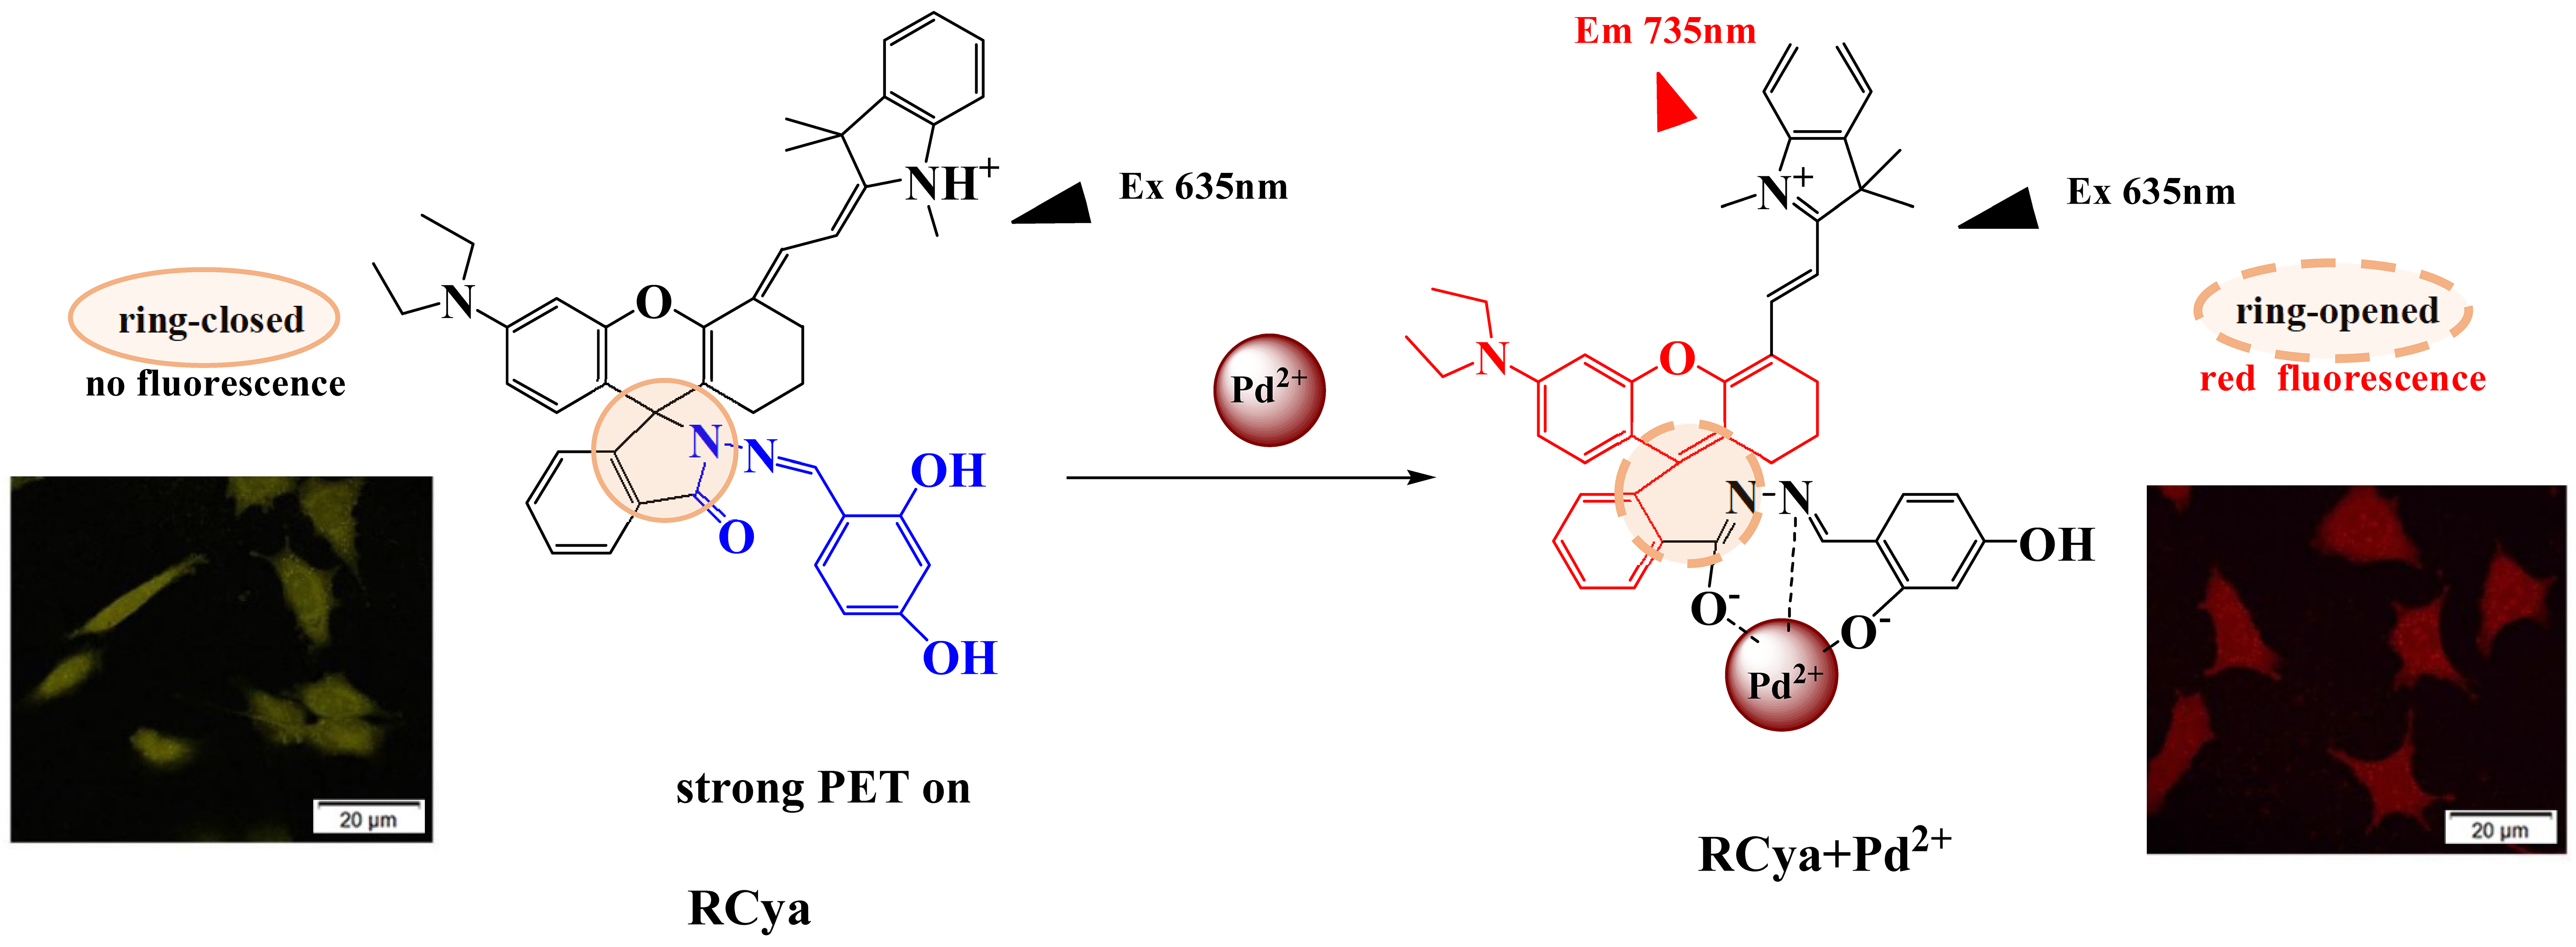
2.2.1. Selectivity and Competition
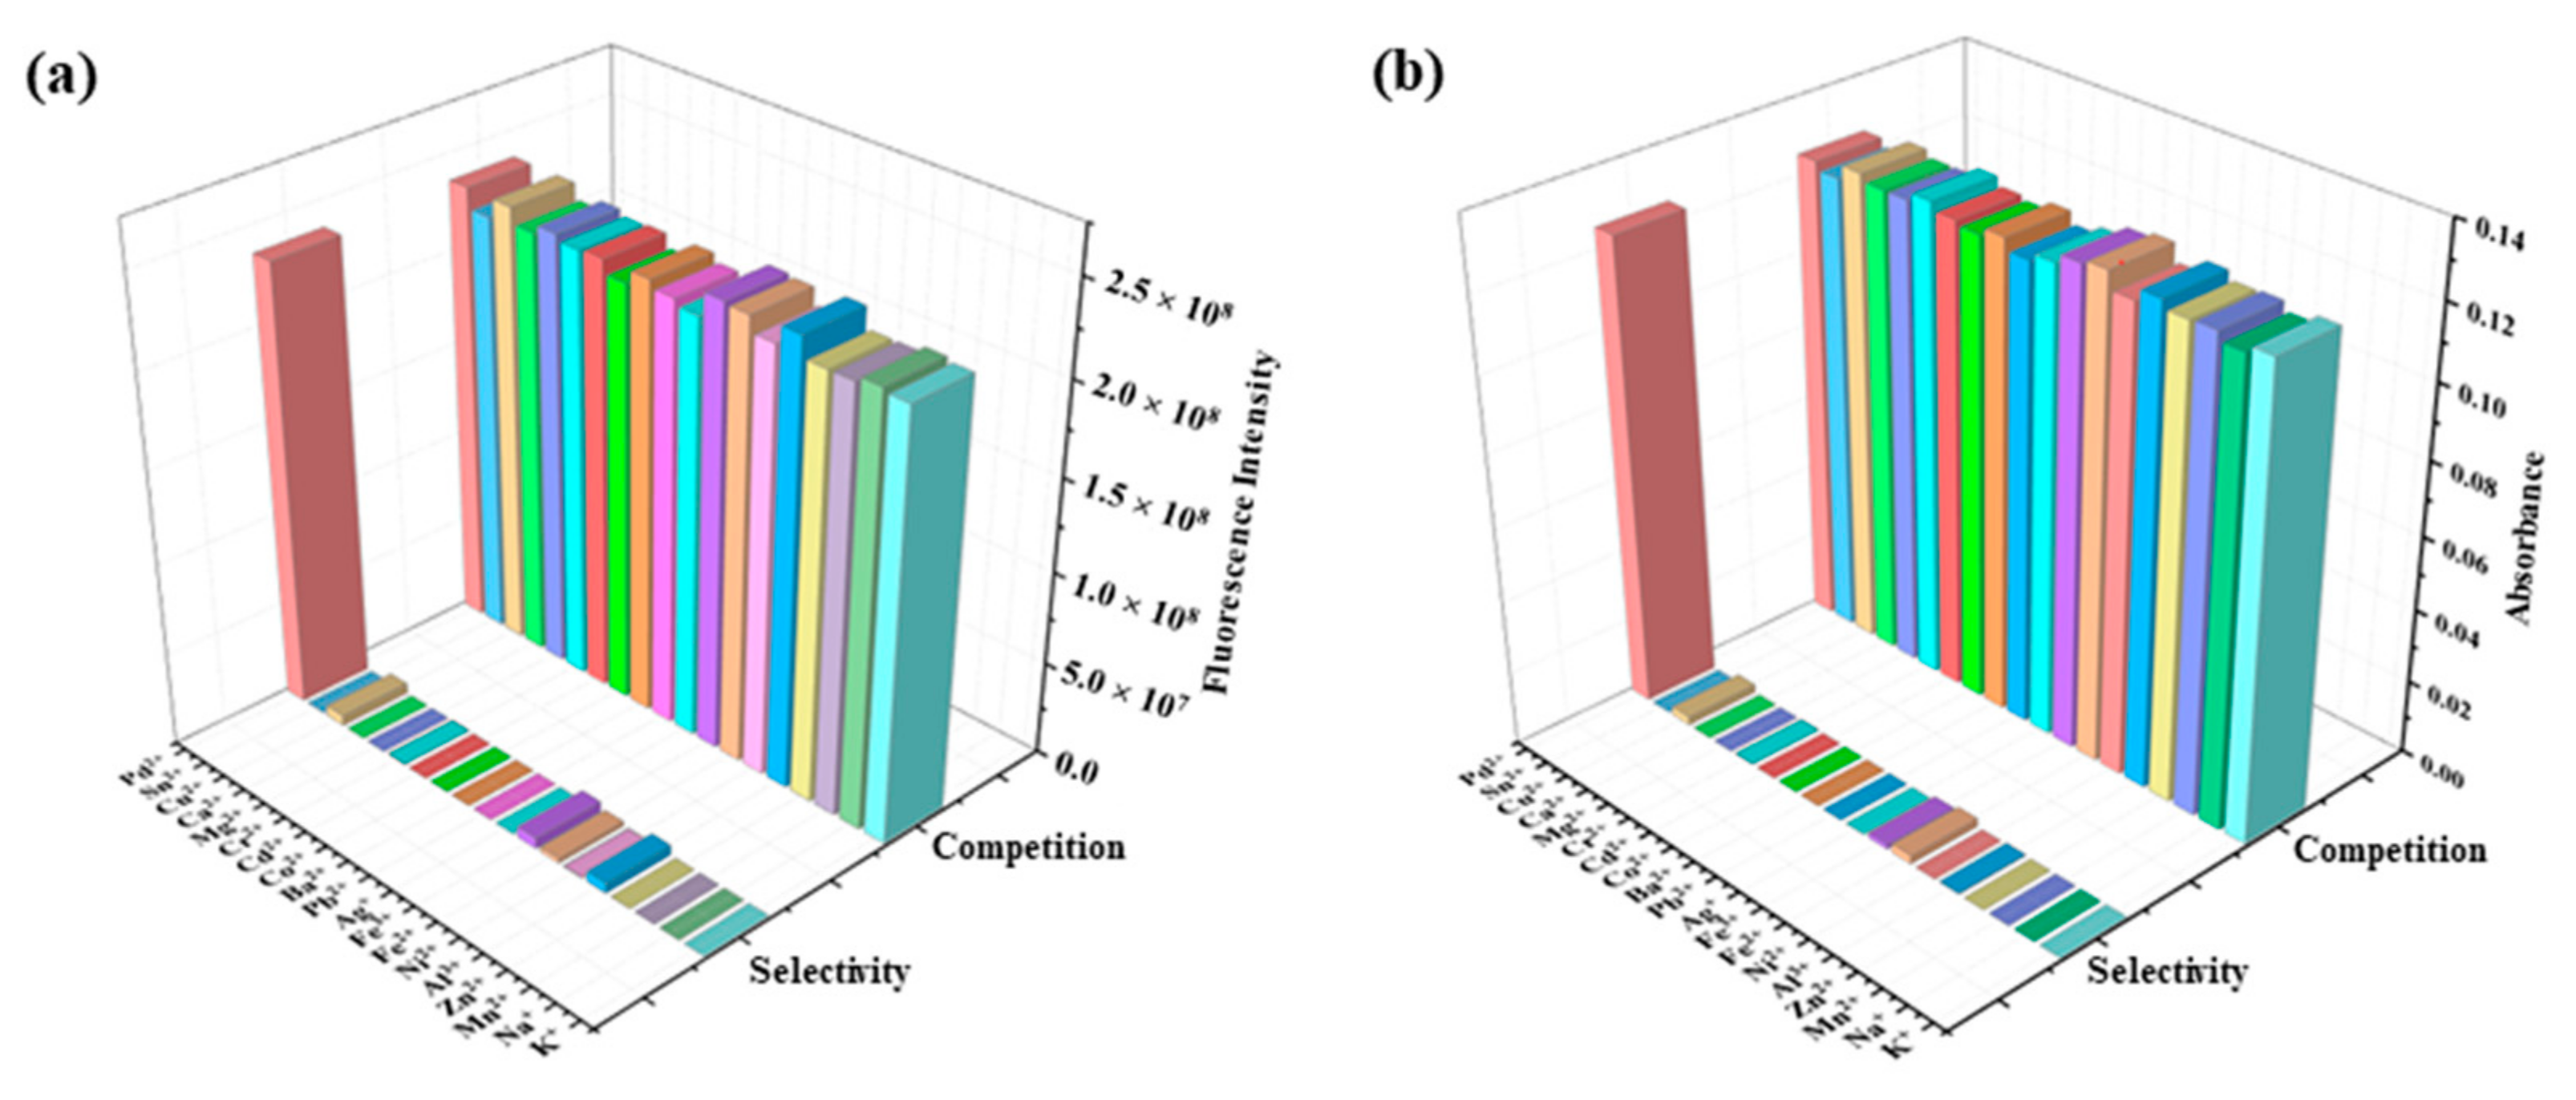
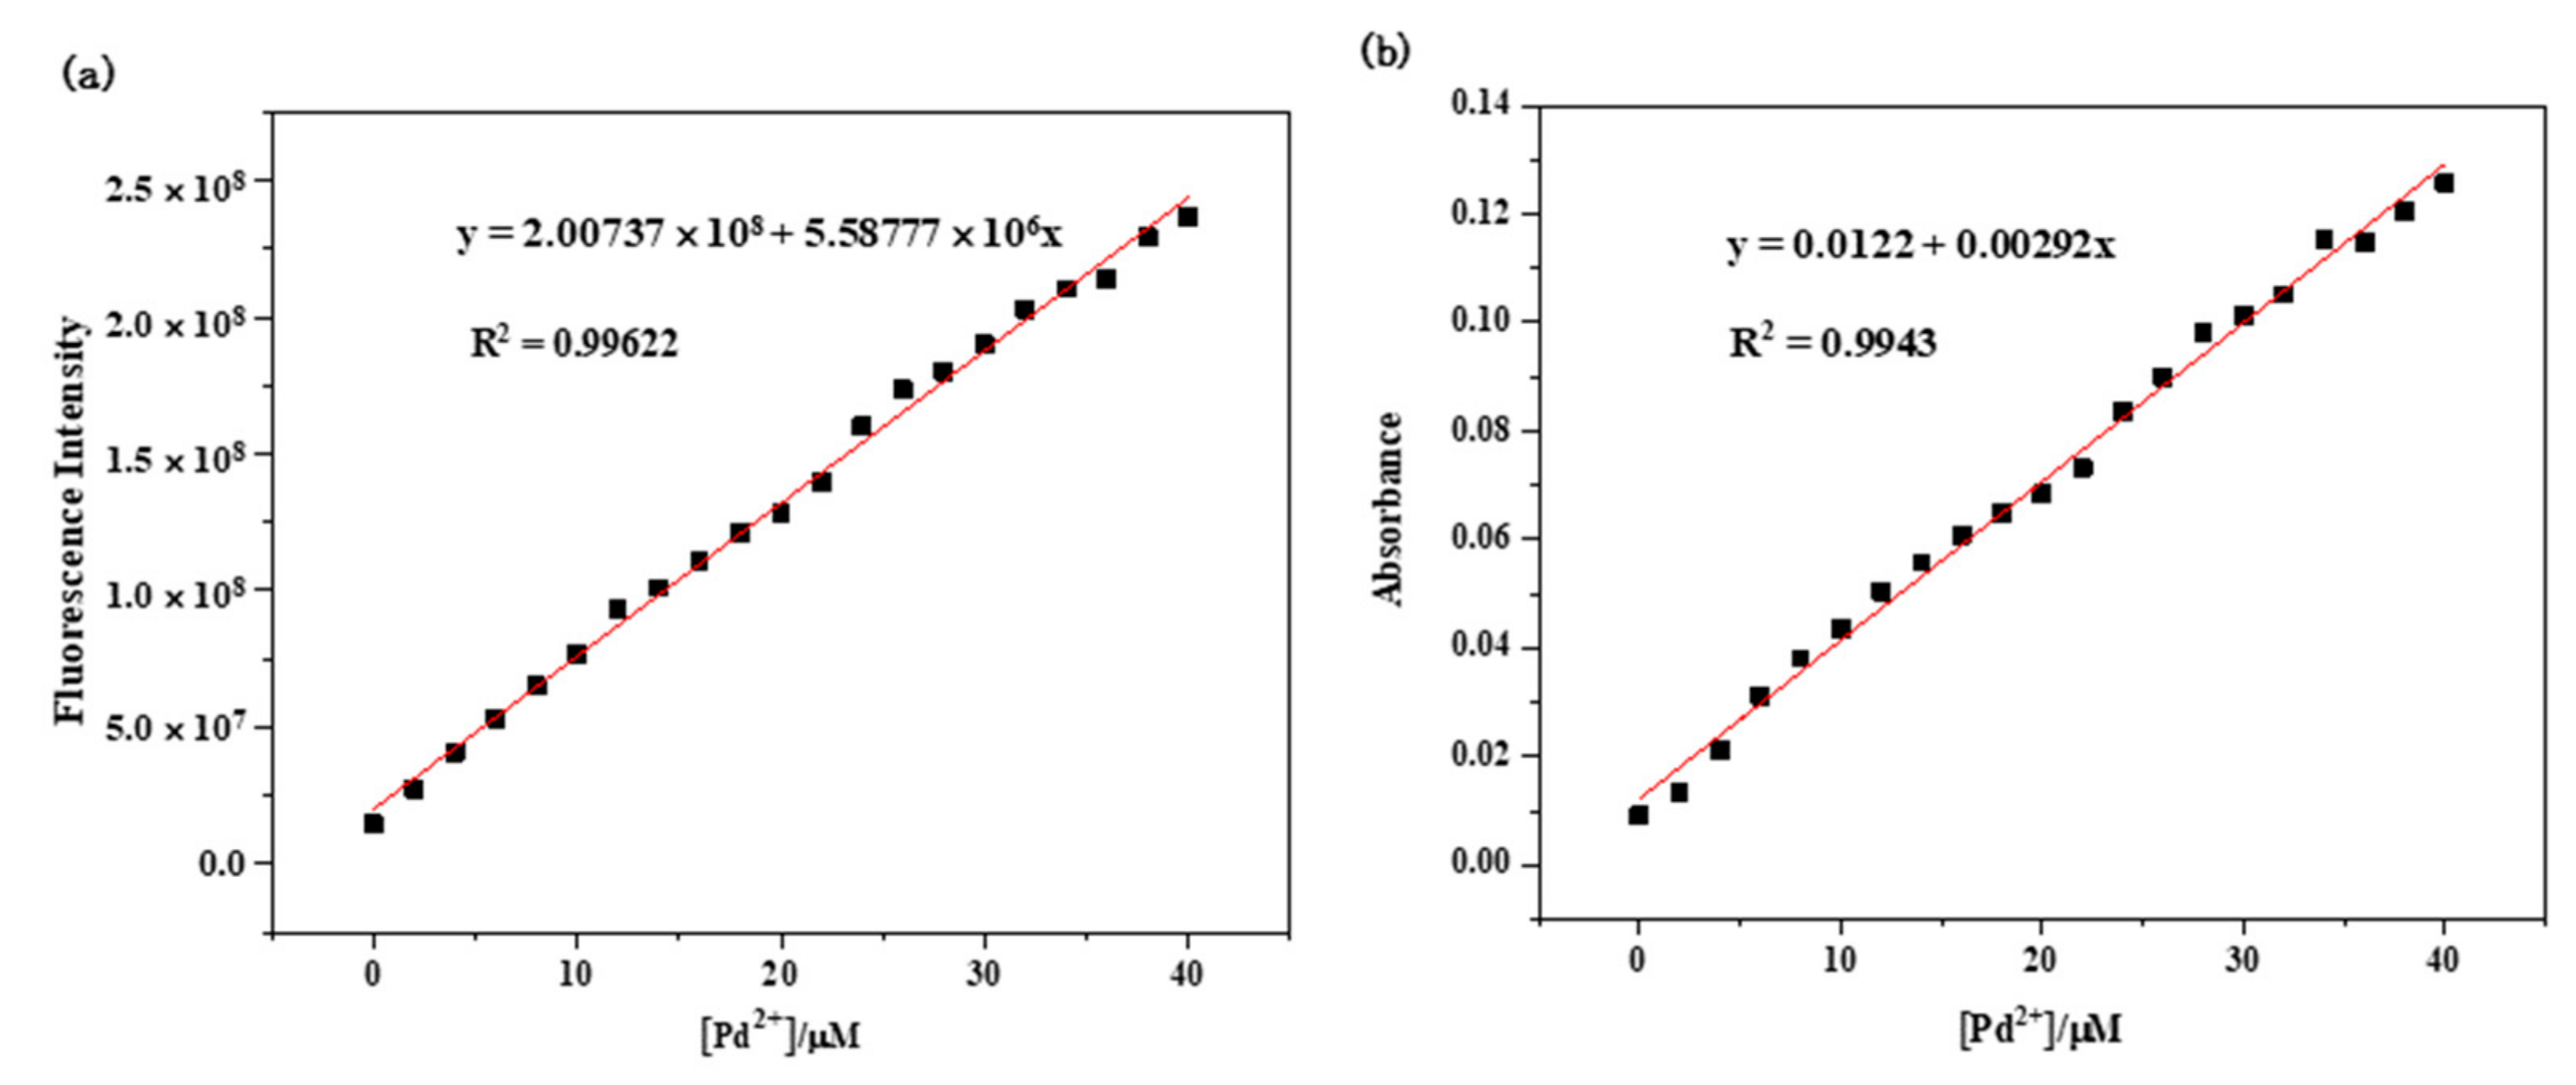
2.2.2. Linear Relationship
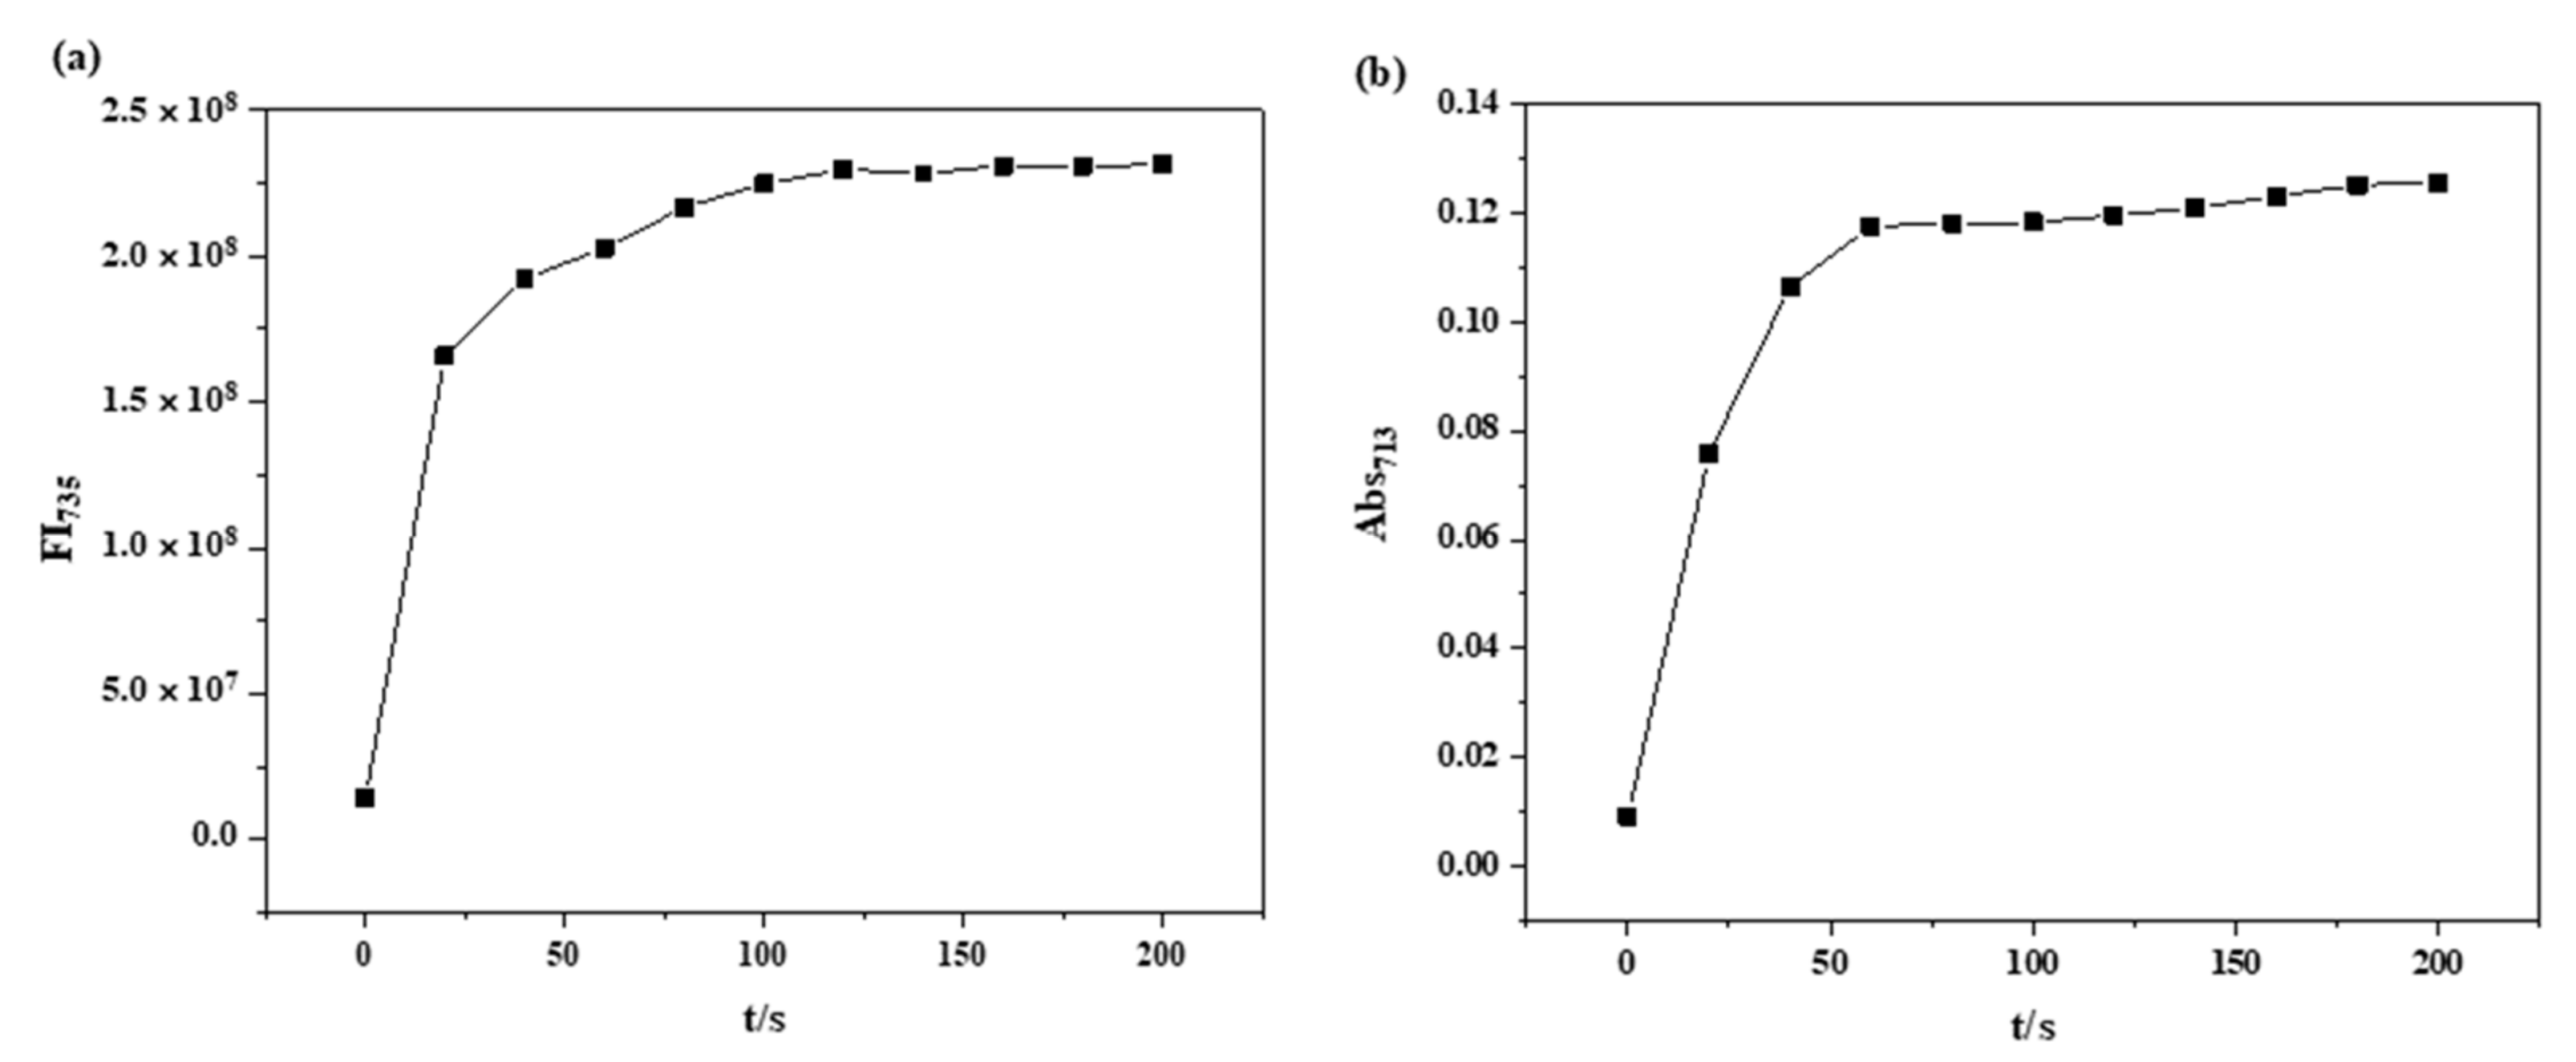
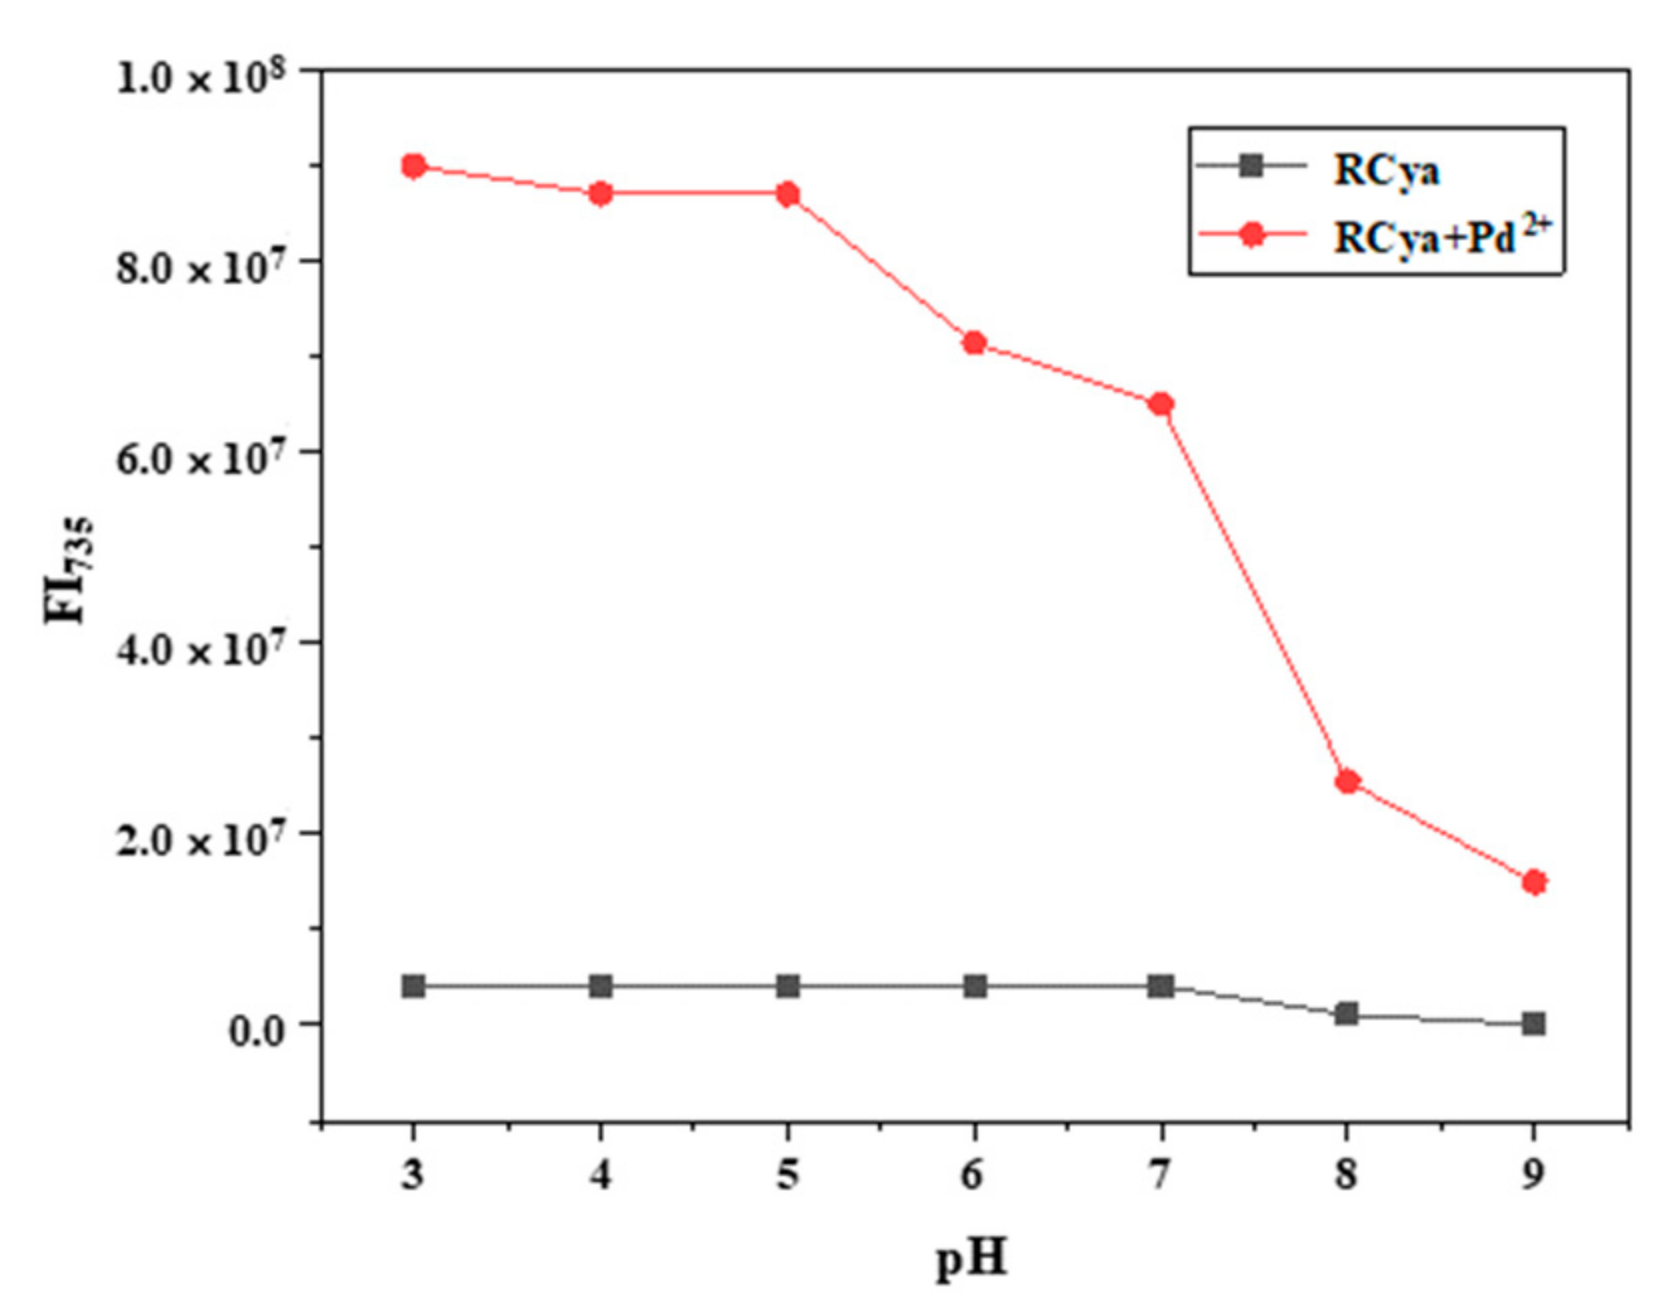
2.2.3. Influence Parameters
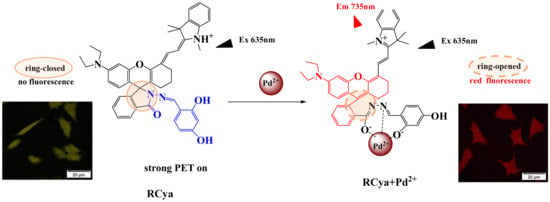
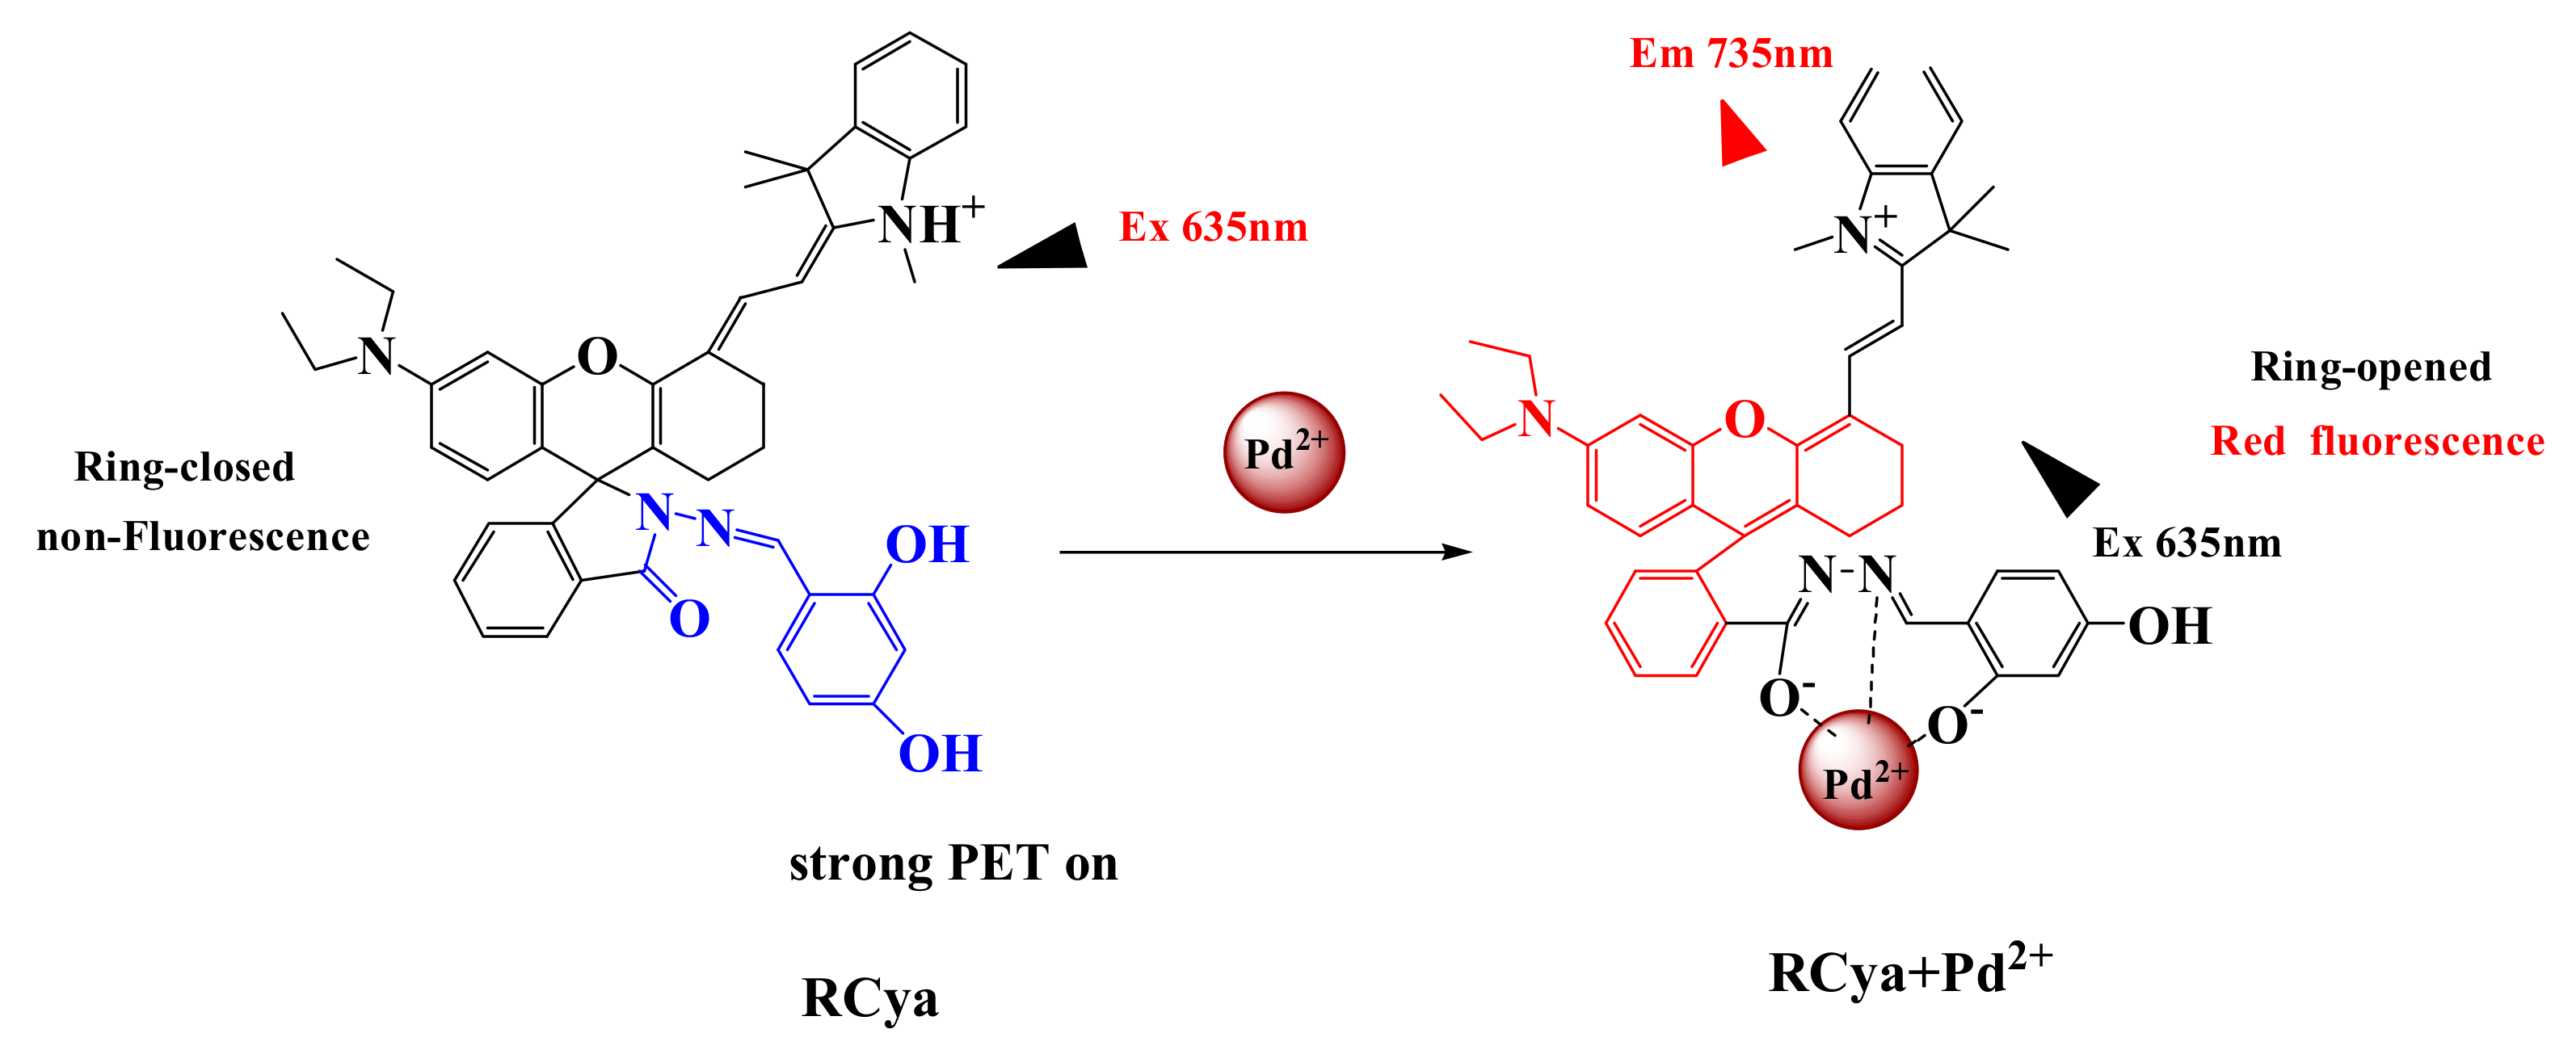
2.3. Mechanism
2.3.1. Proposed Mechanism
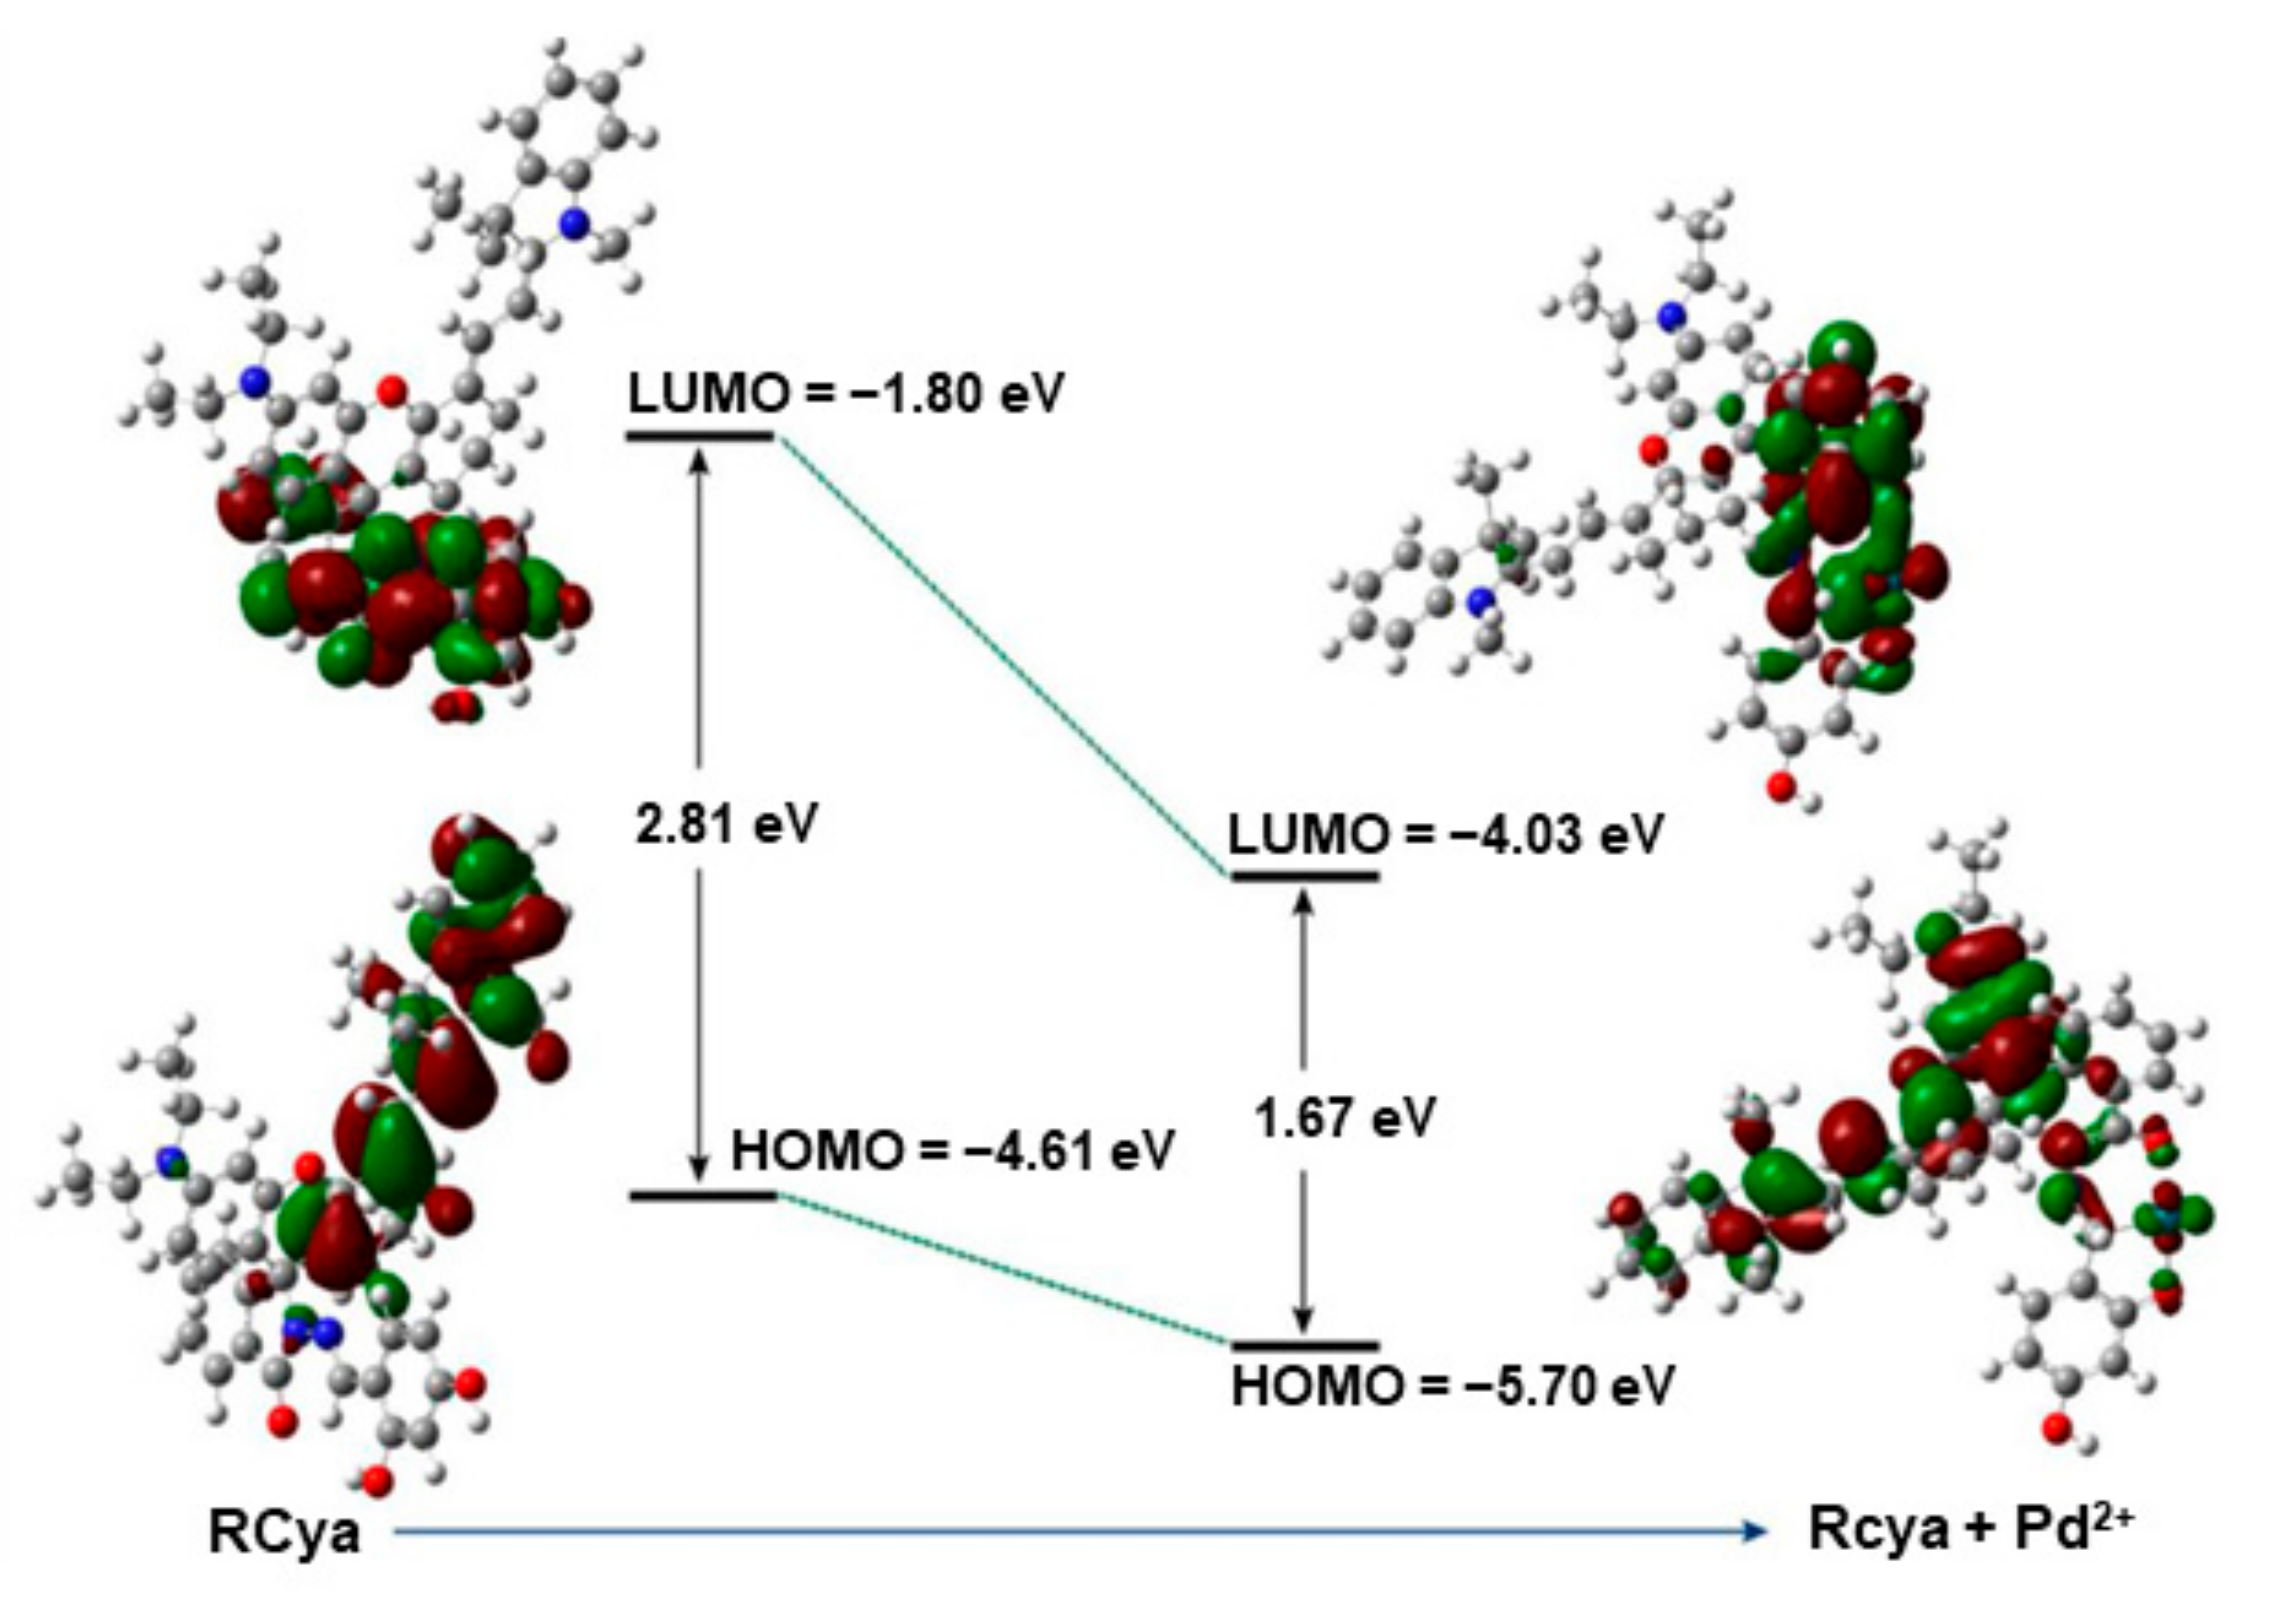
2.3.2. DFT Calculation
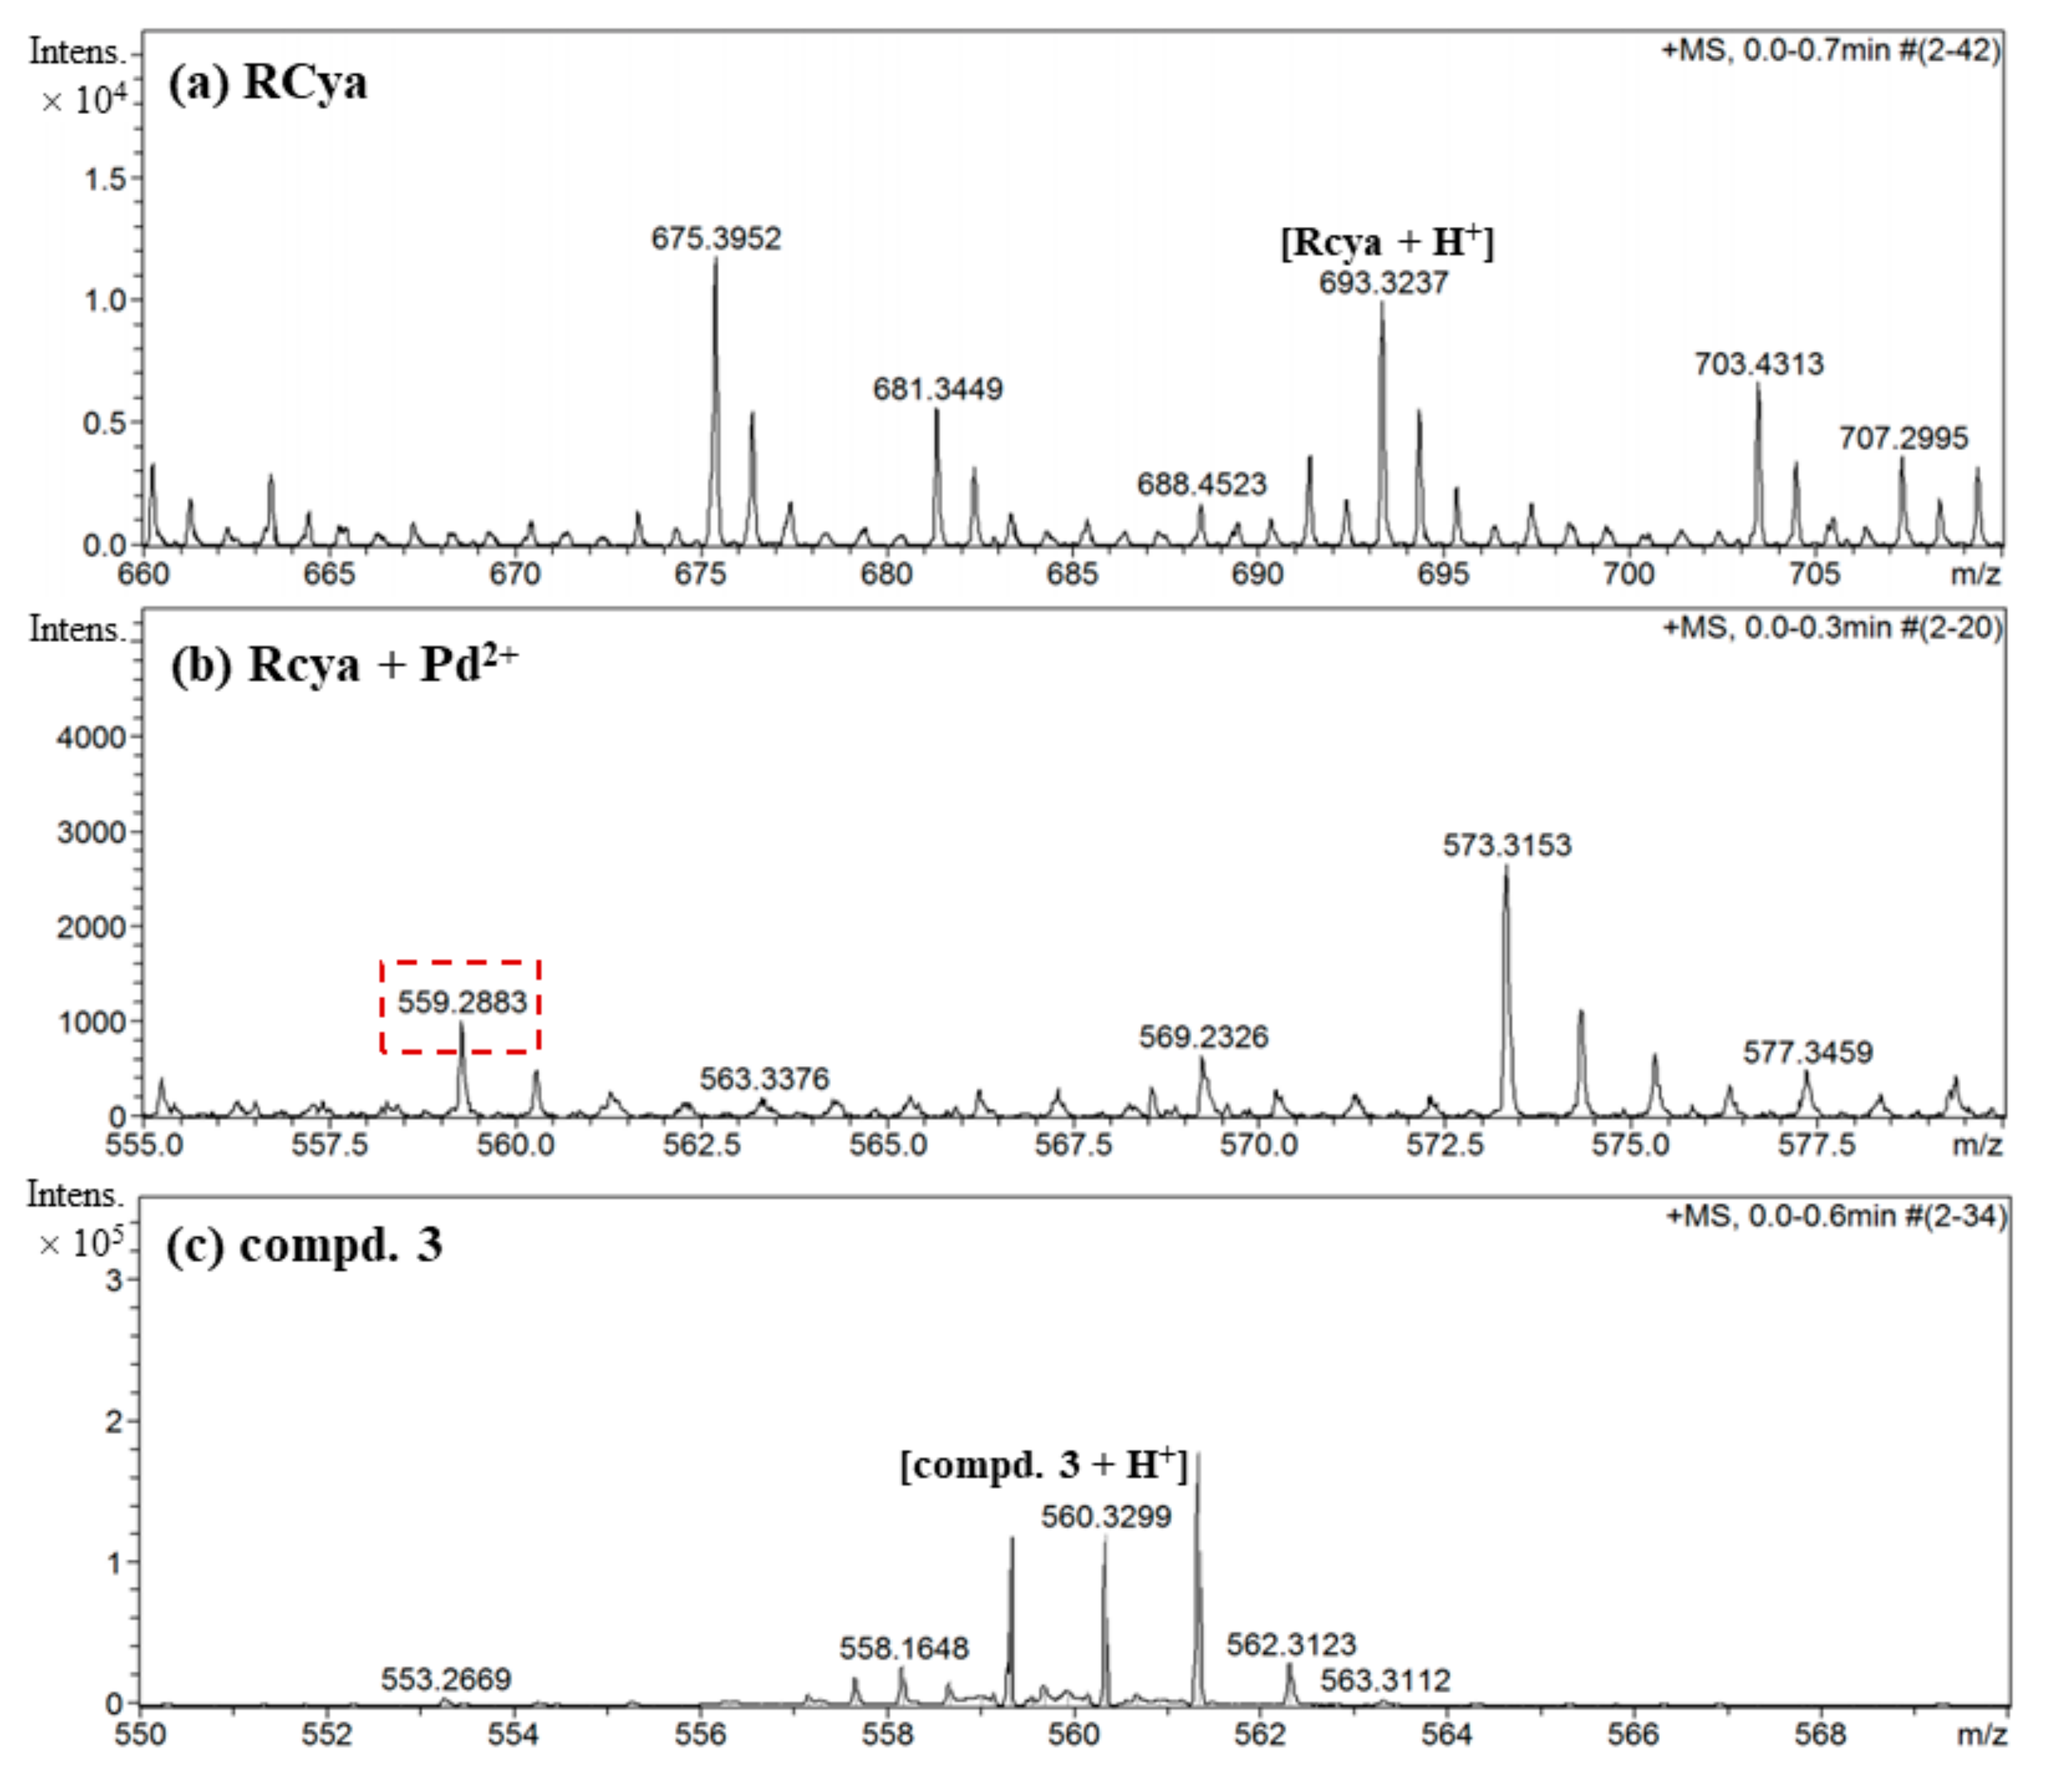
2.3.3. MS Analysis
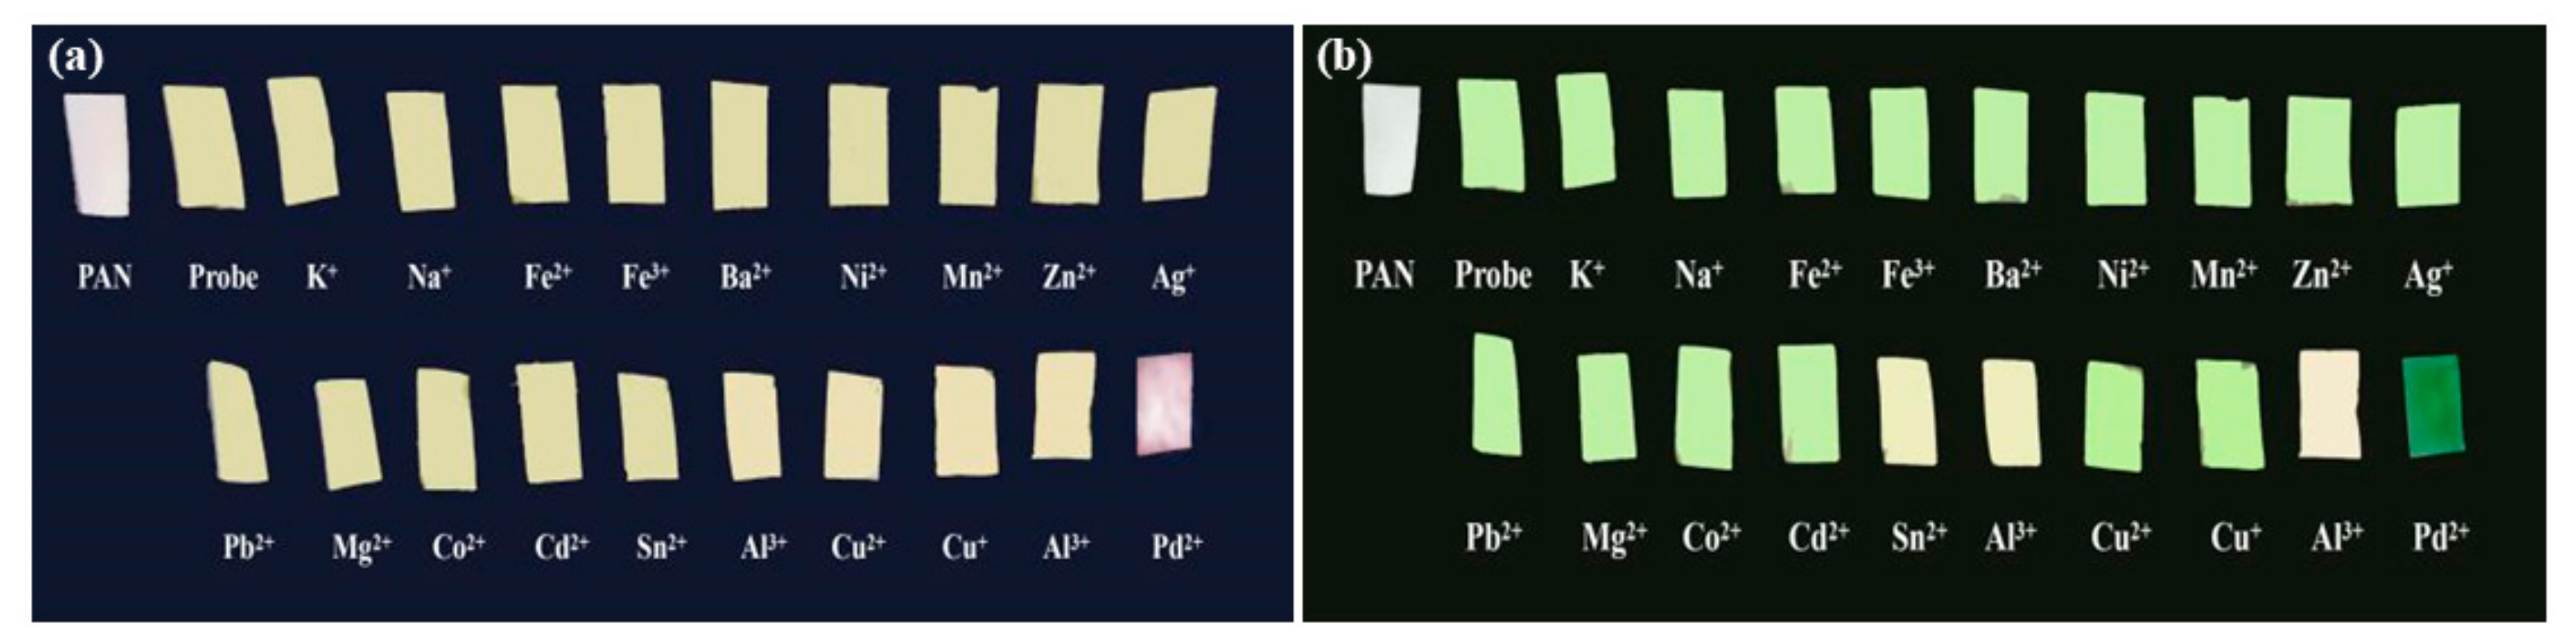
2.4. Nanofiber Imaging Applications
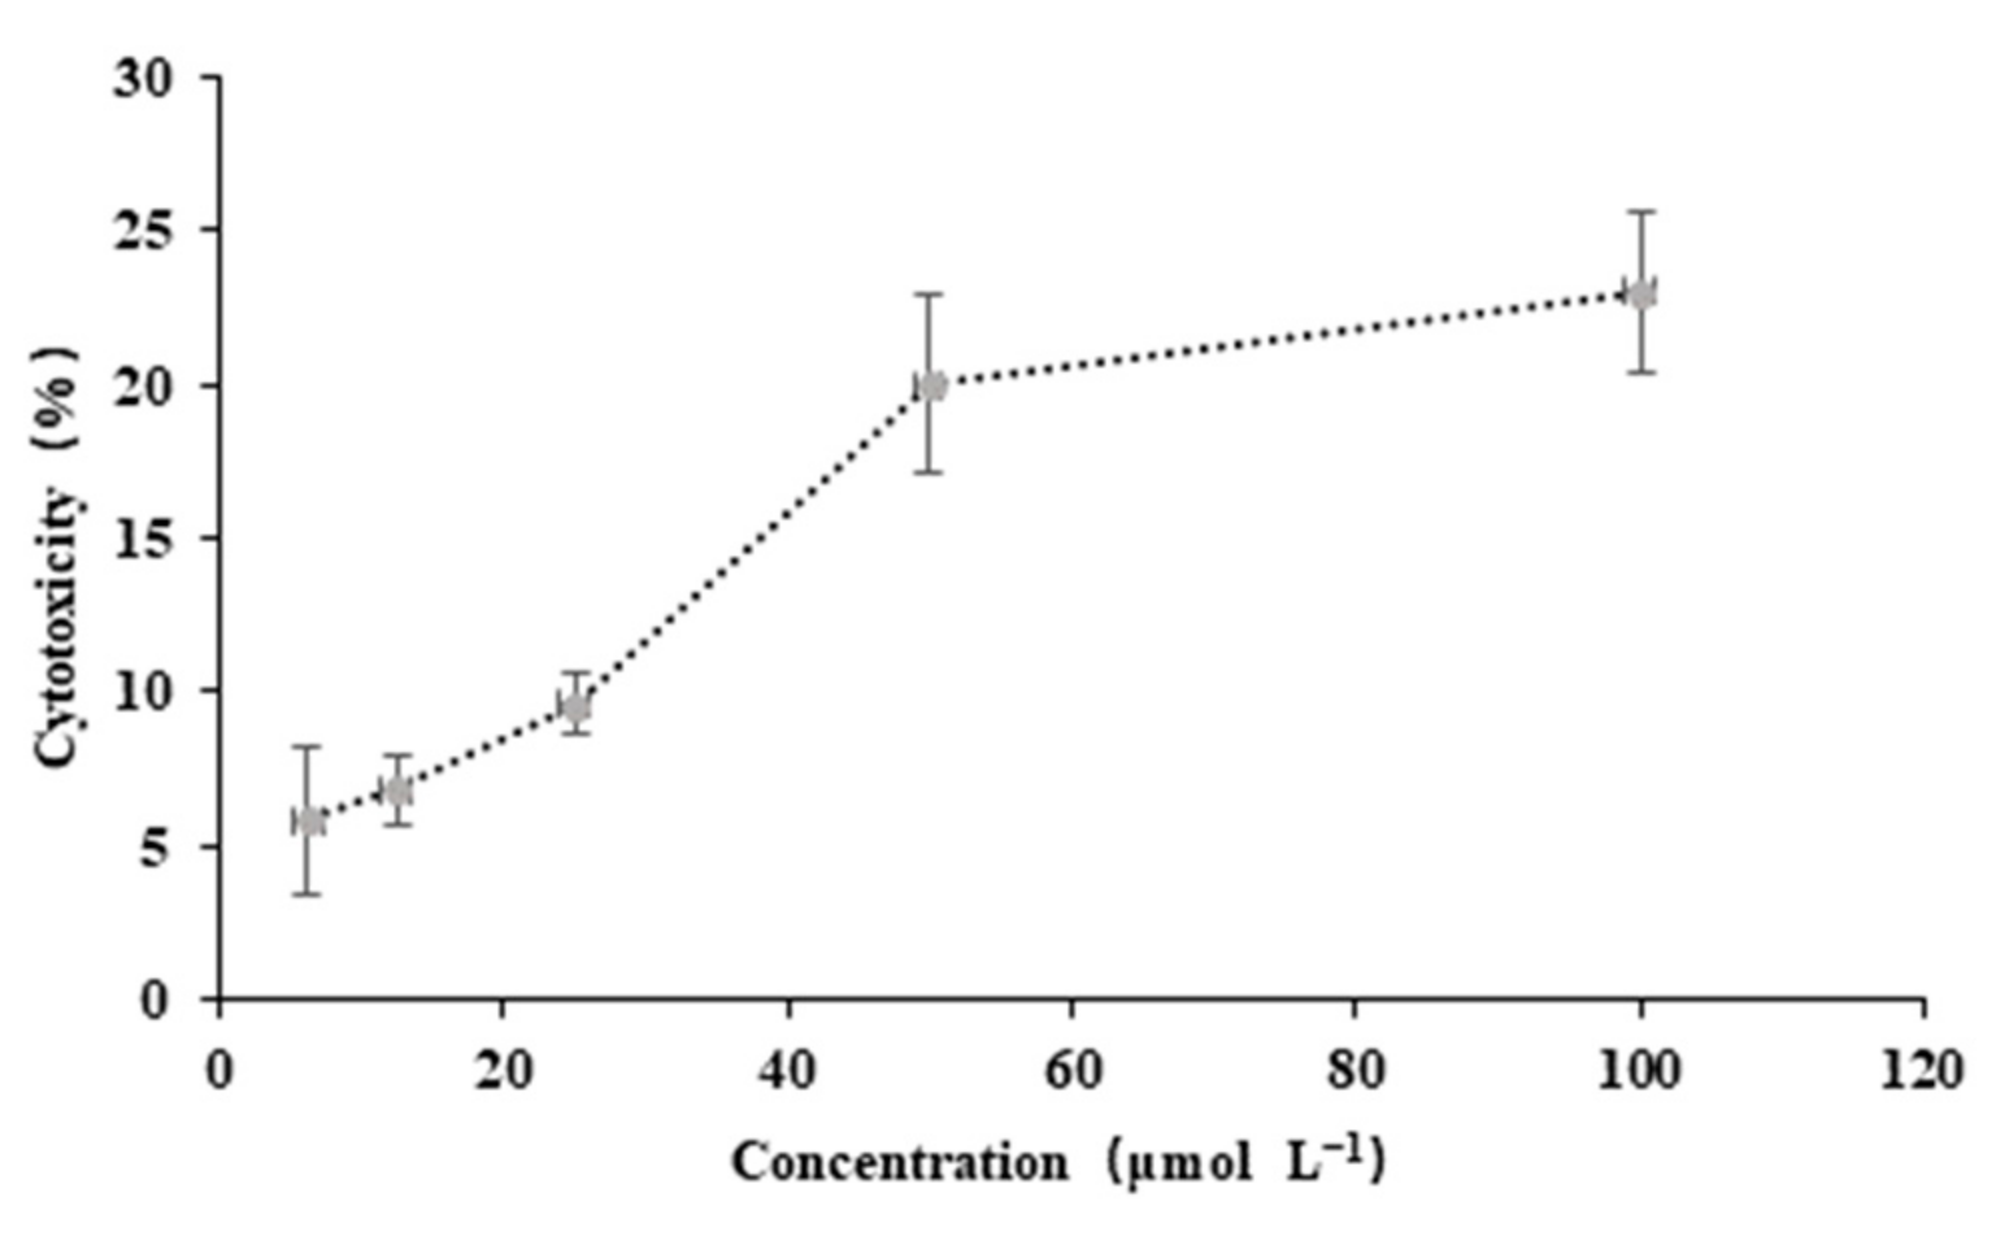
2.5. MTT Assay
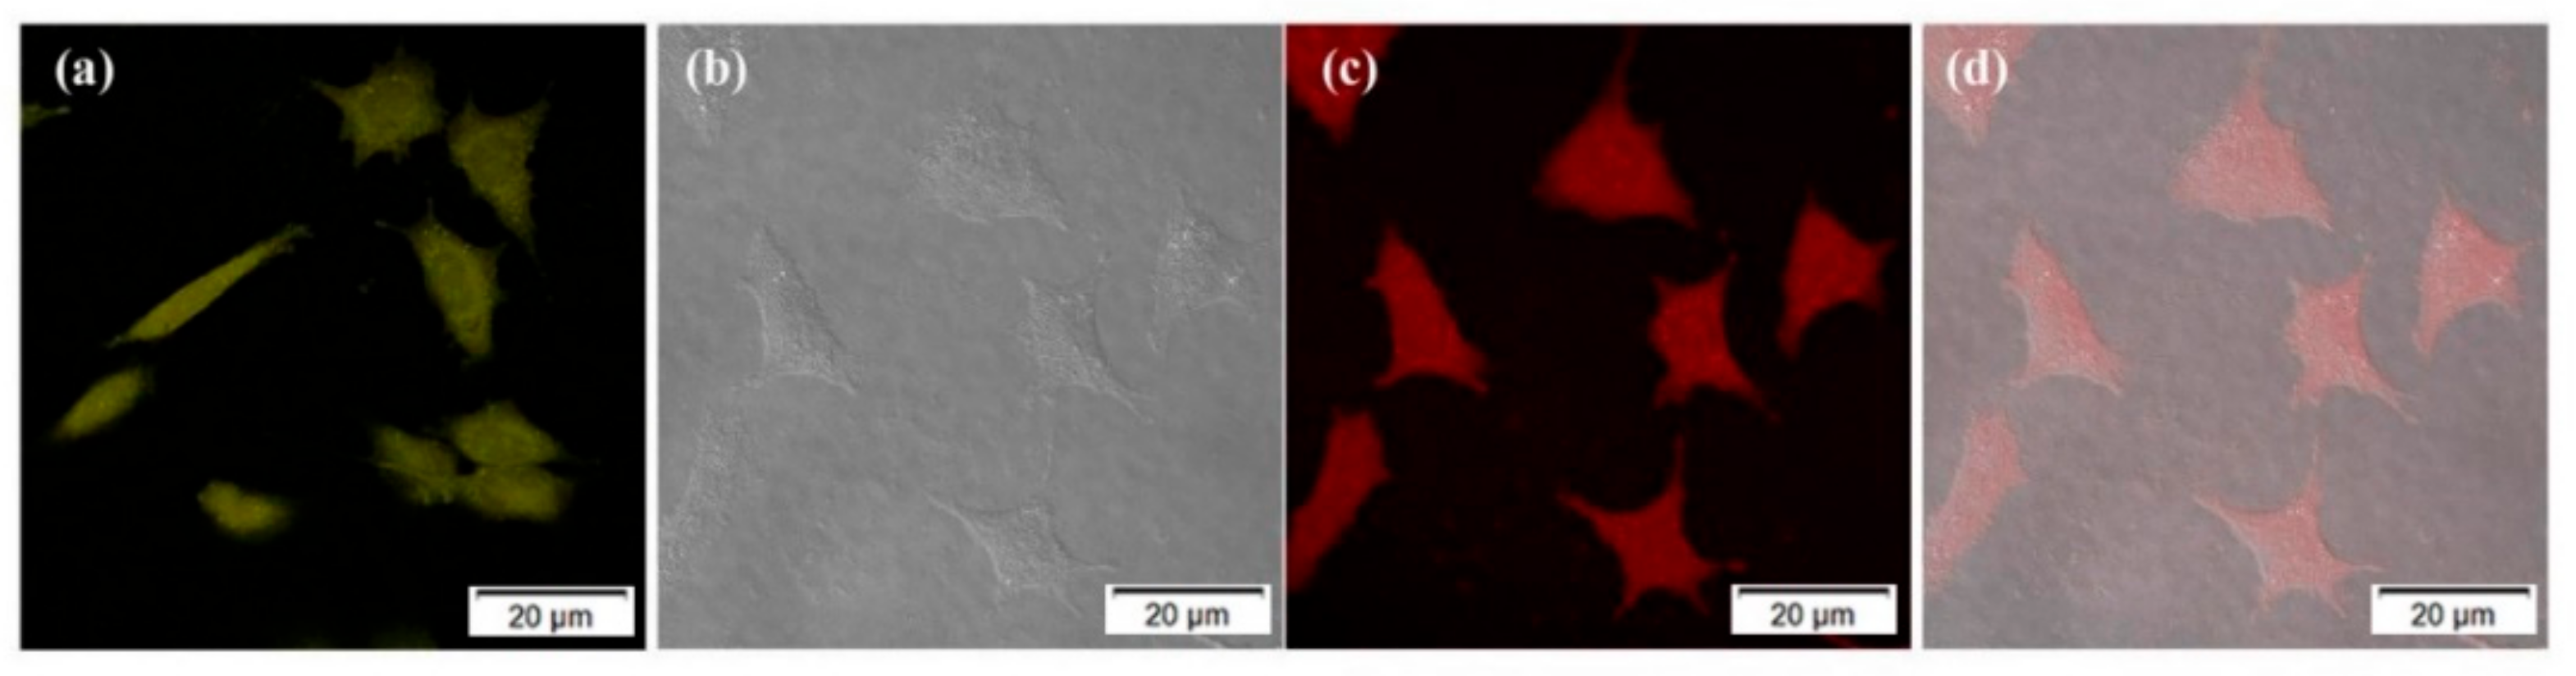
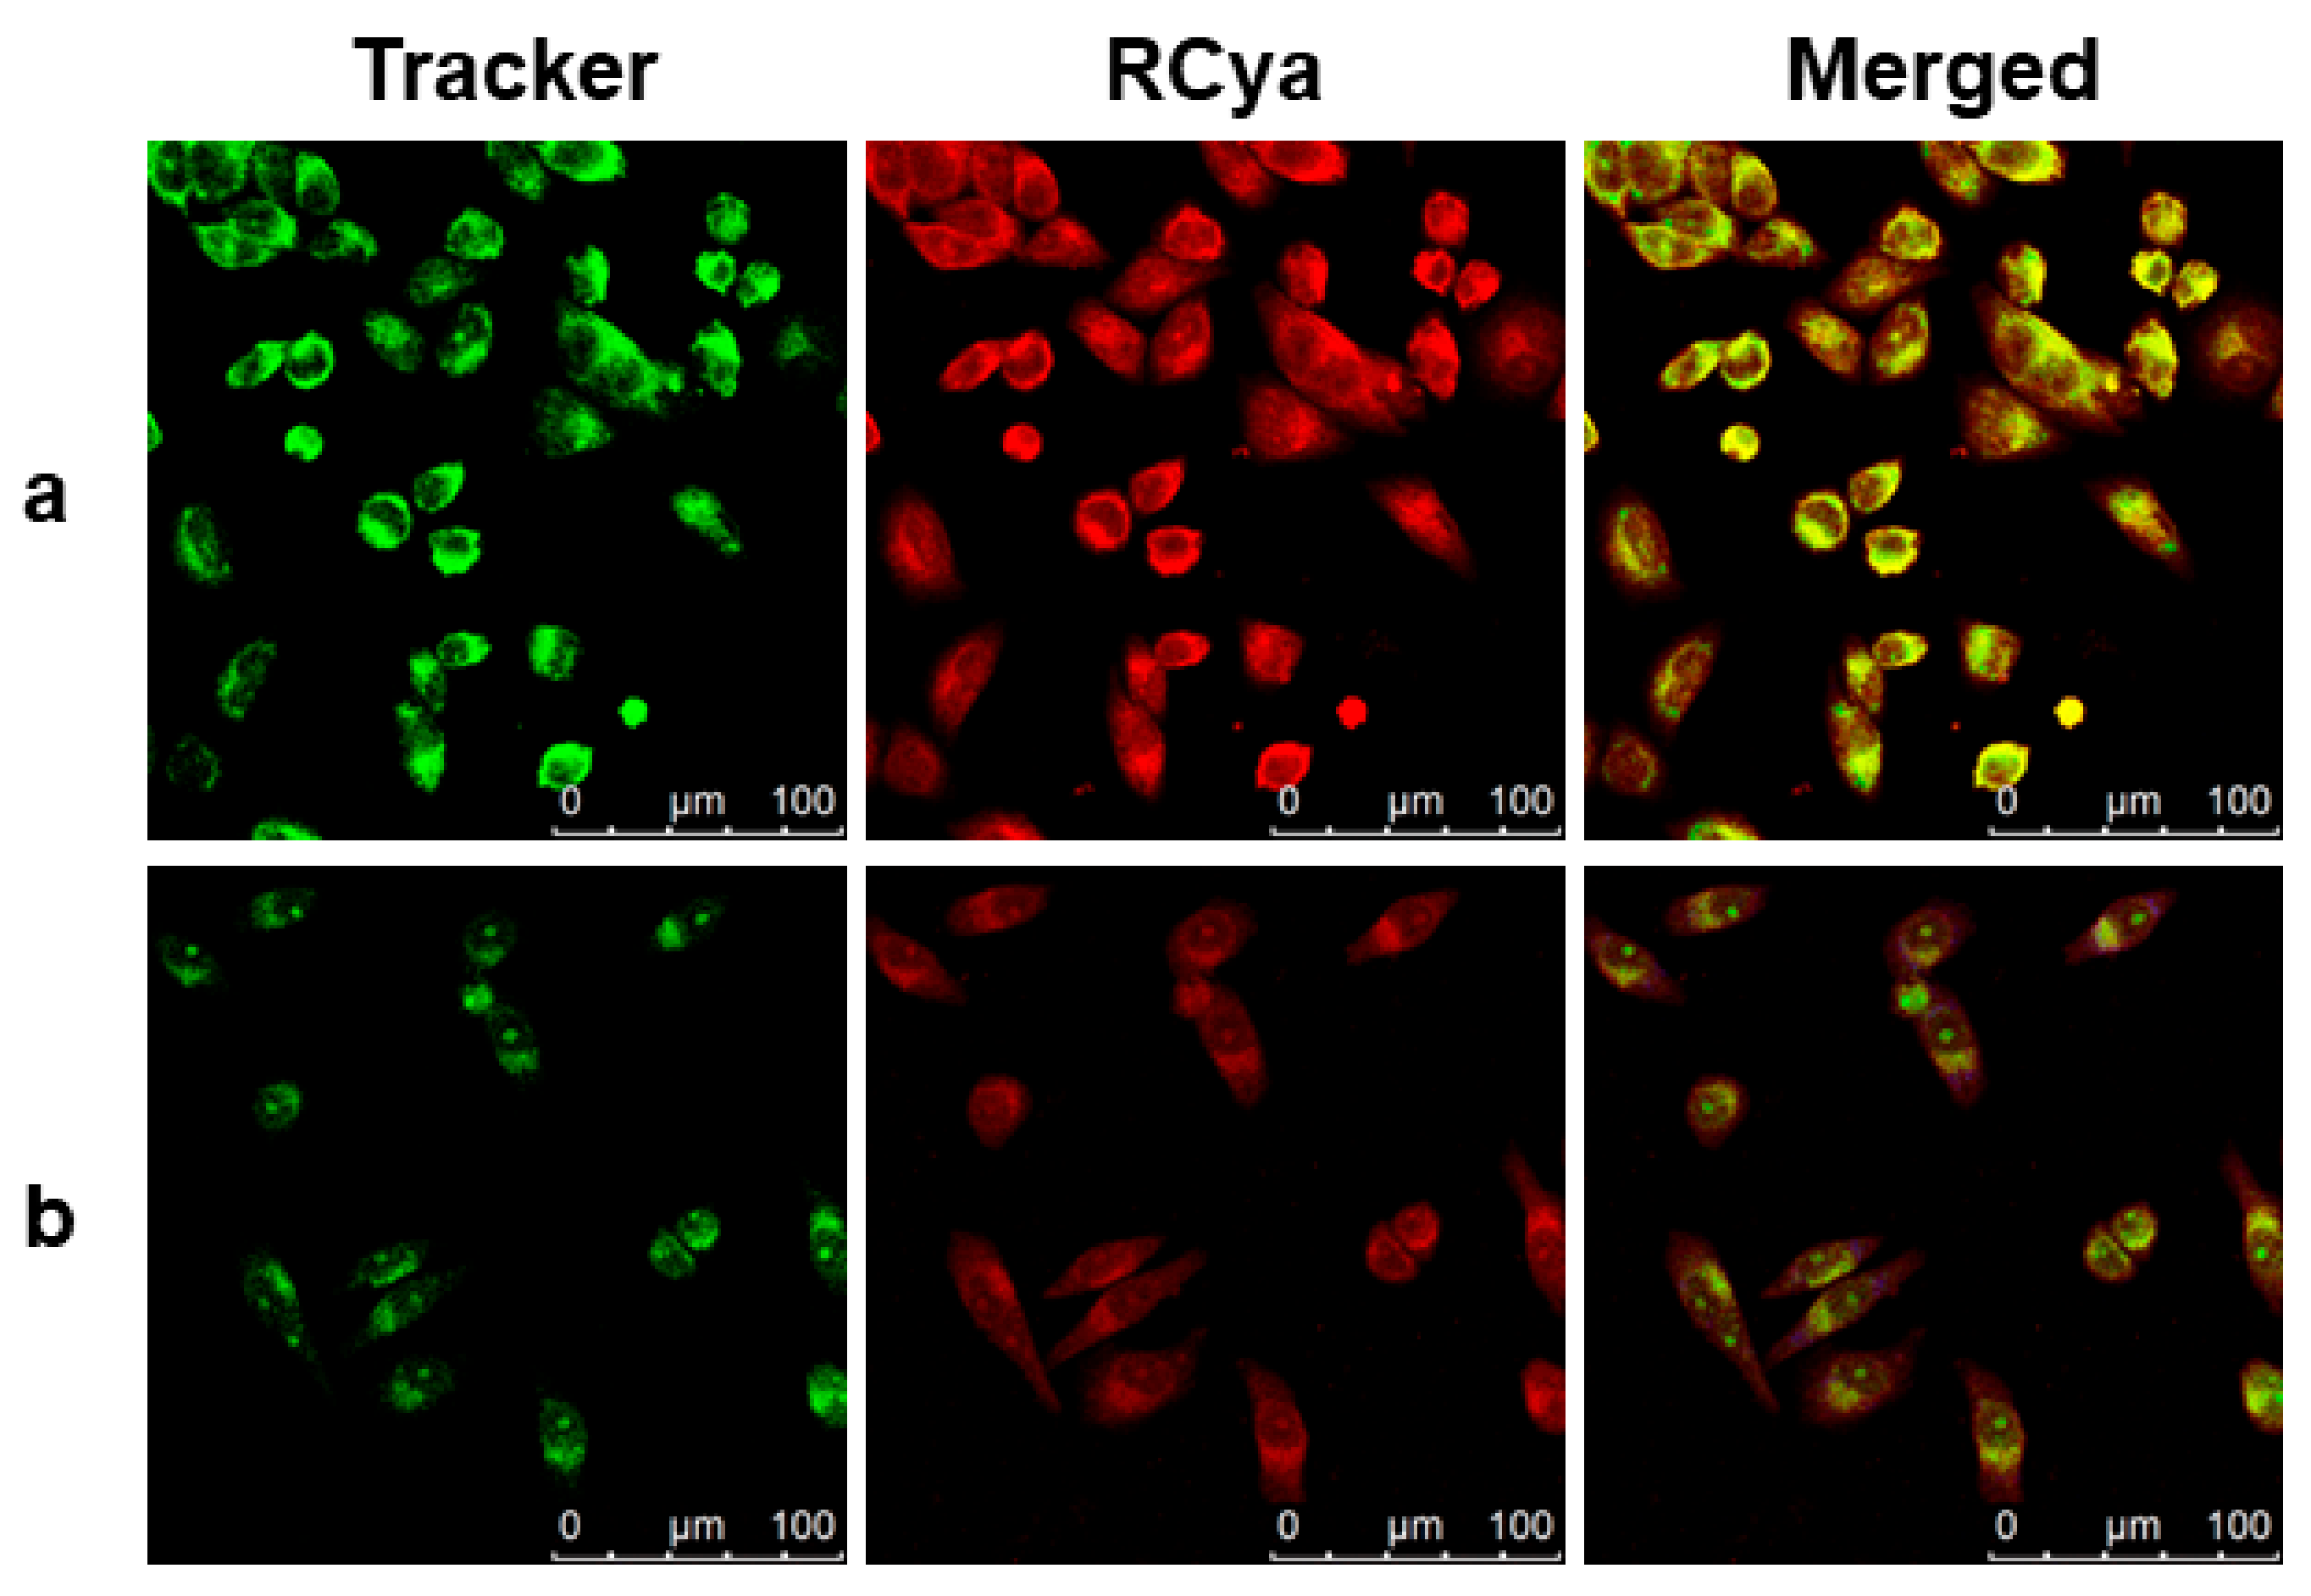
2.6. Bioimaging
3. Discussion
4. Materials and Methods
4.1. Reagents and Equipment
4.2. Synthesis
4.3. Spectroscopic Analysis
4.4. DFT Calculations
4.5. Nanofiber Imaging
4.6. Cytotoxicity
4.7. Fluorescent Imaging in Living Cells
Author Contributions
Funding
Institutional Review Board Statement
Informed Consent Statement
Data Availability Statement
Conflicts of Interest
Sample Availability
References
- Lavado, L.K.; Zhang, M.H.; Patel, K.; Khan, S.; Patel, U.K. Biometals as Potential Predictors of the Neurodegenerative Decline in Alzheimer’s Disease. Cureus 2019, 11, e5573. [Google Scholar] [CrossRef] [PubMed] [Green Version]
- Jing, S.Q.; Wang, S.S.; Zhong, R.M.; Zhang, J.Y.; Wu, J.Z.; Pu, Y.; Yan, L.J. Neuroprotection of Cyperus esculentus L. orientin against cerebral ischemia/reperfusion induced brain injury. Neural Regen. Res. 2020, 15, 548–556. [Google Scholar] [CrossRef] [PubMed]
- Jun, Y.W.; Cho, S.W.; Jung, J.; Huh, Y.; Kim, Y.; Kim, D.; Ahn, K.H. Frontiers in probing Alzheimer’s Disease biomarkers with fluorescent small molecules. ACS Cent. Sci. 2019, 5, 209–217. [Google Scholar] [CrossRef] [PubMed] [Green Version]
- Garrett, C.E.; Prasad, K. The Art of Meeting Palladium Specifications in Active Pharmaceutical Ingredients Produced by Pd-Catalyzed Reactions. Adv. Synth. Catal. 2004, 346, 889–900. [Google Scholar] [CrossRef]
- Luo, W.; Li, J.; Liu, W. A two-photon ratiometric ESIPT probe for fast detection and bioimaging of palladium species. Org. Biomol. Chem. 2017, 15, 5846–5850. [Google Scholar] [CrossRef]
- Wen, J.; Lv, Y.; Xia, P.; Liu, F.; Xu, Y.; Li, H.; Chen, S.S.; Sun, S. A water-soluble near-infrared fluorescent probe for specific Pd2+ detection. Bioorg. Med. Chem. 2018, 26, 931–937. [Google Scholar] [CrossRef]
- Zhou, L.; Wang, Q.; Zhang, X.-B.; Tan, W. Through-bond energy transfer-based ratiometric two-photon probe for fluorescent imaging of Pd2+ ions in living cells and tissues. Anal. Chem. 2015, 87, 4503–4507. [Google Scholar] [CrossRef]
- Luo, W.; Liu, W. A water-soluble colorimetric two-photon probe for discrimination of different palladium species and its application in bioimaging. Dalton Trans. 2016, 45, 11682–11687. [Google Scholar] [CrossRef]
- Zhang, Y.-S.; Balamurugan, R.; Lin, J.-C.; Fitriyani, S.; Liu, J.H.; Emelyanenko, A. Pd2+ fluorescent sensors based on amino and imino derivatives of rhodamine and improvement of water solubility by the formation of inclusion complexes with β-cyclodextrin. Analyst 2017, 142, 1536–1544. [Google Scholar] [CrossRef]
- Zhu, X.; Zhang, Z.; Xue, Z.; Huang, C.; Shan, Y.; Liu, C.; Qin, X.; Yang, W.; Chen, X.; Wang, T. Understanding the selective detection of Fe3+ based on graphene quantum dots as fluorescent probes: The Ksp of a metal hydroxide-assisted mechanism. Anal. Chem. 2017, 89, 12054–12058. [Google Scholar] [CrossRef]
- Kuijpers, K.P.L.; Bottecchia, C.; Cambié, D.; Drummen, K.; König, N.J.; Noël, T. A fully automated continuous-flow platform for fluorescence quenching studies and Stern-Volmer analysis. Angew. Chem. Int. Ed. Eng. 2018, 57, 11278–11282. [Google Scholar] [CrossRef] [Green Version]
- Song, Y.; Pruden, A.; Edwards, M.A.; Rhoads, W.J. Natural organic matter, orthophosphate, pH, and growth phase can limit copper antimicrobial efficacy for legionella in drinking water. Environ. Sci. Technol. 2021, 55, 1759–1768. [Google Scholar] [CrossRef]
- Ning, J.; Wang, W.; Ge, G.; Chu, P.; Long, F.; Yang, Y.; Peng, Y.; Feng, L.; Ma, X.; James, T.D. Target enzyme-activated two-photon fluorescent probes: A case study of CYP3A4 using a two-dimensional design strategy. Angew. Chem. Int. Ed. Engl. 2019, 58, 9959–9963. [Google Scholar] [CrossRef]
- Ning, J.; Liu, T.; Dong, P.; Wang, W.; Ge, G.; Wang, B.; Yu, Z.; Shi, L.; Tian, X.; Huo, X.; et al. Molecular design strategy to construct the near-infrared fluorescent probe for selectively sensing human cytochrome P450 2J2. J. Am. Chem. Soc. 2019, 141, 1126–1134. [Google Scholar] [CrossRef]
- Varadaraju, C.; Paulraj, M.S.; Tamilselvan, G.; Enoch, I.V.M.V.; Srinivasadesikan, V.; Shyi-Long, L. Evaluation of metal ion sensing behaviour of fluorescent probe along with its precursors: PET-CHEF mechanism, molecular logic gate behaviour and DFT studies. J. Incl. Phenom. Macrocycl. Chem. 2019, 95, 79–89. [Google Scholar] [CrossRef]
- Zhang, X.; Zhang, F.; Chai, J.; Yang, B.; Liu, B. A TICT+AIE based fluorescent probe for ultrafast response of hypochlorite in living cells and mouse. Spectrochim. Acta A Mol. Biomol. Spectrosc. 2021, 256, 119735. [Google Scholar] [CrossRef]
- Seyedi, S.; Parvin, P.; Jafargholi, A.; Abbasian, A.; Mehdinejad, M.; Khorrami, A.; Mehrabi, M.; Moafi, A. Fluorescence emission quenching of RdB fluorophores in attendance of various blood type RBCs based on Stern-Volmer formalism. Spectrochim. Acta A Mol. Biomol. Spectrosc. 2021, 248, 119237. [Google Scholar] [CrossRef]
- Lai, J.; Zhou, H.; Jin, Z.; Li, S.; Liu, H.; Jin, X.; Luo, C.; Ma, A.; Chen, W. Highly stretchable, fatigue-resistant, electrically conductive, and temperature-tolerant ionogels for high-performance flexible sensors. ACS Appl. Mater. Interfaces 2019, 11, 26412–26420. [Google Scholar] [CrossRef]
- Zhou, L.; Hu, S.; Wang, H.; Sun, H.; Zhang, X. A novel ratiometric two-photon fluorescent probe for imaging of Pd2+ ions in living cells and tissues. Spectrochim. Acta Part A 2016, 166, 25–30. [Google Scholar] [CrossRef]
- Hassan, S.A.E.; Ahmed, S.A.E.; Helmy, A.H.; Youssef, N.F. Spectrofluorimetric study on fluorescence quenching of tyrosine and l-tryptophan by the aniracetam cognition enhancer drug: Quenching mechanism using Stern-Volmer and double-log plots. Luminescence 2020, 35, 728–737. [Google Scholar] [CrossRef]
- Toprak, M. Fluorescence study on the interaction of human serum albumin with Butein in liposomes. Spectrochim. Acta Part A 2016, 154, 108–113. [Google Scholar] [CrossRef] [PubMed]
- Sun, Y.; Wei, S.; Zhao, Y.; Hu, X.; Fan, J. Characterization of the interaction between 4-(tetrahydro-2-furanmethoxy)-N-octadecyl-1,8-naphthalimide and human serum albumin by molecular spectroscopy and its analytical application. Appl. Spectrosc. 2012, 66, 464–469. [Google Scholar] [CrossRef] [PubMed]
- Freixa, Z.; Rivilla, I.; Monrabal, F.; Gómez-Cadenas, J.J.; Cossío, F.P. Bicolour fluorescent molecular sensors for cations: Design and experimental validation. Phys. Chem. Chem. Phys. 2021, 23, 15440–15457. [Google Scholar] [CrossRef] [PubMed]
- Tian, X.; Murfin, L.C.; Wu, L.; Lewis, S.E.; James, T.D. Fluorescent small organic probes for biosensing. Chem. Sci. 2021, 12, 3406–3426. [Google Scholar] [CrossRef] [PubMed]
- Xie, J.-Y.; Li, C.-Y.; Li, Y.-F.; Fei, J.; Xu, F.; Ou-Yang, J.; Liu, J. Near-infrared fluorescent probe with high quantum yield and its application in the selective detection of glutathione in living cells and tissues. Anal. Chem. 2016, 88, 9746–9752. [Google Scholar] [CrossRef]
- Sugi, Y.; Premkumar, S.; Joseph, S.; Ramadass, K.; Sathish, C.I.; Dasireddy, V.D.B.C.; Yang, J.-H.; Liu, Q.; Kuota, Y.; Vinu, A. Substitutional isomerism of triisopropylnaphthalenes in the isopropylation of naphthalene. Assignment by gas chromatography and confirmation by DFT calculation. Res. Chem. Intermed. 2022, 48, 869–884. [Google Scholar] [CrossRef]
- Tian, M.; He, H.; Wang, B.B.; Wang, X.; Liu, Y.; Jiang, F.L. A reaction-based turn-on fluorescent sensor for the detection of Cu(II) with excellent sensitivity and selectivity: Synthesis, DFT calculations, kinetics and application in real water samples. Dyes Pigm. 2019, 165, 383–390. [Google Scholar] [CrossRef]
- Savran, T.; Karuk Elmas, S.N.; Aydin, D.; Arslan, S.; Arslan, F.N.; Yilmaz, I. Design of multiple-target chemoprobe: “naked-eye” colorimetric recognition of Fe3+ and off–on fluorogenic detection for Hg2+ and its on-site applications. Res. Chem. Intermed. 2022, 48, 1003–1023. [Google Scholar] [CrossRef]
- Li, S.; Zhao, B.; Kan, W.; Wang, L.; Song, B.; Chen, S. A off–on pH fluorescence probe derived from phenanthro[9,10-d]imidazol-fluorescein based on ESIPT and ICT. Res. Chem. Intermed. 2018, 44, 491–502. [Google Scholar] [CrossRef]
- Palanisamy, S.; Wang, Y.L.; Chen, Y.J.; Chen, C.Y.; Tsai, F.T.; Liaw, W.F.; Wang, Y.M. In vitro and in vivo imaging of nitroxyl with copper fluorescent probe in living cells and zebrafish. Molecules 2018, 23, 2551. [Google Scholar] [CrossRef] [Green Version]
- Yi, X.Q.; He, Y.F.; Cao, Y.S.; Shen, W.X.; Lv, Y.Y. Porphyrinic probe for fluorescence “turn-on” monitoring of Cu+ in aqueous buffer and mitochondria. ACS Sens. 2019, 4, 856–864. [Google Scholar] [CrossRef]


Disclaimer/Publisher’s Note: The statements, opinions and data contained in all publications are solely those of the individual author(s) and contributor(s) and not of MDPI and/or the editor(s). MDPI and/or the editor(s) disclaim responsibility for any injury to people or property resulting from any ideas, methods, instructions or products referred to in the content. |
© 2023 by the authors. Licensee MDPI, Basel, Switzerland. This article is an open access article distributed under the terms and conditions of the Creative Commons Attribution (CC BY) license (https://creativecommons.org/licenses/by/4.0/).
Share and Cite
Cheng, Z.; Jin, X.; Liu, Y.; Zhang, X. A PET Fluorescent Probe for Dynamic Pd2+ Tracking with Imaging Applications in the Nanofiber and Living Cells. Molecules 2023, 28, 3065. https://doi.org/10.3390/molecules28073065
Cheng Z, Jin X, Liu Y, Zhang X. A PET Fluorescent Probe for Dynamic Pd2+ Tracking with Imaging Applications in the Nanofiber and Living Cells. Molecules. 2023; 28(7):3065. https://doi.org/10.3390/molecules28073065
Chicago/Turabian StyleCheng, Zhao, Xilang Jin, Yinggang Liu, and Xuejiao Zhang. 2023. "A PET Fluorescent Probe for Dynamic Pd2+ Tracking with Imaging Applications in the Nanofiber and Living Cells" Molecules 28, no. 7: 3065. https://doi.org/10.3390/molecules28073065