
Bioactive Compounds, Antioxidant Activities, and HPLC Analysis of Nine Edible Sprouts in Cambodia
 ,
,  and
and
Abstract
:
1. Introduction
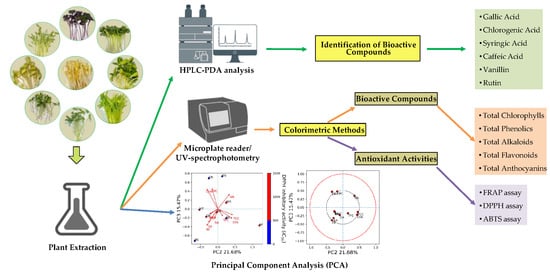
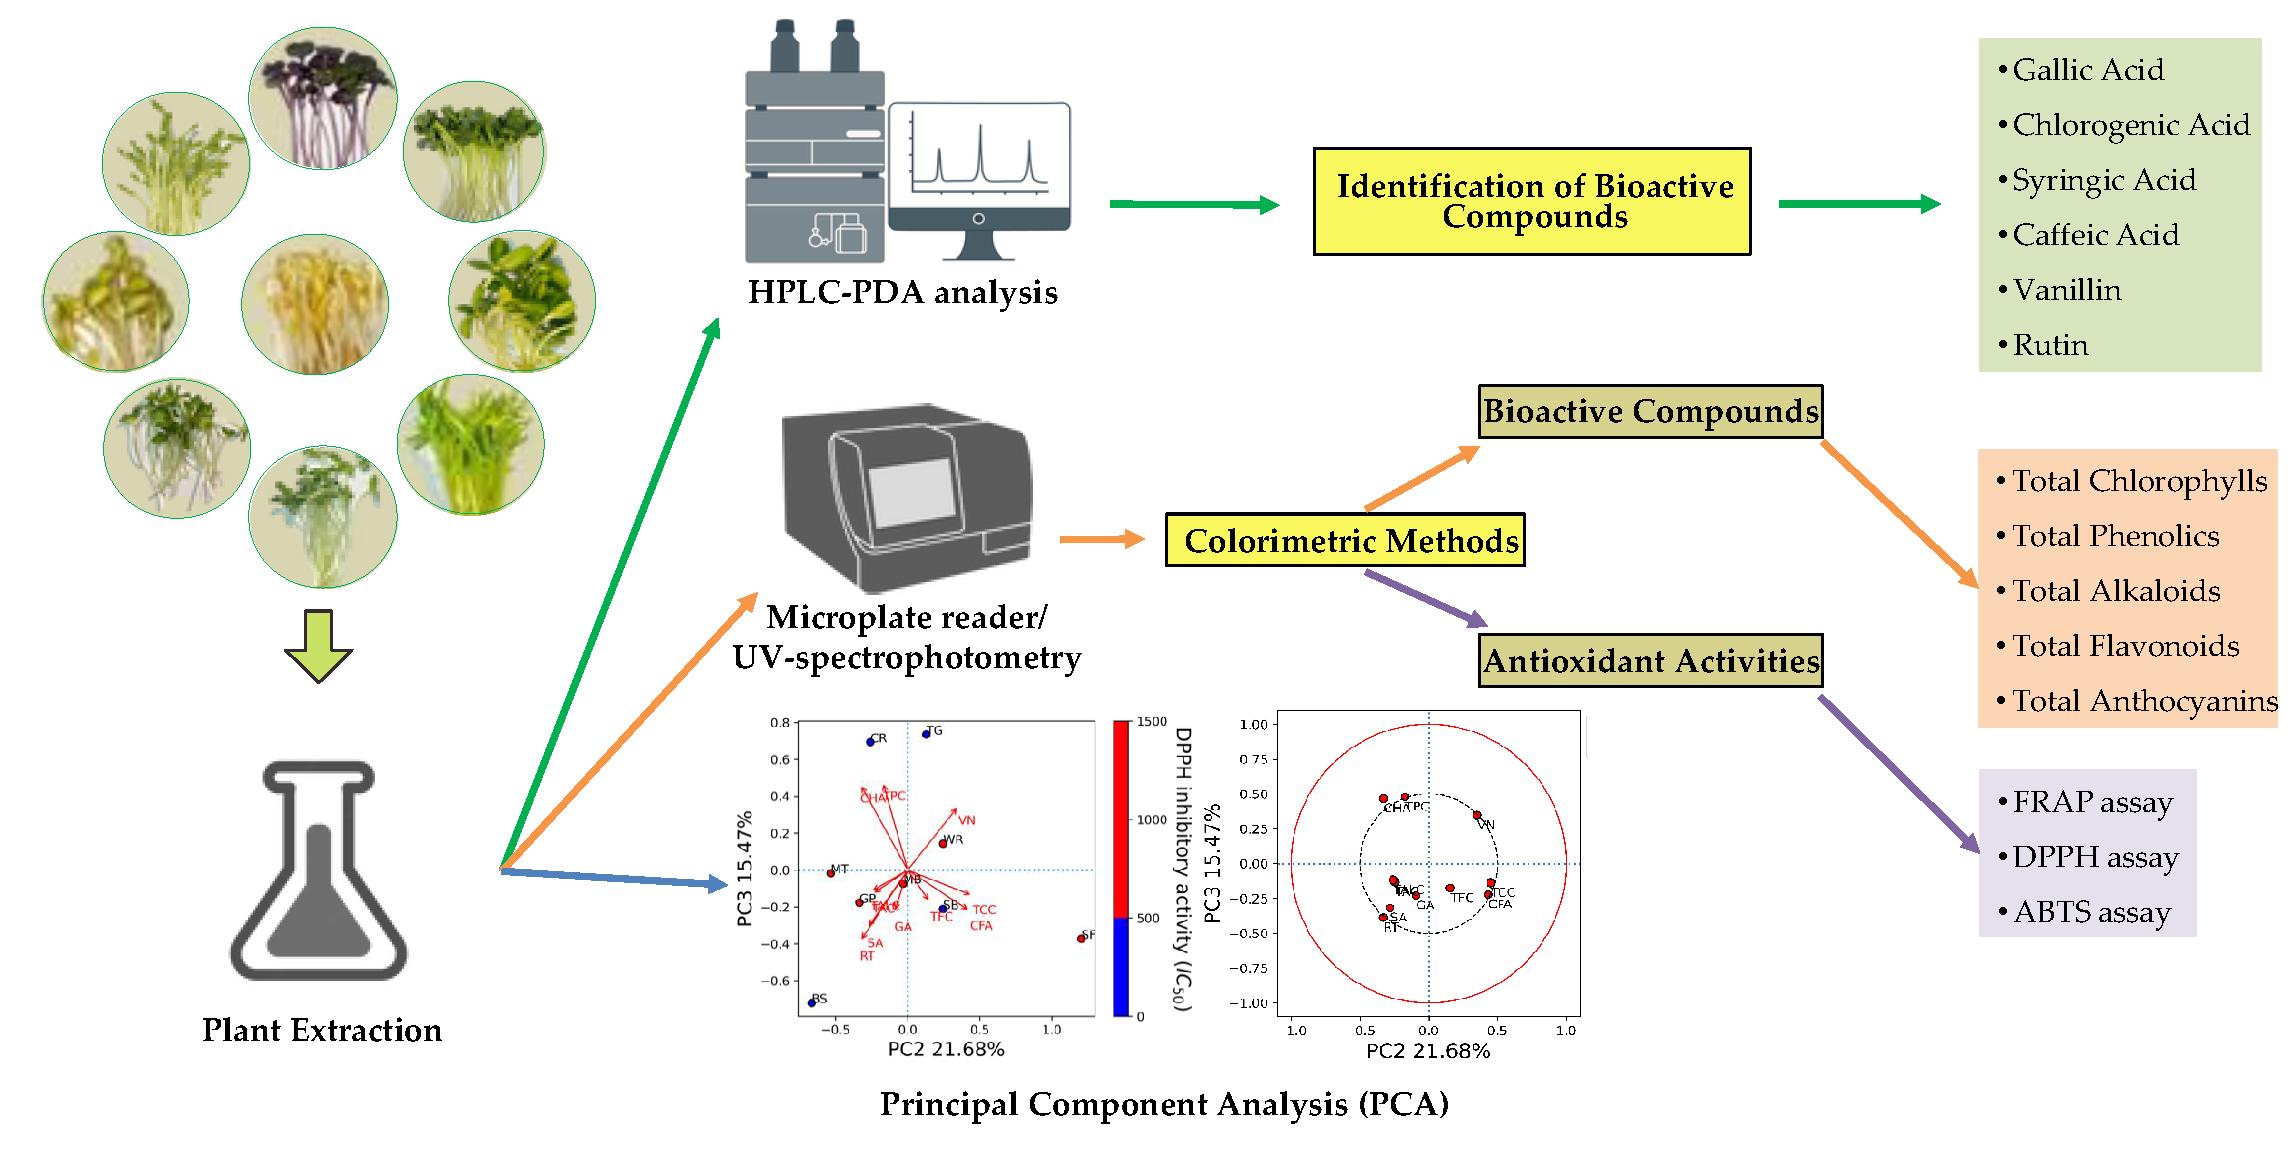
2. Results
2.1. Extraction Yield
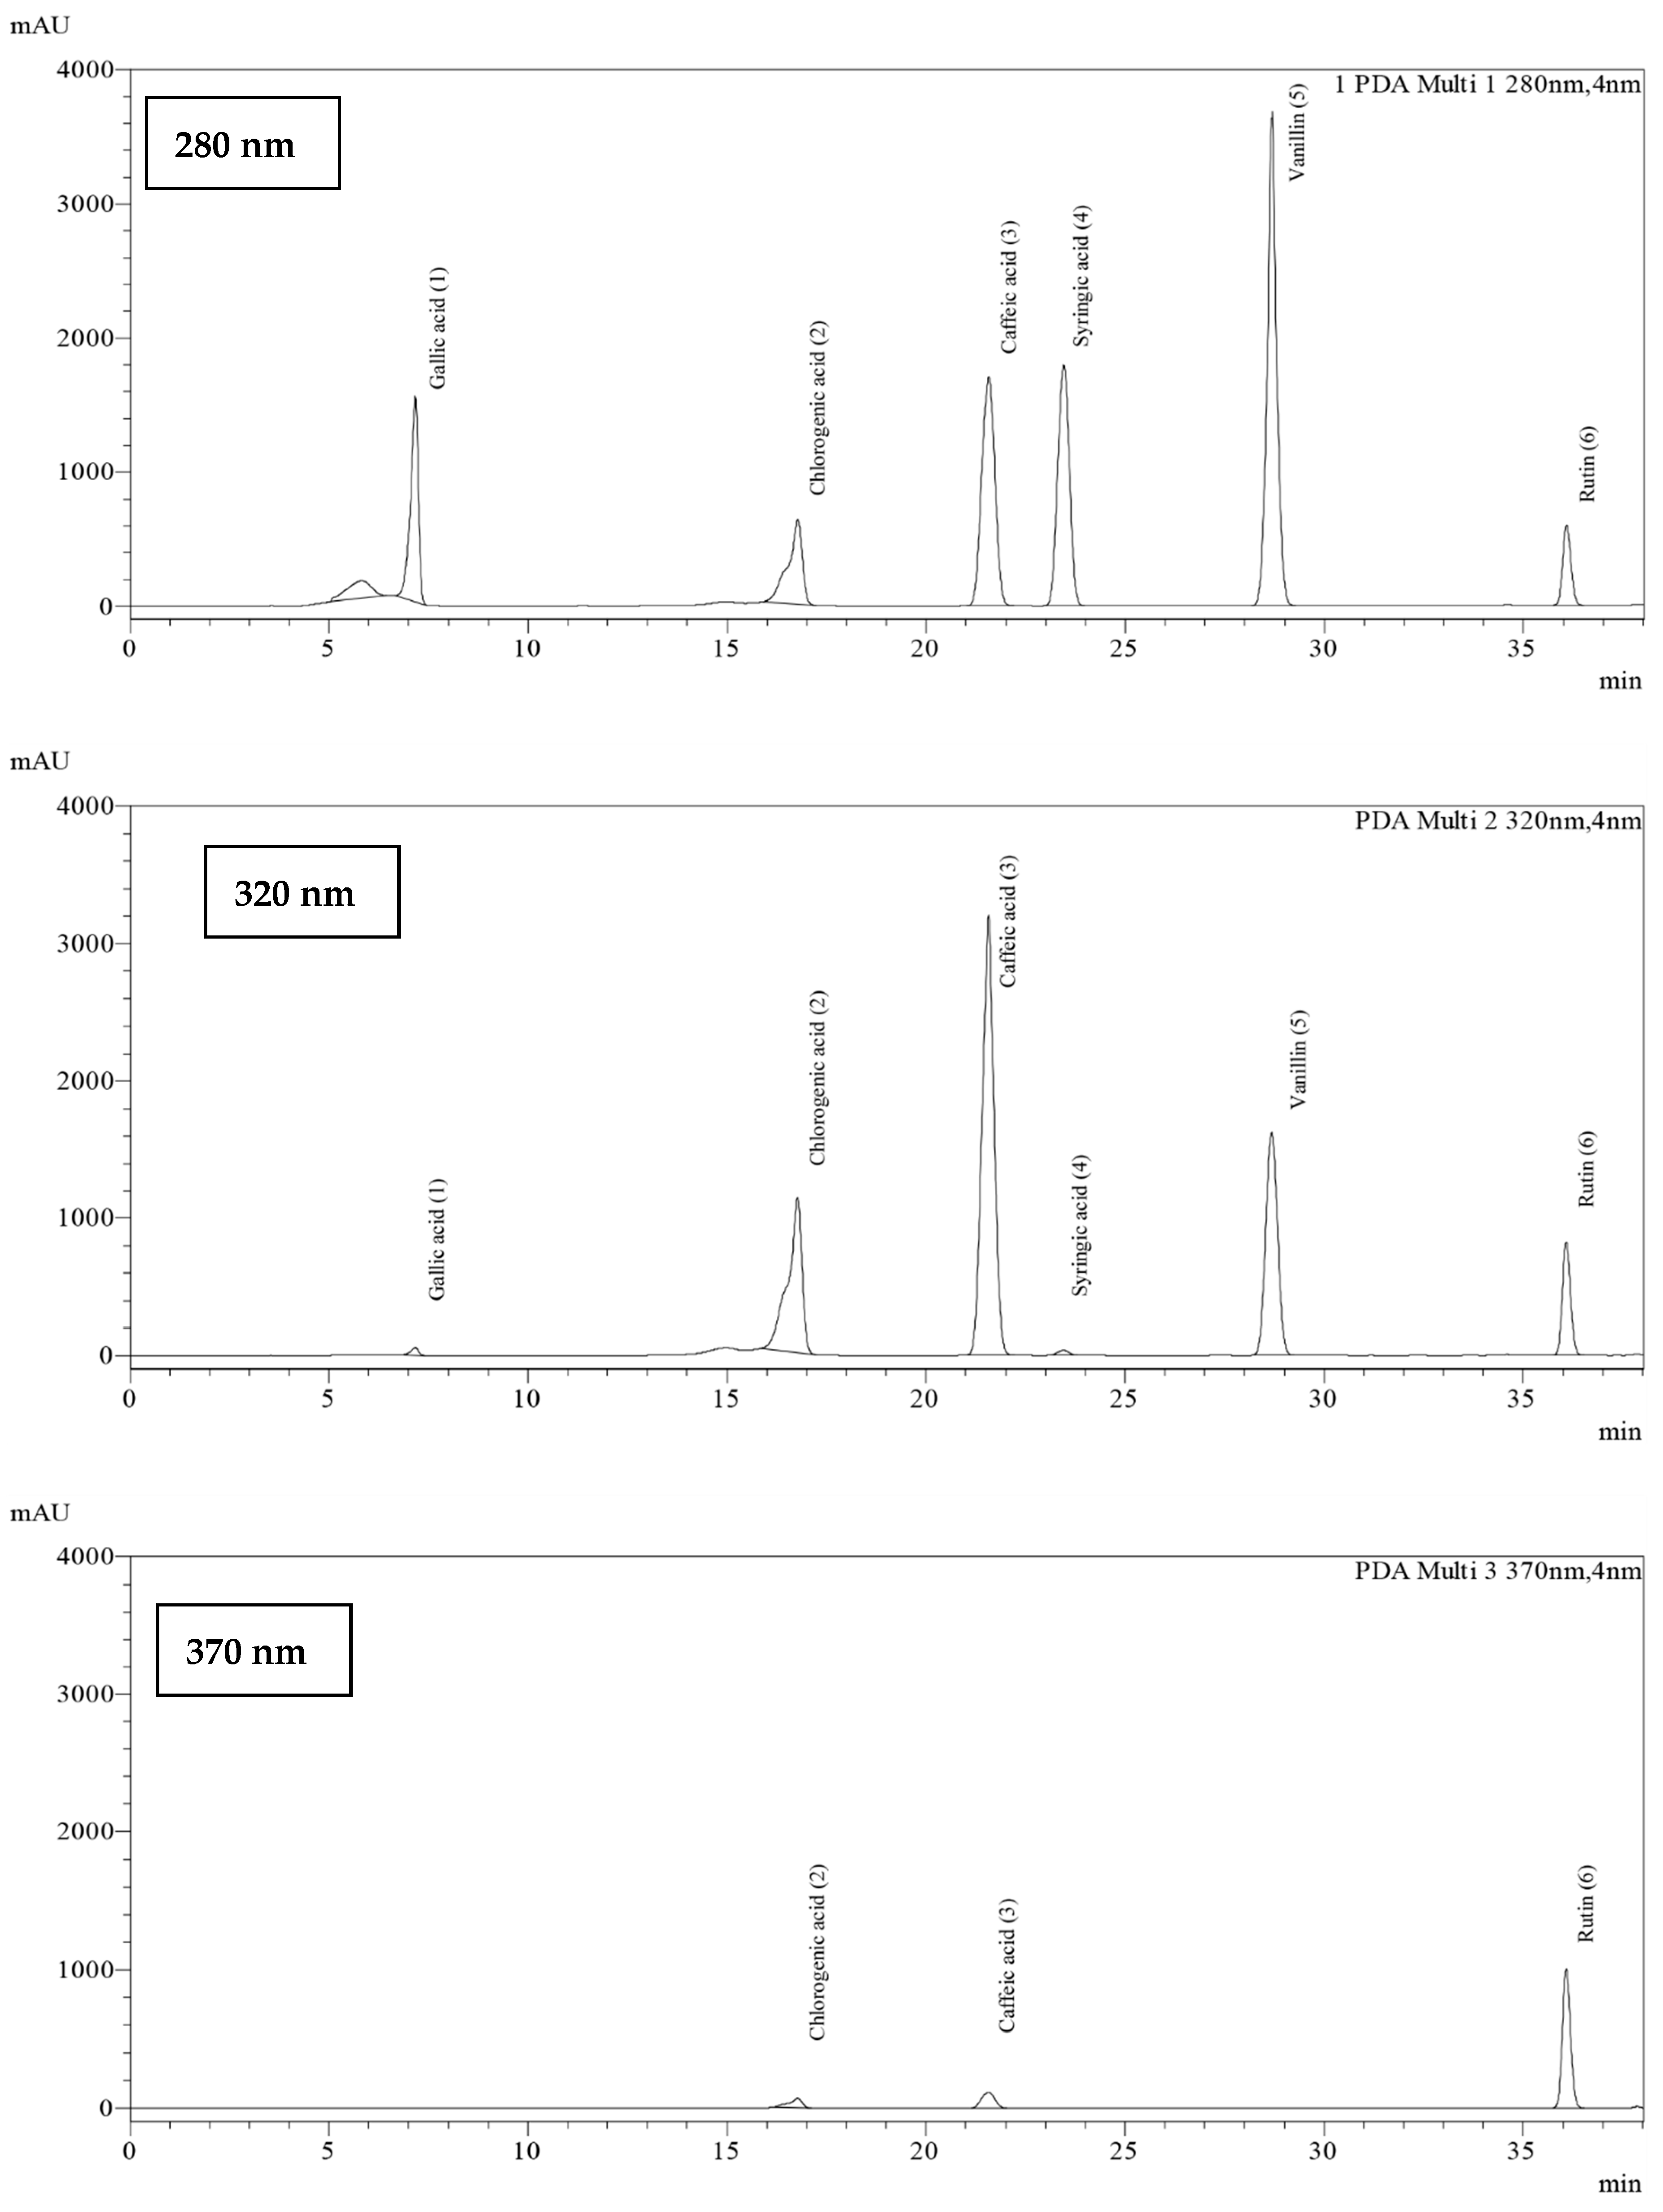
2.2. Identification of Phenolics and Flavonoids Using HPLC
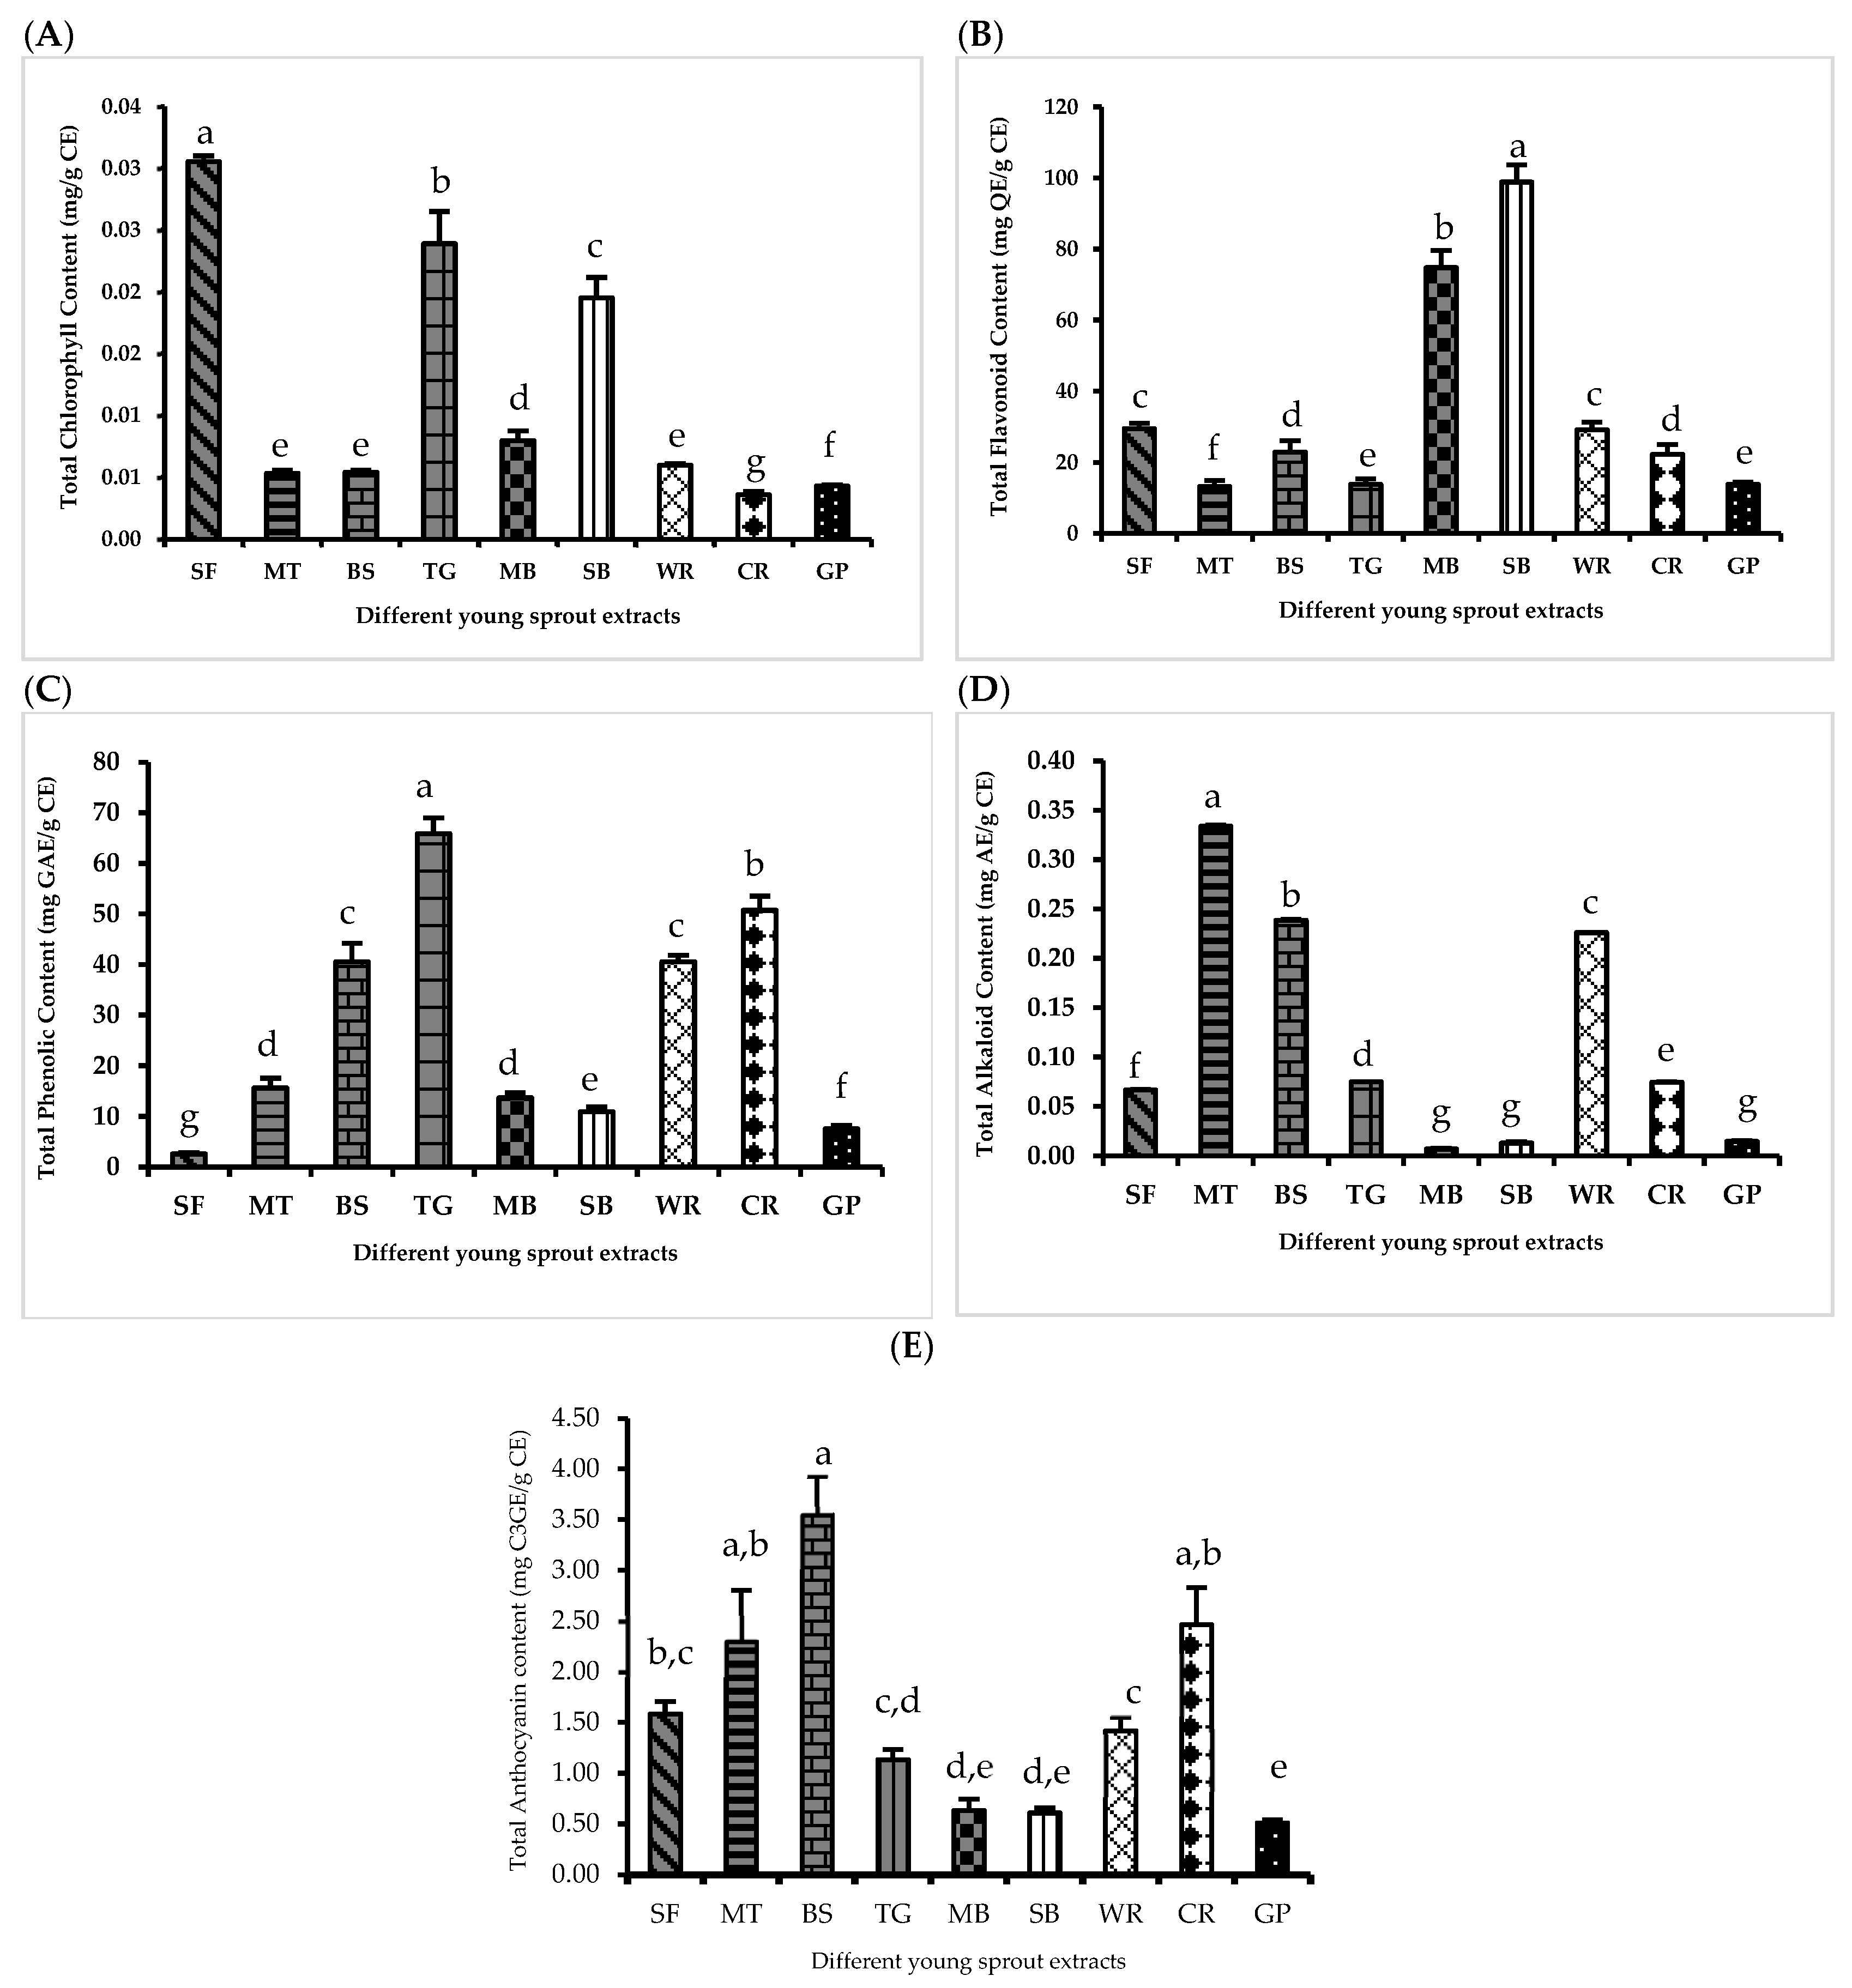
2.3. Phytochemical Contents
2.3.1. Total Chlorophyll Content (TCC)
2.3.2. Total Flavonoid Content (TFC)
2.3.3. Total Phenolic Content (TPC)
2.3.4. Total Alkaloid Content (TALC)
2.3.5. Total Anthocyanin Content (TAC)
2.4. Antioxidant Activities
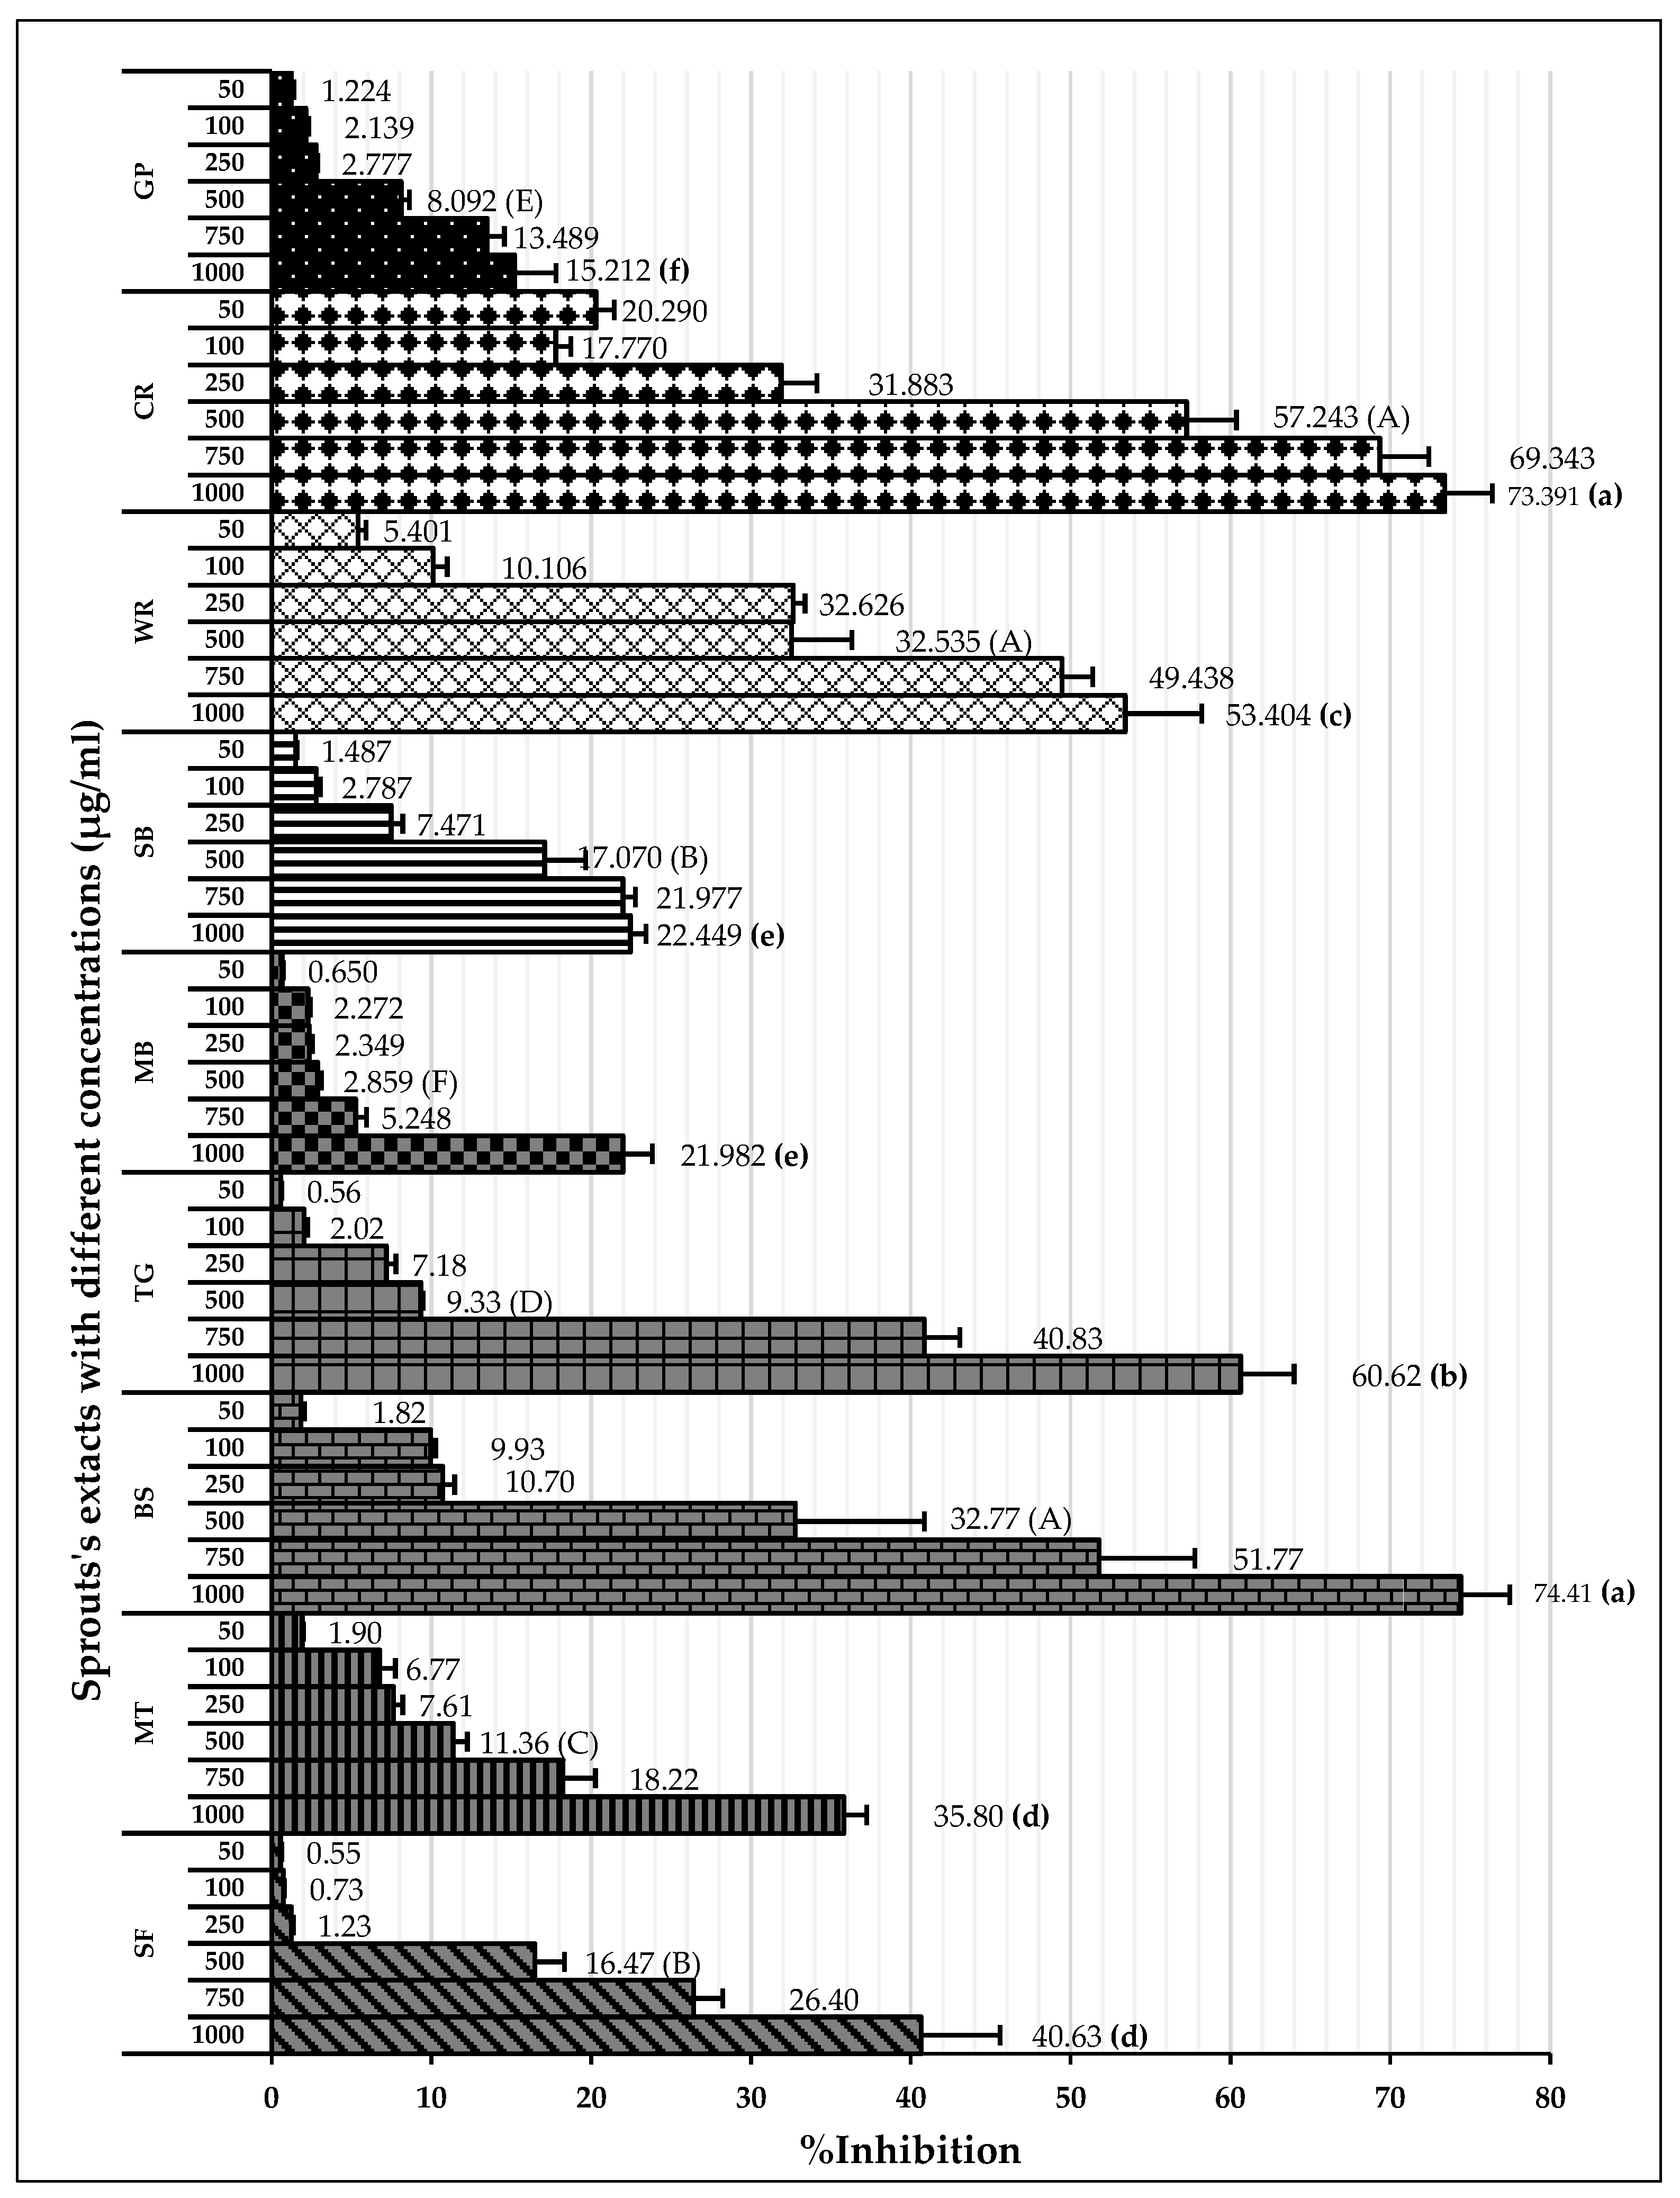
2.4.1. DPPH Radical Scavenging Activities Assay
2.4.2. ABTS Radical Scavenging Activities Assay
2.4.3. Ferric-Reducing Antioxidant Power Assay
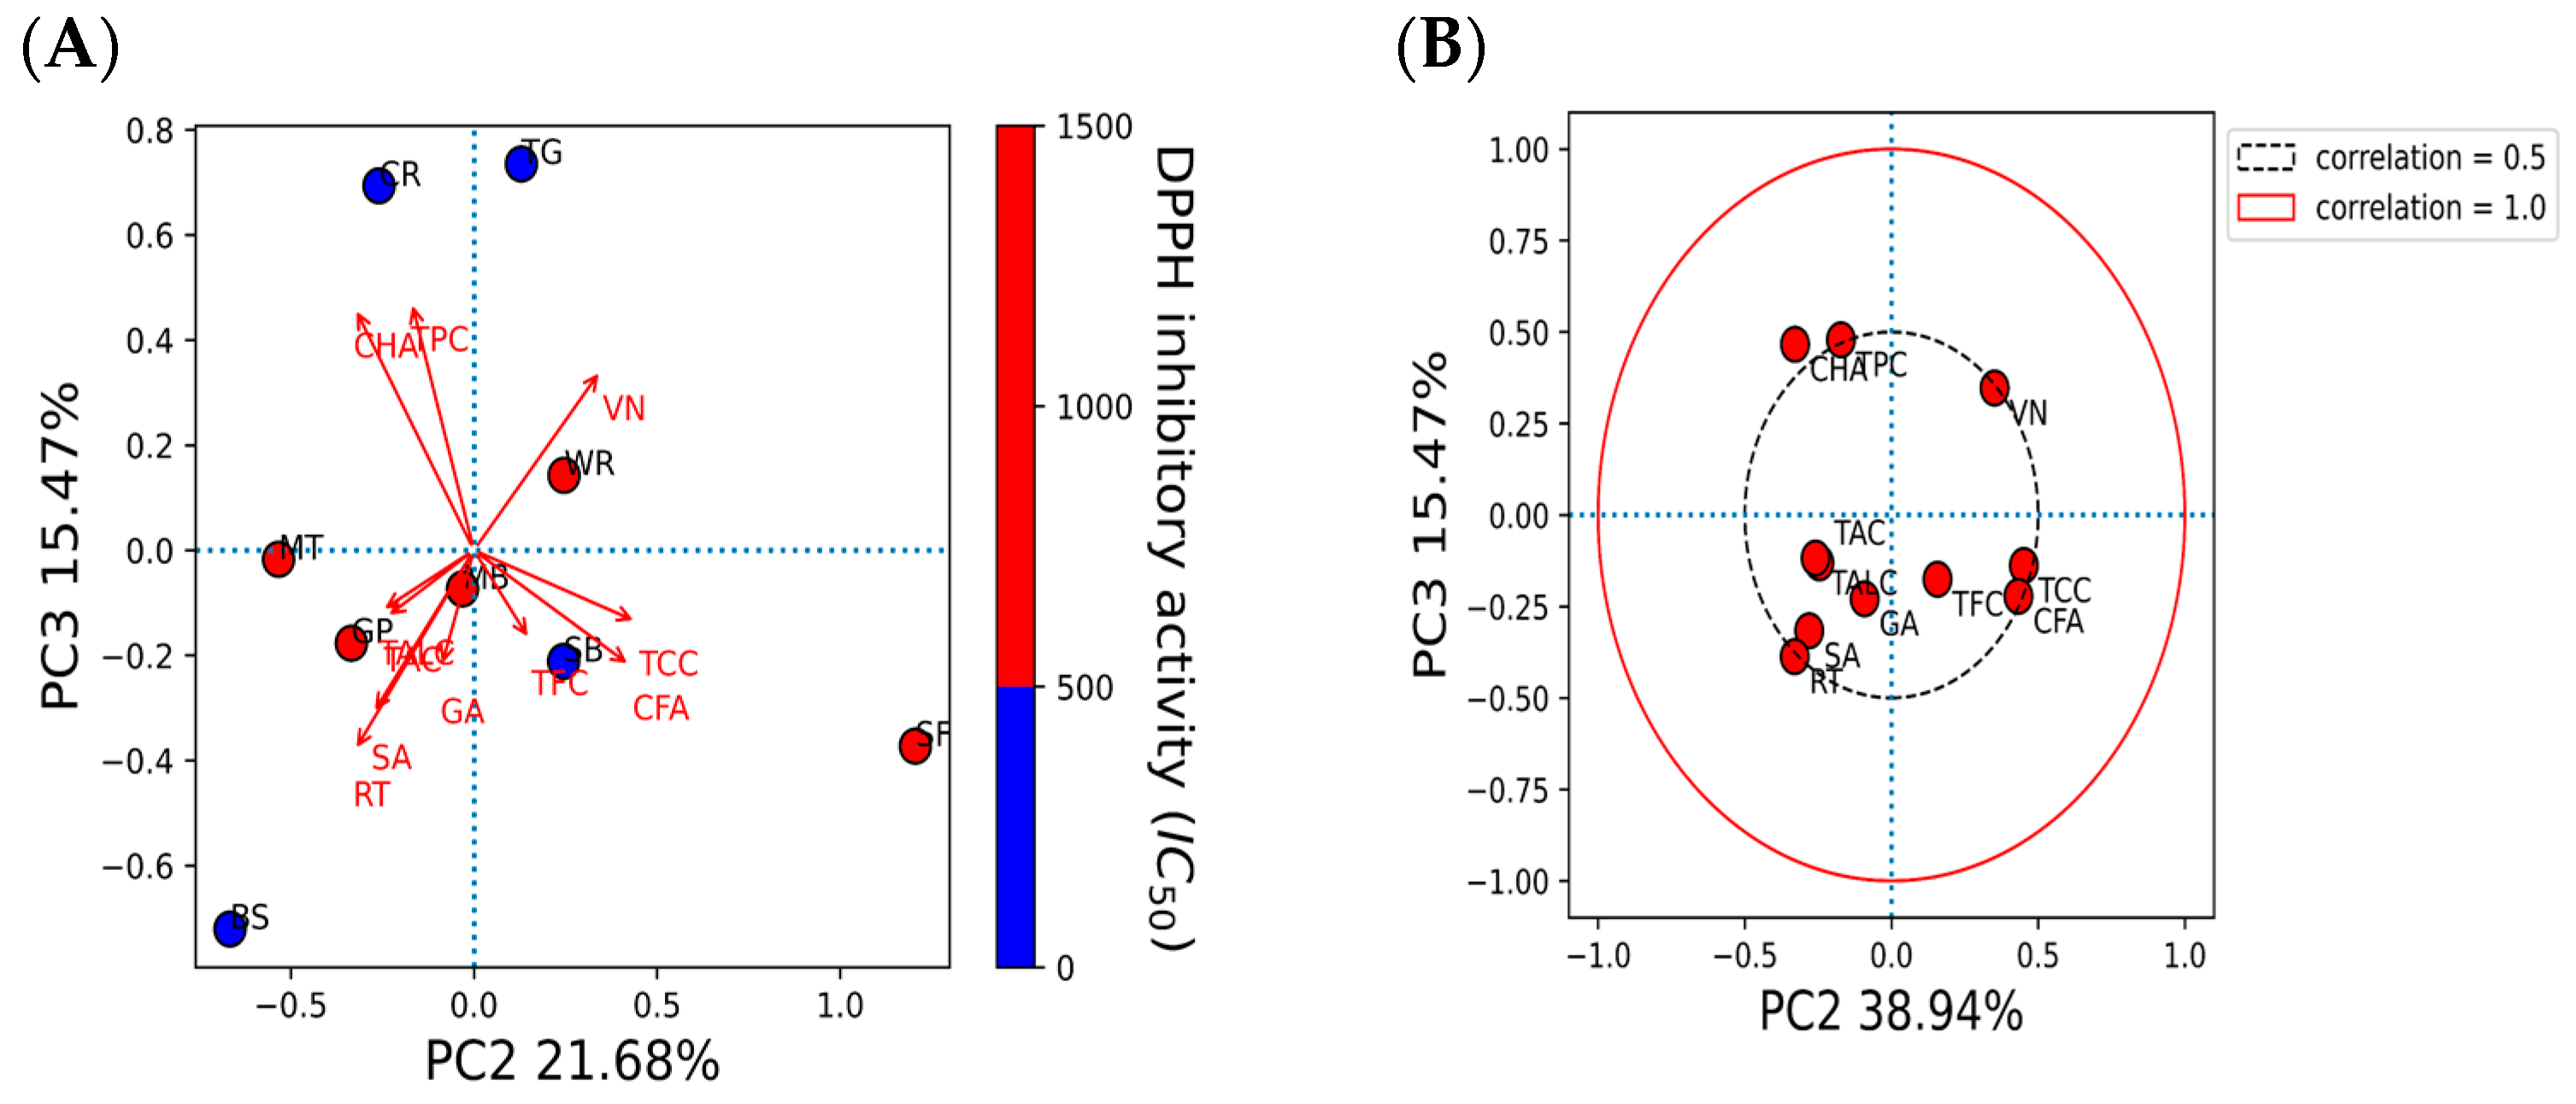
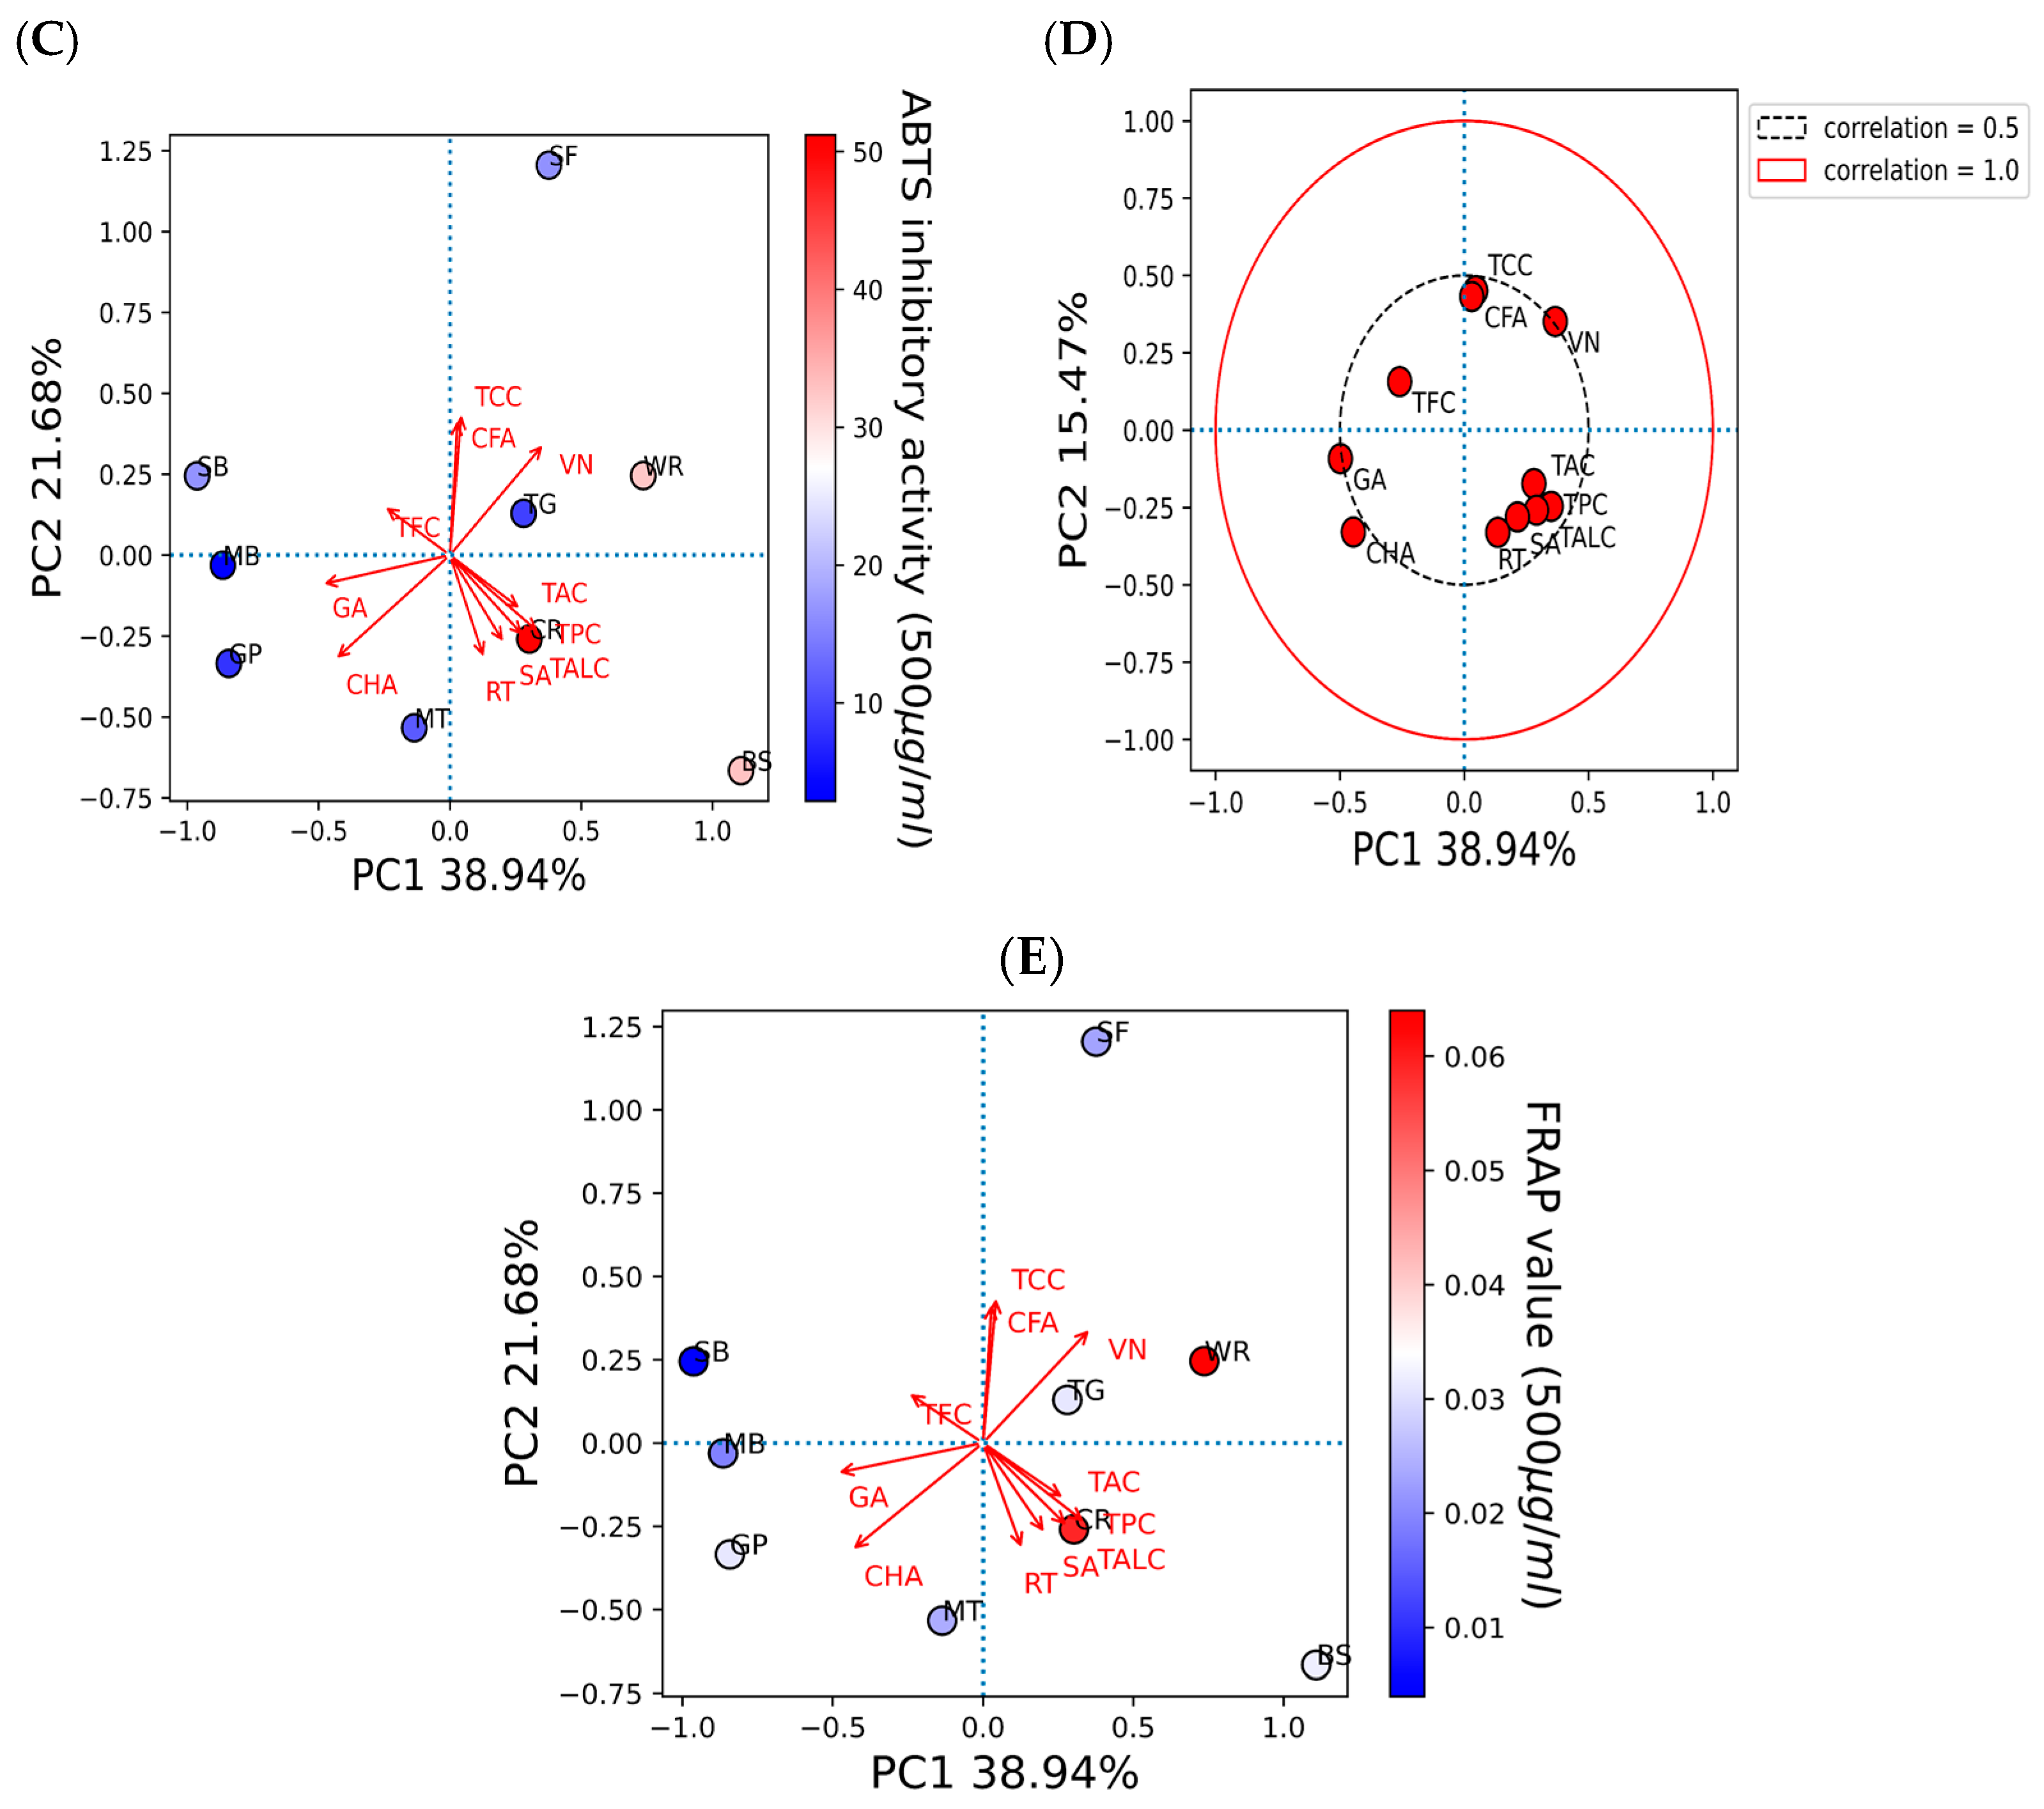
2.5. The Principal Component Analysis (PCA) of Bioactive Compounds and Antioxidant Activities
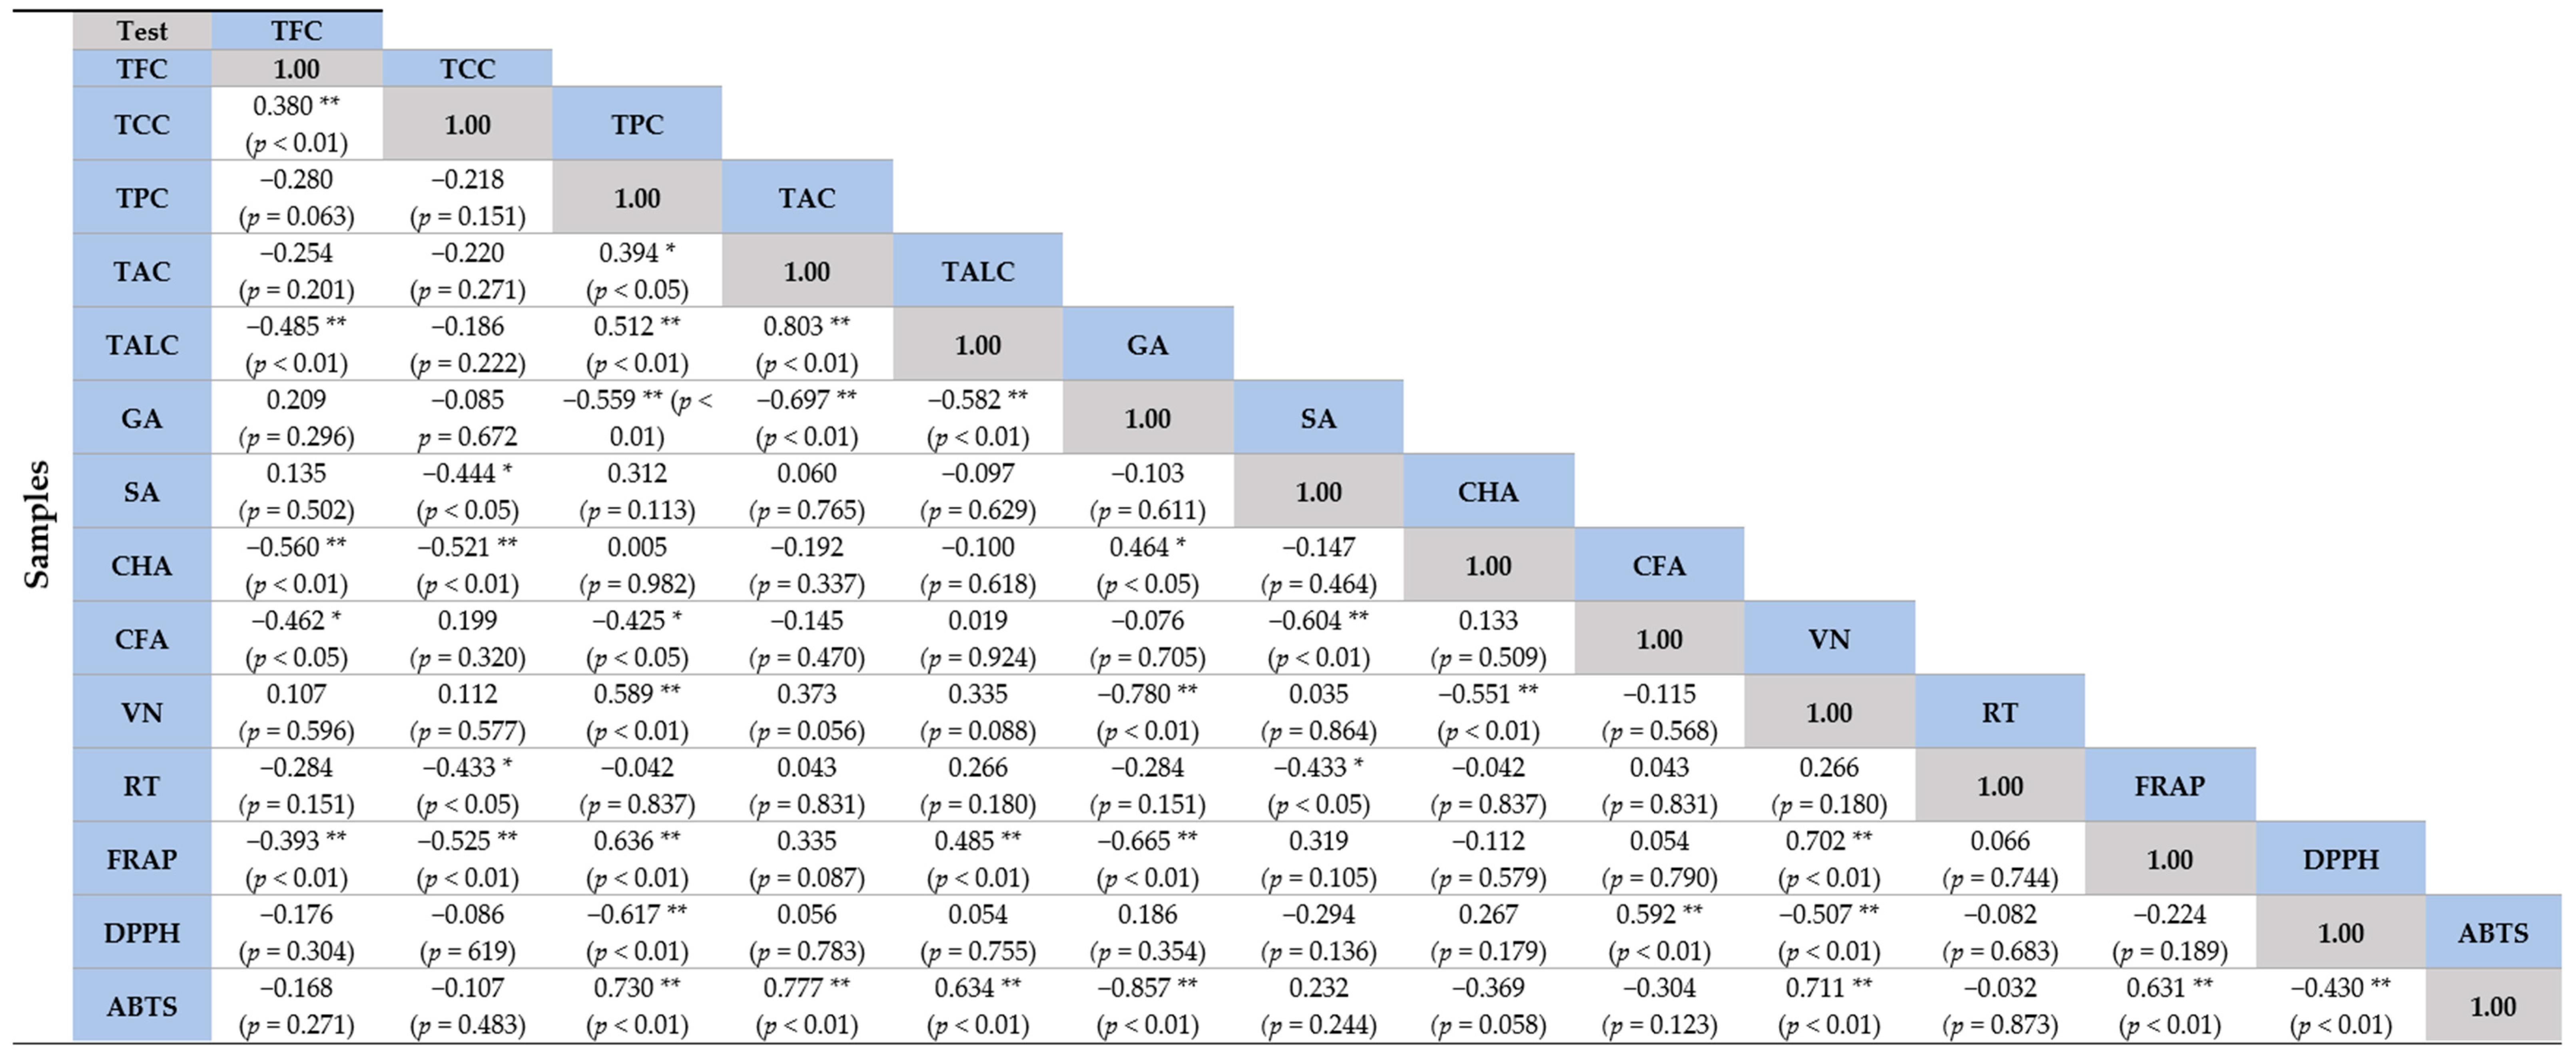
2.6. Correlation Coefficient (r) of Sprouts at Different Species with Antioxidant Capacity
3. Discussion
4. Materials and Methods
4.1. Material and Reagents
4.2. Plant Extraction
4.3. Identification of Phenolics and Flavonoids Using HPLC
4.4. Total Chlorophyll Content (TCC)
4.5. Total Flavonoid Contents (TFC)
4.6. Total Phenolic Content (TPC) by Folin Ciocalteu’s Reagent
4.7. Total Alkaloids Content (TALC)
4.8. Total Anthocyanin Content (TAC)
- -
- Adiff is (A510–A700) pH 1.0 − (A510–A700) pH 4.5;
- -
- Mw is the molecular weight of cyanidin–3–glucoside (g/mol);
- -
- DF is the dilution factor;
- -
- ε is the molar extinction coefficient for 26,900 L mol−1 cm−1.
4.9. Antioxidant Capacity
4.9.1. DPPH Radical Scavenging Activities
- -
- Abs of control = absorbance of control or a reaction mixture in the absence of antioxidant of sample.
- -
- Abs of sample = absorbance of the reaction mixture in the presence of sample.
4.9.2. ABTS Radical Scavenging Activity
- -
- Abs of control = absorbance of control or a reaction mixture in the absence of antioxidant of sample.
- -
- Abs of sample = absorbance of the reaction mixture in the presence of sample.
4.9.3. Reducing Antioxidant Power based on FRAP Assay
4.10. Stastistical Analysis
5. Conclusions
Supplementary Materials
Author Contributions
Funding
Institutional Review Board Statement
Informed Consent Statement
Data Availability Statement
Acknowledgments
Conflicts of Interest
References
- Wang, H.; Zhang, Y.; Jiang, H.; Cao, J.; Jiang, W. A Comprehensive Review of Effects of Electrolyzed Water and Plasma-Activated Water on Growth, Chemical Compositions, Microbiological Safety and Postharvest Quality of Sprouts. Trends Food Sci. Technol. 2022, 129, 449–462. [Google Scholar] [CrossRef]
- Ikram, A.; Saeed, F.; Afzaal, M.; Imran, A.; Niaz, B.; Tufail, T.; Hussain, M.; Anjum, F.M. Nutritional and End-Use Perspectives of Sprouted Grains: A Comprehensive Review. Food Sci. Nutr. 2021, 9, 4617–4628. [Google Scholar] [CrossRef] [PubMed]
- Liu, H.K.; Kang, Y.F.; Zhao, X.Y.; Liu, Y.P.; Zhang, X.W.; Zhang, S.J. Effects of Elicitation on Bioactive Compounds and Biological Activities of Sprouts. J. Funct. Foods 2019, 53, 136–145. [Google Scholar] [CrossRef]
- Hao, J.; Li, J.; Zhao, D. Effect of Slightly Acidic Electrolysed Water on Functional Components, Antioxidant and α-Glucosidase Inhibitory Ability of Buckwheat Sprouts. Int. J. Food Sci. Technol. 2021, 56, 3463–3473. [Google Scholar] [CrossRef]
- Pham-Huy, L.A.; He, H.; Pham-Huy, C. Free Radicals, Antioxidants in Disease and Health. Free Radic. Antioxid. 2008, 4, 89. [Google Scholar]
- Willcox, J.K.; Ash, S.L.; Catignani, G.L. Antioxidants and Prevention of Chronic Disease. Crit. Rev. Food Sci. Nutr. 2004, 44, 275–295. [Google Scholar] [CrossRef]
- Donaldson, M.S. Nutrition and Cancer: A Review of the Evidence for an Anti-Cancer Diet. Nutr. J. 2004, 3, 19. [Google Scholar] [CrossRef] [Green Version]
- Barba, F.J.; Mariutti, L.R.B.; Bragagnolo, N.; Mercadante, A.Z.; Barbosa-Cánovas, G.V.; Orlien, V. Bioaccessibility of Bioactive Compounds From Fruits and Vegetables After Thermal and Nonthermal Processing. Trends Food Sci. Technol. 2017, 67, 195–206. [Google Scholar] [CrossRef]
- Ahmed, A.F.; Attia, F.A.k.; Liu, Z.; Li, C.; Wei, J.; Kang, W. Antioxidant Activity and Total Phenolic Content of Essential Oils and Extracts of Sweet Basil (Ocimum basilicum L.) Plants. Food Sci. Hum. Wellness 2019, 8, 299–305. [Google Scholar] [CrossRef]
- Derakhshan, Z.; Ferrante, M.; Tadi, M.; Ansari, F.; Heydari, A.; Hosseini, M.S.; Conti, G.O.; Sadrabad, E.K. Antioxidant Activity and Total Phenolic Content of Ethanolic Extract of Pomegranate Peels, Juice And Seeds. Food Chem. Toxicol. 2018, 114, 108–111. [Google Scholar] [CrossRef]
- Ayoub, I.; El-Shazly, M.; Lu, M.-C.; Singab, A. Antimicrobial and Cytotoxic Activities of the Crude Extracts of Dietes Bicolor Leaves, Flowers and Rhizomes. S. Afr. J. Bot. 2014, 95, 97–101. [Google Scholar] [CrossRef] [Green Version]
- Raiola, A.; Errico, A.; Petruk, G.; Monti, D.M.; Barone, A.; Rigano, M.M. Bioactive Compounds in Brassicaceae Vegetables with a Role in the Prevention of Chronic Diseases. Molecules 2017, 23, 15. [Google Scholar] [CrossRef] [PubMed] [Green Version]
- Shi, Y.H.; Wang, J.; Guo, R.; Wang, C.Z.; Yan, X.B.; Xu, B.; Zhang, D.Q. Effects of Alfalfa Saponin Extract on Growth Per-Formance and Some Antioxidant Indices of Weaned Piglets. Livest. Sci. 2014, 167, 257–262. [Google Scholar] [CrossRef]
- Yılmaz, H.Ö.; Ayhan, N.Y.; Meric, C.S. Buckwheat: A Useful Food and Its Effects on Human Health. Curr. Nutr. Food Sci. 2020, 16, 29–34. [Google Scholar] [CrossRef]
- Bastida, J.A.G.; Zielinski, H. Buckwheat as a Functional Food and Its Effects on Health. J. Agric. Food Chem. 2015, 63, 7896–7913. [Google Scholar] [CrossRef] [PubMed]
- Shah, M.A.; Sarker, M.M.R.; Gousuddin, M. Antidiabetic Potential of Brassica oleracea Var. Italica in Type 2 Diabetic Sprague Dawley (sd) Rats. Int. J. Pharmacogn. Phytochem. Res. 2016, 8, 462–469. [Google Scholar] [CrossRef]
- Gan, R.-Y.; Lui, W.-Y.; Wu, K.; Chan, C.-L.; Dai, S.-H.; Sui, Z.-Q.; Corke, H. Bioactive Compounds and Bioactivities of Germi-Nated Edible Seeds and Sprouts: An Updated Review. Trends Food Sci. Technol. 2017, 59, 1–14. [Google Scholar] [CrossRef]
- Yan, Z.; Zhong, Y.; Duan, Y.; Chen, Q.; Li, F. Antioxidant Mechanism of Tea Polyphenols and Its Impact on Health Benefits. Anim. Nutr. 2020, 6, 115–123. [Google Scholar] [CrossRef]
- Lü, J.-M.; Lin, P.H.; Yao, Q.; Chen, C. Chemical and Molecular Mechanisms of Antioxidants: Experimental Approaches and Model Systems. J. Cell. Mol. Med. 2010, 14, 840–860. [Google Scholar] [CrossRef] [PubMed]
- Tungmunnithum, D.; Thongboonyou, A.; Pholboon, A.; Yangsabai, A. Flavonoids and other Phenolic Compounds from Medicinal Plants For Pharmaceutical and Medical Aspects: An Overview. Medicines 2018, 5, 93. [Google Scholar] [CrossRef]
- Shi, J.; Wu, Q.; Deng, J.; Balfour, K.; Chen, Z.; Liu, Y.; Kumar, S.; Chen, Y.; Zhu, Z.; Zhu, G. Metabolic Profiling and Antioxidant Analysis for the Juvenile Red Fading Leaves of Sweetpotato. Plants 2022, 11, 3014. [Google Scholar] [CrossRef] [PubMed]
- Yeshi, K.; Crayn, D.; Ritmejerytė, E.; Wangchuk, P. Plant Secondary Metabolites Produced in Response to Abiotic Stresses Has Potential Application in Pharmaceutical Product Development. Molecules 2022, 27, 313. [Google Scholar] [CrossRef] [PubMed]
- Saeed, N.; Khan, M.R.; Shabbir, M. Antioxidant Activity, Total Phenolic and Total Flavonoid Contents of Whole Plant Extracts Torilis leptophylla L. BMC Complement. Altern. Med. 2012, 12, 221. [Google Scholar] [CrossRef] [Green Version]
- Babbar, N.; Oberoi, H.S.; Sandhu, S.K.; Bhargav, V.K. Influence of Different Solvents in Extraction of Phenolic Compounds From Vegetable Residues and Their Evaluation As Natural Sources of Antioxidants. J. Food Sci. Technol. 2014, 51, 2568–2575. [Google Scholar] [CrossRef] [Green Version]
- Agidew, M.G. Phytochemical Analysis of Some Selected Traditional Medicinal Plants in Ethiopia. Bull. Natl. Res. Cent. 2022, 46, 87. [Google Scholar] [CrossRef]
- National Center for Biotechnology Information. PubChem Compound Summary for CID 370, Gallic Acid. PubChem. Available online: https://pubchem.ncbi.nlm.nih.gov/compound/Gallic-Acid (accessed on 28 November 2022).
- Alavi, R.S.; Farhoosh, R.; Sharif, A. Antioxidant Activity of Gallic Acid as Affected by an Extra Carboxyl Group than Pyrogallol in Various Oxidative Environments. Eur. J. Lipid Sci. Technol. 2018, 120, 1800319. [Google Scholar] [CrossRef]
- Vo, Q.V.; Van Bay, M.; Nam, P.C.; Quang, D.T.; Flavel, M.; Hoa, N.T.; Mechler, A. Theoretical and Experimental Studies of the Antioxidant and Antinitrosant Activity of Syringic Acid. J. Org. Chem. 2020, 85, 15514–15520. [Google Scholar] [CrossRef] [PubMed]
- Li, Y.; Zhang, L.; Wang, X.; Wu, W.; Qin, R. Effect of Syringic Acid on Antioxidant Biomarkers and Associated Inflammatory Markers in Mice Model of Asthma. Drug Dev. Res. 2019, 80, 253–261. [Google Scholar] [CrossRef]
- National Center for Biotechnology Information. PubChem Compound Summary for CID 1794427, Chlorogenic Acid. PubChem. Available online: https://pubchem.ncbi.nlm.nih.gov/compound/Chlorogenic-Acid (accessed on 28 November 2022).
- Xu, J.-G.; Hu, Q.-P.; Liu, Y. Antioxidant and DNA-Protective Activities of Chlorogenic Acid Isomers. J. Agric. Food Chem. 2012, 60, 11625–11630. [Google Scholar] [CrossRef]
- National Center for Biotechnology Information. PubChem Compound Summary for CID 689043, Caffeic Acid. PubChem. Available online: https://pubchem.ncbi.nlm.nih.gov/compound/Caffeic-Acid (accessed on 28 November 2022).
- Genaro-Mattos, T.C.; Maurício, Â.Q.; Rettori, D.; Alonso, A.; Hermes-Lima, M. Antioxidant Activity of Caffeic Acid Against Iron-Induced Free Radical Generation—A chemical approach. PLoS ONE 2015, 10, e0129963. [Google Scholar] [CrossRef] [Green Version]
- National Center for Biotechnology Information. PubChem Compound Summary for CID 1183, Vanillin. PubChem. Available online: https://pubchem.ncbi.nlm.nih.gov/compound/Vanillin (accessed on 28 November 2022).
- Tai, A.; Sawano, T.; Yazama, F.; Ito, H. Evaluation of Antioxidant Activity of Vanillin by Using Multiple Antioxidant Assays. Biochim. Biophys. Acta (BBA)—Gen. Subj. 2011, 1810, 170–177. [Google Scholar] [CrossRef] [PubMed]
- National Center for Biotechnology Information. PubChem Compound Summary for CID 5280805, Rutin. PubChem. Available online: https://pubchem.ncbi.nlm.nih.gov/compound/Rutin (accessed on 28 November 2022).
- Yang, J.; Guo, J.; Yuan, J. In Vitro Antioxidant Properties of Rutin. LWT—Food Sci. Technol. 2008, 41, 1060–1066. [Google Scholar] [CrossRef]
- Agidew, M.G.; Dubale, A.A.; Atlabachew, M.; Abebe, W. Fatty Acid Composition, Total Phenolic Contents and Antioxidant Activity of White and Black Sesame Seed Varieties from Different Localities of Ethiopia. Chem. Biol. Technol. Agric. 2021, 8, 14. [Google Scholar] [CrossRef]
- Rice-Evans, C.A.; Diplock, A.T. Current Status of Antioxidant Therapy. Free. Radic. Biol. Med. 1993, 15, 77–96. [Google Scholar] [CrossRef]
- Krinsky, N.I. Mechanism of Action of Biological Antioxidants. Proc. Soc. Exp. Biol. Med. 1992, 200, 248–254. [Google Scholar] [CrossRef]
- Zeb, A. Concept, Mechanism, and Applications of Phenolic Antioxidants in Foods. J. Food Biochem. 2020, 44, e13394. [Google Scholar] [CrossRef]
- Tang, Y.-Y.; He, X.-M.; Sun, J.; Li, C.-B.; Li, L.; Sheng, J.-F.; Xin, M.; Li, Z.-C.; Zheng, F.-J.; Liu, G.-M.; et al. Polyphenols and Alkaloids in Byproducts of Longan Fruits (Dimocarpus longan L.) and Their Bioactivities. Molecules 2019, 24, 1186. [Google Scholar] [CrossRef] [Green Version]
- Jin, H.-M.; Dang, B.; Zhang, W.-G.; Zheng, W.-C.; Yang, X.-J. Polyphenol and Anthocyanin Composition and Activity of Highland Barley with Different Colors. Molecules 2022, 27, 3411. [Google Scholar] [CrossRef]
- Pérez-Gálvez, A.; Viera, I.; Roca, M. Carotenoids and Chlorophylls as Antioxidants. Antioxidants 2020, 9, 505. [Google Scholar] [CrossRef]
- Li, Y.; Cui, Y.; Hu, X.; Liao, X.; Zhang, Y. Chlorophyll Supplementation in Early Life Prevents Diet-Induced Obesity and Modulates Gut Microbiota in Mice. Mol. Nutr. Food Res. 2019, 63, 1801219. [Google Scholar] [CrossRef]
- Vaňková, K.; Marková, I.; Jašprová, J.; Dvořák, A.; Subhanová, I.; Zelenka, J.; Novosádová, I.; Rasl, J.; Vomastek, T.; Sobotka, R.; et al. Chlorophyll-Mediated Changes in the Redox Status of Pancreatic Cancer Cells are Associated with Its Anticancer Effects. Oxidative Med. Cell. Longev. 2018, 2018, 4069167. [Google Scholar] [CrossRef] [PubMed] [Green Version]
- Li, Y.; Cui, Y.; Lu, F.; Wang, X.; Liao, X.; Hu, X.; Zhang, Y. Beneficial Effects of A Chlorophyll-Rich Spinach Extract Supplementation on Prevention of Obesity and Modulation of Gut Microbiota In High-Fat Diet-Fed Mice. J. Funct. Foods 2019, 60, 103436. [Google Scholar] [CrossRef]
- Subramoniam, A.; Asha, V.V.; Nair, S.A.; Sasidharan, S.P.; Sureshkumar, P.K.; Rajendran, K.N.; Karunagaran, D.; Ramalingam, K. Chlorophyll Revisited: Anti-inflammatory Activities of Chlorophyll a and Inhibition of Expression of TNF-α Gene by the Same. Inflammation 2012, 35, 959–966. [Google Scholar] [CrossRef]
- McQuistan, T.J.; Simonich, M.T.; Pratt, M.M.; Pereira, C.B.; Hendricks, J.D.; Dashwood, R.H.; Williams, D.E.; Bailey, G.S. Cancer Chemoprevention by Dietary Chlorophylls: A 12,000-Animal Dose–Dose Matrix Biomarker and Tumor Study. Food Chem. Toxicol. 2012, 50, 341–352. [Google Scholar] [CrossRef] [PubMed] [Green Version]
- Gan, J.; Feng, Y.; He, Z.; Li, X.; Zhang, H. Correlations between Antioxidant Activity and Alkaloids and Phenols of Maca (Lepidium meyenii). J. Food Qual. 2017, 2017, 3185945. [Google Scholar] [CrossRef] [Green Version]
- Villinski, J.; Dumas, E.; Chai, H.B.; Pezzuto, J.; Angerhofer, C.; Gafner, S. Antibacterial Activity and Alkaloid Content of Berberis thunbergii, Berberis vulgaris and Hydrastis canadensis. Pharm. Biol. 2003, 41, 551–557. [Google Scholar] [CrossRef]
- Otshudi, A.L.; Apers, S.; Pieters, L.; Claeys, M.; Pannecouque, C.; De Clercq, E.; Van Zeebroeck, A.; Lauwers, S.; Frédérich, M.; Foriers, A. Biologically Active Bisbenzylisoquinoline Alkaloids from the Root Bark of Epinetrum villosum. J. Ethnopharmacol. 2005, 102, 89–94. [Google Scholar] [CrossRef]
- Wirasathien, L.; Boonarkart, C.; Pengsuparp, T.; Suttisri, R. Biological Activities of Alkaloids from Pseuduvaria setosa. Pharm. Biol. 2006, 44, 274–278. [Google Scholar] [CrossRef] [Green Version]
- Li, L.S.; Chiroma, S.M.; Hashim, T.; Adam, S.K.; Moklas, M.A.M.; Yusuf, Z.; Rahman, S.A. Antioxidant and Anti-Inflammatory Properties of Erythroxylum cuneatum Alkaloid Leaf Extract. Heliyon 2020, 6, e04141. [Google Scholar] [CrossRef]
- Bribi, N.; Algieri, F.; Rodriguez-Nogales, A.; Garrido-Mesa, J.; Vezza, T.; Maiza, F.; Utrilla, M.P.; Rodriguez-Cabezas, M.E.; Galvez, J. Antinociceptive and Anti-Inflammatory Effects of Total Alkaloid Extract from Fumaria capreolata. Evid. Based Complement. Altern. Med. 2015, 2015, 127414. [Google Scholar] [CrossRef] [Green Version]
- Adhikari, B. Roles of Alkaloids from Medicinal Plants in the Management of Diabetes Mellitus. J. Chem. 2021, 2021, 2691525. [Google Scholar] [CrossRef]
- Al-Hakeim, H.K.; Al-Zabibah, R.S.; Alzihari, H.F.; Almensoori, A.K.; Al-Zubaidi, H.A.; Hassan, L.E.A.H. Anticancer and Antiangiogenic Activities of Alkaloids Isolated from Lantana camara by Adsorption on The Magnetic Nanoparticles. Karbala Int. J. Mod. Sci. 2021, 7, 11. [Google Scholar] [CrossRef]
- De’Nobili, M.D.; Bernhardt, D.C.; Basanta, M.F.; Rojas, A.M. Sunflower (Helianthus annuus L.) Seed Hull Waste: Composition, Antioxidant Activity, and Filler Performance in Pectin-Based Film Composites. Front. Nutr. 2021, 8, 777214. [Google Scholar] [CrossRef]
- Bashir, T.; Zia-Ur-Rehman Mashwani, K.Z.; Haider, S.; Shaista, T.M. Chemistry, Pharmacology and Ethnomedicinal Uses of Helianthus annuus (Sunflower): A Review. Pure Appl. Biol. 2021, 4, 226–235. [Google Scholar] [CrossRef]
- Gai, F.; Karamać, M.; Janiak, M.A.; Amarowicz, R.; Peiretti, P.G. Sunflower (Helianthus annuus L.) Plants at Various Growth Stages Subjected to Extraction—Comparison of the Antioxidant Activity and Phenolic Profile. Antioxidants 2020, 9, 535. [Google Scholar] [CrossRef] [PubMed]
- Iqbal, N.; Masood, A.; Nazar, R.; Syeed, S.; Khan, N.A. Photosynthesis, Growth and Antioxidant Metabolism in Mustard (Brassica juncea L.) Cultivars Differing in Cadmium Tolerance. Agric. Sci. Chin. 2010, 9, 519–527. [Google Scholar] [CrossRef]
- Khyade, V.B.; Jagtap, S.G. Sprouting Exert Significant Influence on the Antioxidant Activity in Selected Pulses (Black Gram, Cowpea, Desi Chickpea and Yellow Mustard). World Sci. News 2016, 35, 3–86. [Google Scholar]
- Manvar, M.N. Pharmacognostical Investigations on Ipomoea aquatica Forsk. Int. J. Pharm. Sci. 2011, 2, 2812. [Google Scholar]
- Kusumah, V.; Pertiwi, H. Potential of Ipomea aquatica Hay and Its Phytochemical to Improve Performance and Health Status in Ruminants. Ecol. Environ. Conserv. 2021, 28, 33–41. [Google Scholar] [CrossRef]
- Mastropasqua, L.; Dipierro, N.; Paciolla, C. Effects of Darkness and Light Spectra on Nutrients and Pigments in Radish, Soybean, Mung Bean and Pumpkin Sprouts. Antioxidants 2020, 9, 558. [Google Scholar] [CrossRef]
- Kalim, A.; Zaheer, M.; Siddiqui, M.U.A.; Ahmed, S.; Hassan, M.M. Nutritional value, Ethnomedicine, Phytochemistry and Pharmacology of Vigna radiata (L.) R. Wilczek. J. Pharmacogn. Phytochem. 2021, 10, 54–58. [Google Scholar] [CrossRef]
- Nget, R.; Aguilar, E.A.; Cruz, P.C.S.; Reaño, C.E.; Sanchez, P.B.; Reyes, M.R.; Prasad, P.V.V. Overview of Farmers’ Perceptions of Current Status and Constraints to Soybean Production in Ratanakiri Province of Cambodia. Sustainability 2021, 13, 4433. [Google Scholar] [CrossRef]
- Peiretti, P.G.; Karamać, M.; Janiak, M.; Longato, E.; Meineri, G.; Amarowicz, R.; Gai, F. Phenolic Composition and Antioxidant Activities of Soybean (Glycine max (L.) Merr.) Plant during Growth Cycle. Agronomy 2019, 9, 153. [Google Scholar] [CrossRef] [Green Version]
- Noman, O.M.; Nasr, F.A.; Alqahtani, A.S.; Al-zharani, M.; Cordero, M.A.; Alotaibi, A.A.; Bepari, A.; Alarifi, S.; Daoud, A. Comparative Study of Antioxidant and Anticancer Activities and HPTLC Quantification of Rutin in White Radish (Raphanus sativus L.) Leaves and Root Extracts Grown in Saudi Arabia. Open Chem. 2021, 19, 408–416. [Google Scholar] [CrossRef]
- Yücetepe, A.; Altin, G.; Özçelik, B. A Novel Antioxidant Source: Evaluation of in vitro Bioaccessibility, Antioxidant Activity and Polyphenol Profile of Phenolic Extract from Black Radish Peel Wastes (Raphanus sativus L. Var. Niger) During Simulated Gastrointestinal Digestion. Int. J. Food Sci. 2021, 56, 1376–1384. [Google Scholar] [CrossRef]
- Chorol, S. Antioxidant Content in Different Parts of Radish (Raphanus sativus L.) From Cold Arid Ladakh Region of Trans- Himalaya (Jammu and Kashmir). Pharmacogn. J. 2019, 11, 1064–1070. [Google Scholar] [CrossRef] [Green Version]
- Banihani, S.A. Radish (Raphanus sativus) and Diabetes. Nutrients 2017, 9, 1014. [Google Scholar] [CrossRef] [Green Version]
- Guo, F.; Xiong, H.; Wang, X.; Jiang, L.; Yu, N.; Hu, Z.; Sun, Y.; Tsao, R. Phenolics of Green Pea (Pisum sativum L.) Hulls, Their Plasma and Urinary Metabolites, Bioavailability, and in vivo Antioxidant Activities in a Rat Model. J. Agric. Food Chem. 2019, 67, 11955–11968. [Google Scholar] [CrossRef]
- Hossain, M.A.; Arafat, M.Y.; Alam, M.; Hossain, M.M. Effect of Solvent Types on the Antioxidant Activity and Total Flavonoids of Some Bangladeshi Legumes. Food Res. 2021, 5, 329–335. [Google Scholar] [CrossRef]
- Paśko, P.; Tyszka-Czochara, M.; Galanty, A.; Gdula-Argasińska, J.; Żmudzki, P.; Bartoń, H.; Zagrodzki, P.; Gorinstein, S. Comparative Study of Predominant Phytochemical Compounds and Proapoptotic Potential of Broccoli Sprouts and Florets. Plant Foods Hum. Nutr. 2018, 73, 95–100. [Google Scholar] [CrossRef] [Green Version]
- Sousa, C.; Lopes, G.; Pereira, D.; Taveira, M.; Valentao, P.; Seabra, R.; Pereira, J.A.; Baptista, P.; Ferreres, F.; Andrade, P. Screening of Antioxidant Compounds During Sprouting of Brassica oleracea L. var. costata DC. Comb. Chem. High Throughput Screen. 2007, 10, 377–386. [Google Scholar] [CrossRef] [PubMed]
- Tamprasit, K.; Weerapreeyakul, N.; Sutthanut, K.; Thukhammee, W.; Wattanathorn, J. Harvest Age Effect on Phytochemical Content of White and Black Glutinous Rice Cultivars. Molecules 2019, 24, 4432. [Google Scholar] [CrossRef] [Green Version]
- Seal, T.; Pillai, B.; Chaudhuri, K. Identification and Quantification of Phenolic Acids by HPLC, In Two Wild Edible Plants Viz. Solanum gilo and Solanum kurzii Collected from North-Eastern Region in India. J. Chem. Biol. Phys. Sci. 2016, 6, 1108–1121. [Google Scholar]
- So, V.; Pocasap, P.; Sutthanut, K.; Sethabouppha, B.; Thukhammee, W.; Wattanathorn, J.; Weerapreeyakul, N. Effect of Harvest Age on Total Phenolic, Total Anthocyanin Content, Bioactive Antioxidant Capacity and Antiproliferation of Black and White Glutinous Rice Sprouts. Appl. Sci. 2020, 10, 7051. [Google Scholar] [CrossRef]
- Zohra, T.; Ovais, M.; Khalil, A.T.; Qasim, M.; Ayaz, M.; Shinwari, Z.K. Extraction Optimization, Total Phenolic, Flavonoid Contents, HPLC-DAD Analysis and Diverse Pharmacological Evaluations of Dysphania ambrosioides (L.) Mosyakin & Clemants. Nat. Prod. Res. 2019, 33, 136–142. [Google Scholar] [CrossRef]
- Zkan, G.; Ersus, B.S. Enzyme-Assisted Extraction of Stabilized Chlorophyll from Spinach. Food Chem. 2015, 176, 152–157. [Google Scholar] [CrossRef]
- Elufioye, T.O.; Olusola, D.M.; Oyedeji, A.O. Correlation of Total Phenolic, Flavonoid and Tannin Content of Bryophyllum pinnatum (L.) (Crassulaceae) Extract with the Antioxidant and Anticholinesterase Activities. Pharmacogn. J. 2019, 11, 1003–1009. [Google Scholar] [CrossRef] [Green Version]
- Ghane, S.; Attar, U.; Yadav, P.; Lekhak, M. Antioxidant, Anti-Diabetic, Acetylcholinesterase Inhibitory Potential and Estimation of Alkaloids (Lycorine and Galanthamine) from Crinum Species: An Important Source of Anticancer and Anti-Alzheimer Drug. Ind. Crop. Prod. 2018, 125, 168–177. [Google Scholar] [CrossRef]
- Pauliuc, D.; Dranca, F.; Oroian, M. Antioxidant Activity, Total Phenolic Content, Individual Phenolics and Physicochemical Parameters Suitability for Romanian Honey Authentication. Foods 2020, 9, 306. [Google Scholar] [CrossRef] [Green Version]
- Senhaji, S.; Lamchouri, F.; Boulfia, M.; Lachkar, N.; Bouabid, K.; Toufik, H. Mineral Composition, Content of Phenolic Compounds and in vitro Antioxidant and Antibacterial Activities of Aqueous and Organic Extracts of the Seeds of Peganum harmala L. S. Afr. J. Bot. 2022, 147, 697–712. [Google Scholar] [CrossRef]
- Lee, C.H.; Lee, T.H.; Ong, P.Y.; Wong, S.L.; Hamdan, N.; Elgharbawy, A.A.; Azmi, N.A. Integrated Ultrasound-Mechanical Stirrer Technique for Extraction of Total Alkaloid Content from Annona muricata. Process. Biochem. 2021, 109, 104–116. [Google Scholar] [CrossRef]
- Paśko, P.; Bartoń, H.J.; Zagrodzki, P.; Gorinstein, S.; Fołta, M.; Zachwieja, Z. Anthocyanins, Total Polyphenols and Antioxidant Activity in Amaranth and Quinoa Seeds and Sprouts During Their Growth. Food Chem. 2009, 115, 994–998. [Google Scholar] [CrossRef]
- Ali, A.M.A.; El-Nour, M.E.M.; Yagi, S.M. Total Phenolic and Flavonoid Contents and Antioxidant Activity of Ginger (Zingiber officinale Rosc.) Rhizome, callus and callus Treated with some Elicitors. J. Genet. Eng. Biotechnol. 2018, 16, 677–682. [Google Scholar] [CrossRef]
- Chen, G.-L.; Chen, S.-G.; Xiao, Y.; Fu, N.-L. Antioxidant Capacities and Total Phenolic Contents of 30 Flowers. Ind. Crop. Prod. 2018, 111, 430–445. [Google Scholar] [CrossRef]
- Zhong, Y.; Shahidi, F. Methods for the Assessment of Antioxidant Activity in Foods. In Handbook of Antioxidants for Food Preservation; Elsevier: Amsterdam, The Netherlands, 2015; pp. 287–333. ISBN 9781782420972. [Google Scholar]


| Standard Compounds | Retention Time (min) | |||
|---|---|---|---|---|
| 280 nm | 320 nm | 370 nm | ||
| Hydroxybenzoic Acids | Gallic acid (1) | 7.24 ± 0.07 | 7.24 ± 0.07 | Not detected |
| Syringic acid (4) | 23.47 ± 0.16 | 23.47 ± 0.16 | Not detected | |
| Benzaldehyde | Vanillin (5) | 28.67 ± 0.04 | 28.67 ± 0.04 | 28.67 ± 0.04 |
| Hydroxycinnamic Acids | Chlorogenic acid (2) | 16.51 ± 0.28 | 16.51 ± 0.28 | 16.51 ± 0.28 |
| Caffeic acid (3) | 21.57 ± 0.49 | 21.57 ± 0.49 | 21.57 ± 0.49 | |
| Flavonoids | Rutin (6) | 36.15 ± 0.08 | 36.15 ± 0.08 | 36.15 ± 0.08 |
| Compounds | Detected Amount (mg/g of Crude Extract) | ||||||||
|---|---|---|---|---|---|---|---|---|---|
| SF | MT | BS | TG | MB | SB | WR | CR | GP | |
| (i) Hydroxybenzoic acids | |||||||||
| Gallic acid (1) | ND | 1.37 ± 0.01 d,B | ND | ND | 2.50 ± 0.02 c,A | 4.06 ± 0.01 a,A | ND | ND | 3.34 ± 0.01 b,B |
 | |||||||||
| Syringic acid (4) | ND | ND | 0.464 ± 0.003 a,C | 0.052 ± 0.004 d,D | 0.089 ± 0.003 b,C | 0.019 ± 0.001 e,E | 0.069 ± 0.004 c,D | 0.066 ± 0.003 c,D | 0.070 ± 0.005 c,D |
 | |||||||||
| (ii) Hydroxycinnamic acids | |||||||||
| Chlorogenic acid (2) | ND | 2.39 ± 0.01 a,A | ND | 2.02 ± 0.01 e,A | 2.06 ± 0.00 d,B | 1.98 ± 0.01 f,B | ND | 2.21 ± 0.01 c,A | 2.38 ± 0.03 b,C |
 | |||||||||
| Caffeic acid (3) | 14.91 ± 0.08 a,A | 0.87 ± 0.01 c,D | ND | 0.60 ± 0.00 d,C | ND | ND | 0.35 ± 0.04 e,C | ND | 4.65 ± 0.07 b,A |
 | |||||||||
| (iii) Benzaldehydes | |||||||||
| Vanillin (5) | 1.62 ± 0.01 c,B | ND | 0.94 ± 0.01 e,B | 1.6 ± 0.02 d,B | ND | 0.83 ± 0.01 f,D | 2.03 ± 0.01 a,A | 1.75 ± 0.01 b,B | ND |
 | |||||||||
| (iv) Flavonoids | |||||||||
| Rutin (6) | ND | 0.9 ± 0.00 d,C | 5.29 ± 0.02 a,A | 0.59 ± 0.01 f,C | ND | 1.40 ± 0.07 c,C | 0.79 ± 0.07 e,B | 0.54 ± 0.01 g,C | 2.49 ± 0.02 b,C |
 | |||||||||
| Samples | DPPH IC50 (µg/mL) | ABTS IC50 (µg/mL) | FRAP Value (mM FeSO4/g CE) |
|---|---|---|---|
| SF | 1201.0 ± 38.47 g | ND | 0.023 ± 0.0020 d |
| MT | 1480.7 ± 154.93 h | ND | 0.024 ± 0.00005 d |
| BS | 486.3 ± 58.03 c,d | 527.4 ± 77.86 c | 0.032 ± 0.0034 c |
| TG | 283.6 ± 25.87 b | 108.2 ± 18.87 b | 0.031 ± 0.0004 c |
| MB | 556.5 ± 18.30 e | ND | 0.019 ± 0.0008 d |
| SB | 403.5 ± 36.78 c | ND | 0.0044± 0.0001 e |
| WR | 527.9 ± 14.87 d,e | 813.6 ± 57.10 d | 0.064 ± 0.0039 b |
| CR | 422.7 ± 43.05 c,d | 446.4 ± 45.75 c | 0.059 ± 0.0025 b |
| GP | 704.5 ± 23.80 f | ND | 0.031 ± 0.0012 c |
| Trolox | 32.6 ± 4.14 a | 44.0 ± 0.680 a | - |
| Quercetin | - | - | 0.56 ± 0.019 a |
Disclaimer/Publisher’s Note: The statements, opinions and data contained in all publications are solely those of the individual author(s) and contributor(s) and not of MDPI and/or the editor(s). MDPI and/or the editor(s) disclaim responsibility for any injury to people or property resulting from any ideas, methods, instructions or products referred to in the content. |
© 2023 by the authors. Licensee MDPI, Basel, Switzerland. This article is an open access article distributed under the terms and conditions of the Creative Commons Attribution (CC BY) license (https://creativecommons.org/licenses/by/4.0/).
Share and Cite
So, V.; Poul, P.; Oeung, S.; Srey, P.; Mao, K.; Ung, H.; Eng, P.; Heim, M.; Srun, M.; Chheng, C.; et al. Bioactive Compounds, Antioxidant Activities, and HPLC Analysis of Nine Edible Sprouts in Cambodia. Molecules 2023, 28, 2874. https://doi.org/10.3390/molecules28062874
So V, Poul P, Oeung S, Srey P, Mao K, Ung H, Eng P, Heim M, Srun M, Chheng C, et al. Bioactive Compounds, Antioxidant Activities, and HPLC Analysis of Nine Edible Sprouts in Cambodia. Molecules. 2023; 28(6):2874. https://doi.org/10.3390/molecules28062874
Chicago/Turabian StyleSo, Visessakseth, Philip Poul, Sokunvary Oeung, Pich Srey, Kimchhay Mao, Huykhim Ung, Poliny Eng, Mengkhim Heim, Marnick Srun, Chantha Chheng, and et al. 2023. "Bioactive Compounds, Antioxidant Activities, and HPLC Analysis of Nine Edible Sprouts in Cambodia" Molecules 28, no. 6: 2874. https://doi.org/10.3390/molecules28062874