Article

Luminescent Properties and Charge Compensator Effects of SrMo0.5W0.5O4:Eu3+ for White Light LEDs

1
Institute of Petrochemical Technology, Jilin Institute of Chemical Technology, Jilin 132022, China
2
School of Chemical Engineering, Northeast Electric Power University, Jilin 132012, China
*
Author to whom correspondence should be addressed.
Molecules 2023, 28(6), 2681; https://doi.org/10.3390/molecules28062681
Submission received: 10 January 2023 / Revised: 12 March 2023 / Accepted: 13 March 2023 / Published: 16 March 2023
(This article belongs to the Special Issue Luminescent Coordination Compounds)

Abstract

:
The high-temperature solid-phase approach was used to synthesize Eu3+-doped SrMo0.5W0.5O4 phosphors, whose morphological structure and luminescence properties were then characterized by XRD, SEM, FT-IR, excitation spectra, emission spectra, and fluorescence decay curves. The results reveal that the best phosphor synthesis temperature was 900 °C and that the doping of Eu3+ and charge compensators (K+, Li+, Na+, NH4+) had no effect on the crystal phase change. SrMo0.5W0.5O4:Eu3+ has major excitation peaks at 273 nm, 397 nm, and 464 nm, and a main emission peak at 615 nm, making it a potential red fluorescent material to be used as a down converter in UV LEDs (273 nm and 397 nm) and blue light LEDs (464 nm) to achieve Red emission. The emission spectra of Sr1−yMo0.5W0.5O4:yEu3+(y = 0.005, 0.01, 0.02, 0.05, 0.07) excited at 273 were depicted, with the Eu3+ concentration increasing the luminescence intensity first increases and then decreases, the emission peak intensity of SrMo0.5W0.5O4:Eu3+ achieves its maximum when the doping concentration of Eu3+ is 1%, and the critical transfer distance is calculated as 25.57 Å. When various charge compensators such as K+, Li+, Na+, and NH4+ are added to SrMo0.5W0.5O4:Eu3+, the NH4+ shows the best effect with the optimal doping concentration of 3wt%. The SrMo0.5W0.5O4:Eu3+,NH4+ color coordinate is (0.656,0.343), which is close to that of the ideal red light (0.670,0.333).

1. Introduction

As a new generation of the light source of solid-state lighting, white light-emitting diodes (hereafter referred to as the white light LEDs, w-LEDs, etc.) have piqued the interest of scholars both at home and abroad for their high efficiency, energy savings, and environmental protection advantages [1,2,3,4]. The white light LED used to be created by combining a GaN chip that emits blue light with yellow phosphors (YAG:Ce3+) that can be effectively excited by blue light [5]. However, this approach typically generates a low color rendering index because of the lack of red light in the emission spectrum of the yellow phosphor. The solution is to add red phosphors that can be efficiently excited by blue light [6,7] or use the high-efficiency UV LED and the phosphors that can be excited by it [8,9]. As a result, it is critical to investigate red phosphors that can be successfully stimulated by blue light and UV light.
It is well known that Eu3+ is an outstanding rare earth ion generating red light and can be effectively stimulated by blue light and UV light [10,11,12,13,14]. For instance, a new red phosphor Sr3NaSbO6:Eu3+ doped with Eu3+ was developed, and its emission spectra under excitation at 285 nm is located 500–700 nm, with the primary peak at 618 nm, indicating that this phosphor is a red phosphor that can be successfully stimulated by UV light [15]. Li2.06Nb0.18Ti0.76O3:Eu3+ phosphors by sol-gel method were prepared. When the doping proportion of Eu3+ is x = 3 wt%, the primary excitation peak is at 396 nm, the central emission peak is at 612 nm, and its color coordinate is better than the commercial red phosphor Y2O3:Eu3+ [16]. The phosphors Y2SiO5:Eu3+ synthesized by the solid-state reaction method can be effectively excited by near-UV (394 nm), and the major peak is located at 611 nm, the critical quenching concentration of Eu3+ in the phosphor is determined to be 15 mol%, and the critical transfer distance is calculated as 8.90 Å; co-doping Y2SiO5:Eu3+ with Ge4+ helps to improve the luminescence intensity and color purity, it can be concluded that efficient red light emitting diodes were fabricated using Ge4+, Eu3+ co-doped phosphor based on near ultraviolet(NUV) excited LED lights [17]. By using a high-temperature solid-phase reaction, a new lithium salt type NaBaBi2(PO4)3:Eu3+ phosphor was synthesized, which can emit a main peak at 611 nm under the effective excitation of near UV and blue light, the color temperature and color purity are about 1800K and 88%, respectively, making it an excellent red, warm light material [18]. Eu3+-doped BaLaWO7 and SrLa2WO7 red phosphors were synthesized using the traditional solid-state reaction method [19].
Based on their low phonon energy, outstanding chemical and physical properties, good thermal stability, and strong charge transfer zone in the ultraviolet region, tungstates and molybdates have been widely employed as host materials to phosphors [20,21]. A highly uniform spindle-shaped SrMoO4:Eu3+ phosphor was developed, which produces the Eu3+ characteristic transition peak 5D0-7FJ (J = 1, 2, 3, 4) under ultraviolet light excitation (287 nm), with the 5D0-7F2 transition (613 nm) in the red region being the strongest [22]. The produced SrMoO4:Eu3+ phosphors synthesized by Yanan Zhu et al. can be successfully activated by ultraviolet light at 396 nm and emit red light with a prominent peak at 616 nm [23]. Dy3+-doped SrMoO4 nanophosphors were synthesized, which emit blue light at 485 nm and bright yellow light at 576 nm Under UV illumination at 353 nm [24]. SrWO4:Eu3+ phosphor was synthesized using the microwave radiation heating approach. The phosphor’s excitation spectrum falls in a strong absorption band centered at 295 nm and two weak sharp peaks centered at 389 and 467 nm, and the primary peaks of its emission spectra are positioned at 589 nm and 616 nm [25]. SrWO4:Eu3+ phosphors have been successfully synthesized, with the most substantial emission peaks in the emission spectrum at 615 nm under near UV (394 nm) and blue light (450 nm) excitation [26]. The emission intensity of CaW0.4MoO4:Eu3+ red phosphor is estimated to be 8.3 times that of CaWO4:Eu3+ phosphor [27]. It was discovered that adding Mo(VI) ions to the red phosphor Sr2ZnWO6:Eu3+ red phosphor significantly increased the emission intensity [28]. The phosphor Ca0.3Sr0.7−1.5y−1.5zMo1−xWxO4:EuyLuz was synthesized, and the most incredible emission intensity was observed at x = 0.2, y = 0.1 and z = 0.1 [29]. Gd2(1−x)Eu2x(MoyW1−yO4)3 phosphors were synthesized, and its highest emission intensities increased with more W(VI) [30]. Despite a significant number of reports on tungstate-molybdate phosphors, there are fewer on SrMo0.5W0.5O4:Eu3+.
This research synthesized the red phosphors SrWO4:Eu3+, SrMo0.5W0.5O4:Eu3+, and SrMoO4:Eu3+ using a high-temperature solid-phase technique. Moreover, it examines their spectrum properties as well as the effect of different charge compensators on the luminescence properties of SrMo0.5W0.5O4:Eu3+.

2. Results and Discussion

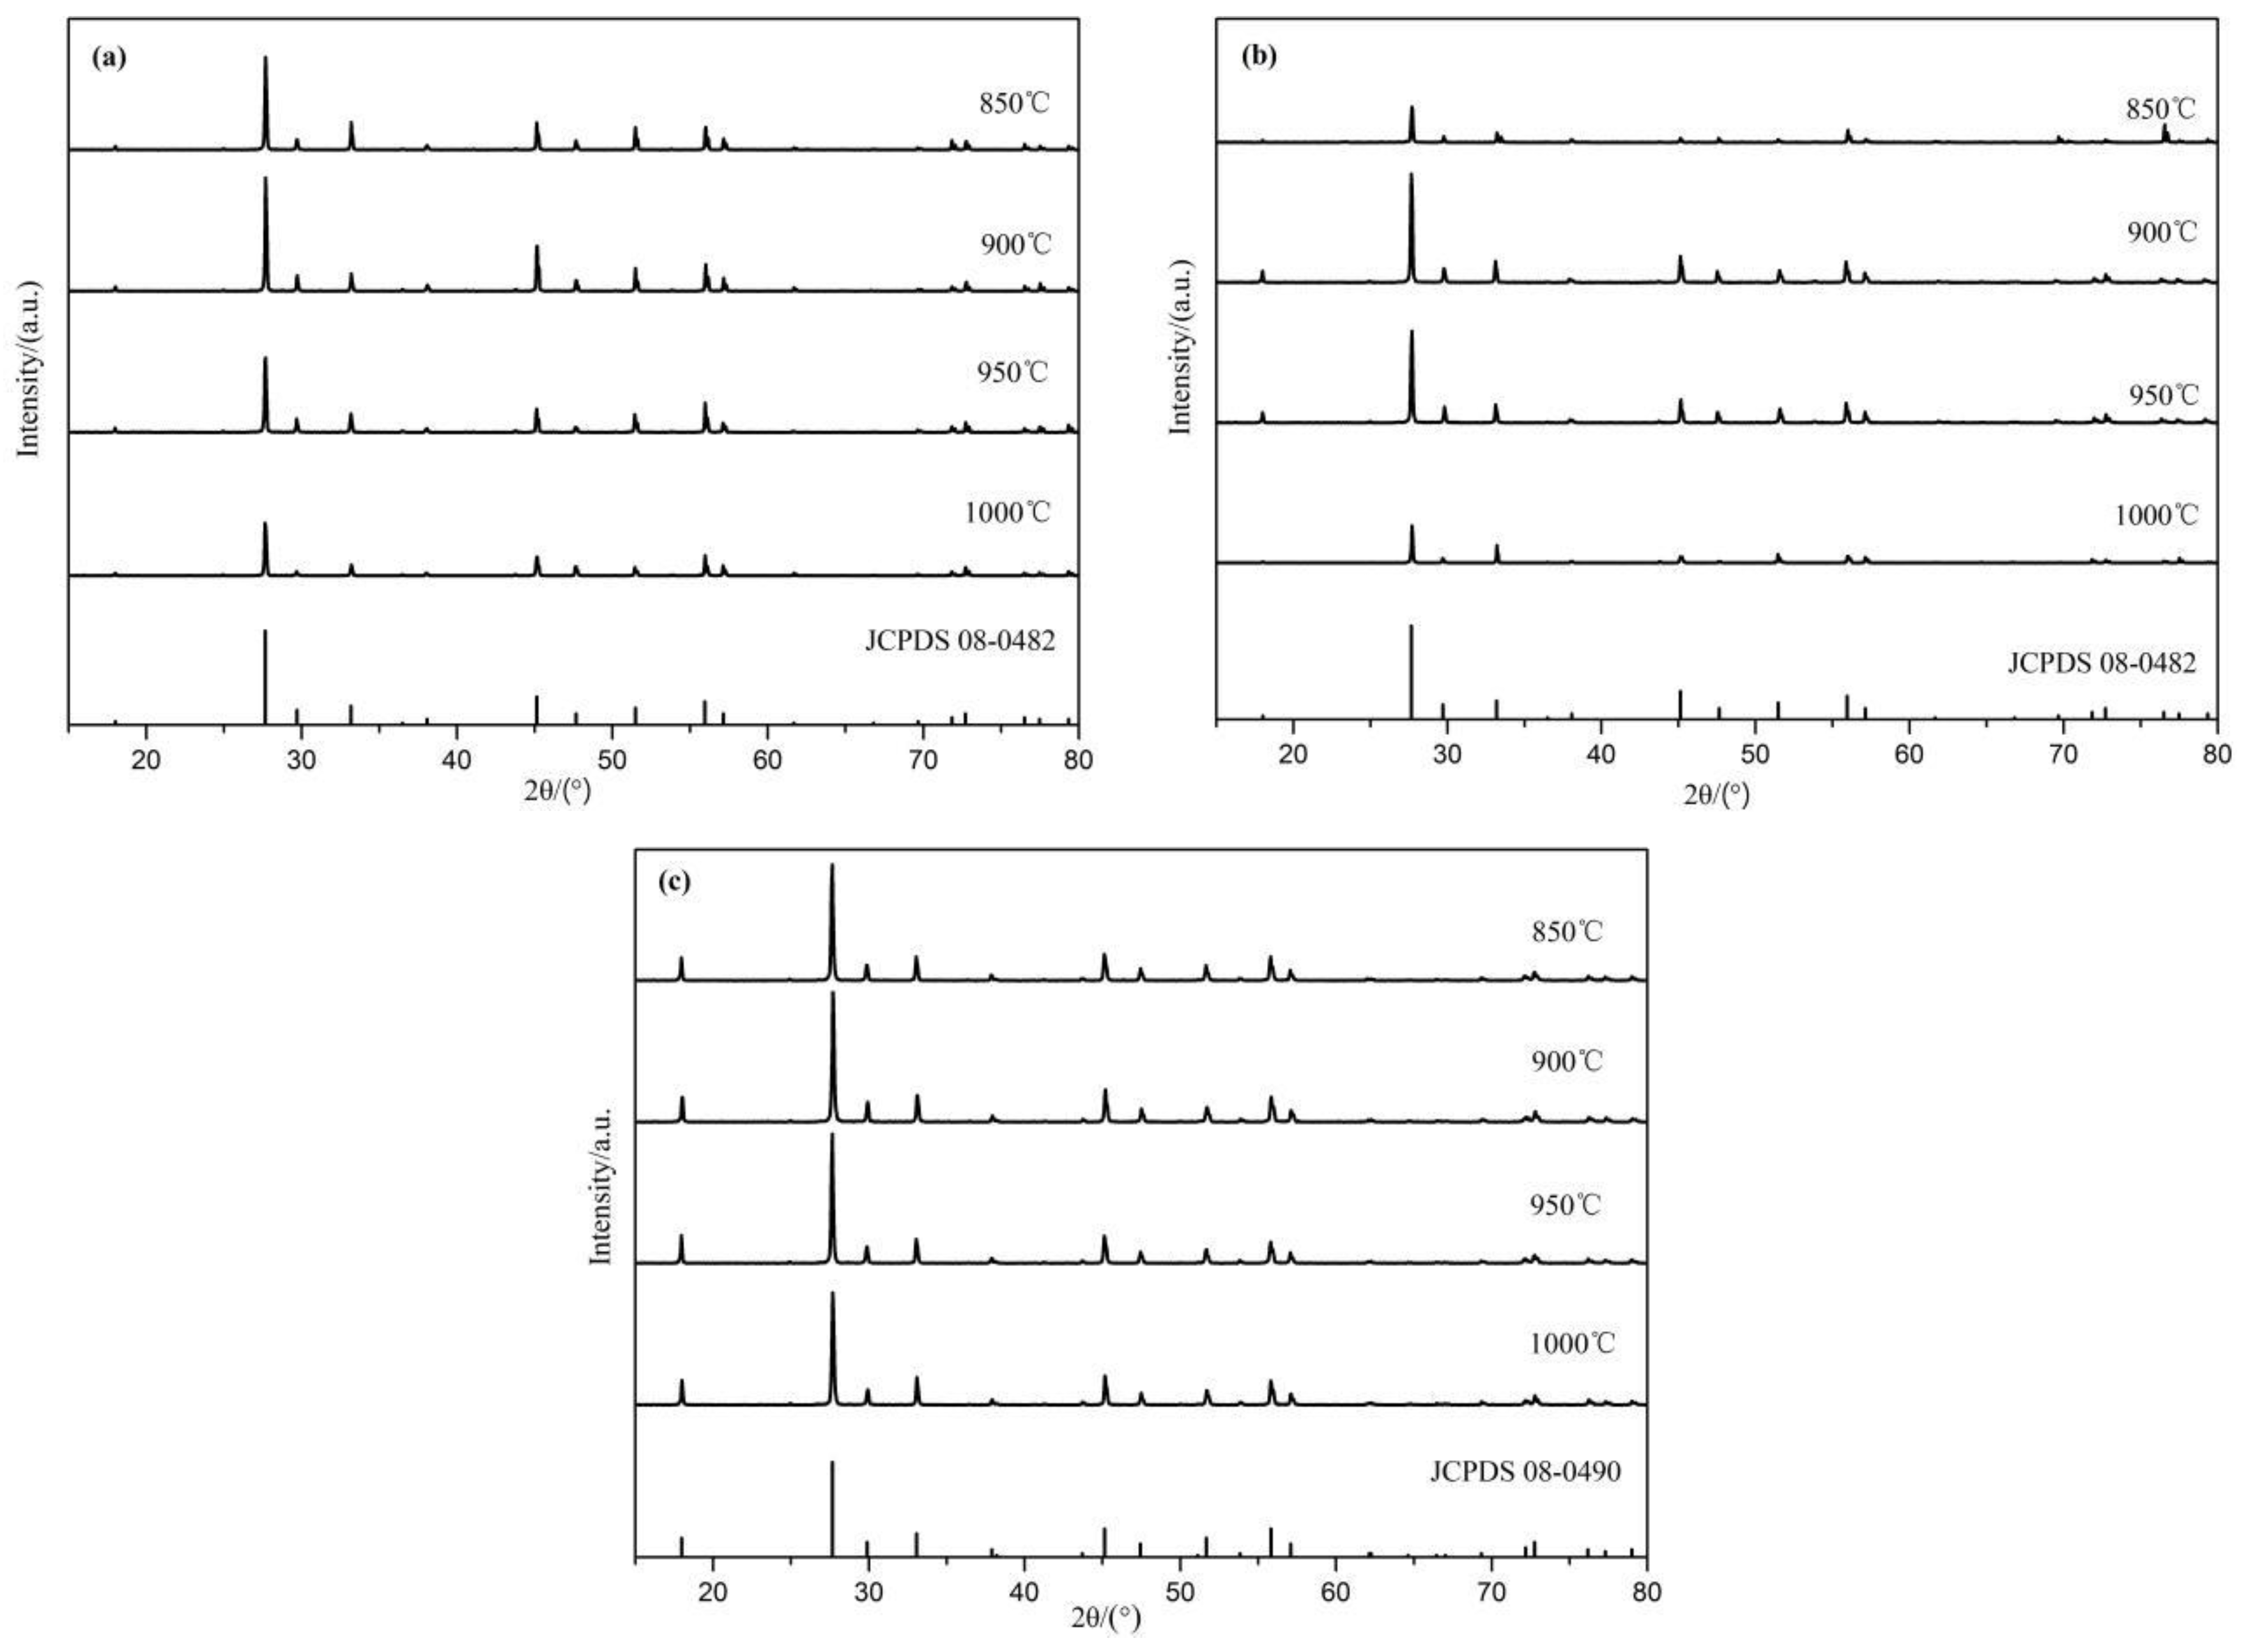
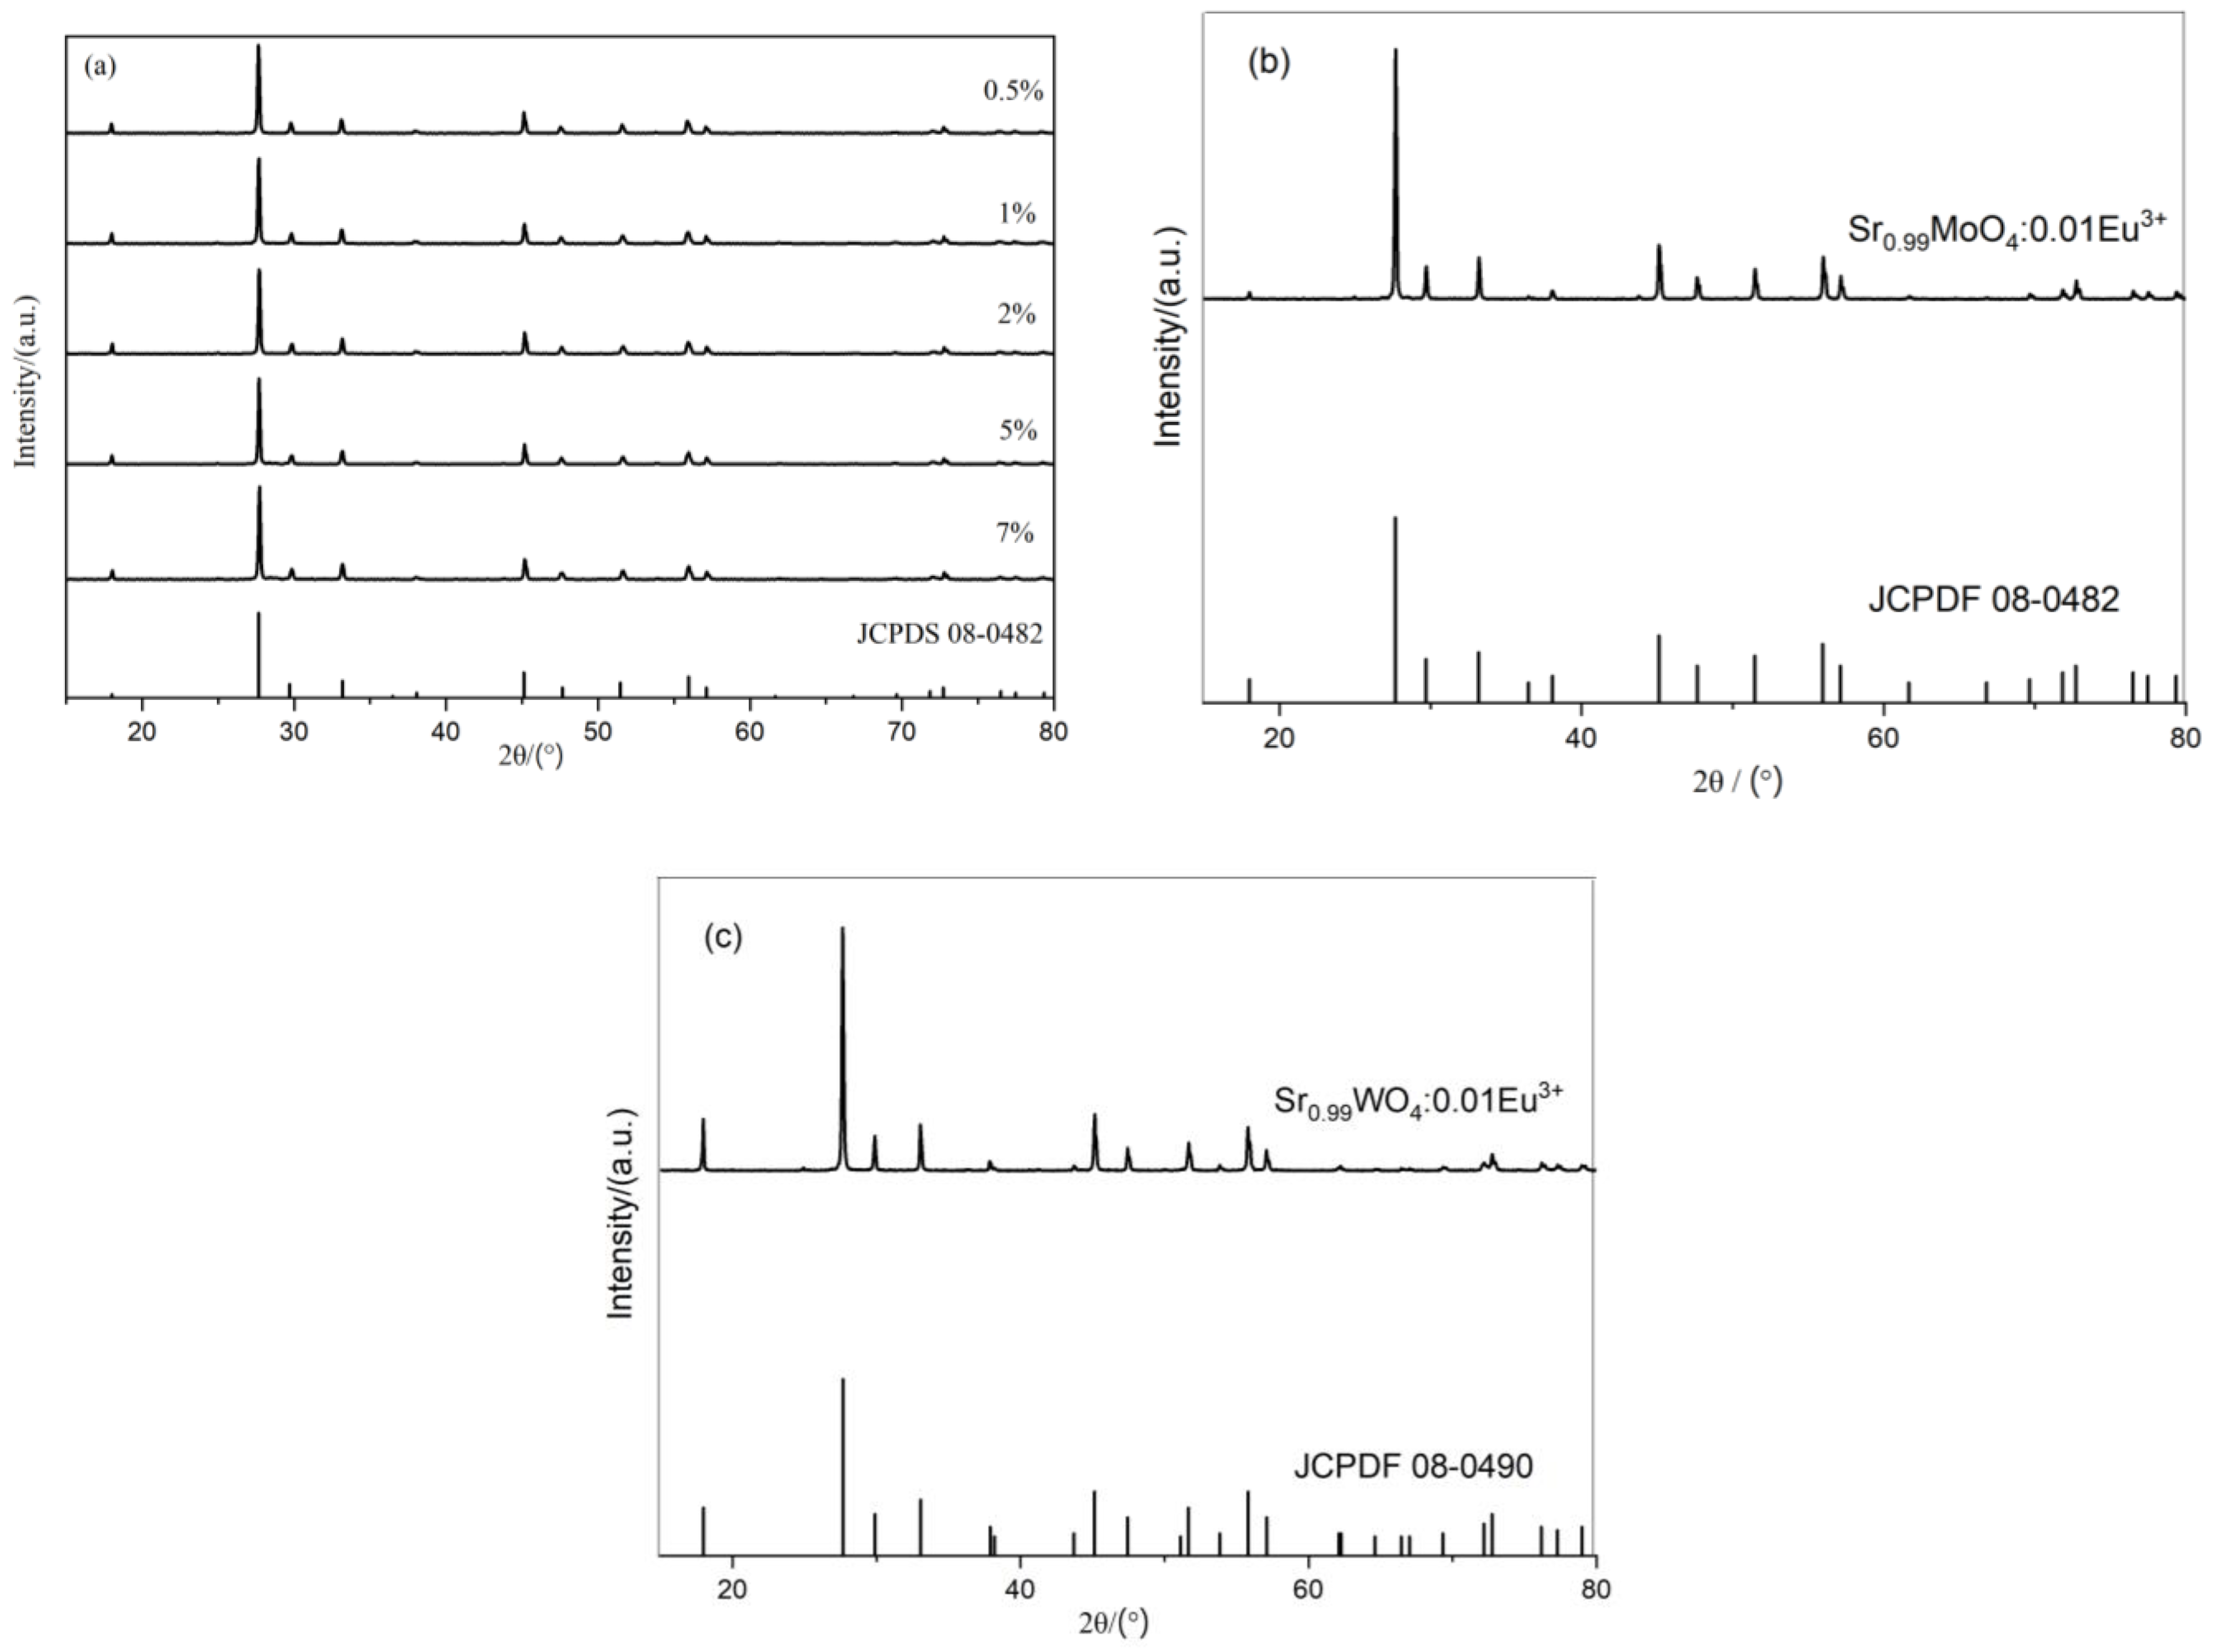
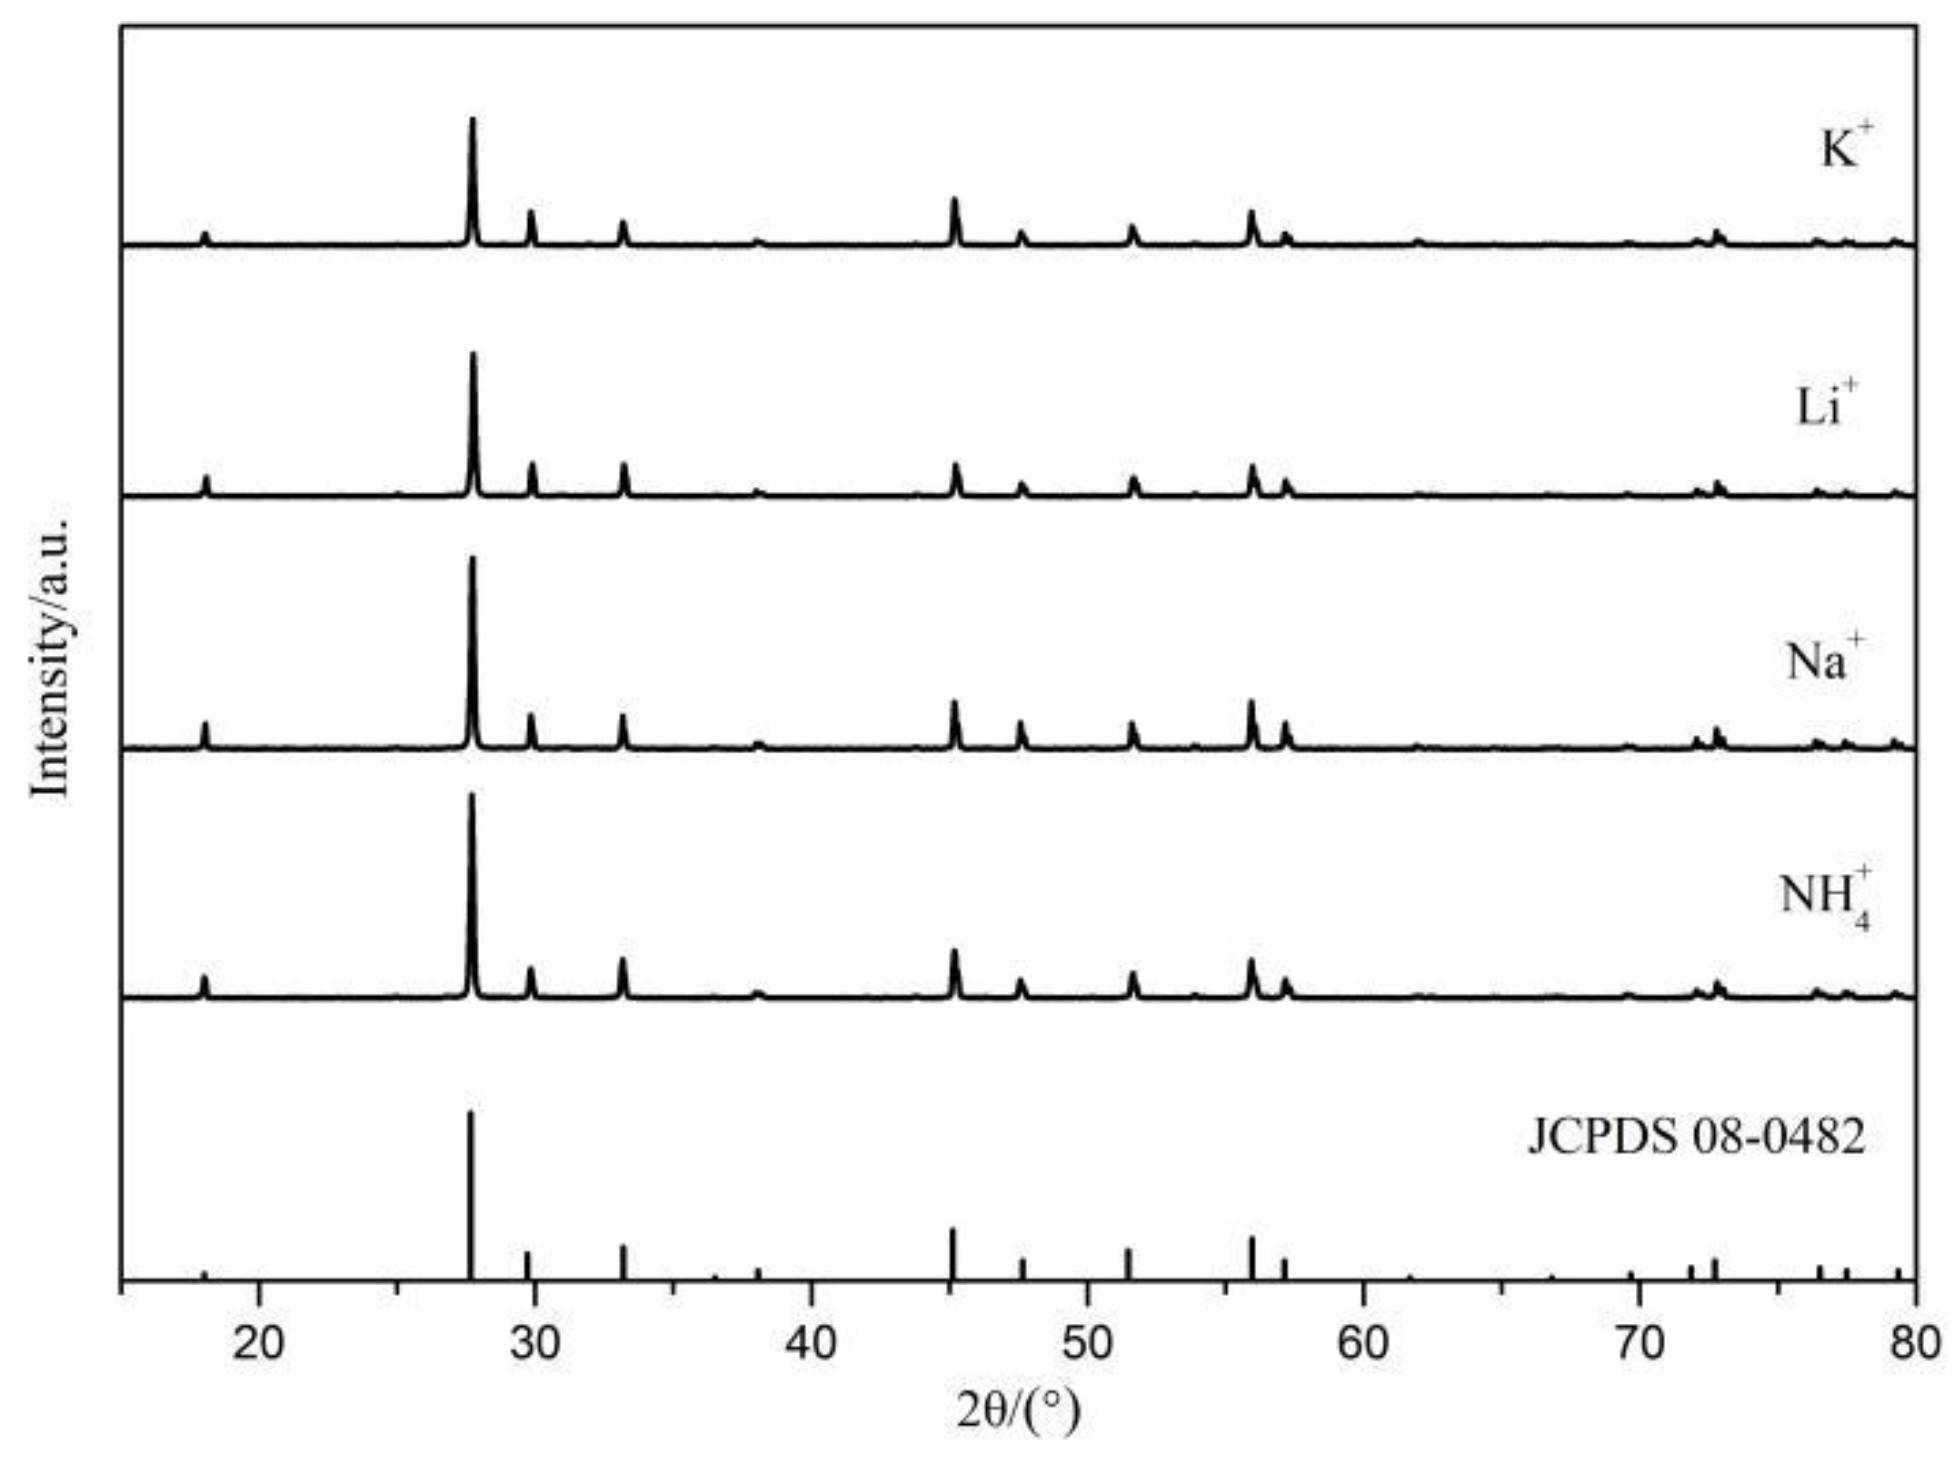
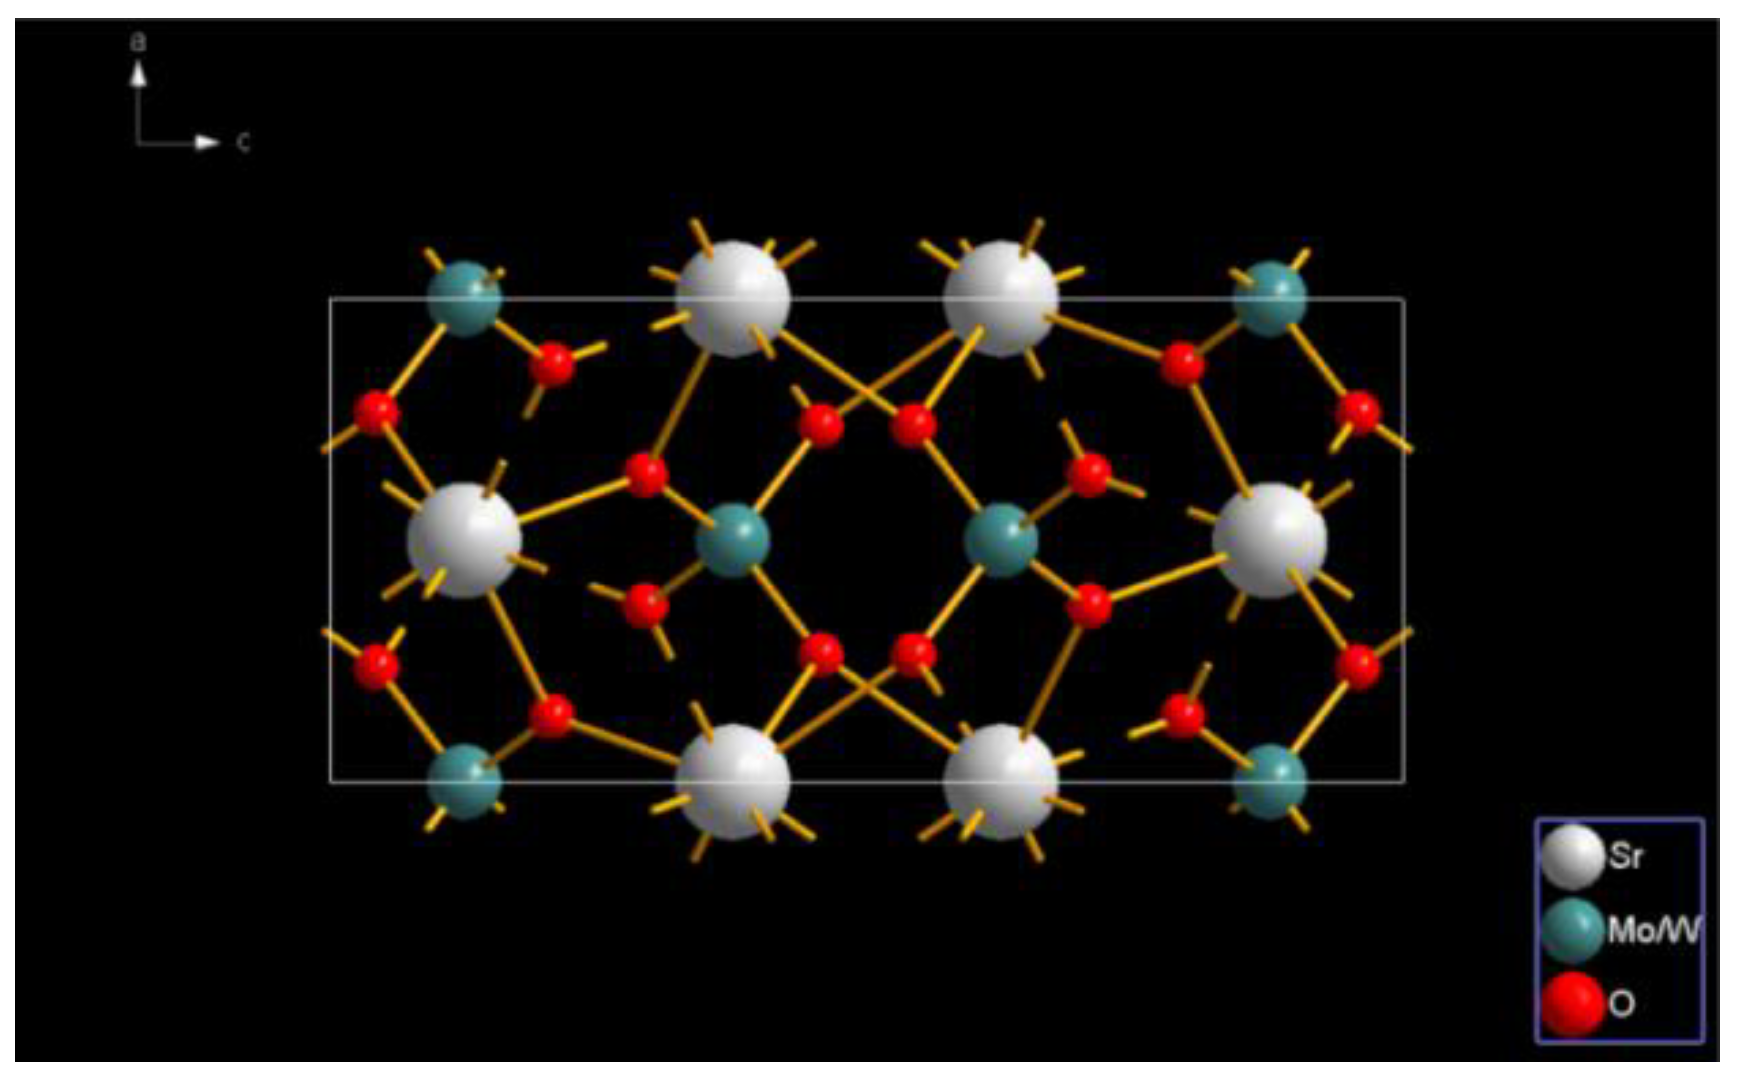
2.1. Physical and Chemical Phase Analysis

Figure 1 reveals the X-ray powder diffraction (XRD) patterns of (a) SrMoO4, (b) SrMo0.5W0.5O4, and (c) SrWO4 synthesized at different temperatures. Figure 1a shows that the XRD patterns’ peak positions and relative intensities of the XRD patterns of the sample SrMoO4 at temperatures of 850 °C, 900 °C, 950 °C, and 1000 °C are essentially the same, which is consistent with the standard card of SrMoO4 (JCPDS 08-0482), indicating that the synthesized samples have a tetragonal crystal system with space group I41/a, and its unit cell data are a = b = 5.3909 Å, c = 12.0118 Å and α = β = γ = 90°. Strontium molybdate can be synthesized at these temperatures without forming an impurity phase. Furthermore, the highest peak intensity was discovered in the sample synthesized at 900 °C, indicating that the crystallinity of the sample is better at this temperature. As a result, the temperature to synthesize SrMoO4 is set to 900 °C. Figure 1b displays that the XRD patterns’ peak positions and relative intensities of the XRD patterns of the sample SrMo0.5W0.5O4 at those temperatures are essentially consistent with the standard card of SrMoO4 (JCPDS 08-0482), demonstrating that the synthesized samples have the structure of SrMoO4, and no new phase is formed. Due to the lanthanide contraction, the atomic and ionic radii of Mo and W, the second and third transition elements in the same group are very close (the atomic radii of Mo and W are both 139 pm, and the ionic radii of Mo(VI) and W(VI) are 59 pm and 60 pm, respectively), and their properties are quite similar. Besides, the structures of MoO42− and WO42− are the same. As a result, WO42− can easily replace MoO42− to form a solid solution. The peak intensity of the XRD pattern of SrMo0.5W0.5O4 at 900 °C is higher, indicating that the sample’s crystallinity is better at this temperature. As a result, 900 °C is the optimal synthesis temperature for SrMo0.5W0.5O4. Figure 1c shows that the XRD patterns of SrWO4 synthesized at temperatures of 850 °C, 900 °C, 950 °C, and 1000 °C are consistent with the standard card of SrWO4 (JCPDS 08-0490), indicating that the synthesized samples have a tetragonal crystal structure with the space group is I41/a (88), and that can synthesize pure phase strontium tungstate at these temperatures. Because the XRD peak of SrWO4 synthesized at 900 °C is the strongest, 900 °C is the best SrWO4 synthesis temperature.
Figure 2a shows that the diffraction peaks of the Sr1−xMo0.5W0.5O4:xEu3+ XRD pattern are in line with the standard card #JCPDS 08-0482 (SrMoO4), indicating that the doping of Eu3+ in the SrMo0.5W0.5O4 system did not cause phase change and no new phase was created. Rare earth metal Eu and alkaline-earth metal Sr have similar atomic and ionic radii (the atomic radii of Eu and Sr are 208 pm and 215 pm, respectively, while the ionic radii of Eu3+ and Sr2+ are 112 pm and 94.7 pm, respectively). When Eu3+ is doped into the SrMo0.5W0.5O4 system, it takes the position of Sr2+ and creates a continuous solid solution. It has been reported that the O2− is created in the system due to the imbalance in electrovalence as a result of the unequal substitution of Sr2+ with Eu3+ [23]. According to Figure 2b, the diffraction peaks of the XRD pattern of the phosphor Sr0.99MoO4:0.01Eu3+ are compatible with the standard card #JCPDS 08-0482 (SrMoO4), indicating that the sample forms pure phase SrMoO4, and no additional phases are created. That is to say, 1% Eu3+ can be added to SrMoO4 without generating a phase shift. As seen in Figure 2c, the diffraction peaks of the XRD pattern of the phosphor Sr0.99WO4:0.01Eu3+ are consistent with the standard card #JCPDS 08-0490 (SrWO4), indicating that the pure phase can still be obtained formed by doping 1% Eu3+ in SrWO4, and no additional substances form.
The electrovalent imbalance induced by the unequal substitution of Sr2+ with Eu3+ in the Sr0.99Mo0.5W0.5O4:0.01Eu3+ system can be rectified by adding charge compensators [31]. Figure 3 depicts the XRD patterns of SrMo0.5W0.5O4:Eu3+ after doping with various charge compensators. Figure 3 shows that the XRD diffraction peaks of SrMo0.5W0.5O4: Eu3+ after adding charge compensator K2CO3, Li2CO3, Na2CO3, NH4Cl are essentially consistent with the standard card of SrMoO4 (JCPDS 08-0482), that is, there is no charge in the lattice of SrMo0.5W0.5O4:Eu3+, and the phase is still SrMo0.5W0.5O4.
SrMo0.5W0.5O4 has a tetragonal crystal system with a scheelite structure, and each of its units contains one Sr site, one Mo/W site, and four O sites. According to Figure 4, there is only one type of cationic site, Sr, in the lattice, and each, on average, has eight coordinated oxygen ions which include four MoO42−/WO42− that belong to the S4 symmetry and have no inversion center. Each central W/Mo site is coordinated with four identical O, forming a MoO42−/WO42− tetrahedron. As the MoO42−/WO42− tetrahedral configuration is quite stable, SrMo0.5W0.5O4 retains its lattice structure when Sr2+ is replaced by Eu3+.
The FT-IR spectrum of the sample SrMo0.5W0.5O4 was obtained by the KBr pressed disc method. As shown in Figure 5, the FT-IR spectra of the prepared samples have absorption peaks at 818 cm−1, 1630 cm−1, and 3420 cm−1, where the absorption peak at 818 cm−1 corresponds to the stretching vibration of O-W/Mo-O, indicating the existence of WO42− and MoO42− groups in the prepared samples. The absorption peaks at 1630 cm−1 and 3420 cm−1 are respectively attributed to the bending and stretching vibrations of O-H, causing the water vapor on the surface of the SrMo0.5W0.5O4 surface sample.
Figure 6 shows the SEM photos of the phosphor Sr0.99Mo0.5W0.5O4:Eu3+ synthesized using a high-temperature solid phase technique at 900 °C. The phosphor Sr0.99Mo0.5W0.5O4:0.01Eu3+ has sharp edges and corners, an irregular form, and a particle size of around 2 μm, with agglomeration produced by high-temperature solid-phase preparation.

2.2. Analysis of Luminescence Performance

Figure 7a–f show the excitation spectra of SrWO4:Eu3+, SrMo0.5W0.5O4: Eu3+, and SrMoO4:Eu3+ at 615 nm, and the emission spectra at 273 nm, respectively. Figure 7a,c,e show that the phosphors SrWO4:Eu3+, SrMo0.5W0.5O4: Eu3+, and SrMoO4:Eu3+ have a solid and broad CT band in the range of 200 nm to 330 nm, with the center wavelength of 273 nm. Furthermore, the f-f characteristic absorption peaks of Eu3+were also observed at 362 nm (7F05D4), 378 nm (7F05G2), 383 nm (7F05G3), 394 nm (7F05L6), 416 nm (7F05D3), 464 nm (7F05D2) and 534 nm (7F05D1); the peaks at 273 nm, 394 nm, and 464 nm are stronger, indicating that SrWO4:Eu3+, SrMo0.5W0.5O4: Eu3+, Figure 7b,d,f demonstrate that the emission spectra of SrWO4:Eu3+, SrMo0.5W0.5O4:Eu3+, and SrMoO4:Eu3+ are composed of a succession of sharp fronts, with several emission peaks detected at 568 nm, 591 nm, 615 nm, and 653 nm, corresponding to the 5D07F0, 5D07F1, 5D07F2, 5D07F3 transitions of Eu3+, respectively. When Eu3+ ions occupy the matrix’s inversion symmetry center site, the magnetic dipole transition of 5D07F1 prevails; conversely, Eu3+ ions occupy the matrix’s non-inversion symmetry center site, Eu3+ electric dipole transition of 5D07F2 dominates. In addition, the red emission peak corresponding to the 5D07F2 transition is the strongest, implying that Eu3+ is located in the non-inversion symmetry center lattice site of host lattices of SrWO4:Eu3+, SrMo0.5W0.5O4: Eu3+, and SrMoO4:Eu3+. So SrMoO4:Eu3+ can be used as a down converter in UV LEDs and blue light LEDs to achieve red emission.
Figure 8 depicts the emission spectra of SrWO4:0.01Eu3+, SrMo0.5W0.5O4:0.01Eu3+, and SrMoO4:0.01Eu3+ under 273 nm monitoring. The emission peak shape and position of Eu3+ ions remain constant across all samples. The intensity of the emission increases after the addition of Mo(VI) ions to SrWO4:Eu3+ and decreases as Mo(VI) ions totally replace the W(VI), and the emission spectrum of Sr0.99Mo0.5W0.5O4:0.01Eu3+ is the strongest. The reason for that is: the introduction of Mo(VI) ions will form MoO42− groups, which can efficiently modulate the diversity of the Eu3+ surrounding environment and shift the symmetry of the local crystal field, thereby promoting the charge transfer transition of O2−→Eu3+, the Eu3+ hypersensitive transition, and the electron-migration energy of MoO42− (M = W, Mo) in the matrix to transfer to Eu3+ [32]. Furthermore, after introducing Mo(VI), the average distance between WO4 groups becomes wider [27], leading to a lower energy transfer between WO4 groups and then more incident energy will be transferred to Eu3+. When the Mo(VI) ion concentration is too high, the impact of the ion-pair interaction between Eu3+ ions will be increased, leading to a reduction in the phosphor’s luminous efficiency [33]. Therefore, inserting Mo(VI) can effectively improve the luminous properties of SrWO4:Eu3+ phosphors.
Figure 9a depicts the emission spectra of SrMo0.5W0.5O4:Eu3+ with varying Eu3+ concentrations excited at 273 nm. Figure 9a shows that all samples’ peak forms and positions remain constant. However, with the Eu3+ concentration increasing, the luminescence intensity first increases and then decreases. The emission peak intensity of Sr0.99Mo0.5W0.5O4:0.01Eu3+ achieves its maximum when the doping concentration of Eu3+ is 1%, and if the concentration of Eu3+ continues to increase, the phenomenon of concentration quenching appears. This is because although the transition of emitted light increases with the increase of the Eu3+ concentration, which can effectively improve the intensity of the emitted light, the continuous increase of the doping amount of Eu3+ will narrow the distance between Eu3+, resulting in a decrease in emission intensity due to nonradiative energy transfer between Eu3+. To look into the energy transfer of Eu3+ ions in SrMo0.5W0.5O4, the critical distance of Eu3+ ions is first estimated using the formula below.
The critical distance Rc can be computed using the Blass theory formula [34]:
R c = 2 ( 3 V 4 π x c N )
In this equation, V denotes the unit cell volume, Xc is the critical concentration of Eu3+ in SrMo0.5W0.5O4(the optimal doping concentration), and N denotes the number of cations per unit cell of SrMo0.5W0.5O4 crystal. Figure 9a shows the critical threshold concentration of Eu3+ is 0.01 in SrMo0.5W0.5O4 crystal, N = 4, V = 349.78 Å3. According to the Blass formula, Rc = 25.57 Å. In general, non-radiative energy transfer modes are broadly classified as electron exchange interaction and electric multipole interaction. When the critical distance Rc is around 5 Å, the non-radiative energy transfer mode is electron exchange interaction. When Rc reaches 25.57 Å, much more than 5 Å, the energy transfer between Eu3+ in SrMo0.5W0.5O4: Eu3+ is electric multipolar interaction.
The energy transfer formula for the electric multipole interaction can be derived using Van Uitert’s theory [35]:
I X = K [ 1 + β ( X ) θ 3 ] 1
In this formula, I is the integrated emission intensity, X is the activator concentration above the critical concentration, and K and β are constants for a given matrix. Analyzing the constant θ confirms the energy transfer mode of the electric multipole interaction, and the number of cations in the unit cell of SrMo0.5W0.5O4 crystal can be deduced. θ = 6, 8, and 10 correspond to dipole-dipole (d-d), dipole-quaternary (d-q), and quaternary-quaternary (q-q) interactions, respectively. Figure 9b reveals the connection between log(I/X) and log(X) of SrMo0.5W0.5O4: Eu3+. If the slope –1.64 is –θ/3, then θ will be 4.92, which the value is closer to 6. As a result, the electric dipole-electric dipole (d-d) interaction causes the quenching concentration in Sr1−xMo0.5W0.5O4:xEu3+.
The partial substitution of Sr2+ by Eu3+ in SrMo0.5W0.5O4:Eu3+ will result in a charge imbalance, leading to excessive charge defects in the lattice and thus decreasing the phosphor luminous efficiency. However, adding the right amount of good charge compensator can increase the sample’s luminous efficiency [31]. Figure 10 depicts the emission spectra of phosphors SrMo0.5W0.5O4: Eu3+, M (M = K+, Li+, Na+, NH4+) doped with various charge compensators. The addition of the charge compensator doesn’t modify the position of the emission peak of SrMo0.5W0.5O4: Eu3+. Various charge compensators have different effects on the luminescence intensity of SrMo0.5W0.5O4:Eu3+, but their doping will improve the luminescence intensity, with NH4+ having the best effect.
Figure 11 depicts the luminescence intensity of Sr0.99Mo0.5W0.5O4:0.01Eu3+ at various NH4+ doping concentrations (0%, 3%, 6%, 10%, 15%). The figure shows that when the concentration of NH4+ is low, the luminescence intensity of the sample increases as the concentration of NH4+ increases. The sample’s emission peak intensity reaches its maximum highest when the NH4+ doping concentration is 3%. As the concentration of NH4+ continues to increase, concentration quenching will occur. This is due to the fact that when the concentration of NH4+ is low, NH4+ can replace the position of Sr2+ in the lattice, lowering the symmetry of the lattice and modifying the local crystal field environment around Eu3+, which eventually increases the sample’s luminescence performance [36,37]; At the same time, due to the difference in the quantities of electric charges of NH4+ and Sr3+, oxygen vacancies will be formed after replacing Sr2+ in order to maintain the electrical neutrality of NH4+. These oxygen vacancies can transfer charge with Eu3+ [34], thereby increasing the sample’s luminescence intensity. On the other hand, the excess NH4+ will enter the lattice gaps and induce lattice distortions, affecting the luminescence intensity of the samples.
Figure 12 shows the luminescence decay curves of SrMo0.5W0.5O4:Eu3+ phosphors doped with several charge compensators (K+, Li+, Na+, NH4+) at an excitation wavelength of 464 nm and an emission wavelength of 615 nm. As illustrated in Figure 12, the decay curves of all samples’ emitted light satisfy a bi-exponential equation [38]:
I ( t ) = I 0 + A 1 exp ( t τ 1 ) + A 2 exp ( t τ 2 )
In the formula, I(t) denotes the emission intensity at time t, I0 represents the initial emission intensity, A1 and A2 are the pre-exponential factors of each decay component, and τ1 and τ2 are the decay times of each component. The average emission decay time (τave) can be calculated using the below [38].
τ ave = A 1 τ 1 2 + A 2 τ 2 2 A 1 τ 1 + A 2 τ 2
The average emission decay time τave shown in Figure 12, was calculated to be 0.57 ms for Sr0.99Mo0.5W0.5O4:0.01Eu3+ and 0.0.51, 0.0.57, 0.56, and 0.0.58 ms for Sr0.99Mo0.5W0.5O4:0.01Eu3+, A (A = Li+, Na+, K+, NH4+), respectively. The emission decay times of all ceramic samples were very similar and slightly lower than that of the powder sample. This suggests that, in the ceramic samples, the electronic relaxation time from the split 5D2 energy levels to the lowest transition energy level 5D0 was reduced. When the charge compensator NH4+ concentration is 3% in the Sr0.99Mo0.5W0.5O4:0.01Eu3+, A (A = K+, Li+, Na+, NH4+) system, the fluorescence lifespan of the sample achieves a maximum of 0.58ms. It is also demonstrated that adding NH4+ can significantly improve the luminescent characteristics of the samples.
Figure 13 depicts the color coordinates of samples Sr0.99Mo0.5W0.5O4: 0.01Eu3+ (b), Sr0.99Mo0.5W0.5O4: 0.01Eu3+, 0.03NH4+ (c), where the color coordinates of b (0.642, 0.358) and c (0.656, 0.343) are both positioned at the edge of the red area, indicating that the synthetic samples have a high color purity. The color coordinates of the SrMo0.5W0.5O4: Eu3+ sample show a red-shifted after adding the charge compensator NH4+, demonstrating that NH4+ can successfully improve the luminescence properties of the non-SrMo0.5W0.5O4: Eu3+ sample. The coordinates are close to the ideal red light’s coordinates (0.670, 0.333) (d) and better than the commercial red phosphor Y2O2S:Eu2+’s coordinates (0.622, 0.351) (a).

3. Materials and Methods

3.1. Sample Preparation

All samples were synthesized in an air atmosphere using a high-temperature solid phase method. The raw materials included SrCO3(A.R.), MoO3(A.R.), WO3(A.R.), Eu2O3 (99.99%), Na2CO3 (A.R.), Li2CO3(A.R.), K2CO3 (A.R.), and NH4Cl (A.R.). They were accurately weighed based on the stoichiometric ratio of Sr(1−y)MoxW1−xO4:yEu3+, transferred to an agate mortar, added a tiny amount of anhydrous ethanol, ground for 30 min, then transferred the blended powder was to a high-temperature furnace and calcined at a certain temperature for 5 h.

3.2. Sample Testing and Characterization

The structures of the samples were studied using a Bruker (Billerica, MA, USA) AXS D8 X-ray diffractometer (XRD), with Cu Kα lines as a radiation source. An operating voltage of 40 KV, An operating current of 30 mA, and a scanning range of 2θ = 15–80°; the microscopic morphology of the samples was characterized using a JSM-6490LV scanning electron microscope (SEM). The sample’s Fourier transform infrared (FT-IR) spectra were evaluated by a Perkin Elmer(Norwalk, CT, USA) Type NicoLet670-shaped Fourier transform infrared spectrometer using the KBr pressed-disc technique and a resolution of 4 cm−1. The excitation, and emission spectra, luminescence decay curves of the luminous material were evaluated using an Edinburgh FS5 fluorescence spectrometer equipped with a 150 W xenon lamp as an excitation light source. All of the preceding experiments were carried out at room temperature.

4. Conclusions

The phosphor SrMo0.5W0.5O4: Eu3+ synthesized by the high-temperature solid-phase technique has an optimal synthesis temperature of 900 °C. The phosphor possesses a tetragonal crystal structure, and the doping of Eu3+ does not affect the crystal phase. The phosphor’s Fourier infrared spectrum indicates a stretching vibration of O-W/Mo-O; the SEM shows irregular particles with sharp edges and corners, a particle size of 2 μm, and numerous agglomerations. The primary excitation peaks of the phosphor SrMo0.5W0.5O4: Eu3+ are positioned at 273 nm, 397 nm, and 464 nm, respectively, and are attributable to the charge migration of O2−→Eu3+ and the distinctive spectrum of Eu3+ (7F05L6, 7F05D2). The central light peak of the emitted light is around 615 nm, representing a possible red fluorescent material that can be used as a down converter in UV LEDs and blue light LEDs. When the emission spectra of red phosphors SrWO4:Eu3+, SrMo0.5W0.5O4: Eu3+, and SrMoO4:Eu3+ are compared, it is discovered that after the introduction of Mo(VI) into SrWO4:Eu3+, the emission intensity increases and when Mo(VI) ions completely replace the W(VI), the emission intensity decreases. The optimal doping concentration (quenching concentration)of Eu3+ in SrMo0.5W0.5O4: Eu3+ is 1%, and the quenching concentration is 1%, which is due to the galvanic-even-order interaction in the electric multilevel interaction, and its critical distance is Rc = 25.57 Å. Charge compensators of various types, including Eu3+: K+, Li+, Na+, and NH4+, were added into SrMo0.5W0.5O4, with NH4+ having the best effect and the best doping concentration of it being 3%. In comparison to the color coordinates (0.642, 0.358) of SrMo0.5W0.5O4: Eu3+, the color coordinates (0.656, 0.343) of SrMo0.5W0.5O4: Eu3+, NH4+ exhibit an apparent red shift phenomenon, and the color coordinates of the obtained phosphors are all better than the color coordinates of commercial red phosphors (0.622, 0.351) and are closer to the ideal.

Author Contributions

Methodology, L.K.; software, Y.N. and H.Y.; formal analysis, L.K. and H.Y.; investigation, S.Z.; resources, R.W. and Q.D.; data curation, H.S.; writing—original draft preparation, H.S.; writing—review and editing, L.K.; visualization, Y.Y.; supervision, G.L.; project administration, L.K.; funding acquisition, H.Y. All authors have read and agreed to the published version of the manuscript.

Funding

Jilin Province Specialized Science Foundation for Youths (No. YDZJ202101ZYTS163).

Institutional Review Board Statement

Not applicable.

Informed Consent Statement

Not applicable.

Data Availability Statement

The data presented in this study are available on request from the corresponding author.

Acknowledgments

This work was financially supported by Jilin Province Specialized Science Foundation for Youths (No. YDZJ202101ZYTS163). The data were obtained using equipment maintained by the Jilin Insititute of Chemical Technology Center of Characterization and Analysis.

Conflicts of Interest

The authors declare no conflict of interest.

Sample Availability

Samples of the compounds are not available from the authors.

References

  1. Yang, S.; Jiang, B.; Wu, J.H.; Duan, C.G.; Shan, Y.K.; Zhao, Q.B. LaMoBO6:Tb3+,Eu3+/Sm3+,Bi3+ yellow phosphors with exceptionally high quantum yields that can be excited by blue light. J. Mater. Chem. C 2021, 9, 7065–7073. [Google Scholar] [CrossRef]
  2. Yi, L.H.; Zhou, L.Y.; Wang, Z.L.; Sun, J.H.; Gong, F.Z.; Wan, W.; Wang, W. KGd (MoO4)2:Eu3+ as a promising red phosphor for light-emitting diode application. Curr. Appl. Phys. 2010, 10, 208–213. [Google Scholar] [CrossRef]
  3. Sokolnicki, J. Nitridated CaSiO3:Eu and SrSiO3:Eu phosphors for LEDs. J. Alloy. Compd. 2022, 903, 163973–163980. [Google Scholar] [CrossRef]
  4. Kong, L.; Liu, Y.Y.; Dong, L.P.; Zhang, L.; Qiao, L.; Wang, W.S.; You, H.P. Enhanced red luminescence in CaAl12O19: Mn4+via doping Ga3+ for plant growth lighting. Dalton Trans. 2020, 49, 1947–1954. [Google Scholar] [CrossRef]
  5. Nakamura, S.; Fasol, G. The Blue Laser Diode: GaN Based Light Emitters and Lasers; Springer: Berlin/Heidelberg, Germany, 1996; pp. 1–24. [Google Scholar]
  6. Gao, R.P.; Liang, H.; Chen, T.; Wu, Z.Y.; Jiang, Z.Y.; Yi, X.H.; Wen, J.P.; Zhong, Q.H. Study on luminescence characterizations of SrMg2La2W2O12:Eu3+ red-emitting phosphor. J. Phys. Chem. Solids 2022, 163, 110569–110577. [Google Scholar]
  7. Qin, L.; Chen, J.H.; Chen, X.M.; Shao, H.B.; Wang, Z.L. Photoluminescence, thermal stability and structural properties of red-emitting phosphors Na5YSi4O12:Eu3+. J. Lumin. 2021, 238, 118228–118233. [Google Scholar] [CrossRef]
  8. Kachou, I.; Saidi, K.; Salhi, R.; Dammak, M. Synthesis and optical spectroscopy of Na3Y(VO4)2:Eu3+phosphors for thermometry and display applications. Rsc. Adv. 2022, 12, 7529–7539. [Google Scholar] [CrossRef]
  9. Matsumoto, S.; Watanable, T.; Ito, A. Photoand Radioluminescence Properties of Eu3+-doped Y2O3 Thick Film Phosphor Prepared via Chemical Vapor Deposition. Sens. Mater. 2022, 34, 669–675. [Google Scholar]
  10. Chen, F.; Akram, M.N.; Chen, X.Y. Improved photoluminescence performance of Eu3+-doped Y2(MoO4)3 red-emitting phosphor via orderly arrangement of the crystal lattice. Molecules 2023, 28, 1014. [Google Scholar] [CrossRef]
  11. Dikhtyar, Y.Y.; Spassky, D.A.; Morozov, V.A.; Polyakov, S.N.; Romanova, V.D.; Stefanovich, S.Y.; Deyneko, D.V.; Baryshnikova, O.V.; Nikiforov, I.V.; Lazoryak, B.I. New series of red-light phosphor Ca9−xZnxGd0.9(PO4)7:0.1Eu3+ (x = 0–1). Molecules 2023, 28, 352. [Google Scholar] [CrossRef]
  12. Huong, T.T.; VinhLe, T.; Hoang, T.K.; Le, D.T.; Nguyen, D.V.; Do, T.T.; Ha, T.P. Synthesis and in vitro testing of YVO4:Eu3+@silica-NH-GDA-IgG bio-nano complexes for labelling MCF-7 breast cancer cells. Molecules 2023, 28, 280. [Google Scholar] [CrossRef] [PubMed]
  13. Gontcharenko, V.E.; Kiskin, M.A.; Dolzhenko, V.D.; Korshunov, V.M.; Taydakov, I.V.; Belousov, Y.A. Mono- and mixed metal complexes of Eu3+, Gd3+, and Tb3+ with a diketone, bearing pyrazole moiety and CHF2-group: Structure, color tuning, and kinetics of energy transfer between lanthanide ions. Molecules 2021, 26, 2655. [Google Scholar] [CrossRef]
  14. Kolesnikov, I.E.; Daria, V.; Mamonova, M.A.; Kurochkin, E.Y.; Kolesnikov, E.L. Optical thermometry by monitoring dual emissions from YVO4 and Eu3+ in YVO4:Eu3+ nanoparticles. ACS Appl. Nano Mater. 2021, 4, 1959–1966. [Google Scholar] [CrossRef]
  15. Li, J.J.; Liu, X.H.; Liu, Y.F. Luminescence investigation of a novel red-emitting Sr3NaSbO6:Eu3+ phosphor. Optik 2021, 242, 166809–166816. [Google Scholar] [CrossRef]
  16. Chen, S.M.; Zeng, Q.; Guo, C.C.; Liu, L.; Yao, C.F.; Chen, X.; Feng, Y.Z. Sol-gel preparation and luminescent properties of Li2.06Nb0.18Ti0. 6O3: Eu3+ red phosphor. Optik 2021, 241, 166921–166927. [Google Scholar] [CrossRef]
  17. Zhang, Y.; Dong, Y.Y.; Xu, J.Y.; Wei, B. Ge4+ Eu3+-codoped Y2SiO5 as a novel red phosphor for white LED applications. Phys. Status Solidi A 2017, 214, 1600731. [Google Scholar] [CrossRef]
  18. Yu, B.; Li, Y.C.; Zhan, R.P.; Li, H.; Wang, Y.N. A novel thermally stable eulytite-type NaBaBi2(PO4)3:Eu3+ red-emitting phosphor for pc-WLEDs. J. Alloy. Compd. 2021, 852, 157020–157032. [Google Scholar] [CrossRef]
  19. Wei, D.L.; Hyo, J.S.; Liu, Y.S.; Yang, X.F. Reveal luminescence differences via comparative studies of dynamic spectra in Eu3+-activated BaLa2WO7 and SrLa2WO7 phosphors. Ceram. Int. 2023, 49, 7534–7545. [Google Scholar]
  20. Huang, X.Y.; Li, B.; Guo, H. Highly efficient Eu3+-activated K2Gd(WO4)(PO4) red-emitting phosphors with superior thermal stability for solid-state lighting. Ceram. Int. 2017, 43, 10566–10571. [Google Scholar] [CrossRef]
  21. Du, P.; Wang, L.L.; Yu, J.S. Luminescence properties and energy transfer behavior of single-component NaY(WO4)2: Tm3+/Dy3+/ Eu3+ phosphors for ultraviolet-excited white light-emitting diodes. J. Alloy. Compd. 2016, 673, 426–432. [Google Scholar] [CrossRef]
  22. Ren, X.L.; Zhang, Y.; Li, Q.Y.; Yu, M. Sodium citrate (Na3Cit)-assisted hydrothermal synthesis of uniform spindle-like SrMoO4:Eu3+phosphors. Mater. Res. Bull. 2014, 59, 283–289. [Google Scholar] [CrossRef]
  23. Zhu, Y.N.; Zheng, G.H.; Dai, Z.X.; Zhang, L.Y.; Mu, J.J. Core-Shell Structure and Luminescence of SrMoO4:Eu3+(10%) Phosphors. J. Mater. Sci. Technol. 2016, 32, 1361–1371. [Google Scholar] [CrossRef]
  24. Chavan, A.B.; Gawande, A.B.; Gaikwad, V.B.; Jain, G.H.; Deore, M.K. Hydrothermal synthesis and luminescence properties of Dy3+ doped SrMoO4 nano-phosph. J. Lumin. 2021, 234, 117996–118003. [Google Scholar] [CrossRef]
  25. Feng, H.; Yang, Y.; Wang, X. Microwave radiation heating synthesis and luminescence of SrWO4 and SrWO4:xEu3+ powders. Ceram. Int. 2014, 40, 10115–10118. [Google Scholar] [CrossRef]
  26. Saravanakumar, S.; Sivaganesh, D.; Sivakumar, V.; Sasikumar, S.; Thirumalaisamy, T.K. Red emitting Eu3+induced SrWO4 materials: Synthesis, structural, morphological and photoluminescence analysis. Phys. Scr. 2021, 96, 125817–125832. [Google Scholar] [CrossRef]
  27. Huang, X.Y.; Li, B.; Guo, H.; Chen, D.Q. Molybdenum-doping-induced photoluminescence enhancement in Eu3+ activated CaWO4 red-emitting phosphors for white light-emitting diodes. Dyes. Pigmen. 2017, 143, 86–94. [Google Scholar] [CrossRef]
  28. Li, L.; Pan, Y.; Zhou, X.J.; Zhao, C.L.; Wang, Y.J.; Jiang, S.; Suchocki, A.; Brik, M.G. Luminescence enhancement in the Sr2ZnW1−xMoxO6:Eu3+,Li+ phosphor for near ultraviolet based solid state lighting. J. Alloy. Compd. 2016, 685, 917–926. [Google Scholar] [CrossRef]
  29. Xie, H.D.; Chen, C.; Li, J.; He, Y.Y.; Wang, N. Sol-gel synthesis and luminescent performance of Eu3+, Lu3+co-doped Ca0.3Sr0.7Mo1−xWxO4 red-emitting phosphor. Inorg. Nano Met. Chem. 2020, 51, 1297–1305. [Google Scholar] [CrossRef]
  30. Zhang, M.; Cao, C.Y.; Chen, X.T.; Chen, Z.J.; Yang, L.; Li, Y.C.; Xie, A. Synthesis, luminescent properties, and thermal stabilities of Gd2(1−x)Eu2x(MoyW1−yO4)(3)(0 ≤ x ≤ 0.2,0 ≤ y ≤ 1) solid solution phosphors. Solid State Sci. 2021, 120, 106710–106719. [Google Scholar] [CrossRef]
  31. Liu, S.Q.; Liang, Y.J.; Zhu, Y.L.; Li, H.R.; Chen, J.H.; Wang, M.Y.; Li, W.J. Enhancing emission intensity and thermal stability by charge compensation in Sr2Mg3P4O15:Eu3+. J. Am. Ceram. Soc. 2018, 101, 1655–1664. [Google Scholar] [CrossRef]
  32. Yang, C.G.; Huang, Q.M.; Lin, G.Q. Structure and luminescence properties of Eu3+/Tb3+/MoO42− tri-doped calcium tungstate phosphors. J. Chin. Ceram. Soc. 2015, 43, 75–80. (In Chinese) [Google Scholar]
  33. Chiu, C.H.; Wang, M.F.; Lee, C.S.; Chen, T.M. Structural, spectroscopic and photoluminescence studies of LiEu(WO4)2−x (MoO4)x as a near-UV convertible phosphor. J. Solid State Chem. 2006, 180, 619–627. [Google Scholar] [CrossRef]
  34. Blasse, G. Energy transfer in oxidicphosphors. Philips. Res. Rep. 1969, 24, 131–136. [Google Scholar]
  35. Van Uitert, L.G. Characterization of energy transfer interactions between rare earth ions. J. Electrochem. Soc. 1967, 114, 1048–1053. [Google Scholar] [CrossRef]
  36. Grzyb, T.; Lis, S. Structural and spectroscopic properties of LaOF:Eu3+ nanocrystals prepared by the sol–gel Pechini method. Inorg. Chem. 2011, 50, 8112–8120. [Google Scholar] [CrossRef] [PubMed]
  37. Chen, G.Y.; Liu, H.C.; Somesfalean, Q.; Sheng, G.Y.; Liang, H.J.; Zhang, Z.G.; Sun, Q.; Wang, F.P. Enhancement of the upconversion radiation in Y2O3:Er3+ nanocrystals by codoping with Li+ ions. Appl. Phys. Lett. 2008, 92, 139. [Google Scholar] [CrossRef]
  38. Blasse, G.; Grabmarier, B.C. Luminescent Materials; Springer: Berlin/Heidelberg, Germany, 1994; p. 46. [Google Scholar]
Figure 1. XRD patterns of (a) SrMoO4, (b) SrMo0.5W0.5O4, (c) SrWO4 synthesized at different temperatures.
Molecules 28 02681 g001
Figure 2. XRD of (a) Sr1−xMo0.5W0.5O4:xEu3+, (b) Sr0.99MoO4:0.01Eu3+ and (c) Sr0.99WO4:0.01Eu3+.
Molecules 28 02681 g002
Figure 3. XRD of Sr0.99Mo0.5W0.5O4:0.01Eu3+ with different charge compensators.
Molecules 28 02681 g003
Figure 4. Crystal structure of SrMo0.5W0.5O4.
Molecules 28 02681 g004
Figure 5. FT-IR spectrum of SrMo0.5W0.5O4 sample.
Molecules 28 02681 g005
Figure 6. SEM of Sr0.99Mo0.5W0.5O4:Eu3+. (a) 7500 times; (b) 950 times.
Molecules 28 02681 g006
Figure 7. Excitation (a,c,e) and emission (b,d,f) spectra of SrWO4:Eu3+, SrMo0.5W0.5O4: Eu3+, and SrMoO4:Eu3+.
Molecules 28 02681 g007
Figure 8. The emission spectrum of Sr0.99MoxW1−xO4:0.01Eu3+(x = 0, 0.5, 1).
Molecules 28 02681 g008
Figure 9. (a) The emission spectrum of Sr1−yMo0.5W0.5O4:yEu3+(y = 0.005, 0.01, 0.02, 0.05, 0.07), (b) Dependence of log (I/x) on log (x) for Sr1yMo0.5W0.5O4:yEu3+.
Molecules 28 02681 g009
Figure 10. Emission spectra of SrMo0.5W0.5O4:Eu3+ with different charge compensators.
Molecules 28 02681 g010
Figure 11. Emission spectra of SrMo0.5W0.5O4:Eu3+ with different concentrations of NH4+.
Molecules 28 02681 g011
Figure 12. Lifetime decay curve of SrMo0.5W0.5O4:0.01Eu3+, A (A = Li+, Na+, K+, NH4+).
Molecules 28 02681 g012
Figure 13. CIE color coordinates of Y2O2S:Eu2+ (a), Sr0.99−xMo0.5W0.5O4:0.01Eu3+ (b), Sr0.99Mo0.5W0.5O4:0.01Eu3+, 0.03NH4+ (c) and ideal red light (d).
Molecules 28 02681 g013
Disclaimer/Publisher’s Note: The statements, opinions and data contained in all publications are solely those of the individual author(s) and contributor(s) and not of MDPI and/or the editor(s). MDPI and/or the editor(s) disclaim responsibility for any injury to people or property resulting from any ideas, methods, instructions or products referred to in the content.

