
Determination of the Major By-Products of Citrus hystrix Peel and Their Characteristics in the Context of Utilization in the Industry
 , , , ,
Abstract
:
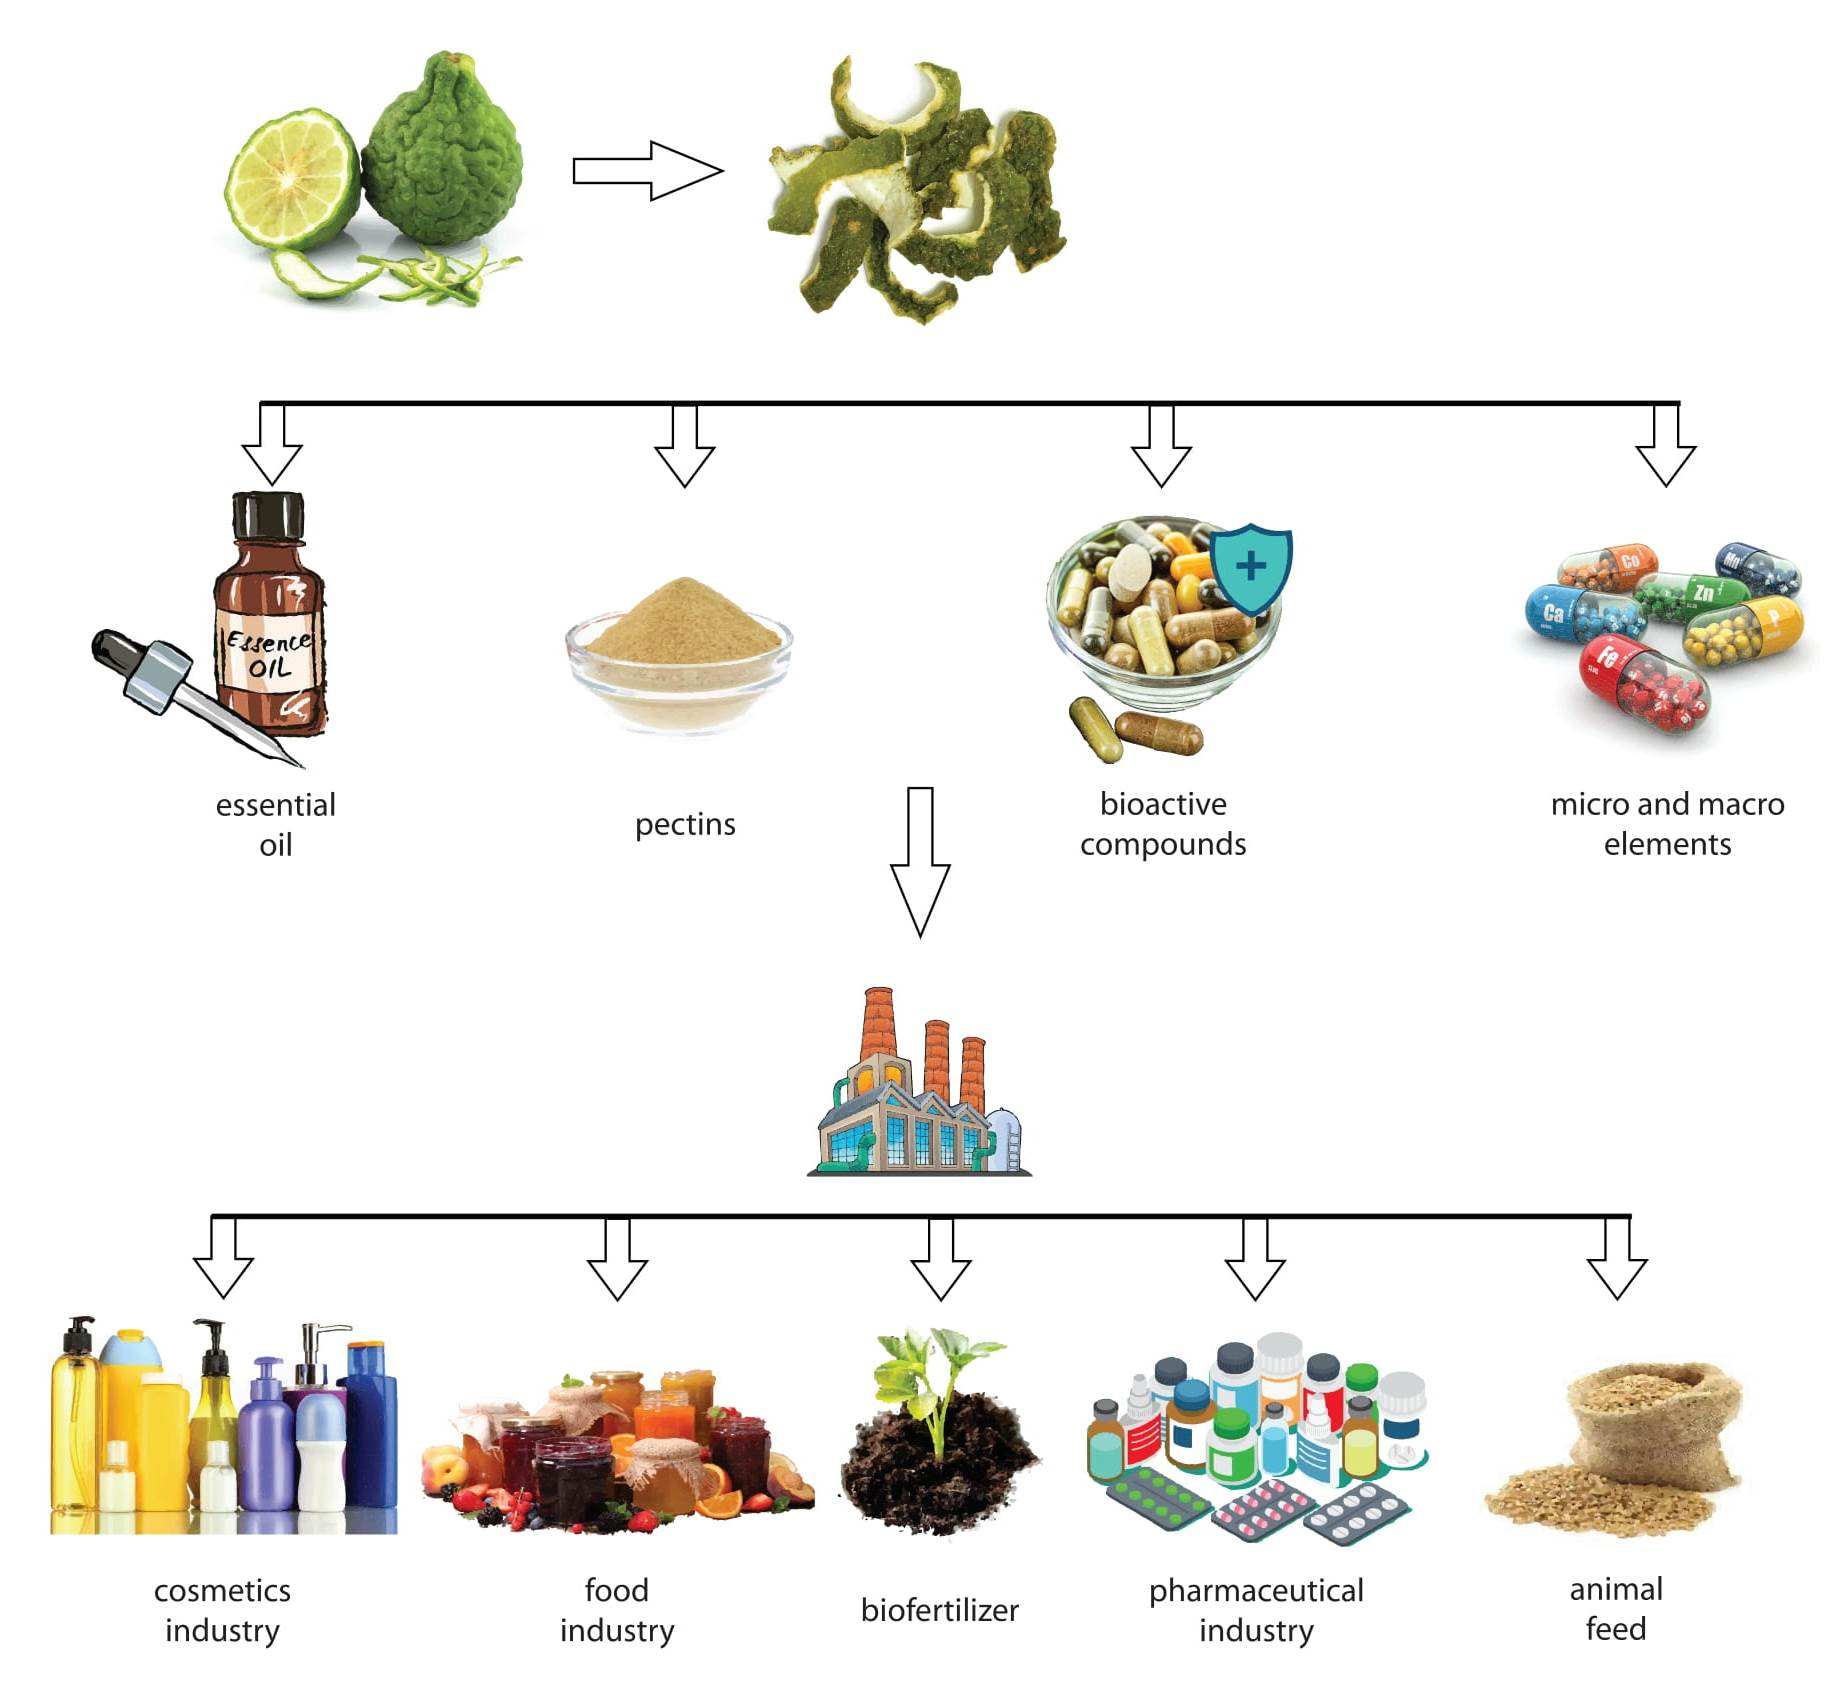
1. Introduction
2. Results and Discussion
2.1. Essential Oil
2.1.1. Essential Oil Extraction Efficiency
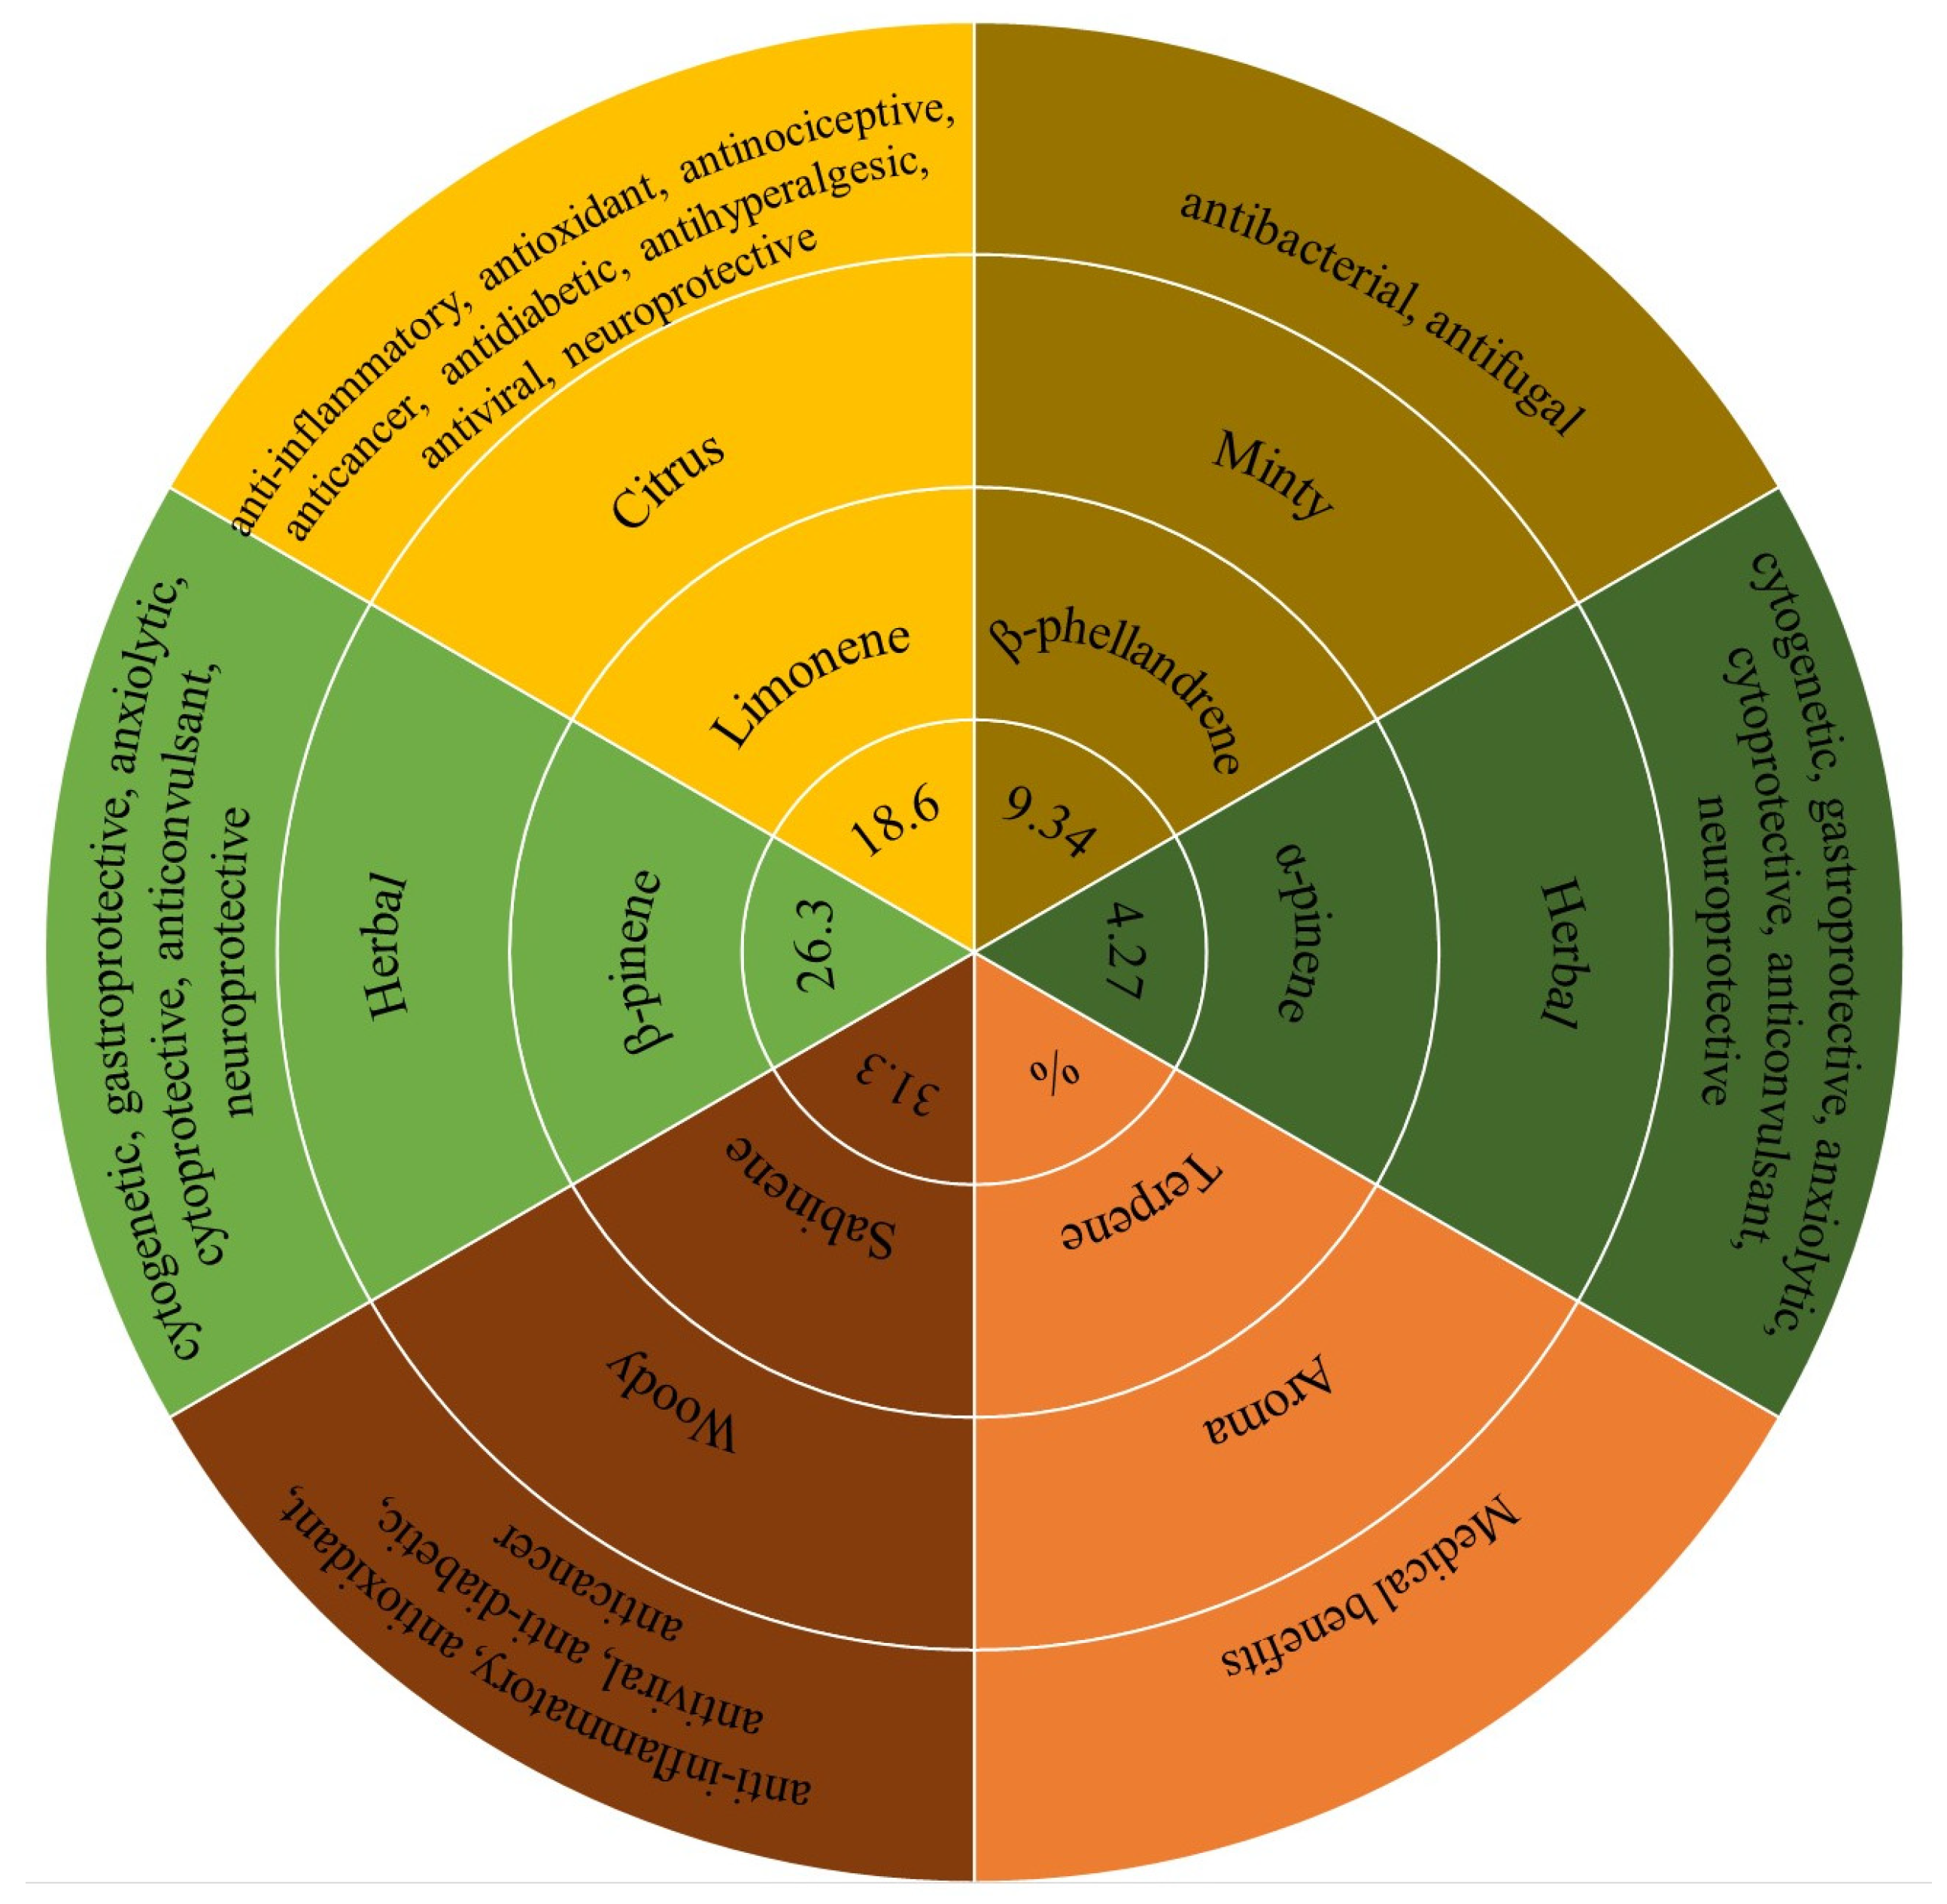
2.1.2. Essential Oil Composition
2.2. Pectins
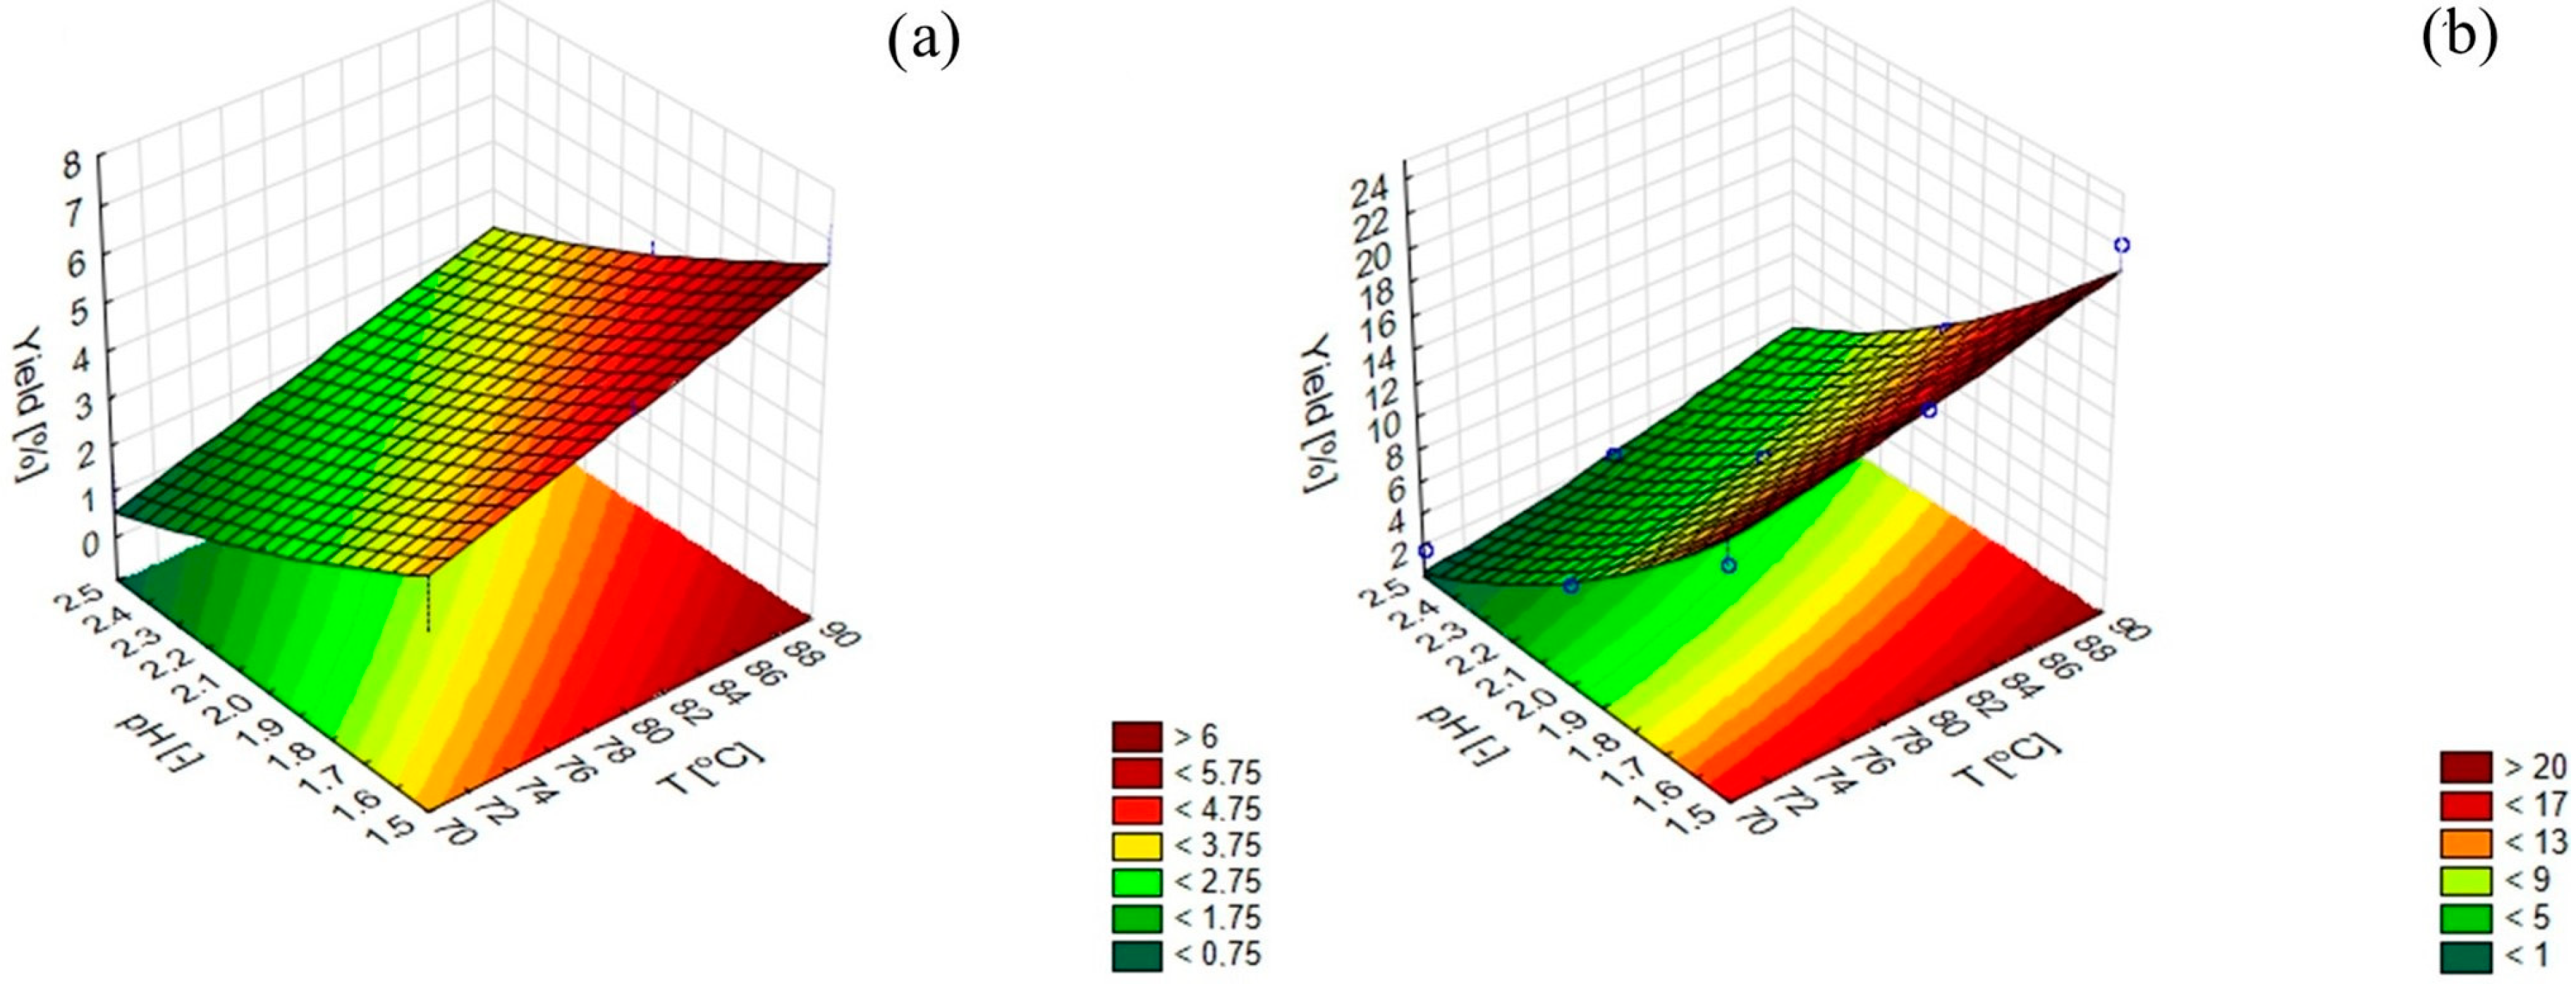
2.2.1. Optimization of Pectin’s Extraction Conditions
Selection of Temperature and Type of Acid
Determination of the Influence of Ultrasound on the Extraction Efficiency
2.2.2. Degree of Methylation
2.2.3. Galacturonic Acid Content
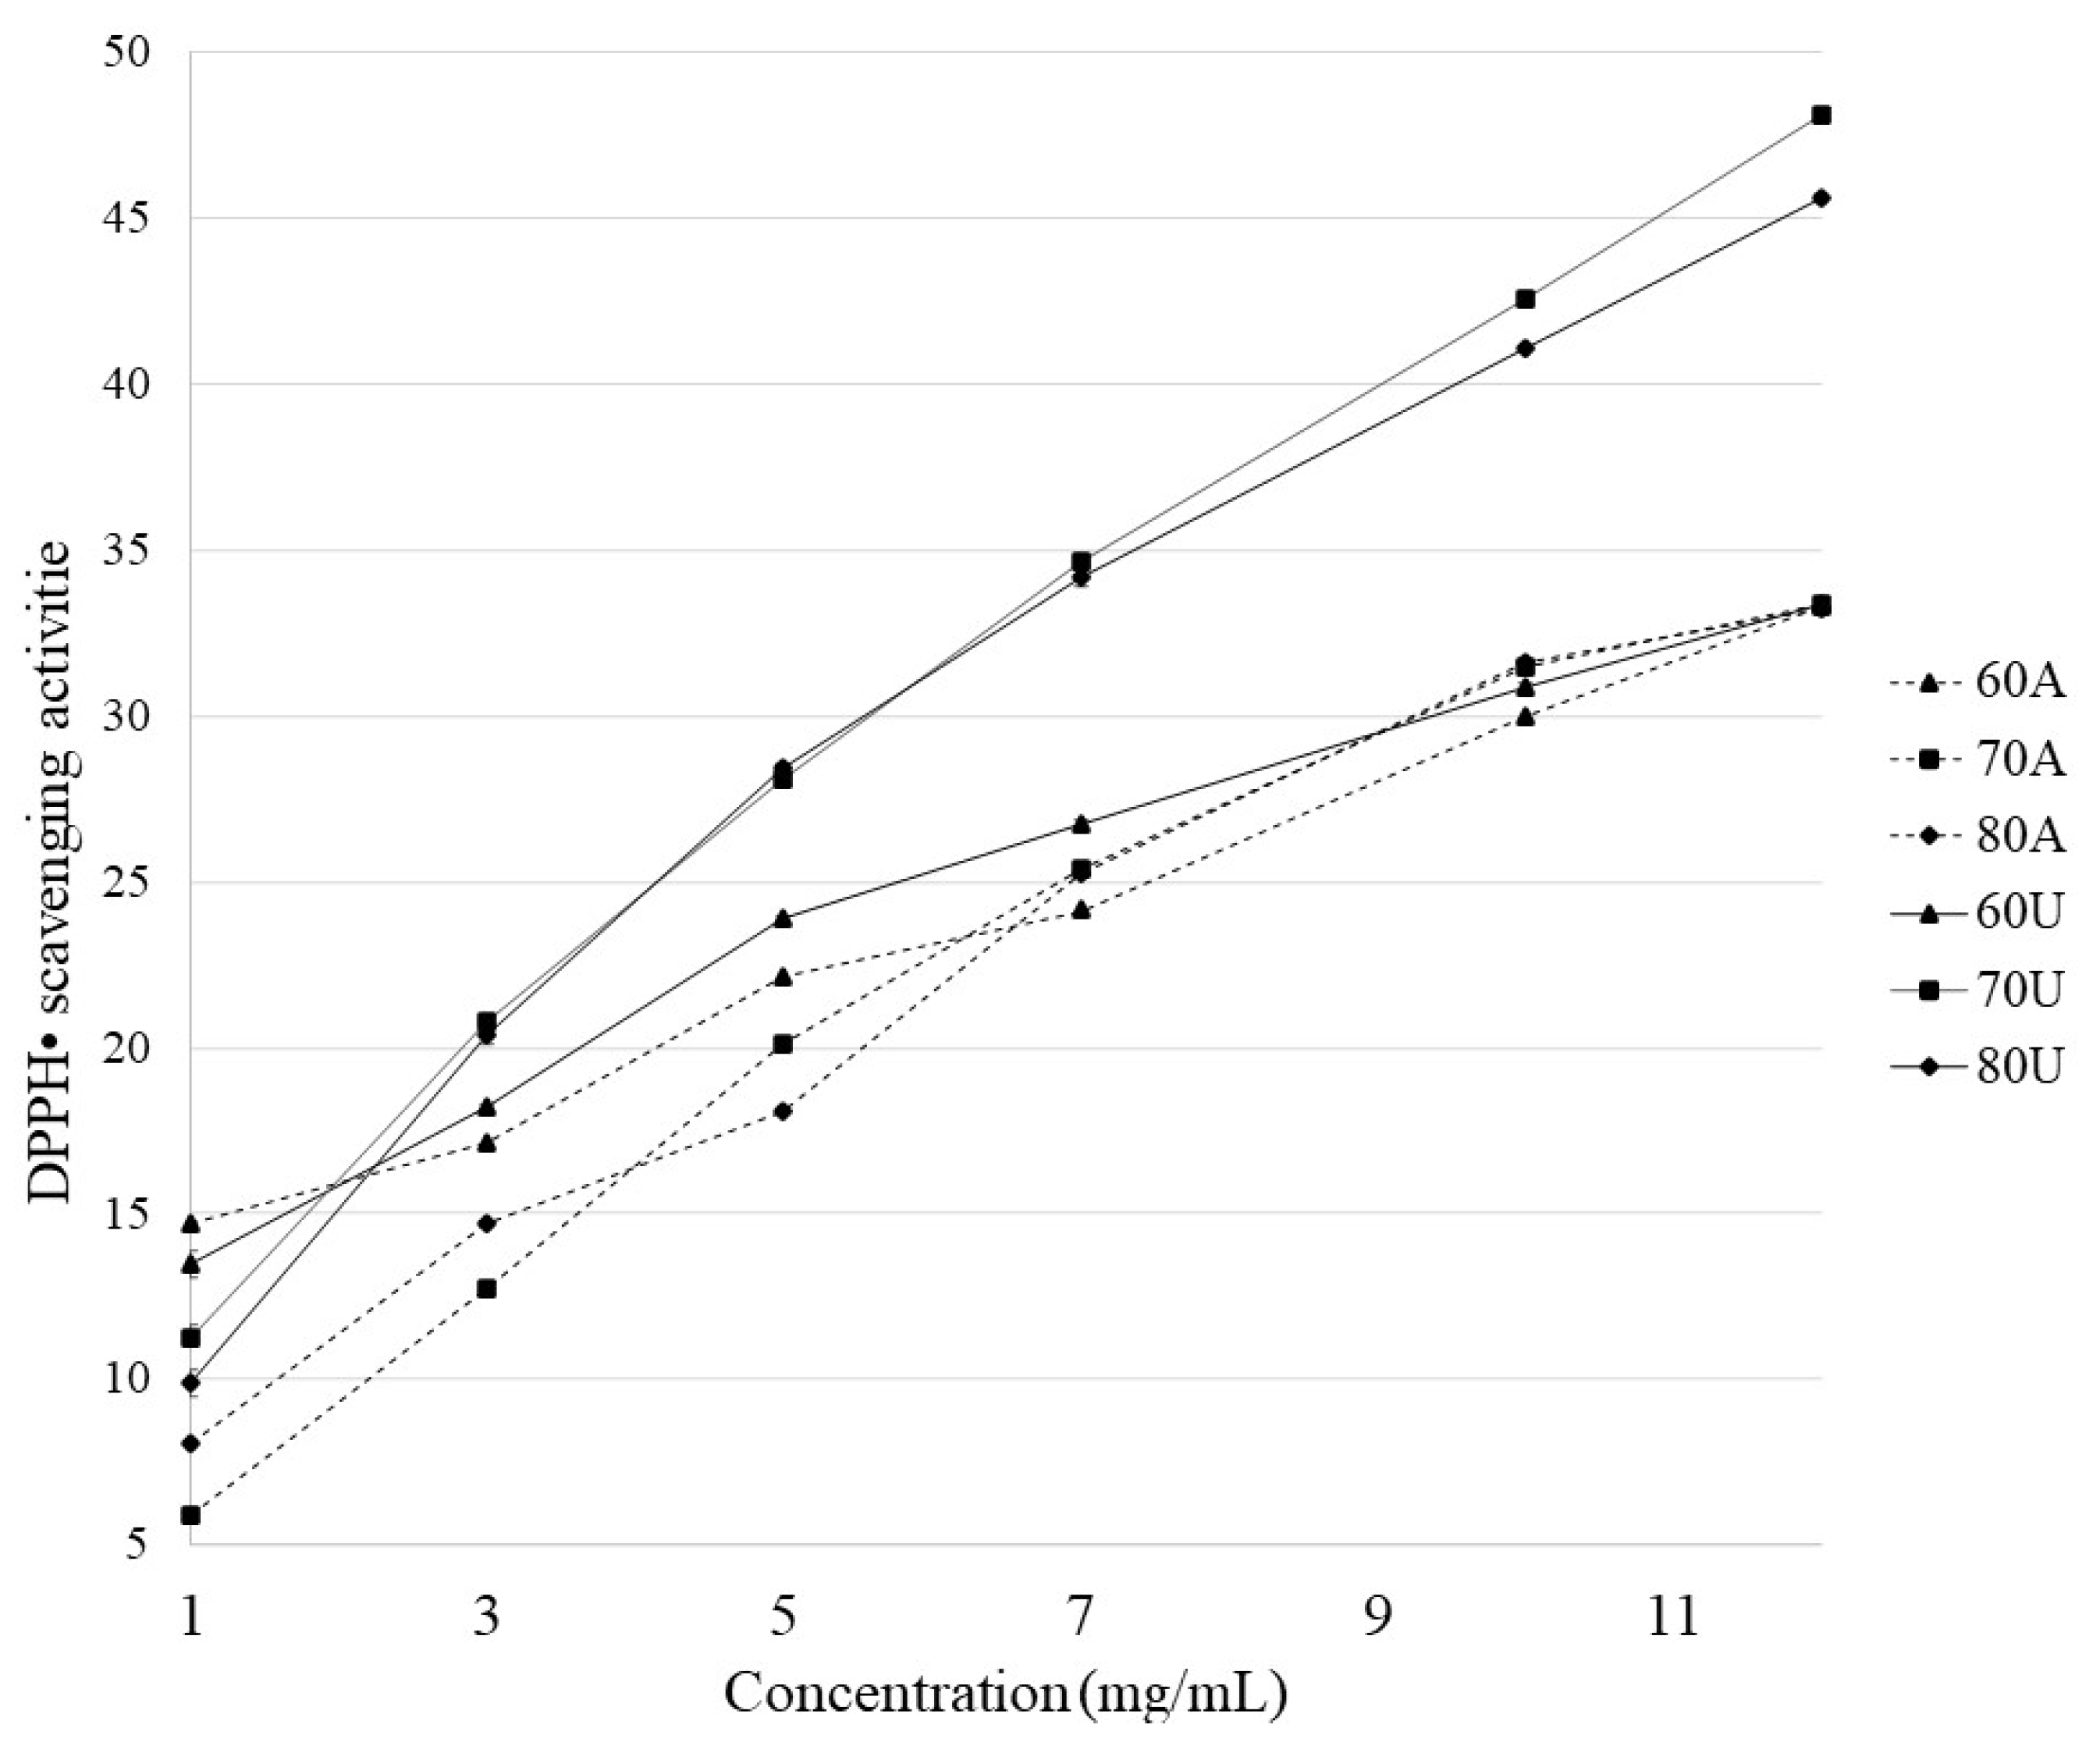
2.2.4. DPPH Free Radical Scavenging
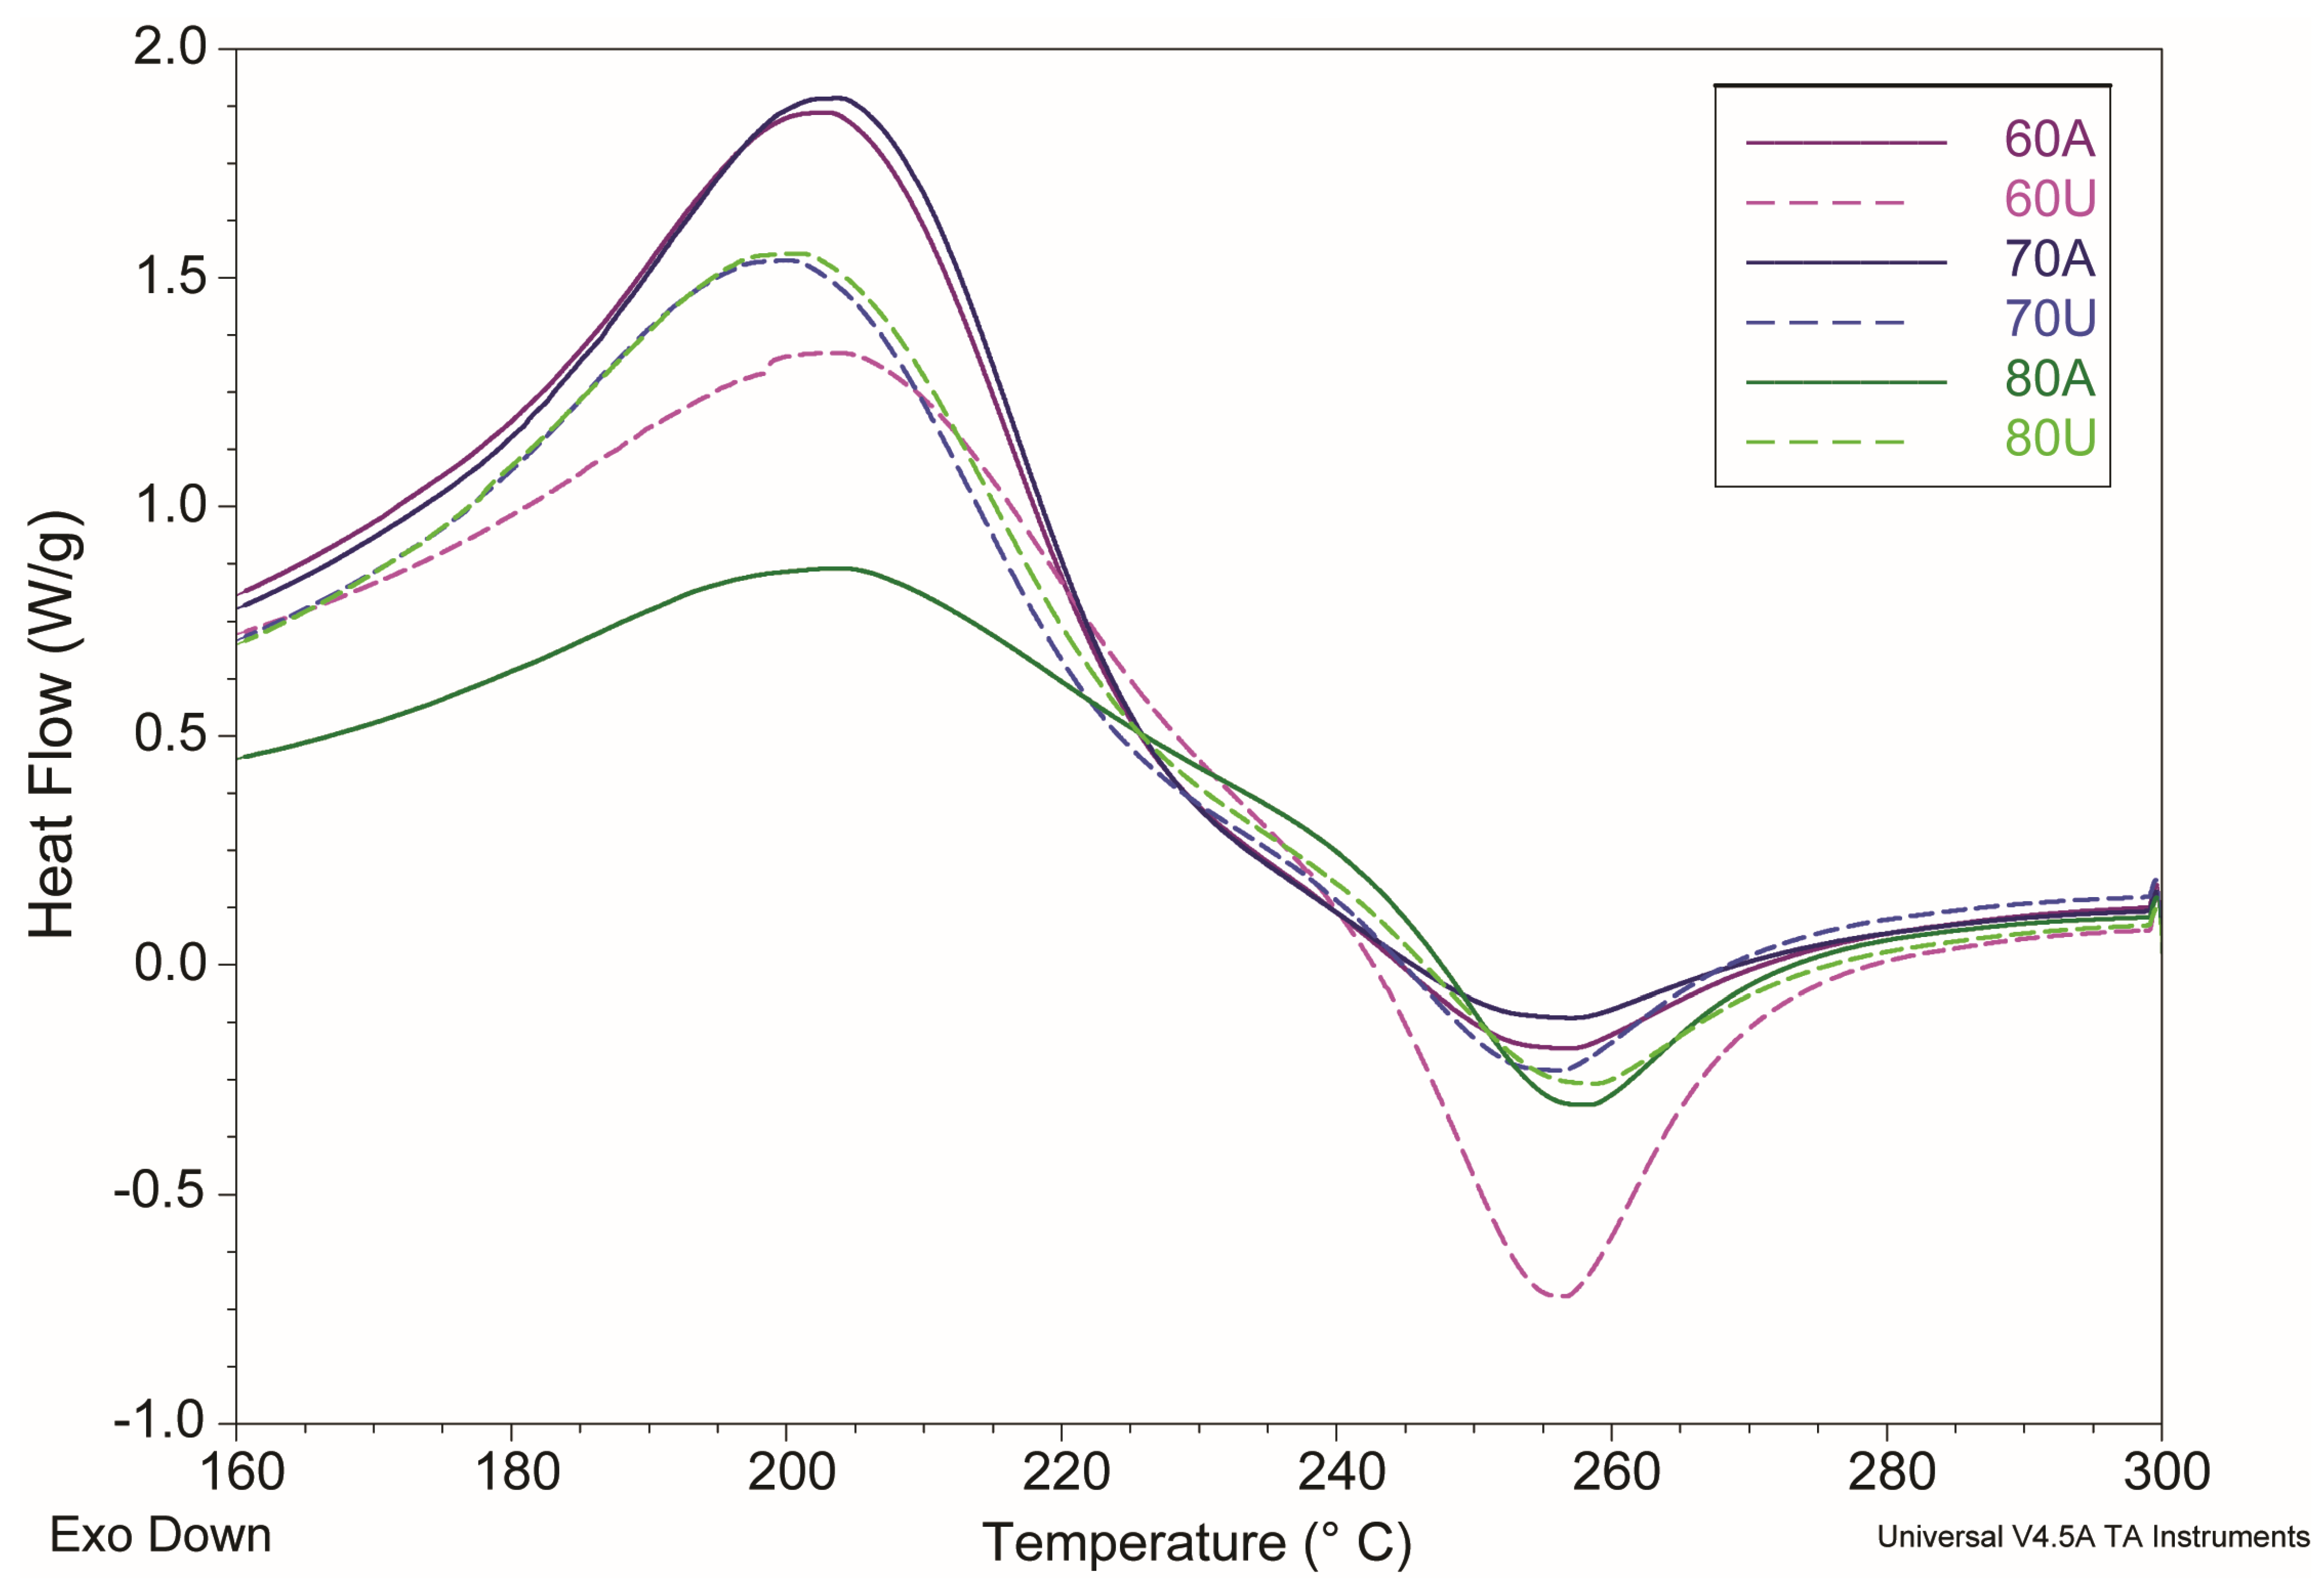
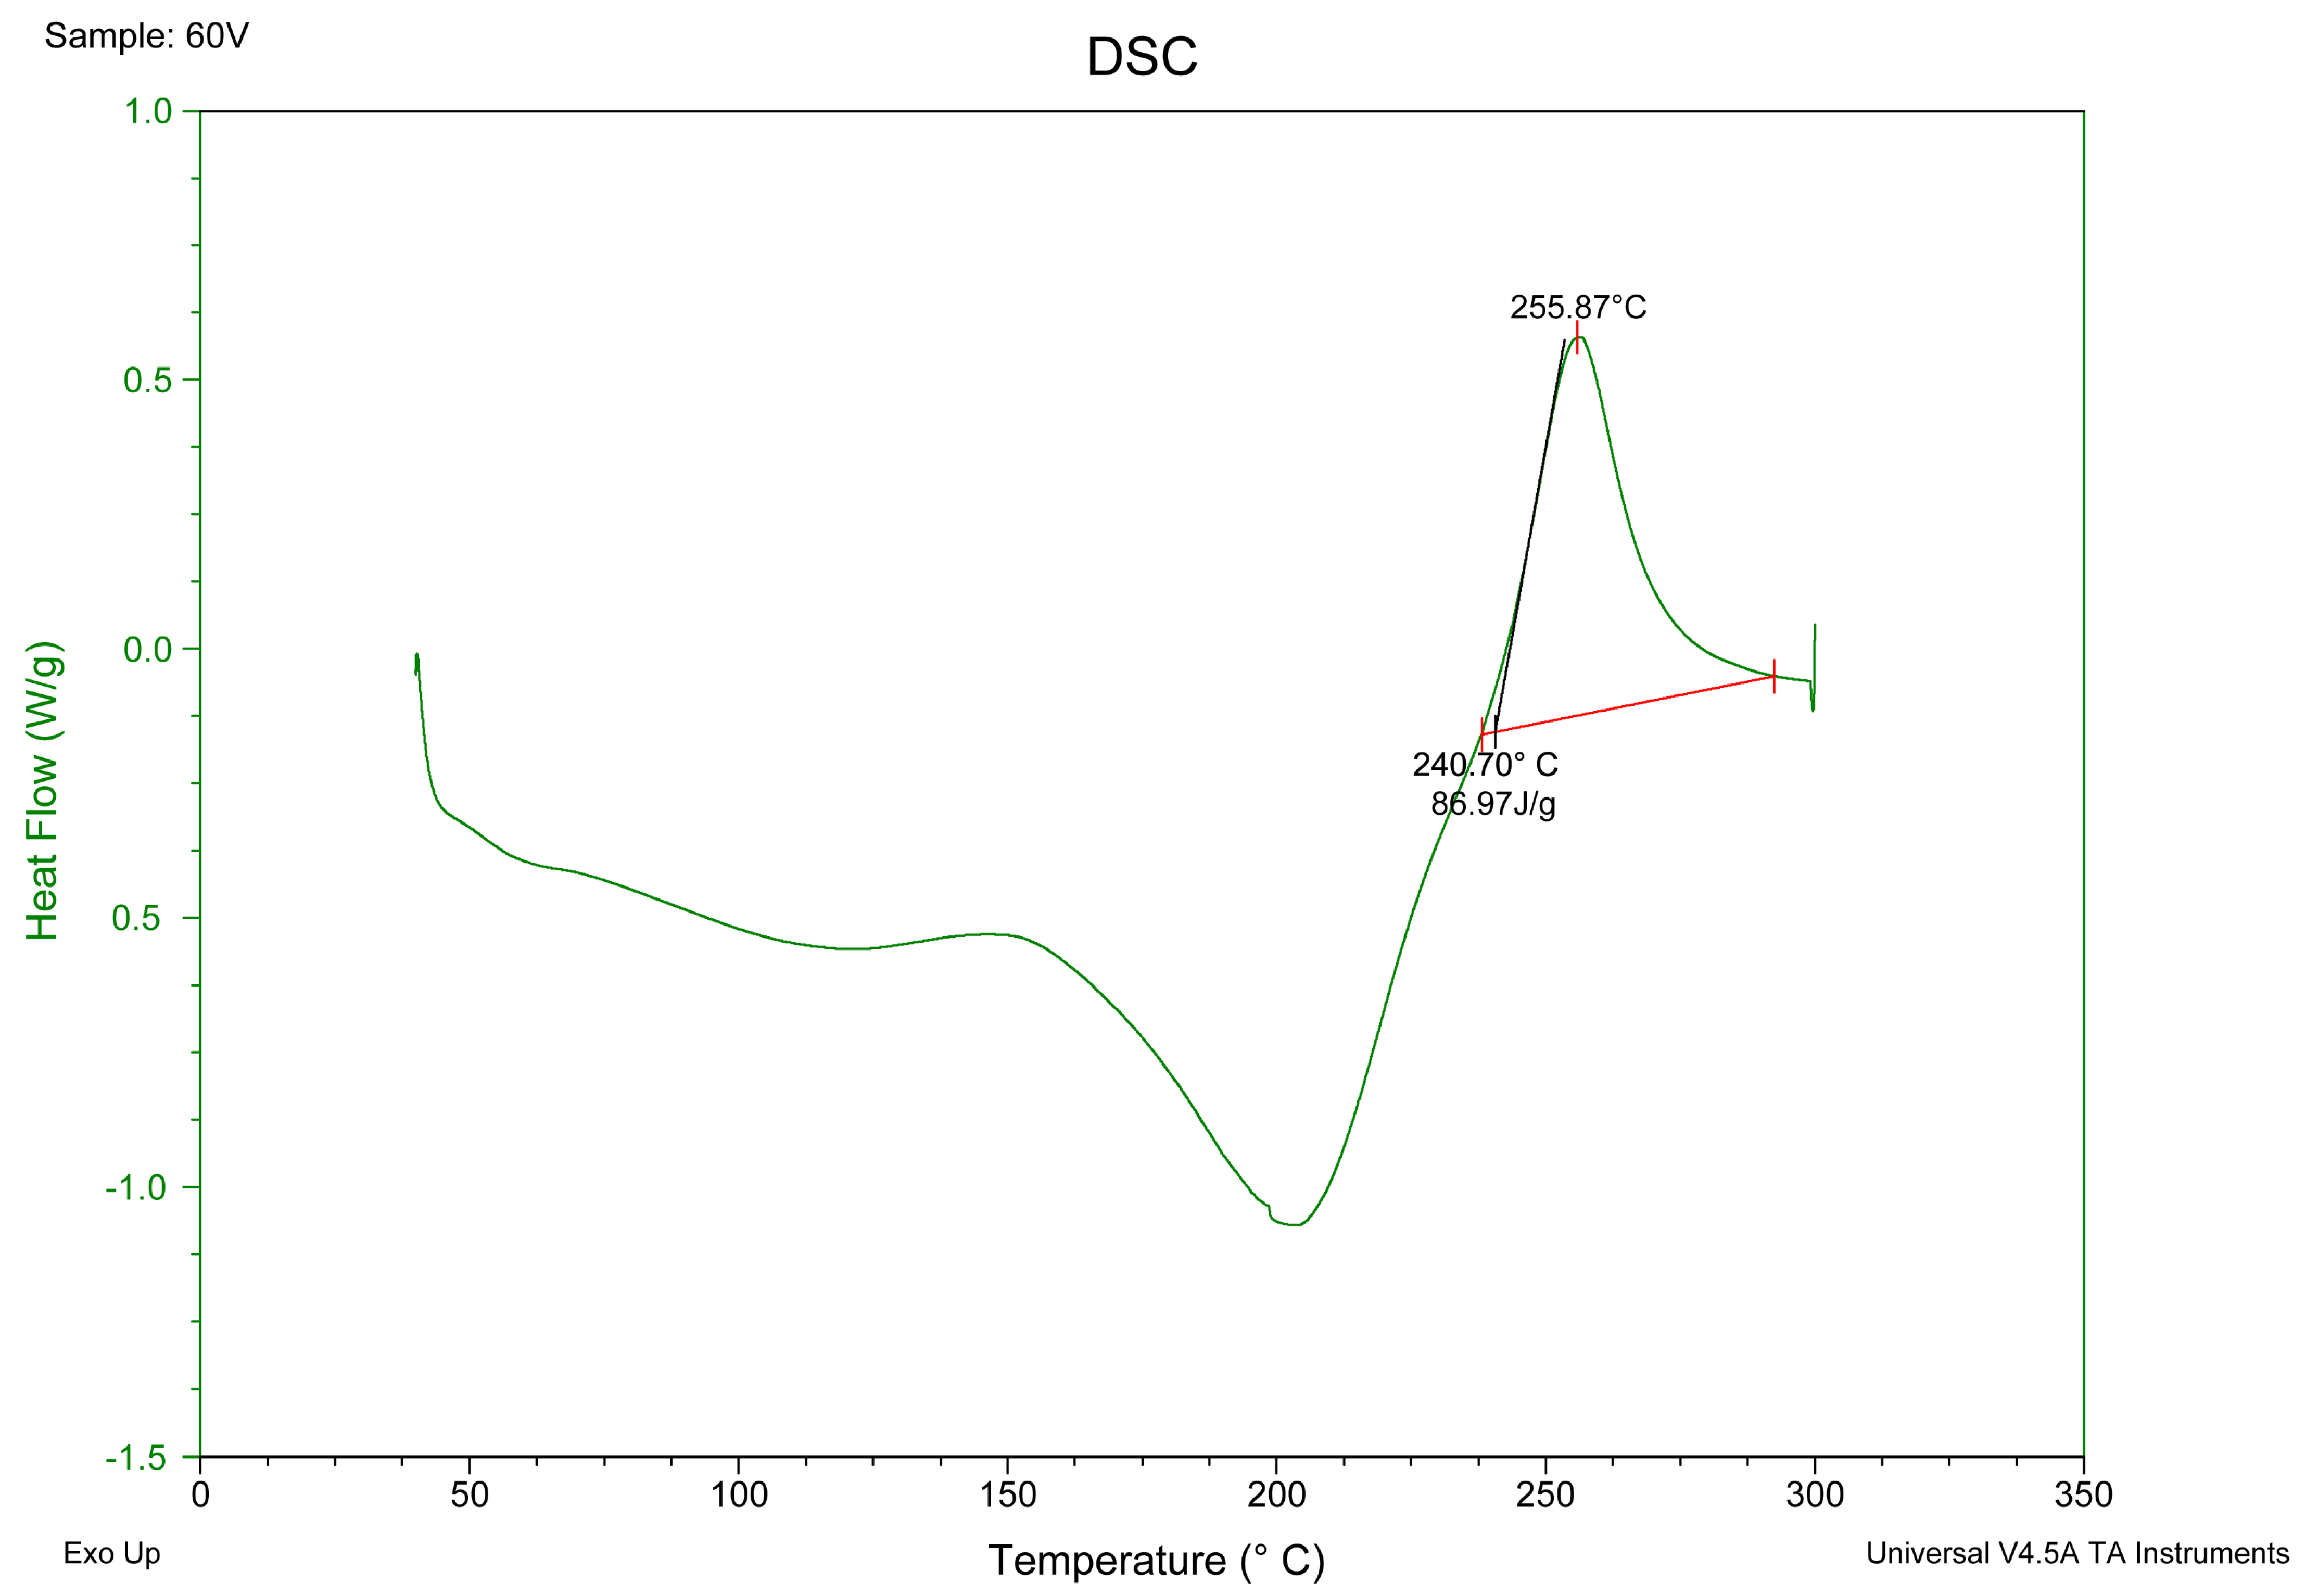
2.2.5. DSC Analysis
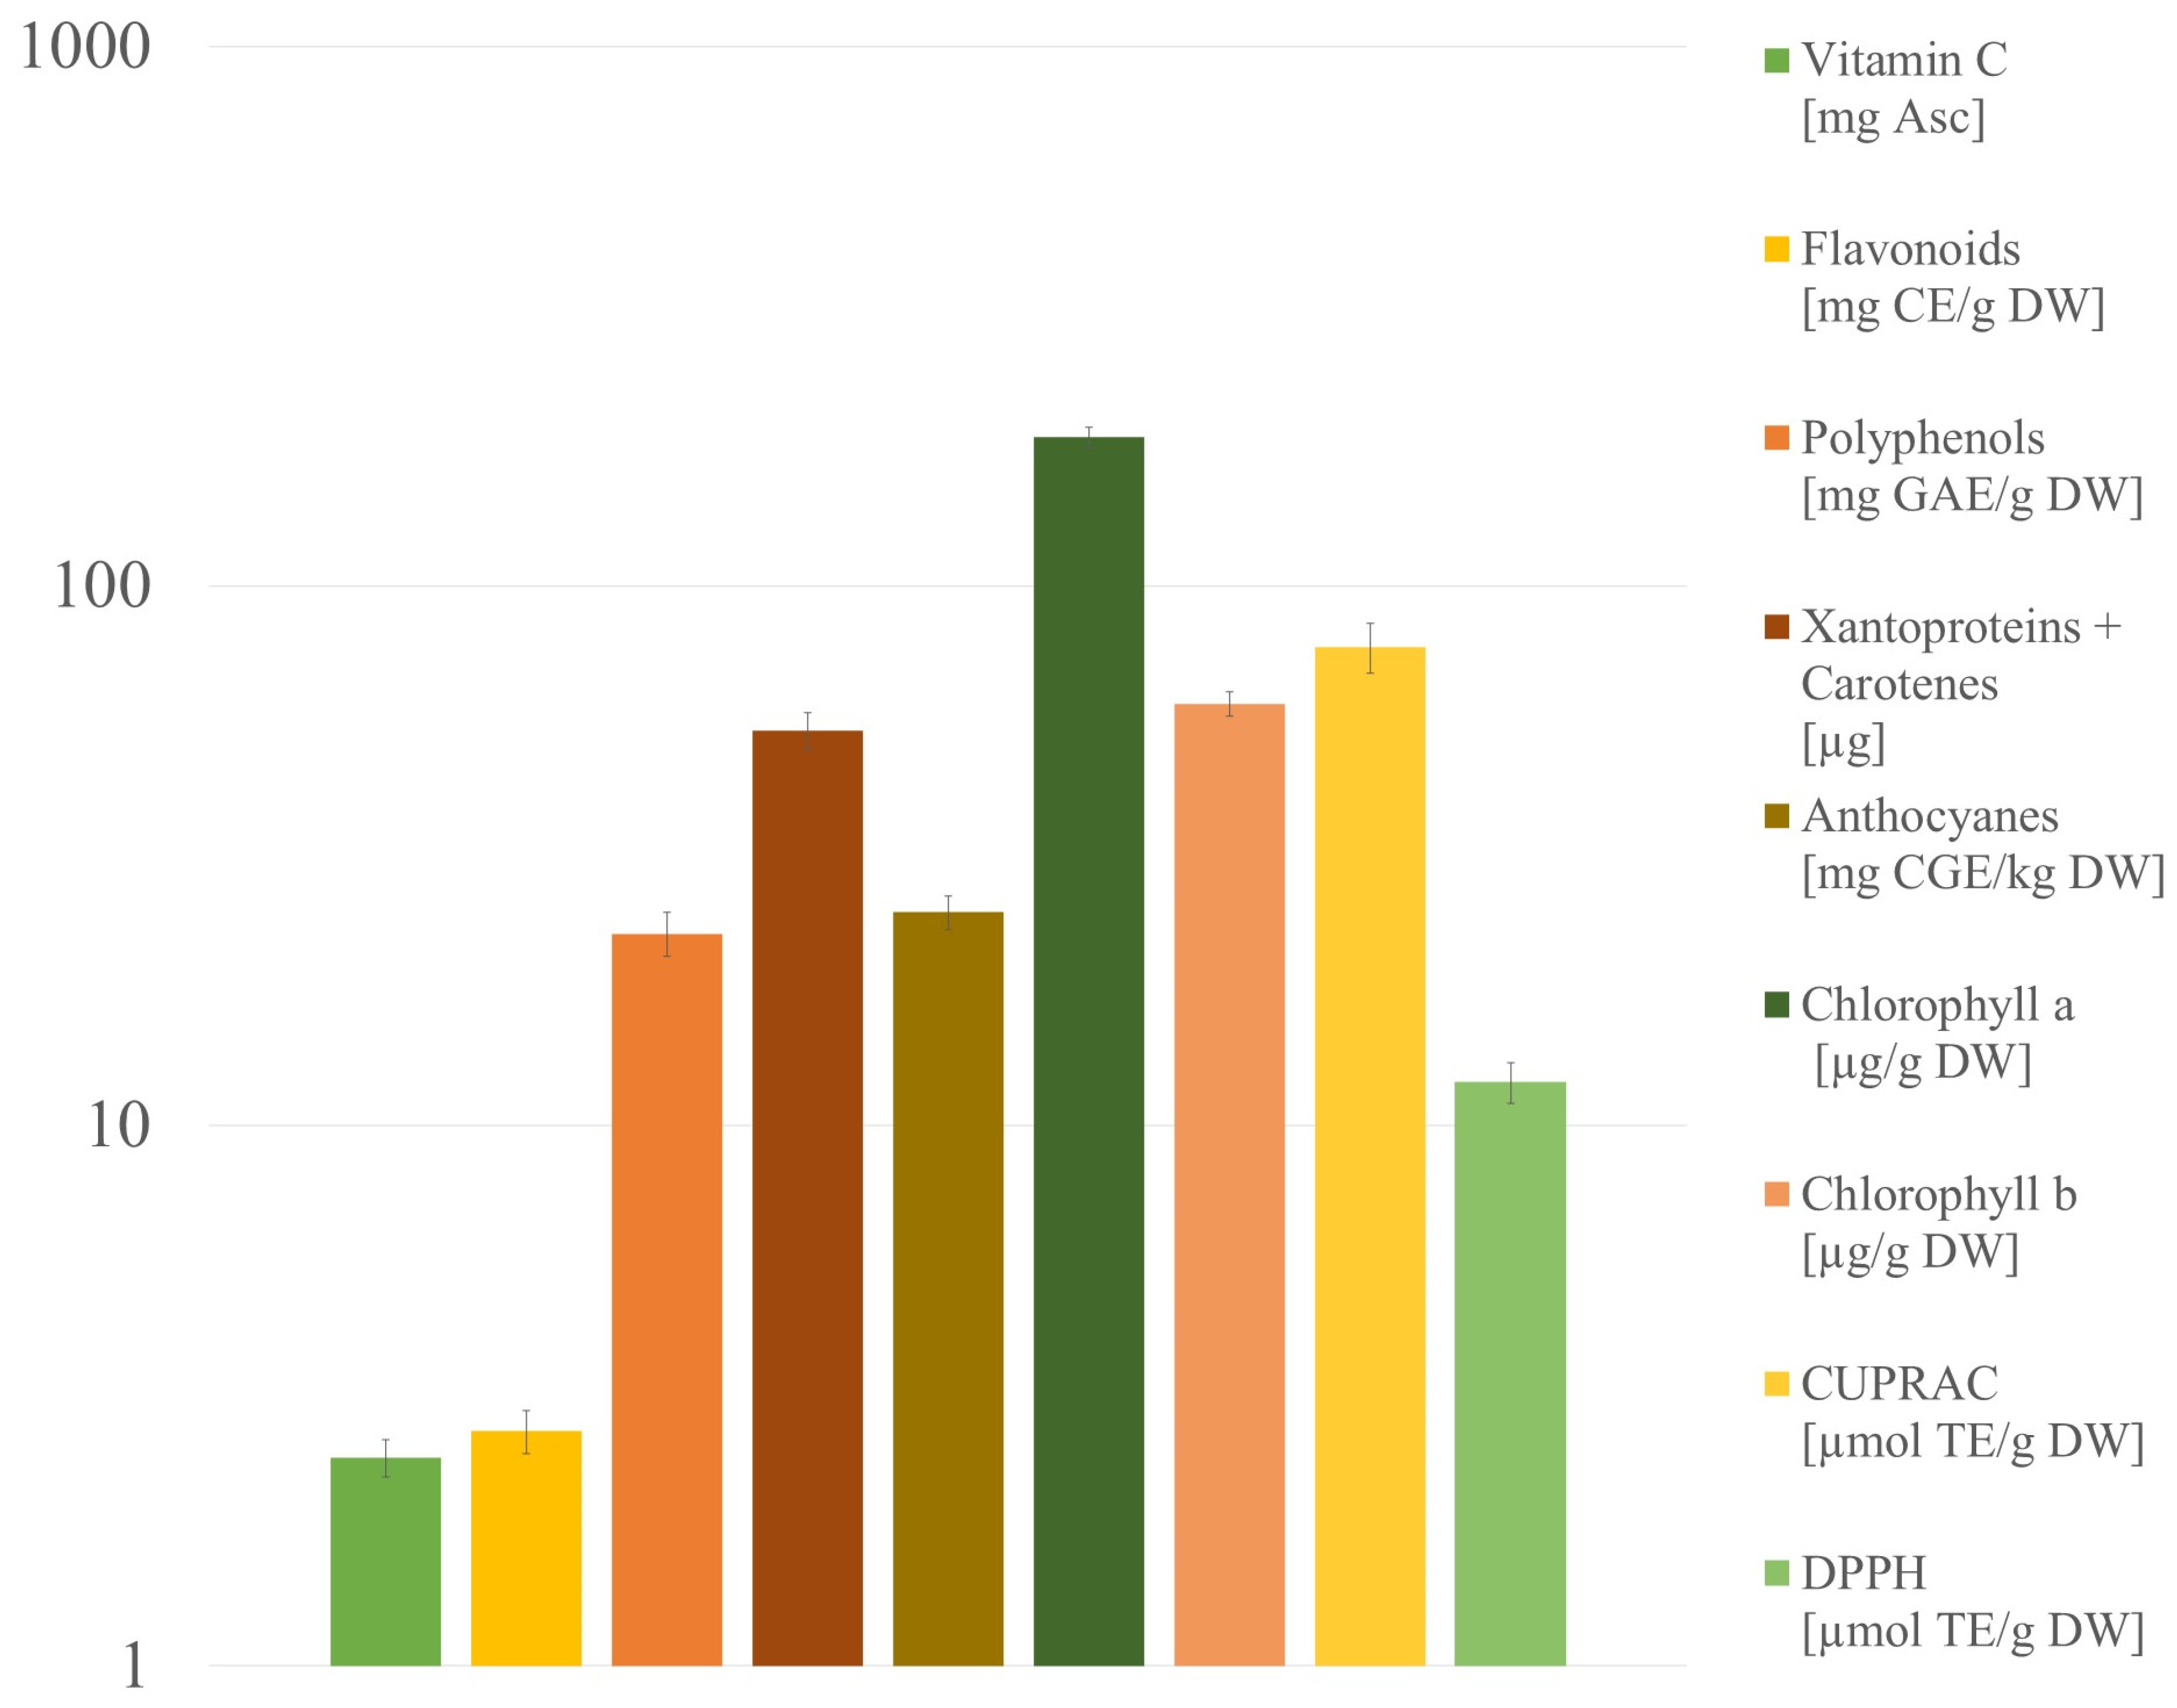
2.3. Bioactive Compounds’ Determination and Antioxidant Assays
2.3.1. Polyphenols
2.3.2. Chlorophylls
2.3.3. Flavonoids
2.3.4. Anthocyanins
2.3.5. Carotenoids (Xanthophylls and Carotenes)
2.3.6. Vitamin C
2.3.7. DPPH Free Radical Scavenging and CUPRAC Cupric Reducing Antioxidant Capacity
2.4. Micro and Macroelements
3. Materials and Methods
3.1. Materials and Reagents
3.2. Essential Oil Compositions
3.2.1. Hydrodistillation
3.2.2. GS–MS Analysis
3.3. Pectins’ Characteristics
3.3.1. Extraction
3.3.2. Degree of Methylation
3.3.3. Galacturonic Acid Content
3.3.4. DPPH Free Radical Scavenging
3.3.5. DSC Analysis
3.4. Bioactive Compounds’ Determination and Antioxidant Assays
3.5. Micro- and Macroelements’ Content
3.6. Data Analysis
4. Conclusions
Author Contributions
Funding
Institutional Review Board Statement
Informed Consent Statement
Data Availability Statement
Conflicts of Interest
Sample Availability
References
- Chen, Y.; Barzee, T.J.; Zhang, R.; Pan, Z. Citrus. In Integrated Processing Technologies for Food and Agricultural By-Products; Elsevier: Amsterdam, The Netherlands, 2019; pp. 217–242. [Google Scholar]
- Zhong, G.; Nicolosi, E. Citrus Origin, Diffusion, and Economic Importance. In The Citrus Genome. Compendium of Plant Genomes; Springer: Cham, Switzerland, 2020; pp. 5–21. [Google Scholar]
- Wang, Y.C.; Chuang, Y.C.; Hsu, H.W. The flavonoid, carotenoid and pectin content in peels of citrus cultivated in Taiwan. Food Chem. 2008, 106, 277–284. [Google Scholar] [CrossRef]
- Köse, M.D.; Bayraktar, O. Valorization of citrus peel waste. Nat. Volatiles Essent. Oils 2018, 5, 10–18. [Google Scholar]
- Volpe, M.; Panno, D.; Volpe, R.; Messineo, A. Upgrade of citrus waste as a biofuel via slow pyrolysis. J. Anal. Appl. Pyrolysis 2015, 115, 66–76. [Google Scholar] [CrossRef]
- Lohrasbi, M.; Pourbafrani, M.; Niklasson, C.; Taherzadeh, M.J. Process design and economic analysis of a citrus waste biorefinery with biofuels and limonene as products. Bioresour. Technol. 2010, 101, 7382–7388. [Google Scholar] [CrossRef]
- Wedamulla, N.E.; Fan, M.; Choi, Y.-J.; Kim, E.-K. Citrus peel as a renewable bioresource: Transforming waste to food additives. J. Funct. Foods 2022, 95, 105163. [Google Scholar] [CrossRef]
- Lubinska-Szczygieł, M.; Różańska, A.; Namieśnik, J.; Dymerski, T.; Shafreen, R.B.; Weisz, M.; Ezra, A.; Gorinstein, S. Quality of limes juices based on the aroma and antioxidant properties. Food Control 2018, 89, 270–279. [Google Scholar] [CrossRef]
- Agouillal, F.; Taher, M.T.; Moghrani, H.; Nasrallah, N.; El Enshasy, H. A Review of Genetic Taxonomy, Biomolecules Chemistry and Bioactivities of Citrus hystrix DC. Biosci. Biotechnol. Res. Asia 2017, 14, 285–305. [Google Scholar] [CrossRef]
- Siti, H.N.; Mohamed, S.; Kamisah, Y. Potential Therapeutic Effects of Citrus hystrix DC and Its Bioactive Compounds on Metabolic Disorders. Pharmaceuticals 2022, 15, 167. [Google Scholar] [CrossRef]
- Suresh, A.; Velusamy, S.; Ayyasamy, S.; Rathinasamy, M. Techniques for essential oil extraction from kaffir lime and its application in health care products—A review. Flavour Fragr. J. 2020, 36, 1–17. [Google Scholar] [CrossRef]
- Kulig, M.; Galanty, A.; Grabowska, K.; Podolak, I. Assessment of safety and health-benefits of Citrus hystrix DC. peel essential oil, with regard to its bioactive constituents in an in vitro model of physiological and pathological skin conditions. Biomed. Pharmacother. 2022, 151, 113151. [Google Scholar] [CrossRef]
- Anuchapreeda, S.; Chueahongthong, F.; Viriyaadhammaa, N.; Panyajai, P.; Anzawa, R.; Tima, S.; Ampasavate, C.; Saiai, A.; Rungrojsakul, M.; Usuki, T.; et al. Antileukemic cell proliferation of active compounds from kaffir lime (Citrus hystrix) leaves. Molecules 2020, 12, 1300. [Google Scholar] [CrossRef] [Green Version]
- Kanmani, P. Extraction and Analysis of Pectin from Citrus Peels: Augmenting the Yield from Citrus limon Using Statistical Experimental Design. Iran. J. energy Environ. 2014, 5, 303–312. [Google Scholar] [CrossRef]
- Methacanon, P.; Krongsin, J.; Gamonpilas, C. Pomelo (Citrus maxima) pectin: Effects of extraction parameters andits properties. Food Hydrocoll. 2014, 35, 383–391. [Google Scholar] [CrossRef]
- Kumar, C.S.; Sivakumar, M.; Ruckmani, K. Microwave-assisted Extraction of polysaccharides from Cyphomandra betacea and its biological activities. Int. J. Biol. Macromol. 2016, 92, 682–693. [Google Scholar] [CrossRef]
- La Cava, E.L.; Gerbino, E.; Sgroppo, S.C.; Andrea, G. Characterization of Pectins Extracted from Different Varieties of Pink / Red and White Grapefruits [Citrus Paradisi (Macf.)] by Thermal Treatment and Thermosonication. J. Food Sci. 2018, 83, 1613–1621. [Google Scholar] [CrossRef]
- Lubinska-Szczygeł, M.; Różańska, A.; Dymerski, T.; Namieśnik, J.; Katrich, E.; Gorinstein, S. A novel analytical approach in the assessment of unprocessed Kaffir lime peel and pulp as potential raw materials for cosmetic applications. Ind. Crops Prod. 2018, 120, 313–321. [Google Scholar] [CrossRef]
- Liew, S.S.; Ho, W.Y.; Yeap, S.K.; Bin Sharifudin, S.A. Phytochemical composition and in vitro antioxidant activities of Citrus sinensis peel extracts. PeerJ 2018, 2018, e5331. [Google Scholar] [CrossRef] [PubMed] [Green Version]
- Kasuan, N.; Yunus, M.; Rahiman, M.H.F.; Aris, S.R.A.; Taib, M.N. Essential oil composition of Kaffir lime: Comparative analysis between controlled steam distillation and hydrodistillation extraction process. In Proceedings of the SCOReD2009—Proceedings of 2009 IEEE Student Conference on Research and Development, Serdang, Malaysia, 16–18 November 2009; pp. 479–482. [Google Scholar]
- Chanthaphon, S.; Chanthachum, S.; Hongpattarakere, T. Antimicrobial activities of essential oils and crude extracts from tropical Citrus spp. Against food-related microorganisms. Songklanakarin J. Sci. Technol. 2008, 30, 125–131. [Google Scholar]
- Hongratanaworakit, T.; Buchbauer, G. Chemical composition and stimulating effect of Citrus hystrix oil on humans. Flavour Fragr. J. 2007, 22, 443–449. [Google Scholar] [CrossRef]
- Telci, I.; Demirtas, I.; Sahin, A. Variation in plant properties and essential oil composition of sweet fennel (Foeniculum vulgare Mill.) fruits during stages of maturity. Ind. Crops Prod. 2009, 30, 126–130. [Google Scholar] [CrossRef]
- Bozkurt, T.; Gülnaz, O.; Kaçar, Y.A. Chemical composition of the essential oils from some citrus species and evaluation of the antimicrobial activity. IOSR J. Environ. Sci. 2017, 11, 29–33. [Google Scholar] [CrossRef]
- Hien, T.T.; Quyen, N.T.C.; Minh, P.T.H.; Le, X.T. Determine the components of Kaffir Lime Oil (Citrus hystrix DC.) in the Microwave-assisted Extraction Process. In Proceedings of the IOP Conference Series: Materials Science and Engineering, Ulaanbaatar, Mongolia, 10–13 September 2020. [Google Scholar]
- Sukontason, K.L.; Samerjai, C.; Sanit, S.; Klong-Klaew, T.; Limsopatham, K.; Sontigun, N.; Suwannayod, S.; Kurahashi, H.; Bunchu, N.; Chaiwon, T.; et al. Survey of forensically important fly species in northern Thailand. Southeast Asian J. Trop. Med. Public Health 2018, 49, 32. [Google Scholar]
- Suwannayod, S.; Sukontason, K.L.; Somboon, P.; Junkum, A.; Leksomboon, R.; Chaiwong, T.; Jones, M.K.; Sripa, B.; Balthaisong, S.; Phuyao, C.; et al. Activity of kaffir lime (Citrus hystrix) essential oil against blow flies and house fly. Southeast Asian J. Trop. Med. Public Health 2018, 49, 32–45. [Google Scholar]
- Warsito, W.; Palungan, M.H.; Utomo, E.P. Profiling study of the major and minor components of kaffir lime oil (Citrus hystrix dc.) in the fractional distillation process. Pan Afr. Med. J. 2017, 27, 282. [Google Scholar] [CrossRef]
- Sharma, S.; Gupta, J.; Prabhakar, P.K.; Gupta, P.; Solanki, P.; Rajput, A. Phytochemical Repurposing of Natural Molecule: Sabinene for Identification of Novel Therapeutic Benefits Using in Silico and in Vitro Approaches. Assay Drug Dev. Technol. 2019, 17, 339–351. [Google Scholar] [CrossRef]
- Baccati, C.; Gibernau, M.; Paoli, M.; Ollitrault, P.; Tomi, F.; Luro, F. Chemical variability of peel and leaf essential oils in the citrus subgenus Papeda (Swingle) and few relatives. Plants 2021, 10, 1117. [Google Scholar] [CrossRef]
- Shaha, R.K.; Punichelvana, Y.N.A.P.; Afandi, A. Optimized Extraction Condition and Characterization of Pectin from Kaffir Lime (Citrus hystrix). Res. J. Agric. For. Sci. 2013, 1, 1–11. [Google Scholar]
- Phatak, L.; Chang, K.C.; Brown, G. Isolation and Characterization of Pectin in Sugar-Beet Pulp. J. Food Sci. 1988, 53, 830–833. [Google Scholar] [CrossRef]
- Wang, W.; Ma, X.; Xu, Y.; Cao, Y.; Jiang, Z.; Ding, T.; Ye, X.; Liu, D. Ultrasound-assisted heating extraction of pectin from grapefruit peel: Optimization and comparison with the conventional method. Food Chem. 2015, 178, 106–114. [Google Scholar] [CrossRef]
- Sayah, M.Y.; Chabir, R.; Benyahia, H.; Kandri, Y.R.; Chahdi, F.O.; Touzani, H.; Errachidi, F. Yield, esterification degree and molecular weight evaluation of pectins isolated from orange and grapefruit peels under different conditions. PLoS ONE 2016, 11, e0161751. [Google Scholar] [CrossRef] [Green Version]
- Wang, X.; Chen, Q.; Lü, X. Pectin extracted from apple pomace and citrus peel by subcritical water. Food Hydrocoll. 2014, 38, 129–137. [Google Scholar] [CrossRef]
- May, C.D. Industrial pectins: Sources, production and applications. Carbohydr. Polym. 1990, 12, 79–99. [Google Scholar] [CrossRef]
- Müller-Maatsch, J.; Bencivenni, M.; Caligiani, A.; Tedeschi, T.; Bruggeman, G.; Bosch, M.; Petrusan, J.; Van Droogenbroeck, B.; Elst, K.; Sforza, S. Pectin content and composition from different food waste streams. Food Chem. 2016, 201, 37–45. [Google Scholar] [CrossRef] [PubMed] [Green Version]
- Rahman, M.M.; Islam, M.B.; Biswas, M.; Khurshid Alam, A.H.M. In vitro antioxidant and free radical scavenging activity of different parts of Tabebuia pallida growing in Bangladesh. BMC Res. Notes 2015, 8, 621. [Google Scholar] [CrossRef] [Green Version]
- Gharibzahedi, S.M.T.; Smith, B.; Guo, Y. Pectin extraction from common fig skin by different methods: The physicochemical, rheological, functional, and structural evaluations. Int. J. Biol. Macromol. 2019, 136, 275–283. [Google Scholar] [CrossRef]
- Wathoni, N.; Yuan Shan, C.; Yi Shan, W.; Rostinawati, T.; Indradi, R.B.; Pratiwi, R.; Muchtaridi, M. Characterization and antioxidant activity of pectin from Indonesian mangosteen (Garcinia mangostana L.) rind. Heliyon 2019, 5, e02299. [Google Scholar] [CrossRef]
- Einhorn-Stoll, U.; Kunzek, H.; Dongowski, G. Thermal analysis of chemically and mechanically modified pectins. Food Hydrocoll. 2007, 21, 1101–1112. [Google Scholar] [CrossRef]
- Godeck, R.; Kunzek, H.; Kabbert, R. Thermal analysis of plant cell wall materials depending on the chemical structure and pre-treatment prior to drying. Eur. Food Res. Technol. 2001, 213, 395–404. [Google Scholar] [CrossRef]
- Einhorn-Stoll, U.; Kastner, H.; Fatouros, A.; Krähmer, A.; Kroh, L.W.; Drusch, S. Thermal degradation of citrus pectin in low-moisture environment—Investigation of backbone depolymerisation. Food Hydrocoll. 2020, 107, 104–115. [Google Scholar] [CrossRef]
- Khan, U.M.; Sameen, A.; Aadil, R.M.; Shahid, M.; Sezen, S.; Zarrabi, A.; Ozdemir, B.; Sevindik, M.; Kaplan, D.N.; Selamoglu, Z.; et al. Citrus genus and its waste utilization: A review on health-promoting activities and industrial application. Evidence-based Complement. Altern. Med. 2021, 2021, 2488804. [Google Scholar] [CrossRef]
- Chen, Q.; Wang, D.; Tan, C.; Hu, Y.; Sundararajan, B.; Zhou, Z. Profiling of flavonoid and antioxidant activity of fruit tissues from 27 Chinese local citrus cultivars. Plants 2020, 9, 196. [Google Scholar] [CrossRef] [Green Version]
- Solymosi, K.; Mysliwa-Kurdziel, B. Chlorophylls and their Derivatives Used in Food Industry and Medicine. Mini Rev. Med. Chem. 2017, 17, 1194–1222. [Google Scholar] [CrossRef] [Green Version]
- Ciriminna, R.; Forest, B.; Meneguzzo, F.; Pagliaro, M.; Hamann, M.T. Technical and economic feasibility of a stable yellow natural colorant production from waste lemon peel. Appl. Sci. 2020, 10, 6812. [Google Scholar] [CrossRef]
- Win, T.O.; Srilaong, V.; Kyu, K.L.; Poomputsa, K.; Kanlayanarat, S. Biochemical and physiological changes during chlorophyll degradation in lime (Citrus aurantifolia Swingle cv.). J. Hortic. Sci. Biotechnol. 2006, 81, 471–477. [Google Scholar] [CrossRef]
- Perez-Galvez, A.; Viera, I.; Roca, M. Chemistry in the Bioactivity of Chlorophylls: An Overview. Curr. Med. Chem. 2018, 24, 4515–4536. [Google Scholar] [CrossRef] [PubMed] [Green Version]
- Robak, J.; Gryglewski, R.J. Bioactivity of flavonoids. Pol. J. Pharmacol. 1996, 48, 555–564. [Google Scholar] [PubMed]
- Chatha, S.A.S.; Hussain, A.I.; Asi, M.R.; Majeed, M.; Iqbal, H.M.N. Evaluation of antioxidant potential of citrus peel extracts. J. Chem. Soc. Pakistan 2011, 33, 863–868. [Google Scholar]
- Ćetković, G.; Čanadanović-Brunet, J.; Djilas, S.; Savatović, S.; Mandić, A.; Tumbas, V. Assessment of polyphenolic content and in vitro antiradical characteristics of apple pomace. Food Chem. 2008, 109, 340–347. [Google Scholar] [CrossRef]
- Changxing, L.; Chenling, M.; Alagawany, M.; Jianhua, L.; Dongfang, D.; Gaichao, W.; Wenyin, Z.; Syed, S.F.; Arain, M.S.; Saeed, M.; et al. Health benefits and potential applications of anthocyanins in poultry feed industry. Worlds. Poult. Sci. J. 2018, 74, 251–264. [Google Scholar] [CrossRef]
- Gorinstein, S.; Zachwieja, Z.; Katrich, E.; Pawelzik, E.; Haruenkit, R.; Trakhtenberg, S.; Martin-Belloso, O. Comparison of the contents of the main antioxidant compounds and the antioxidant activity of white grapefruit and his new hybrid. LWT—Food Sci. Technol. 2004, 37, 337–343. [Google Scholar] [CrossRef]
- Kato, M.; Ikoma, Y.; Matsumoto, H.; Sugiura, M.; Hyodo, H.; Yano, M. Accumulation of Carotenoids and Expression of Carotenoid Biosynthetic Genes during Maturation in Citrus Fruit. Plant Physiol. 2004, 134, 824–837. [Google Scholar] [CrossRef] [PubMed] [Green Version]
- Ojha, P.; Bahadur Karki, T.; Sitaula, R. Physio-chemical and functional quality evaluation of mandarin peel powder. J. Agric. Sci. Technol. 2016, 18, 575–582. [Google Scholar]
- Guimarães, R.; Barros, L.; Barreira, J.C.M.; Sousa, M.J.; Carvalho, A.M.; Ferreira, I.C.F.R. Targeting excessive free radicals with peels and juices of citrus fruits: Grapefruit, lemon, lime and orange. Food Chem. Toxicol. 2010, 48, 99–106. [Google Scholar] [CrossRef]
- Farris, P.K. Topical vitamin C: A useful agent for treating photoaging and other dermatologic conditions. Dermatol. Surg. 2005, 31, 814–817. [Google Scholar] [CrossRef]
- Mcharek, N.; Hanchi, B. Maturational effects on phenolic constituents, antioxidant activities and LC-MS / MS profiles of lemon (Citrus limon) peels. J. Appl. Bot. Food Qual. 2017, 90, 1–9. [Google Scholar] [CrossRef]
- Wang, Y.; Qian, J.; Cao, J.; Wang, D.; Liu, C.; Yang, R.; Li, X.; Sun, C. Antioxidant capacity, anticancer ability and flavonoids composition of 35 citrus (Citrus reticulata Blanco) varieties. Molecules 2017, 22, 1114. [Google Scholar] [CrossRef] [PubMed] [Green Version]
- Nishad, J.; Saha, S.; Dubey, A.K.; Varghese, E.; Kaur, C. Optimization and comparison of non-conventional extraction technologies for Citrus paradisi L. peels: A valorization approach. J. Food Sci. Technol. 2019, 56, 1221–1233. [Google Scholar] [CrossRef]
- De Moraes Barros, H.R.; De Castro Ferreira, T.A.P.; Genovese, M.I. Antioxidant capacity and mineral content of pulp and peel from commercial cultivars of citrus from Brazil. Food Chem. 2012, 134, 1892–1898. [Google Scholar] [CrossRef] [PubMed]
- Ani, P.N.; Abel, H.C. Nutrient, phytochemical, and antinutrient composition of Citrus maxima fruit juice and peel extract. Food Sci. Nutr. 2018, 6, 653–658. [Google Scholar] [CrossRef] [Green Version]
- Munirah, N.; Khairi, M.; Nozulaidi, M.; Jahan, M. The Effects of Zinc Application on Physiology and Production of Corn Plants. Aust. J. Basic Appl. Sci. 2015, 9, 161–165. [Google Scholar]
- Gorinstein, S.; Zachwieja, Z.; Folta, M.; Barton, H.; Piotrowicz, J.; Zemser, M.; Weisz, M.; Trakhtenberg, S.; Màrtín-Belloso, O. Comparative contents of dietary fiber, total phenolics, and minerals in persimmons and apples. J. Agric. Food Chem. 2001, 49, 952–957. [Google Scholar] [CrossRef] [PubMed]
- Dibanda Romelle, F.; Ashwini, R.P.; Manohar, R.S. Chemical Composition of Some Selected Fruit Peels. Eur. J. Food Sci. Technol. 2016, 4, 12–21. [Google Scholar]
- Dumon, J.C.; Ernst, W.H.O. Titanium in Plants. J. Plant Physiol. 1988, 133, 203–209. [Google Scholar] [CrossRef]
- Rodsamran, P.; Sothornvit, R. Microwave heating extraction of pectin from lime peel: Characterization and properties compared with the conventional heating method. Food Chem. 2019, 278, 364–372. [Google Scholar] [CrossRef]
- Melton, L.D.; Smith, B.G. Determination of the Uronic Acid Content Of Plant Cell Walls Using A Colorimetric Assay. Handb. Food Anal. Chem. 2005, 1–2, 735–738. [Google Scholar] [CrossRef]
- Papoutsis, K.; Pristijono, P.; Golding, J.B.; Stathopoulos, C.E.; Scarlett, C.J.; Bowyer, M.C.; Vuong, Q. Van Impact of different solvents on the recovery of bioactive compounds and antioxidant properties from lemon (Citrus limon L.) pomace waste. Food Sci. Biotechnol. 2016, 25, 971–977. [Google Scholar] [CrossRef] [PubMed]
- Boyer, R.F. Isolation and spectrophotometric characterization of photosynthetic pigments. Biochem. Educ. 1990, 18, 203–206. [Google Scholar] [CrossRef]
- Ku, Y.G.; Bae, J.H.; Namieśnik, J.; Barasch, D.; Nemirovski, A.; Katrich, E.; Gorinstein, S. Detection of Bioactive Compounds in Organically and Conventionally Grown Asparagus Spears. Food Anal. Methods 2018, 11, 309–318. [Google Scholar] [CrossRef]
- Özyürek, M.; Güçlü, K.; Bektaşoǧlu, B.; Apak, R. Spectrophotometric determination of ascorbic acid by the modified CUPRAC method with extractive separation of flavonoids-La(III) complexes. Anal. Chim. Acta 2007, 588, 88–95. [Google Scholar] [CrossRef]


| No. | Chemical Compound * | Composition (%) |
|---|---|---|
| 1 | α-pinene | 4.27 |
| 2 | Camphene | 0.17 |
| 3 | Sabinene | 31.9 |
| 4 | β-pinene | 26.3 |
| 5 | Myrcene | 0.81 |
| 6 | p-cymene | 0.79 |
| 7 | β-phellandrene | 9.34 |
| 8 | Limonene | 18.6 |
| 9 | β-ocimene | 0.27 |
| 10 | Linalool | 0.24 |
| 11 | Citronellal | 0.24 |
| 12 | Terpinen-4-ol | 0.23 |
| 13 | α-Terpineol | 0.33 |
| 14 | Carveol | 0.16 |
| 15 | Citronellol | 0.17 |
| Extraction Conditions | Pectin Yield (%) |
|---|---|
| Acid extraction, 60 °C (60A) | 7.6 |
| Acid extraction, 70 °C (70A) | 14.1 |
| Acid extraction, 80 °C (80A) | 17.6 |
| Ultrasound acid extraction 60 °C (60U) | 9.9 |
| Ultrasound acid extraction, 70 °C (70U) | 16.0 |
| Ultrasound acid extraction, 80 °C (80U) | 28.2 |
| Extraction Conditions | Degree of Methylation (%) |
|---|---|
| Acid extraction, 60 °C (60A) | 3.45 ± 0.51 |
| Acid extraction, 70 °C (70A) | 2.81 ± 0.45 |
| Acid extraction, 80 °C (80A) | 4.00 ± 0.84 |
| Ultrasound acid extraction 60 °C (60U) | 3.81 ± 0.89 |
| Ultrasound acid extraction, 70 °C (70U) | 3.87 ± 0.03 |
| Ultrasound acid extraction, 80 °C (80U) | 2.91 ± 0.64 |
| Extraction Conditions | Galacturonic Acid Content (mg GAL/g) |
|---|---|
| Acid extraction, 60 °C (60A) | 650 ± 75 |
| Acid extraction, 70 °C (70A) | 503.2 ± 8.7 |
| Acid extraction, 80 °C (80A) | 439.4 ± 6.5 |
| Ultrasound acid extraction 60 °C (60U) | 312.8 ± 2.2 |
| Ultrasound acid extraction, 70 °C (70U) | 339.5 ± 1.7 |
| Ultrasound acid extraction, 80 °C (80U) | 367 ± 10 |
| Tendo [°C] | ΔHendo [J/g] | Texo [°C] | ΔHexo [J/g] | |
|---|---|---|---|---|
| Acid extraction, 60 °C (60A) | 203.40 | 334.6 | 256.21 | 54.91 |
| Acid extraction, 60 °C (60U) | 204.77 | 191.1 | 255.87 | 86.97 |
| Acid extraction, 70 °C (70A) | 204.15 | 320.5 | 253.49 | 70.49 |
| Acid extraction, 70 °C (70U) | 200.49 | 276.5 | 254.42 | 67.33 |
| Acid extraction, 80 °C (80A) | 204.26 | 151.5 | 256.82 | 65.52 |
| Acid extraction, 80 °C (80U) | 201.23 | 262.4 | 256.84 | 77.73 |
| Microelements Concentration ± U [mg/kg] | |
| Fe | 32.72 ± 0.39 |
| Zn | 16.09 ± 0.14 |
| Cu | 4.518 ± 0.039 |
| Mn | 7.008 ± 0.029 |
| Co | <LOQ |
| Ni | <LOD |
| Cr | <LOQ |
| Mo | 0.295 ± 0.017 |
| V | <LOD |
| Macroelements Concentration ± U [mg/kg] | |
| Mg | 1050.3 ± 7.3 |
| Ca | 9416 ± 34 |
| K | 10820 ± 130 |
| Na | 1500 ± 28 |
| Ballast Element Concentration ± U [mg/kg] | |
| Cd | <LOD |
| Hg | 0.0145 ± 0.0011 |
| Pb | <LOD |
| Al. | 77.46 ± 0.33 |
| Ba | 16.52 ± 0.29 |
| Sr | 16.16 ± 0.22 |
| Pt | <LOD |
| Analyte | WAVELENGTH [nm] | LOD [mg/kg] | LOQ [mg/kg] | Linearity | |||||
|---|---|---|---|---|---|---|---|---|---|
| Calibration Range [mg/kg] | |||||||||
| Min. | Max. | Points | Rep. | Calibration Curve | R2 | ||||
| Microelements | |||||||||
| Fe | 371.993 | 0.33 | 1.0 | 1.0 | 100 | 8 | 4 | y = 5510x − 1049 | 0.9997 |
| Zn | 213.857 | 0.19 | 0.58 | 0.58 | 10 | 9 | 4 | y = 12014x + 96 | 0.9995 |
| Cu | 327.395 | 0.026 | 0.077 | 0.30 | 20 | 6 | 4 | y = 44555x − 1626 | 0.9999 |
| Mn | 403.076 | 0.0064 | 0.019 | 0.019 | 1.0 | 5 | 4 | y = 28990x + 44 | 0.9999 |
| Co | 345.351 | 0.012 | 0.035 | 0.050 | 1.0 | 5 | 4 | y = 13331x − 2.4 | 0.9999 |
| Ni | 361.939 | 0.0070 | 0.021 | 0.10 | 20 | 7 | 4 | y = 5637x − 338 | 0.9999 |
| Cr | 425.433 | 0.0027 | 0.0082 | 0.01 | 10 | 8 | 4 | y = 29402x + 29 | 0.9999 |
| Mo | 386.410 | 0.0060 | 0.018 | 0.018 | 20 | 9 | 4 | y = 15860x + 29 | 0.9995 |
| V | 437.923 | 0.0057 | 0.017 | 0.017 | 20 | 9 | 4 | y = 7795x + 42 | 0.9997 |
| Macroelements | |||||||||
| Mg | 279.553 | 0.40 | 1.2 | 1.2 | 40 | 6 | 4 | y = 152325x + 37340 | 0.9996 |
| Ca | 430.253 | 2.0 | 6.0 | 10 | 250 | 6 | 4 | y = 898.5x + 1376 | 0.9995 |
| K | 766.491 | 0.16 | 0.48 | 2.5 | 20 | 4 | 4 | y = 48347x − 16941 | 0.9997 |
| Na | 568.263 | 1.1 | 3.3 | 10 | 200 | 5 | 4 | y = 34.5x − 34.1 | 0.9998 |
| Ballast substances | |||||||||
| Cd | 228.802 | 0.022 | 0.066 | 0.066 | 20 | 8 | 4 | y = 23459x − 525 | 0.9998 |
| Hg | 253.700 | 0.00096 | 0.0029 | 0.0029 | 0.10 | 10 | 3 | y = 1.001x − 0.15 | 0.9999 |
| Pb | 405.781 | 0.012 | 0.035 | 0.050 | 5.0 | 6 | 4 | y = 2776x − 77 | 0.9999 |
| Al | 396.152 | 0.088 | 0.26 | 1.0 | 100 | 8 | 4 | y = 20008x + 632 | 0.9998 |
| Ba | 493.408 | 0.21 | 0.63 | 0.63 | 3.0 | 4 | 4 | y = 20318x + 5708 | 0.9962 |
| Sr | 421.552 | 0.0045 | 0.013 | 0.013 | 40 | 6 | 4 | y = 29277x + 58 | 1.0000 |
| Pt | 265.945 | 0.075 | 0.23 | 0.40 | 4.0 | 4 | 4 | y = 3628x + 499 | 0.9994 |
Disclaimer/Publisher’s Note: The statements, opinions and data contained in all publications are solely those of the individual author(s) and contributor(s) and not of MDPI and/or the editor(s). MDPI and/or the editor(s) disclaim responsibility for any injury to people or property resulting from any ideas, methods, instructions or products referred to in the content. |
© 2023 by the authors. Licensee MDPI, Basel, Switzerland. This article is an open access article distributed under the terms and conditions of the Creative Commons Attribution (CC BY) license (https://creativecommons.org/licenses/by/4.0/).
Share and Cite
Lubinska-Szczygeł, M.; Kuczyńska-Łażewska, A.; Rutkowska, M.; Polkowska, Ż.; Katrich, E.; Gorinstein, S. Determination of the Major By-Products of Citrus hystrix Peel and Their Characteristics in the Context of Utilization in the Industry. Molecules 2023, 28, 2596. https://doi.org/10.3390/molecules28062596
Lubinska-Szczygeł M, Kuczyńska-Łażewska A, Rutkowska M, Polkowska Ż, Katrich E, Gorinstein S. Determination of the Major By-Products of Citrus hystrix Peel and Their Characteristics in the Context of Utilization in the Industry. Molecules. 2023; 28(6):2596. https://doi.org/10.3390/molecules28062596
Chicago/Turabian StyleLubinska-Szczygeł, Martyna, Anna Kuczyńska-Łażewska, Małgorzata Rutkowska, Żaneta Polkowska, Elena Katrich, and Shela Gorinstein. 2023. "Determination of the Major By-Products of Citrus hystrix Peel and Their Characteristics in the Context of Utilization in the Industry" Molecules 28, no. 6: 2596. https://doi.org/10.3390/molecules28062596