Author Contributions
Conceptualization, Y.K.H. and T.A.; methodology, D.S. and T.A.; software, T.A. and D.S.; validation, T.A., D.S. and Y.K.H.; formal analysis, T.A. and H.A.; investigation, T.A.; resources, T.A., S.M.A.A. and U.H.; data curation, T.A., H.A., U.H. and D.S.; writing—original draft preparation, T.A.; writing—review and editing, T.A., D.S., Y.K.H. and S.V.M.; visualization, D.S. and T.A.; supervision, Y.K.H., D.S. and S.V.M.; project administration, Y.K.H. All authors have read and agreed to the published version of the manuscript.
Figure 1.
A schematic diagram of CDK4/6 function depicting the role of phosphorylation and inactivation of retinoblastoma protein (Rb). The mitogenic signal stimulates the formation of the Cyclin D-CDK4/6 complex, which subsequently phosphorylates Rb, leading to the release of E2F transcription factors, thus triggering the expression of the gene responsible for the G1-S phase transition. CDK4/6 inhibitors prevent Rb phosphorylation, thereby arresting the cell cycle.
Figure 2.
A schematic illustration of the functional relationships between aromatase and CDK4/6 inhibitors. The ER pathway is directly targeted by aromatase inhibitors, while CDK4/6 inhibitors work by inhibiting the ER escape pathway, or the Cyclin D-CDK4/6-Rb pathway.
Figure 2.
A schematic illustration of the functional relationships between aromatase and CDK4/6 inhibitors. The ER pathway is directly targeted by aromatase inhibitors, while CDK4/6 inhibitors work by inhibiting the ER escape pathway, or the Cyclin D-CDK4/6-Rb pathway.
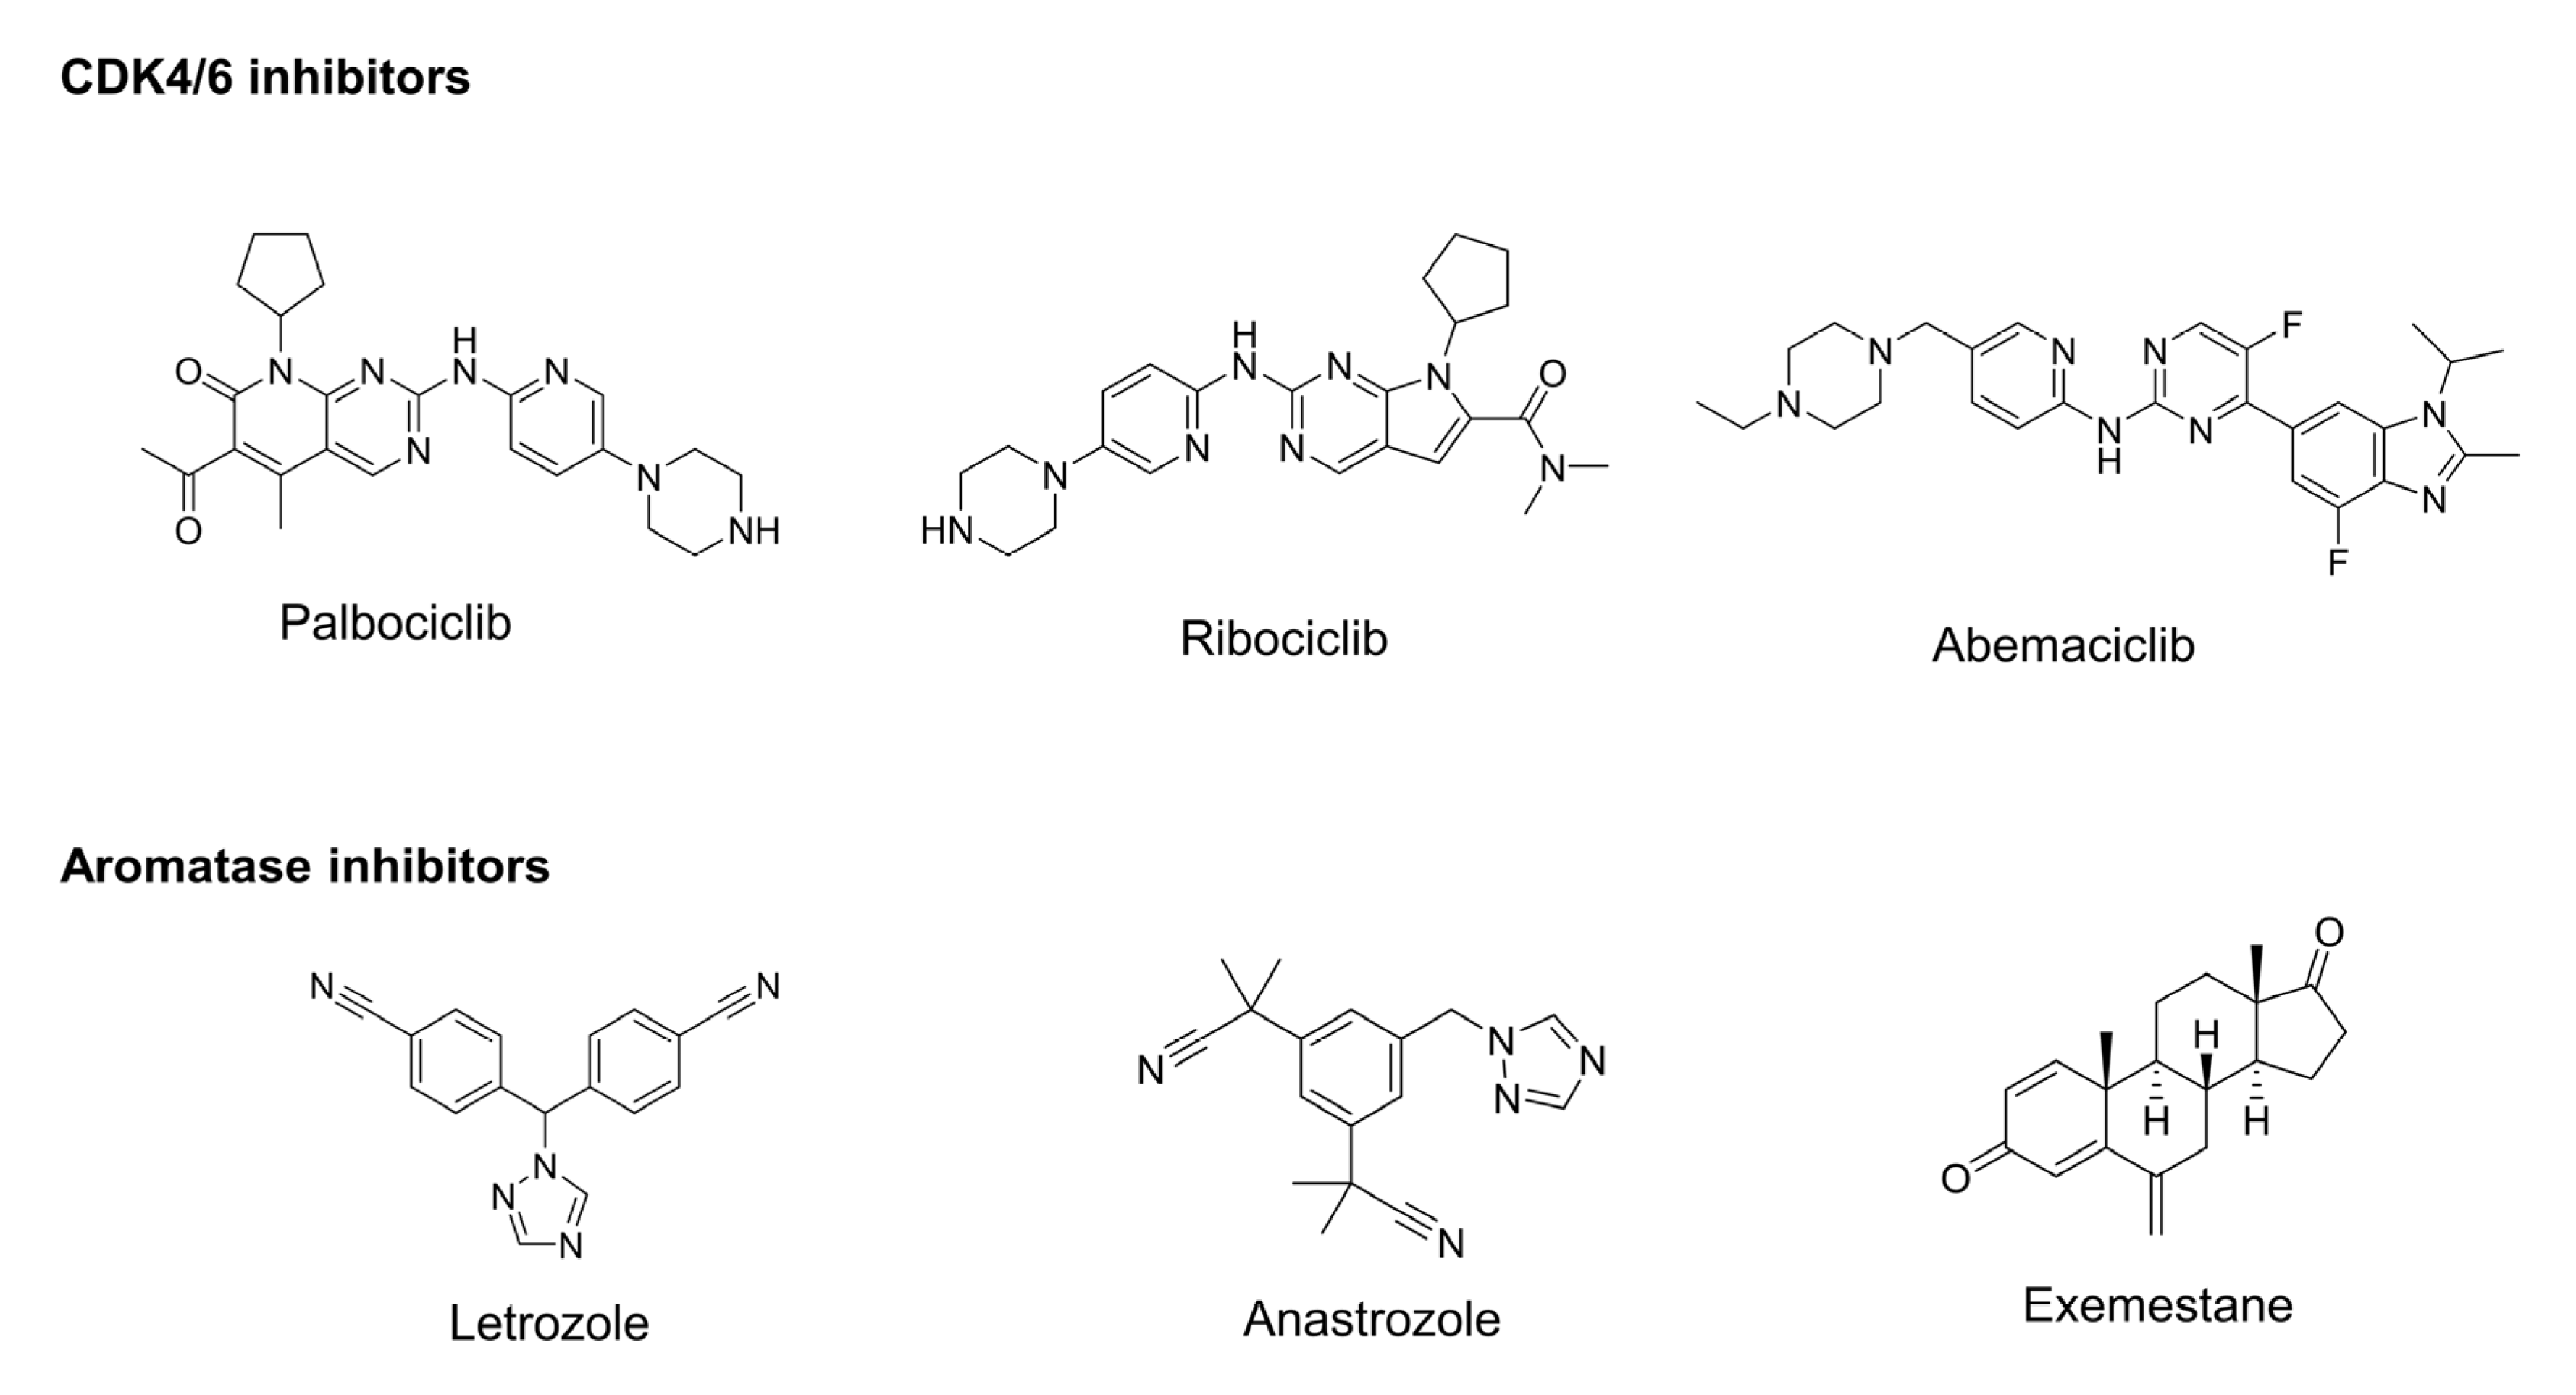
Figure 3.
Representative CDK4/6 and aromatase inhibitors have been studied for their potential in combined therapy.
Figure 3.
Representative CDK4/6 and aromatase inhibitors have been studied for their potential in combined therapy.
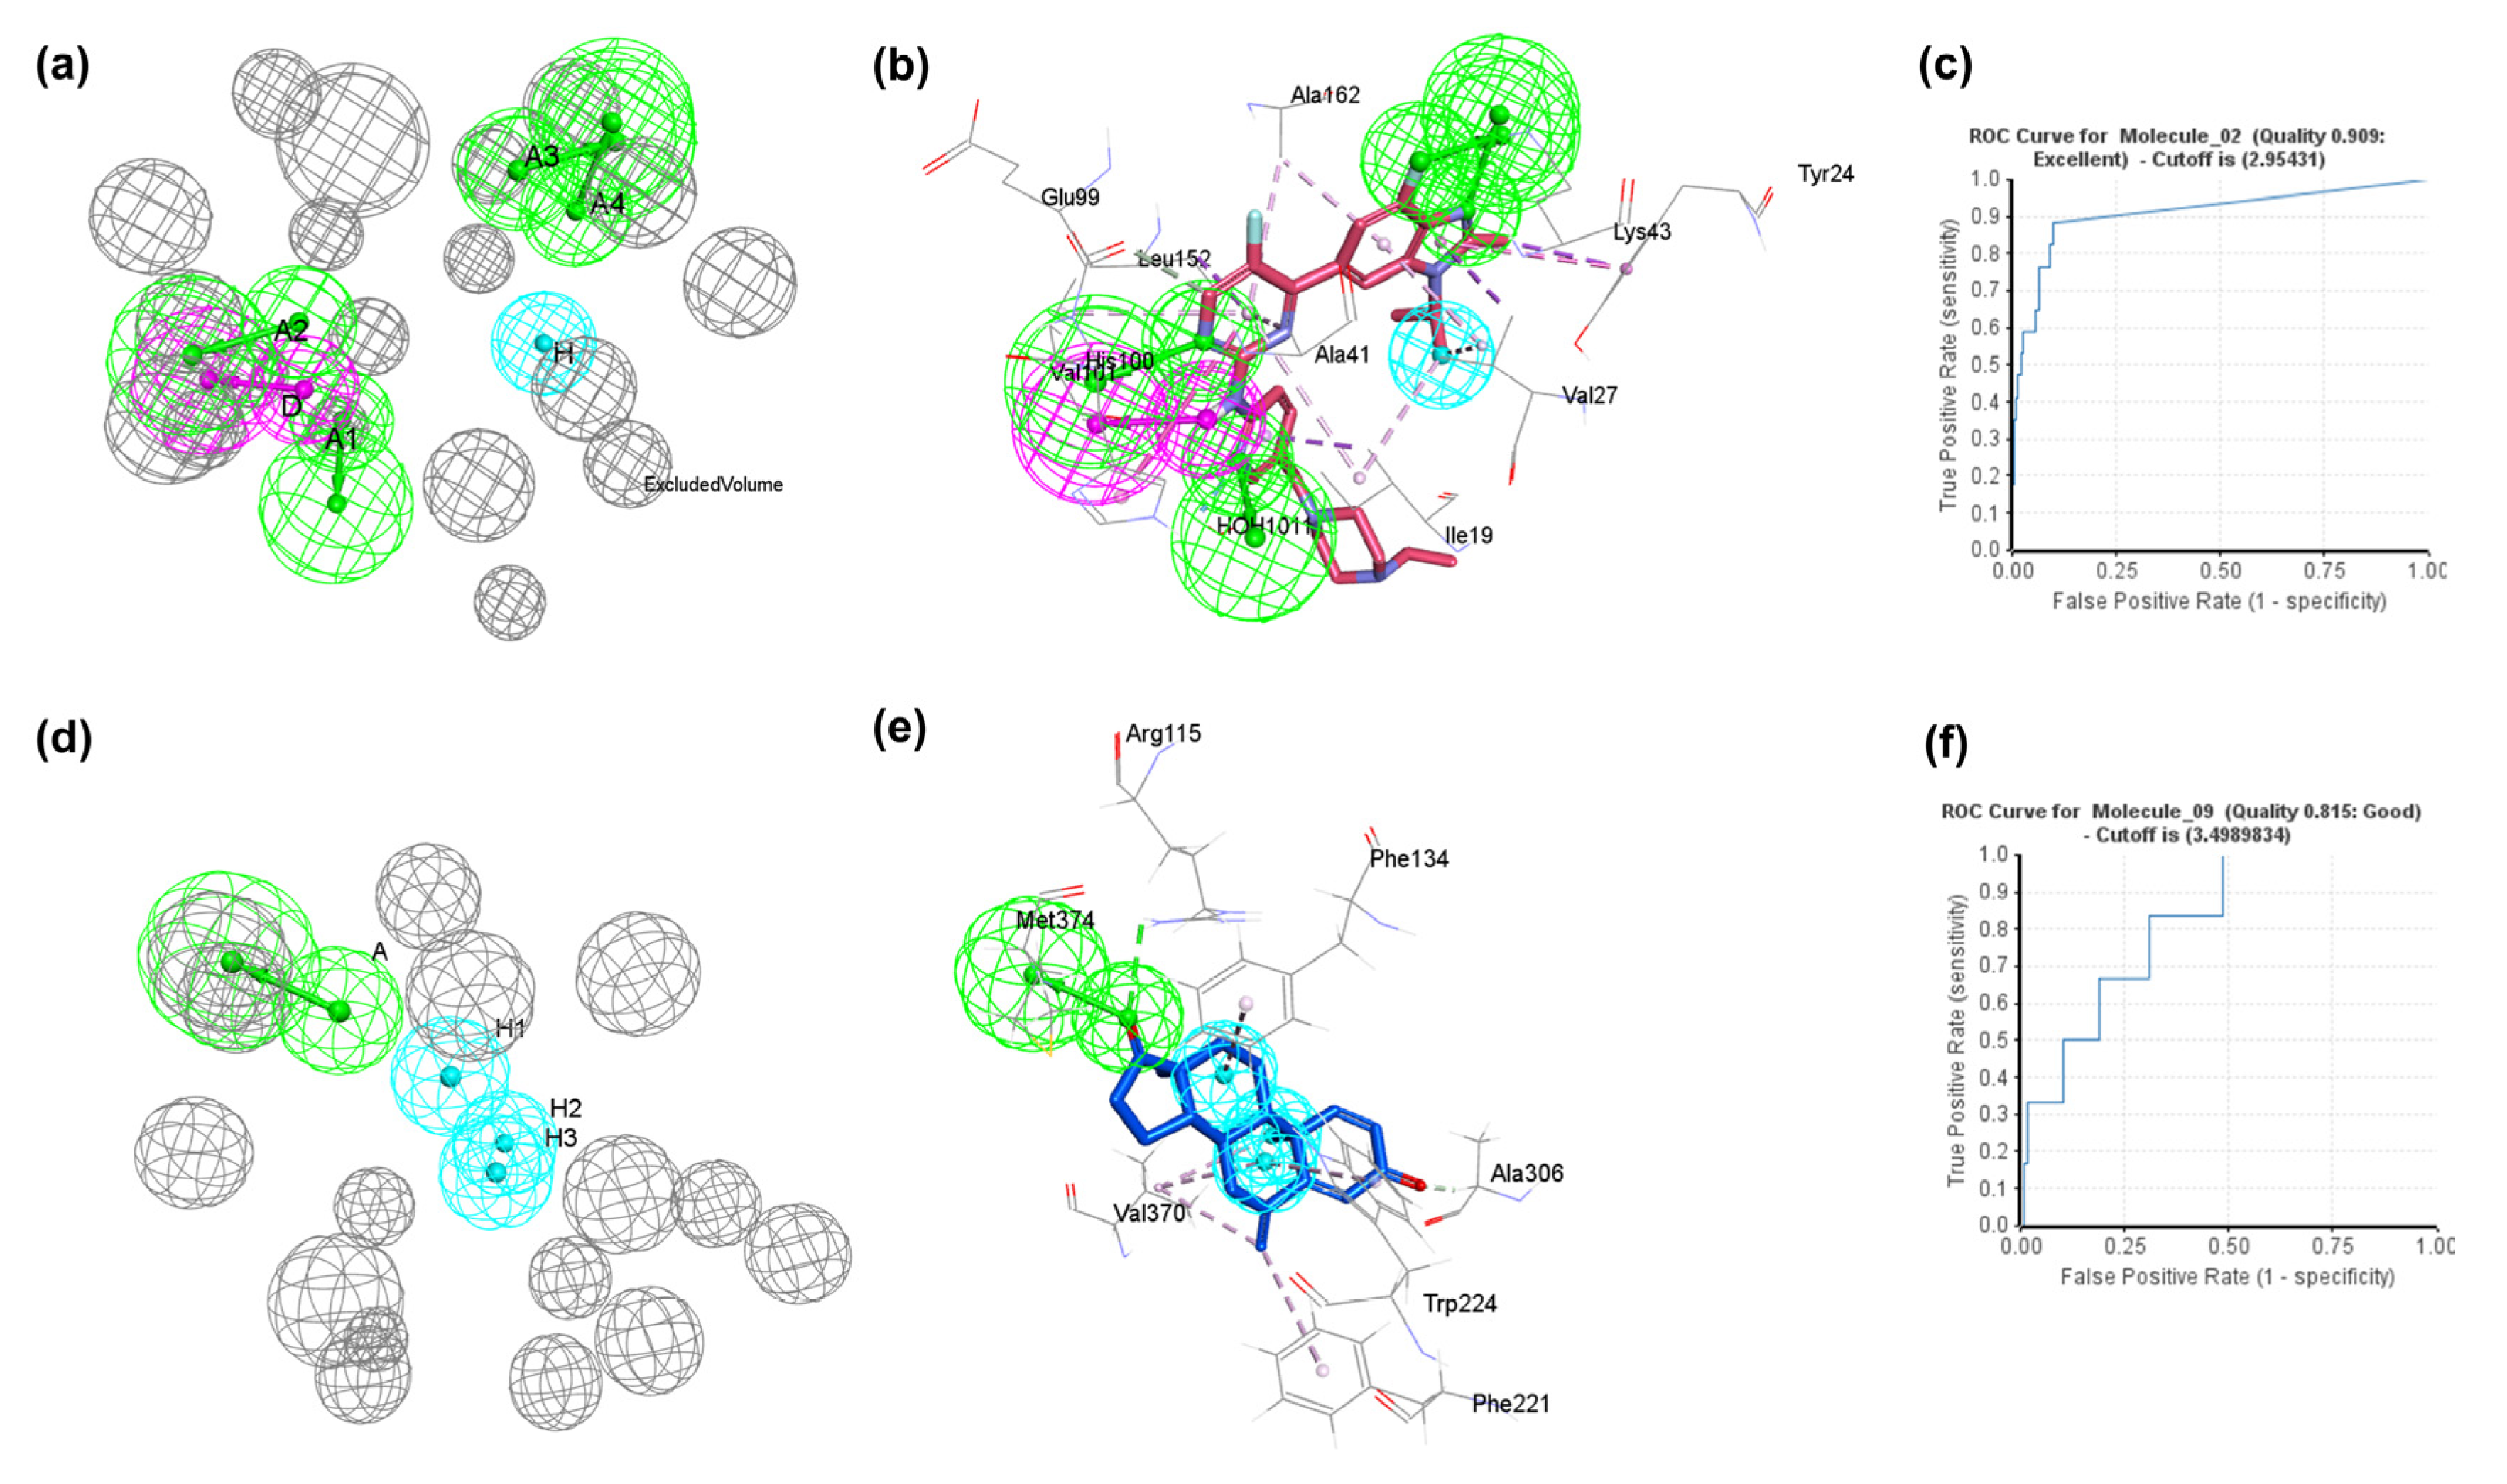
Figure 4.
Representation of pharmacophore models. (a) Pharmacophore _02model (AAAADH) of CDK6 protein with six pharmacophoric features; (b) pharmacophore_02 model in complex with co-crystal abemaciclib (PDB ID:5L2S); (c) ROC curve of the validation of pharmacophore_02 model; (d) pharmacophore_09 model (AHHH) of aromatase with four pharmacophoric features; (e) pharmacophore_02 model in complex with co-crystal exemestane (PDB ID:3S7S); (f) The validation ROC curve for the pharmacophore_09 model. Magenta, green, and cyan represent hydrogen bond donor (D), hydrogen bond acceptor (A), and hydrophobic (H) features, respectively. The grey color represents the excluded volumes.
Figure 5.
The structure-based pharmacophore model identified candidates; (a) 2D structure of identified virtual hit candidates, (b) pharmacophore_02 model (AAAADH) aligns to the identified hit candidates, (c) pharmacophore_09 model (AHHH) aligns to the identified virtual hit candidates.
Figure 5.
The structure-based pharmacophore model identified candidates; (a) 2D structure of identified virtual hit candidates, (b) pharmacophore_02 model (AAAADH) aligns to the identified hit candidates, (c) pharmacophore_09 model (AHHH) aligns to the identified virtual hit candidates.
Figure 6.
(a) shows the 2D docking interactions between abemaciclib and CDK6 (PDB ID: 5L2S). (b) shows the 2D interactions between exemestane and aromatase (PDB ID: 3S7S).
Figure 6.
(a) shows the 2D docking interactions between abemaciclib and CDK6 (PDB ID: 5L2S). (b) shows the 2D interactions between exemestane and aromatase (PDB ID: 3S7S).
Figure 7.
The 2D plot of candidate 1 in CDK6 (a) and aromatase (b) at the binding site.
Figure 7.
The 2D plot of candidate 1 in CDK6 (a) and aromatase (b) at the binding site.
Figure 8.
2D plot of potential candidate 2 in CDK6 (a) and aromatase (b) at the binding site.
Figure 8.
2D plot of potential candidate 2 in CDK6 (a) and aromatase (b) at the binding site.
Figure 9.
The 2D plot of candidate 3 in CDK (a) and aromatase (b) at the binding site.
Figure 9.
The 2D plot of candidate 3 in CDK (a) and aromatase (b) at the binding site.
Figure 10.
The 2D plot of candidate 4 in CDK (a) and aromatase (b) at the binding site.
Figure 10.
The 2D plot of candidate 4 in CDK (a) and aromatase (b) at the binding site.
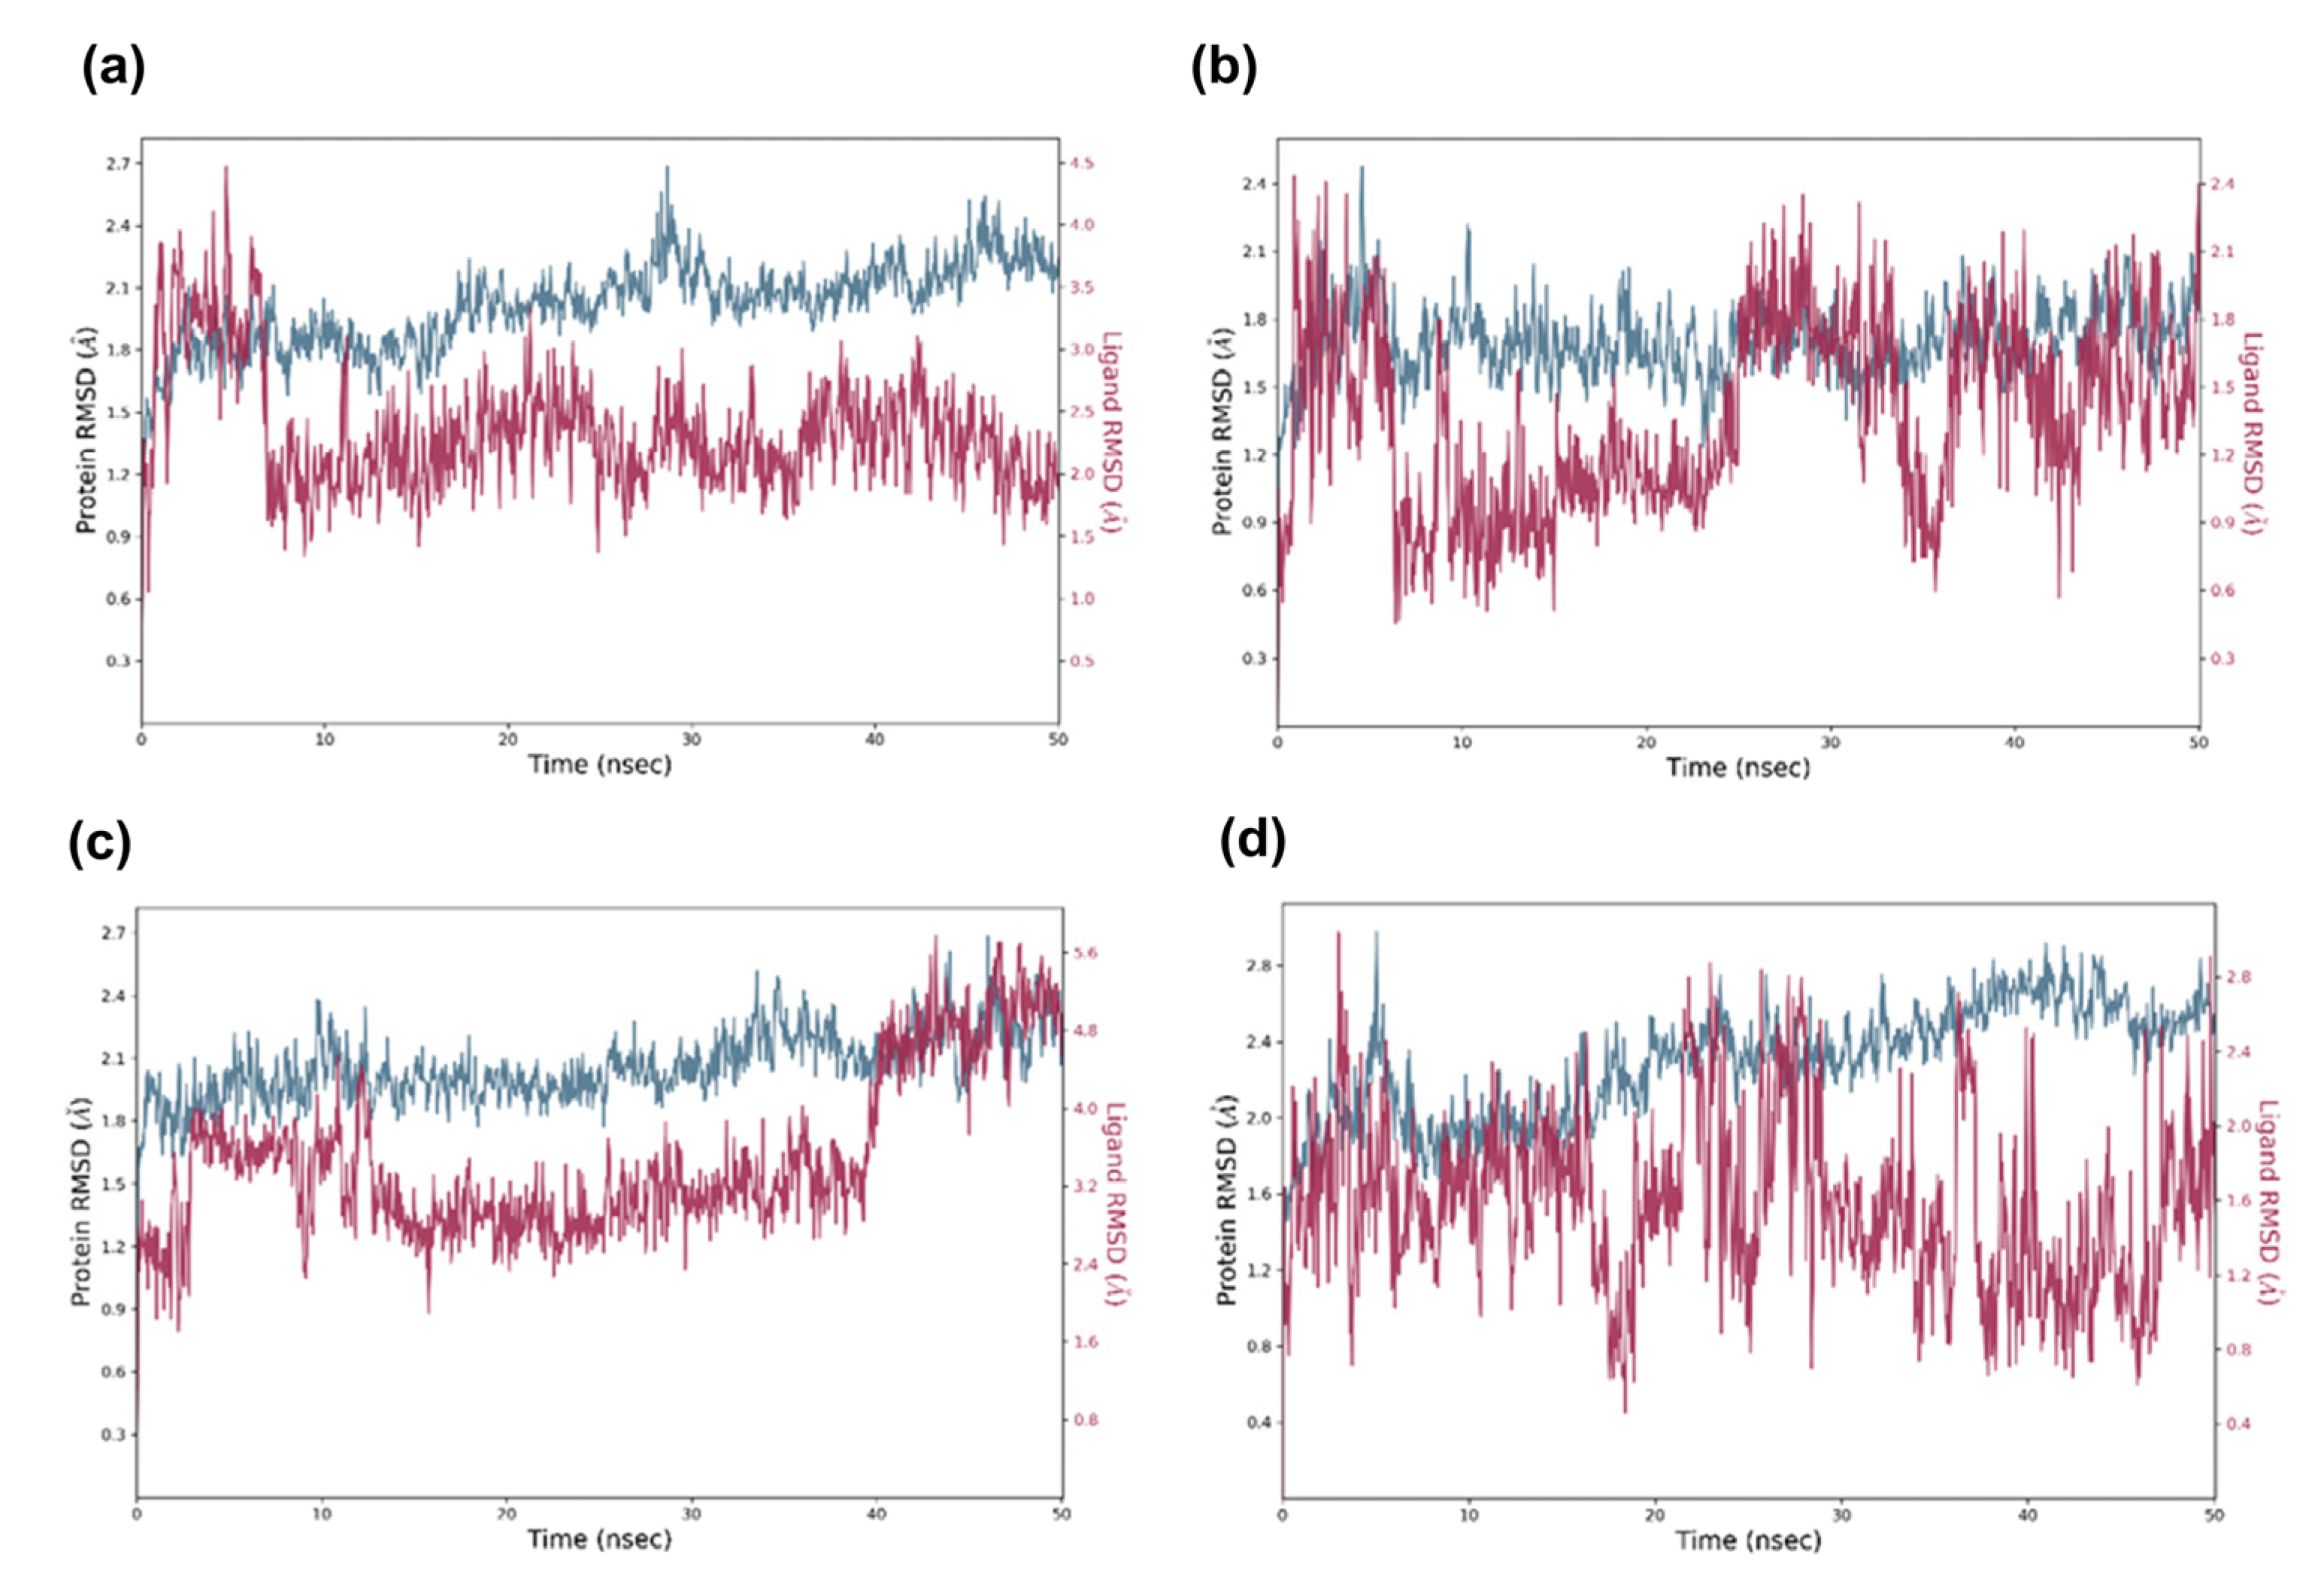
Figure 11.
MD simulation trajectory (50 ns) analysis of the docked complexes via RMSD. In the time-dependent RMSD graph, Cα-atoms of CDK6 complex with identified potential candidates, i.e., (a) candidate 1, (b) candidate 2, (c) candidate 3, (d) candidate 4. The CDK Cα-atom RMSD is shown in blue, while the RMSD of candidates concerning CDK6 is shown in red.
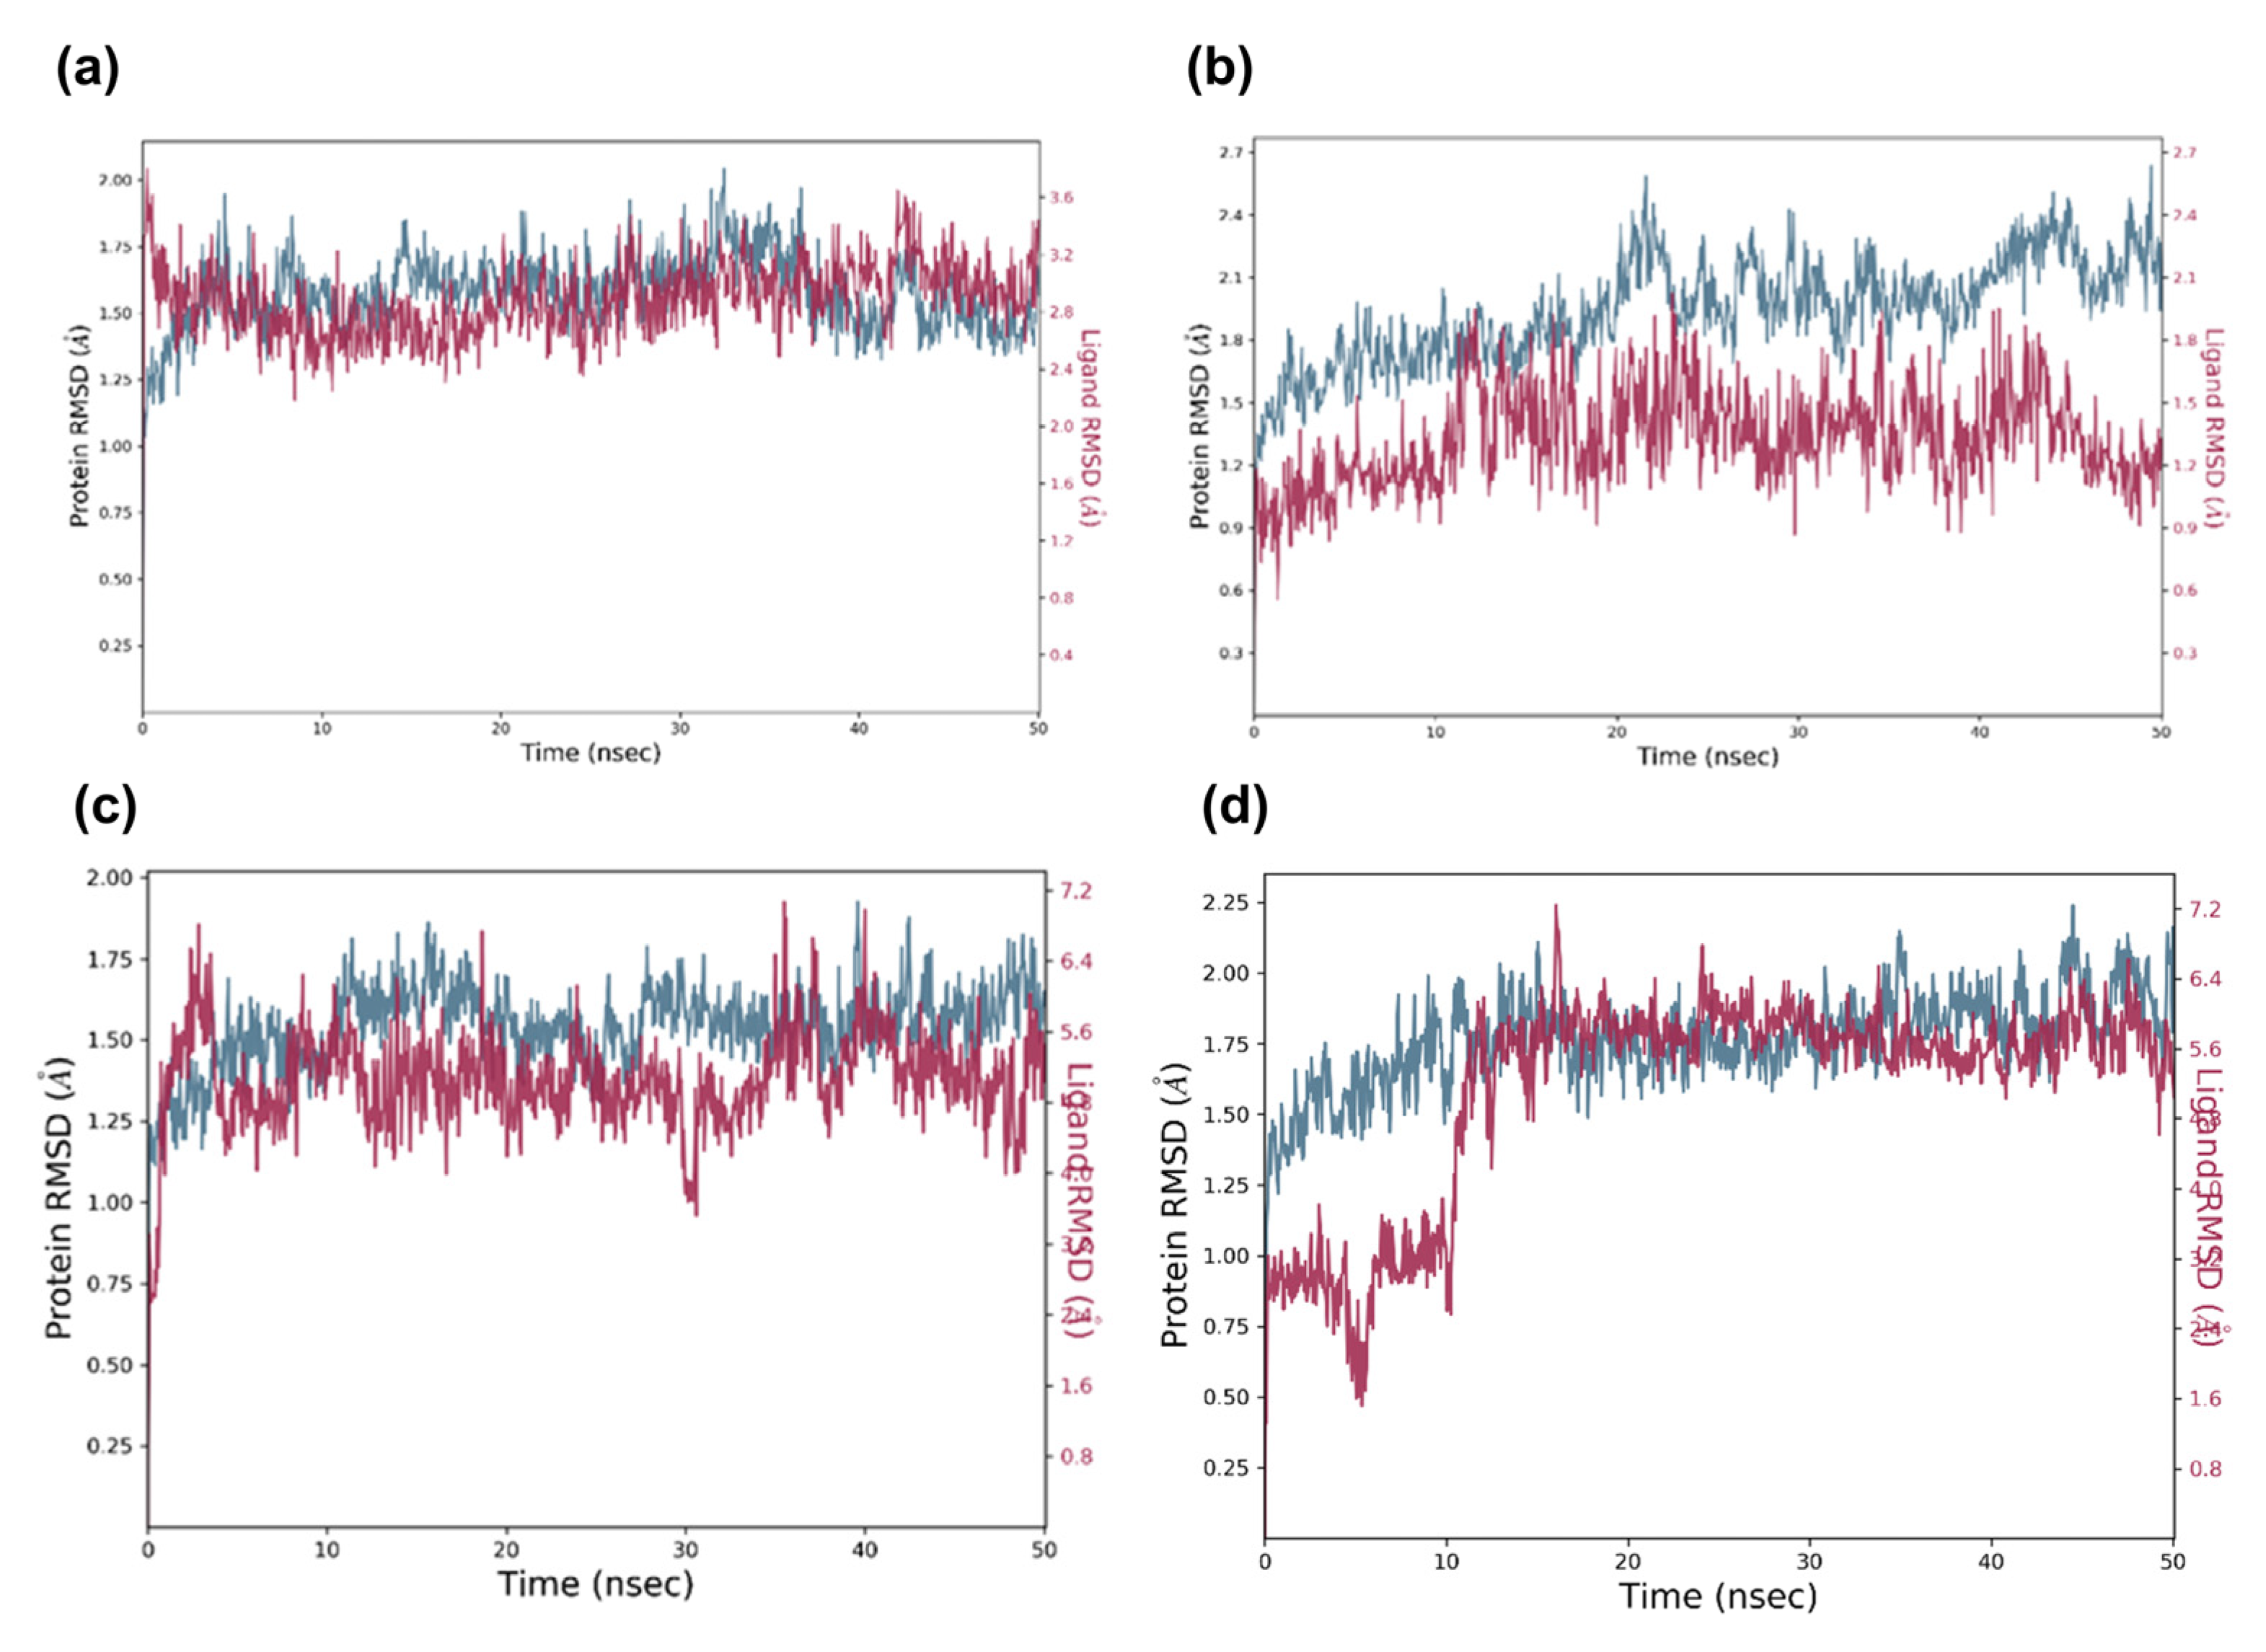
Figure 12.
MD simulation trajectory (50 ns) analysis of the potential docked complexes via RMSD. In the time-dependent RMSD graph, Cα-atoms of aromatase complex with identified potential virtual candidates, i.e., (a) candidate 1, (b) candidate 2, (c) candidate 3, (d) candidate 4. Aromatase Cα-atom RMSD is shown in blue, whereas the RMSD of candidates for aromatase is shown in red.
Figure 13.
ADMET PSA vs. ALogP98 plot for identified compounds demonstrating the 95% and 99% confidence limit ellipses corresponding to the BBB and HIA models. According to the model, the compound should meet the following specifications to achieve optimal cellular permeability: PSA_2D < 140 Å2 and AlogP98 < 5. ADMET: Absorption, distribution, metabolism, excretion, and toxicity, BBB: Blood–brain barrier.
Table 1.
Structure-based pharmacophore model hypothesis with their features and score.
Table 1.
Structure-based pharmacophore model hypothesis with their features and score.
| Pharmacophore Model | No of Features | Feature Set | Selectivity Score | ROC |
|---|
| CDK4/6 | Aromatase | CDK4/6 | Aromatase | CDK4/6 | Aromatase | CDK4/6 | Aromatase |
|---|
| Pharmacophore_01 | 6 | 5 | AAAADHarom | AHHHH | 1.993 | 4.764 | 0.775 | 0.555 |
| Pharmacophore_02 | 6 | 5 | AAAADH | AHHHH | 1.993 | 4.764 | 0.909 | 0.546 |
| Pharmacophore_03 | 6 | 4 | AAAADH | AHHH | 1.993 | 6.347 | 0.790 | 0.600 |
| Pharmacophore_04 | 6 | 4 | AAAADHarom | AHHH | 1.993 | 6.347 | 0.643 | 0.570 |
| Pharmacophore_05 | 6 | 4 | AAAADH | AHHH | 1.993 | 6.347 | 0.903 | 0.679 |
| Pharmacophore_06 | 6 | 4 | AAAADH | AHHH | 1.993 | 6.347 | 0.654 | 0.704 |
| Pharmacophore_07 | 6 | 4 | AAAADHarom | AHHH | 1.993 | 6.347 | 0.792 | 0.593 |
| Pharmacophore_08 | 6 | 4 | AAAADH | AHHH | 1.993 | 6.347 | 0.904 | 0.582 |
| Pharmacophore_09 | 6 | 4 | AAAADH | AHHH | 1.993 | 6.347 | 0.774 | 0.815 |
| Pharmacophore_10 | 6 | 4 | AAAADHarom | AHHH | 1.993 | 6.347 | 0.625 | 0.715 |
Table 2.
Fit value of identified candidates mapped to pharmacophore models.
Table 2.
Fit value of identified candidates mapped to pharmacophore models.
| Sl.no | Compound | Compound ID | Fit Value |
|---|
| Pharmacophore_02 Model | Pharmacophore_09 Model |
|---|
| 1 | Candidate 1 | ZINC77287236 | 0.748 | 1.887 |
| 2 | Candidate 2 | CHEMBL517070 | 3.538 | 3.064 |
| 3 | Candidate 3 | 51000421 | 2.642 | 3.515 |
| 4 | Candidate 4 | ZINC36924410 | 3.060 | 3.383 |
Table 3.
Molecular docking result of identified candidates docked to target CDK6 and aromatase protein.
Table 3.
Molecular docking result of identified candidates docked to target CDK6 and aromatase protein.
| Sl.no | Compound | 5L2S | 3S7S |
|---|
| CDOCKER Energy (kcal/mol) | CDOCKER Interaction Energy (kcal/mol) | CDOCKER Energy (kcal/mol) | CDOCKER Interaction Energy (kcal/mol) |
|---|
| 1 | Candidate1 | −13.04 | −56.37 | 3.892 | −56.27 |
| 2 | Candidate2 | −18.21 | −46.60 | −25.29 | −52.21 |
| 3 | Candidate3 | −31.82 | −35.28 | −28.57 | −32.98 |
| 4 | Candidate4 | −30.69 | −32.07 | −30.35 | −31.16 |
| 5 | Abemaciclib | −27.35 | −58.02 | - | - |
| 6 | Exemestane | - | - | −22.01 | −39.15 |
Table 4.
In silico ADMET profile and mutagenic prediction of the identified candidate compounds.
Table 4.
In silico ADMET profile and mutagenic prediction of the identified candidate compounds.
| Compound | Absorption | Solubility | a BBB | b PPB | c CYP2D6 | Hepatotoxicity | AMES Mutagenicity | AlogP98 | d PSA-2D |
|---|
| Candidate 1 | 0 | 3 | 4 | True | False | True | NM | 1.034 | 123.8 |
| Candidate 2 | 3 | 2 | 4 | False | False | True | NM | 0.434 | 185.8 |
| Candidate 3 | 0 | 3 | 3 | True | False | True | NM | 0.552 | 82.35 |
| Candidate 4 | 0 | 3 | 3 | True | False | True | NM | 0.175 | 82.35 |
Table 5.
HOMO and LUMO values calculated for identified candidates.
Table 5.
HOMO and LUMO values calculated for identified candidates.
| Sl.no | Compound | HUMO | LUMO | Energy Gap (ΔE) |
|---|
| 1 | Candidate 1 | −0.128 | −0.075 | 0.053 |
| 2 | Candidate 2 | −0.231 | −0.094 | 0.137 |
| 3 | Candidate 3 | −0.192 | −0.056 | 0.136 |
| 4 | Candidate 4 | −0.187 | −0.061 | 0.126 |
Table 6.
DS 2019 guidelines for ADMET-related descriptors and mutagenicity prediction.
Table 6.
DS 2019 guidelines for ADMET-related descriptors and mutagenicity prediction.
| ADMET Descriptor | Level | Description |
|---|
| Absorption | 0 | Good absorption |
| 1 | Moderate absorption |
| 2 | Low absorption |
| 3 | Very low absorption |
| Solubility | 0 | Extremely low |
| 1 | Very low, but possible |
| 2 | Yes, low |
| 3 | Yes, good |
| 4 | Yes, optimal |
| 5 | No, too soluble |
| 6 | Unknown |
| BBB a | 0 | Very high |
| 1 | High |
| 2 | Medium |
| 3 | Low |
| 4 | Undefined |
| 5 | Unknown |
| PPB b | 0 (False) | Binding is <90% |
| 1 (True) | Binding is ≥90% |
| CYP2D6 c | 0 (False) | Non-inhibitor |
| 1 (True) | Inhibitor |
| Hepatotoxicity | 0 (False) | Non-hepatotoxic |
| 1 (True) | Toxic |
| AMES Mutagenicity | 0 (False) | Non-mutagen |
| 1 (True) | Mutagen |

 ,
, 


