
Identification of Differential Compositions of Aqueous Extracts of Cinnamomi Ramulus and Cinnamomi Cortex

Abstract
:1. Introduction
2. Results and Discussion
2.1. Optimization of the LC-MS Conditions
2.2. Identification of the Constituents of CR and CC
2.2.1. Identification of Phenylpropanoids and Phenolic Acids

| NO. | Name | RT | Formula | Calc. MW | Error (ppm) | Theoretical Mass (m/z) | Experimental Mass (m/z) | MS2 (m/z) | Total Score (%) a | Ref. | Source b |
|---|---|---|---|---|---|---|---|---|---|---|---|
| 1 | Gentisic acid-5-O-glucoside | 3.15 | C13H16O9 | 316.0781 | −0.50 | 315.0711 [M − H]− | 315.0709 [M − H]− | 270.8695 [M − COOH + H]+ 165.0183, 153.0185 [M − C6H10O5 + H]+, 152.0108, 113.0240, 109.0293 [M − C6H10O5 − COOH + H]+, 108.0211 | 91.2 | [27] | |
| 2 | Isovanillic acid | 3.22 | C8H8O4 | 168.0415 | 1.88 | 167.0339 [M − H]− | 167.0342 [M − H]− | 152.0116 [M − CH3 − H]−, 151.0226 [M − OH]−, 123.0449 [M − COOH − H]−, 108.0217 [M − COOH − CH − H]− | [28,29,30] | CR, C. cassia leaves | |
| 3 | Gentisic acid | 3.30 | C7H6O4 | 154.0257 | 3.04 | 153.0182 [M − H]− | 153.0187 [M − H]− | 153.0187, 135.0182 [M − H2O + H]+, 109.0288 [M − COOH + H]+, 85.0289, 81.0343 [M − COOH − CO + H]+, 68.9978 | 96.6 | [31,32] | C. cassia |
| 4 | Syringic acid | 3.65 | C9H10O5 | 198.0527 | −4.53 | 199.0601 [M + H]+ | 199.0588 [M + H]+ | 181.0495 [M − OH + H]+, 163.1478 [M − 2H2O + H]+, 155.0166, 153.0764 [M − OH − OCH3 + H]+, 95.0492 | 75.3 | [31] | CR, CC, C. cassia leaves |
| 5 | Catechol | 3.80 | C6H6O2 | 110.0363 | 4.05 | 109.0284 [M − H]− | 109.0291 [M − H]− | 108.0215 [M − 2H]−, 93.7792 [M − OH − H]−, 81.6772 | 97.4 | [33] | CR |
| 6 | Neochlorogenic acid | 4.40 | C16H18O9 | 354.0936 | −4.21 | 353.0892 [M − H]− | 353.0886 [M − H]− | 191.0550 [M − C9H6O3 − H]−, 179.0343 [M − C7H10O5 − H]−, 161.0237 [M − C7H10O5 − H2O − H]−, 135.0445 [M − C7H10O5 − CO2 − H]−, 111.0446 | [34] | CR, CC | |
| 7 | Salicylic acid | 5.38 | C7H6O3 | 138.0311 | 3.50 | 137.0233 [M − H]− | 137.0238 [M − H]− | 119.0132 [M − H2O − H]−, 108.8992 [M − CO − H]−, 93.0343 [M − COO − H]− | 62.9 | [31,35] | CR, CC |
| 8 | Citrinin | 5.40 | C13H14O5 | 250.0840 | −0.46 | 251.0916 [M + H]+ | 251.0915 [M + H]+ | 233.0804 [M − H2O + H]+, 221.0807 [M − 2CH3 + H]+, 205.0857 [M − H2O − CO + H]+, 204.0785, 191.0701 | 75.5 | ||
| 9 | 4-Methoxy benzaldehyde | 6.30 | C8H8O2 | 136.0523 | −0.77 | 137.0597 [M + H]+ | 137.0596 [M + H]+ | 122.0362 [M − CH3 + H]+, 107.0490 [M − OCH2 + H]+, 93.0590 [M − CO − CH3 + H]+, 91.0543, 81.0698, 79.0543 [M − CO − OCH3 + H]+ | 81.9 | [28,36] | CR, CC, C. cassia leaves |
| 10 | Darendoside A | 6.32 | C19H28O11 | 432.1613 | −2.29 | 431.1547 [M − H]− | 431.1538 [M − H]− | 191.0547, 161.0446, 149.0447,113.0245, 99.0081, 89.0244 | 67.5 | ||
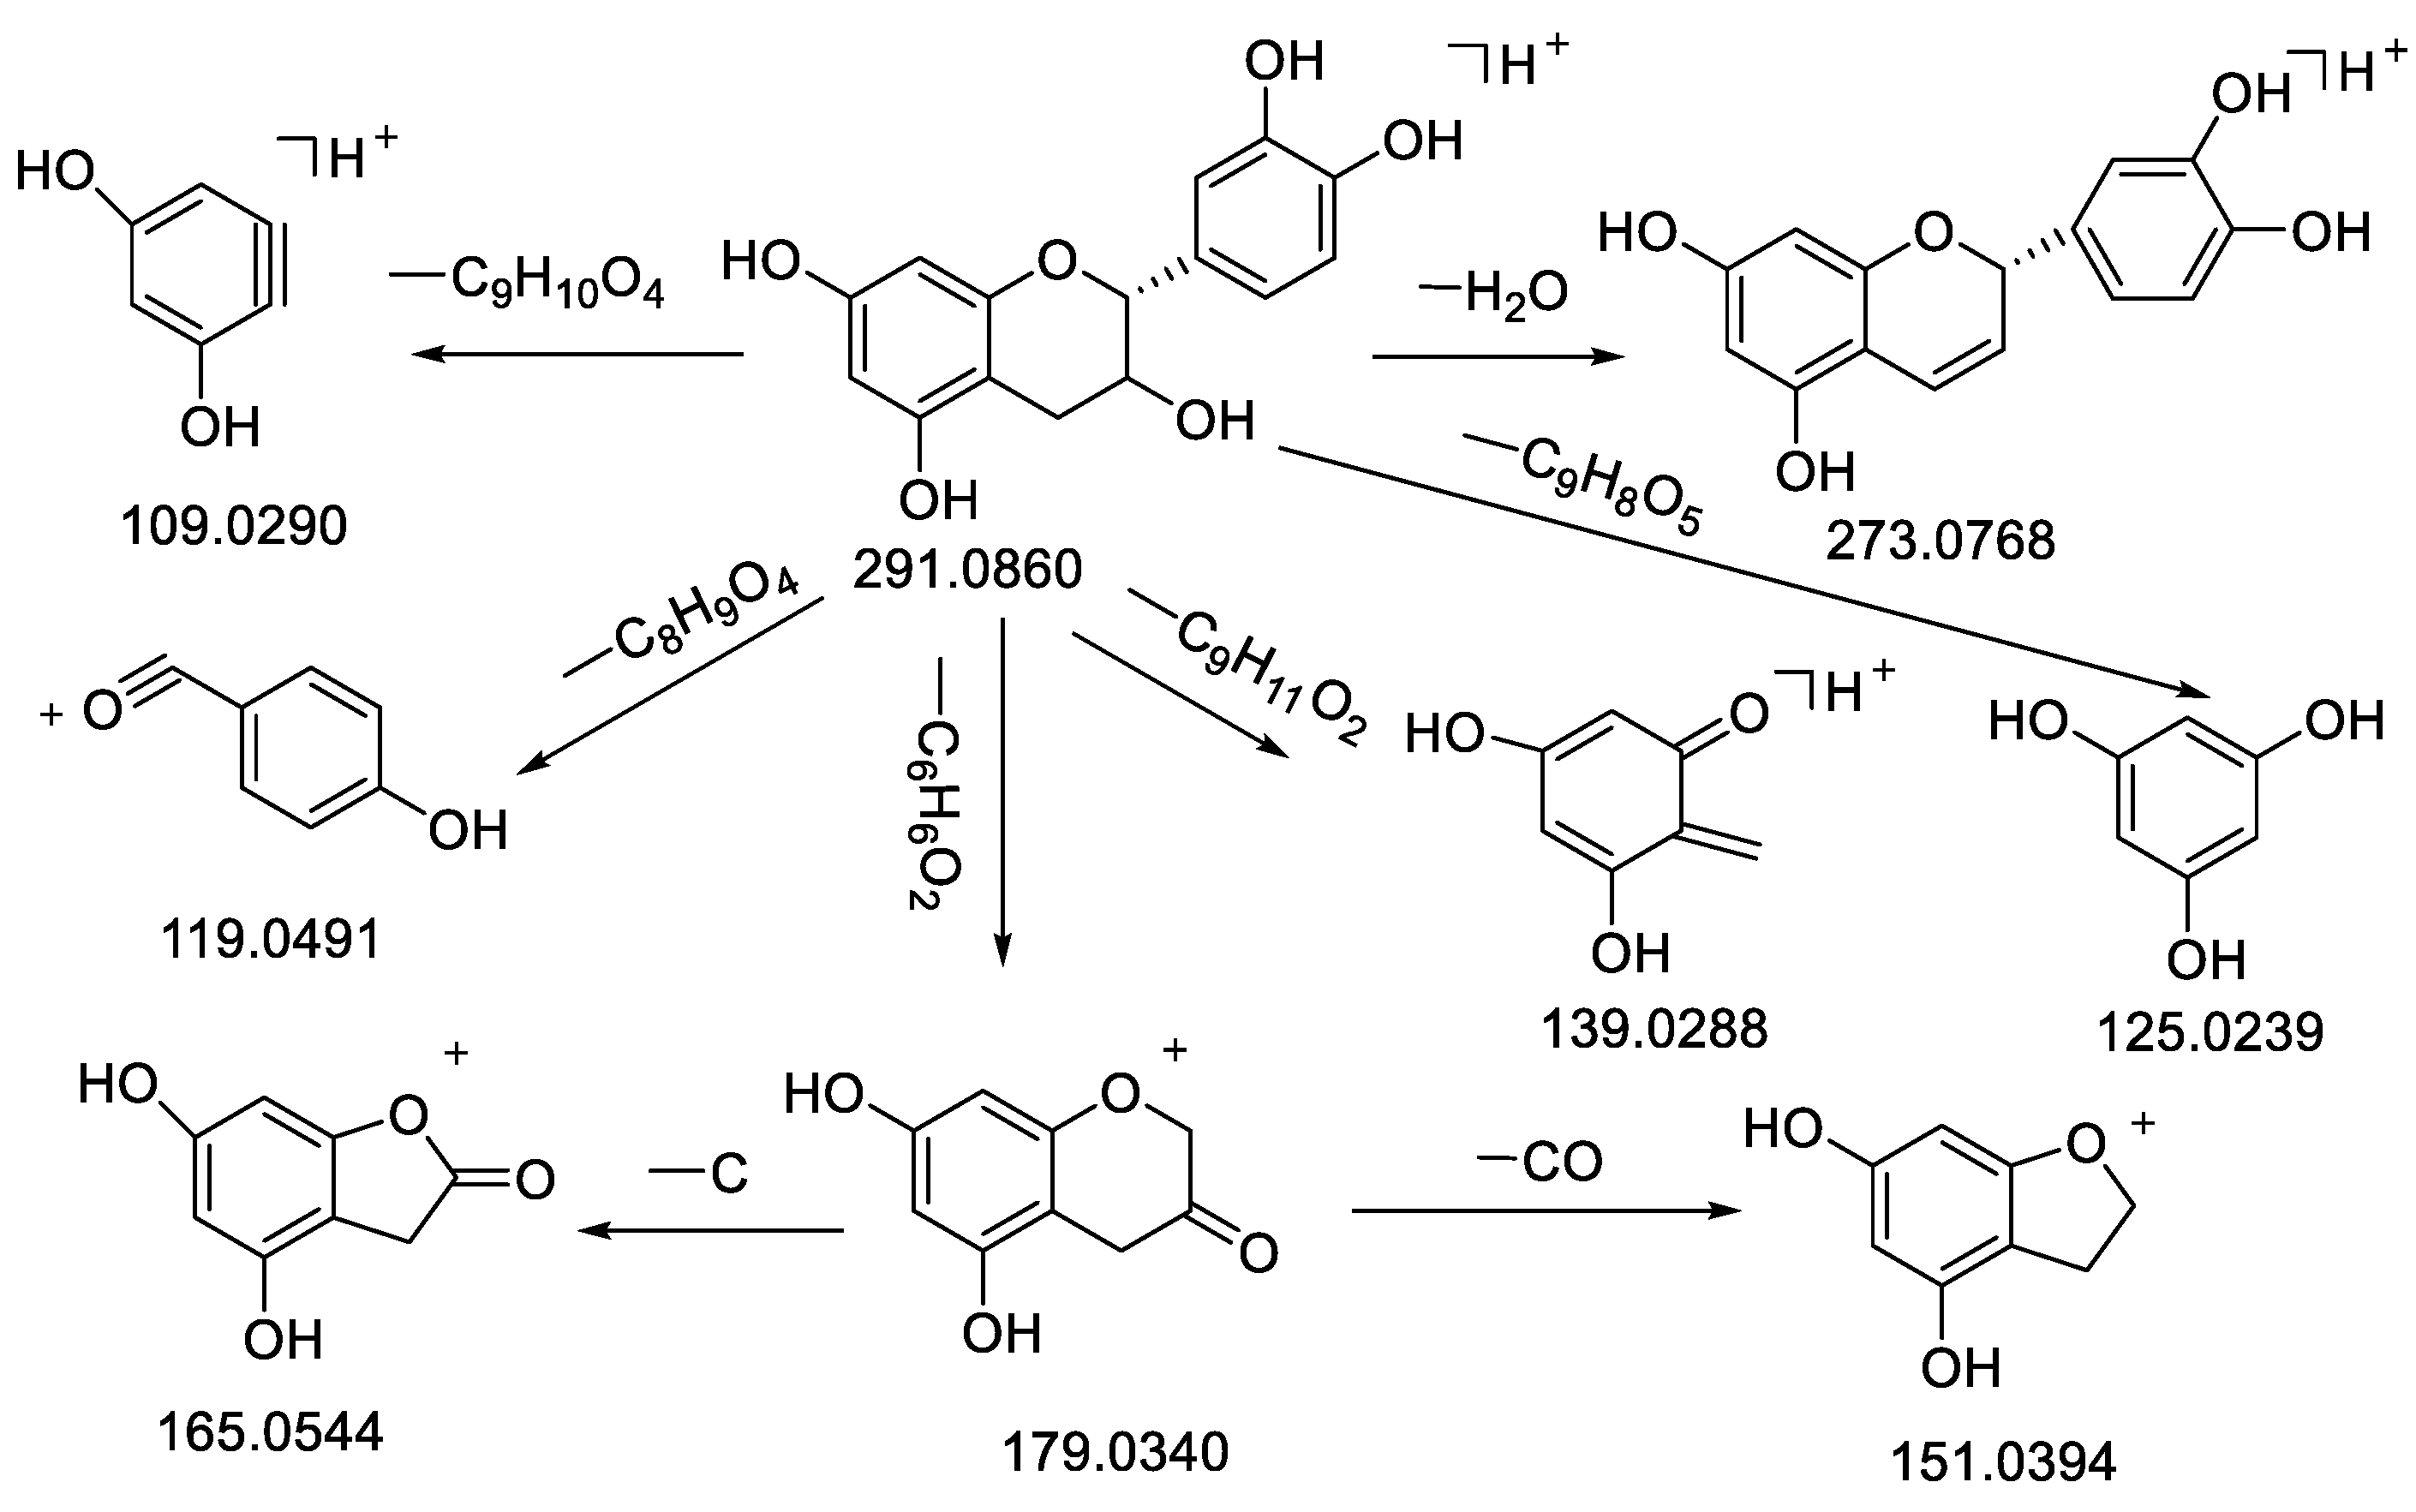
| 11 | Epicatechin | 8.41 | C15H14O6 | 290.0788 | −1.08 | 291.0863 [M + H]+ | 291.0860 [M + H]+ | 273.0768 [M − H2O + H]+, 249.0766, 179.0340 [M−C6H6O2+H] +, 165.0544 [M − C6H6O2 − CH2 + H]+, 151.0394, 139.0388 [M − C9H11O2 + H]+,125.0239 [M − C9H8O3 + H]+, 123.0439, 119.0491, 109.0290 [M − C9H10O4 + H]+, 95.0490 | 99.4 | Standard, [37] | CR |
| 12 | 2,4,6-Trihydroxy-2-(4-hydroxybenzyl)-1-benzofuran-3(2H)-one | 8.68 | C15H12O6 | 288.0621 | −4.34 | 287.0521 [M − H]− | 287.0511 [M − H]− | 161.0233 [M − C6H6O3 − H]−, 131.2500, 125.0239 [M − C8H2O4 − H]− | 88.7 | ||
| 13 | Dihydrophaseic acid | 8.75 | C15H22O5 | 282.1454 | −0.53 | 281.1383 [M − H]− | 281.1382 [M − H]− | 237.1486 [M − CHO − H]−, 201.1273 [M − CHO − H2O − OH − H]−, 189.1278, 171.1171, 139.0758 | 76.8 | ||
| 14 | Catechin | 8.83 | C15H14O6 | 290.0777 | −1.26 | 289.0707 [M − H]− | 289.0703 [M − H]− | 289.0703 [M − H2O − H]−, 271.0603, 245.08081, 203.07036, 151.0393, 125.0239, 109.0290 | [35] | CC | |
| 15 | Vanillin | 9.28 | C8H8O3 | 152.0472 | −0.82 | 153.0548 [M + H]+ | 153.0545 [M + H]+ | 153.0545, 125.0595 [M − CO + H]+, 111.0441, 93.0333, 65.0387 | 90.7 | [28,31,38] | C. cassia leaves |
| 16 | 4-Acetyl-3-hydroxy-5-methylphenyl-β-D-glucopyranoside | 10.08 | C15H20O8 | 328.1144 | −1.05 | 327.1074 [M − H]− | 327.1071 [M − H]− | 165.0547 [M − C6H10O5 − H]−, 147.0446 [M − C6H10O5 − H2O − H]−, 121.0653 [M − C6H10O5 − OH − CH3 − CH2 − OH]−, 106.0416 | 91.7 | [27] | |
| 17 | Picconioside B | 10.95 | C26H40O12 | 544.2500 | −3.66 | 543.2438 [M − H]− | 543.2421 [M − H]− | 525.2305 [M − H2O − H]−, 363.1800 [M − H2O − C6H10O5 − H]−, 381.1912, 167.1070, 165.0922, 101.0240, 89.0240, 59.0136 | 91.2 | ||
| 18 | 2 Methoxybenzoic acid | 12.68 | C8H8O3 | 152.0472 | −0.92 | 153.0546 [M + H]+ | 153.0545 [M + H]+ | 153.0545, 135.0439, 111.0440, 105.0441, 95.0491 [M − CO2 − CH2 + H]+, 93.0699, 79.0541 | 96.3 | [39,40] | CR |
| 19 | Taxifolin | 13.79 | C15H12O7 | 304.0581 | 2.03 | 305.0656 [M + H]+ | 305.0662 [M + H]+ | 287.0573 [M − H2O + H]+, 259.0591 [M − CO − H2O + H]+, 231.0652, 153.0188 [M − CO − C7H8O2 + H]+, 149.0230 | 91.1 | Standard, [12,41] | CR |
| 20 | Lyoniresinol-3a-O-β-D-glucopyranosid | 13.89 | C28H38O13 | 582.2289 | −4.09 | 581.2230 [M − H]− | 581.2209 [M − H]− | 566.1975, 535.1785, 419.1691 [M − C6H10O5 − H]−, 404.1459, 373.1275 [M − C6H10O5 − 3CH3 − H]−, 359.1110 [M − C6H10O5 − 4CH3 − H]−, 233.0812, 202.0624, 153.0549, 138.0316 [M − C6H10O5 − OH − C14H18O6 − H]−, 101.0238 | 92.3 | [33,42,43] | CC |
| 21 | 4-Ethylphenol | 14.12 | C8H10O | 122.0726 | 4.32 | 121.0649 [M − H]− | 121.0654 [M − H]− | 106.0419 [M − CH3 − H]−, 90.9232 [M − CH3 − O − H]−, 61.9880 | 87.9 | [44,45] | C. cassia |
| 22 | (−)-Lyoniresinol | 14.19 | C22H28O8 | 420.1766 | −1.53 | 419.1700 [M − H]− | 419.1694 [M − H]− | 373.1277 [M − 3CH3 − H]−,359.1119 [M −4 CH3 − H]−, 313.0712, 221.0801, 180.0404, 139.0396, 134.0383 | 96.0 | [33] | |
| 23 | Lyoniside | 14.33 | C27H36O12 | 552.2186 | −3.79 | 551.2123 [M − H]− | 551.2105 [M − H]− | 536.1875, 419.1650, 389.1591, 374.1359, 373.1275 [M − C6H10O5 − 3CH3 − H]−, 359.1105 [M−C6H10O5−4CH3−H]−, 341.1013, 325.1092, 233.0823, 119.0345, 113.0239 | 91.8 | [33] | |
| 24 | 3-Oxoindane-1-carboxylic acid | 14.41 | C10H8O3 | 176.0472 | −0.69 | 177.0546 [M + H]+ | 177.0545 [M + H]+ | 153.9367, 149.0596 [M−CO+H] +, 133.0646 [M−COO+H] +, 131.0490, 121.1010, 107.0490, 105.0693 [M − CO − COO + H]+, 93.0098 [M − CO − COO − C + H]+, 81.0700 [M − CO − COO − 2C + H]+ | 72.2 | ||
| 25 | 3-Methoxy phenylacetic acid | 14.52 | C9H10O3 | 166.0622 | 1.69 | 165.0546 [M − H]− | 165.0549 [M − H]− | 147.0443, 136.9315 [M − OCH3 − H]−, 121.0654, 106.0419, 96.9597 [M − C2H3O2 − H]− | [39] | ||
| 26 | 2-(4-Hydroxyphenyl)-7-((3,4,5-trihydroxy-6-(hydroxymethyl) tetrahydro-2H-pyran-2-yl) oxy) chroman-4-one | 14.53 | C21H22O9 | 418.1248 | −0.74 | 417.1180 [M − H]− | 417.1177 [M − H]− | 301.0338 [M − C6H10O5 − H]−, 255.0651, 153.0187 [M − C6H10O5 − CO − C7H6O2 − H]−, 135.0082 [M − C6H10O5 − CO − C7H6O2 − H2O − H]−, 119.0497, 91.0184 | 67.5 | [12] | |
| 27 | Quercetin-3β-D-glucoside | 14.55 | C21H20O12 | 464.0936 | 0.21 | 463.0871 [M − H]− | 463.0872 [M − H]− | 301.0338 [M − H − C6H10O5]−, 300.0270, 271.0247 | [34] | ||
| 28 | 2-[1-(2H-1,3-Benzodiox ol-5-yl) propan-2-yl]-6-metho xy-4-(prop-2-en-1-yl) phenol | 14.74 | C20H22O4 | 326.1516 | 0.63 | 327.1590 [M + H]+ | 327.1593 [M + H]+ | 312.1348, 295.1328 [M − OCH2 + H]+, 280.1095, 263.1071, 251.0001, 235.1122, 175.0758, 163.0753 [M − C10H12O2 + H]+, 151.075, 137.0596, 133.0647, 103.0540, 98.9841 | 71.6 | ||
| 29 | Cinnamylalcohol-6′-O-α-furanara- binose-O-β-glucopyranoside | 14.81 | C20H28O10 | 428.1664 | −4.38 | 427.1598 [M − H]− | 427.1582 [M − H]− | 293.0861, 233.0650, 191.0549, 161.0451, 149.0448, 125.0239, 89.0240, 81.0344, 59.0136 | 85.9 | [46] | CR |
| 30 | 6-Methoxymellein | 14.99 | C11H12O4 | 208.0734 | −0.55 | 209.0804 [M + H]+ | 209.0802 [M + H]+ | 191.0701, 181.0847, 177.0544, 163.0765, 149.0596 [M − COOCH + H]+, 131.0486, 121.0647 [M − 2OH − OCH3 − CO + H]+, 109.0647, 103.0540, 93.0698, 91.0540, 55.0177 | 85.8 | . | |
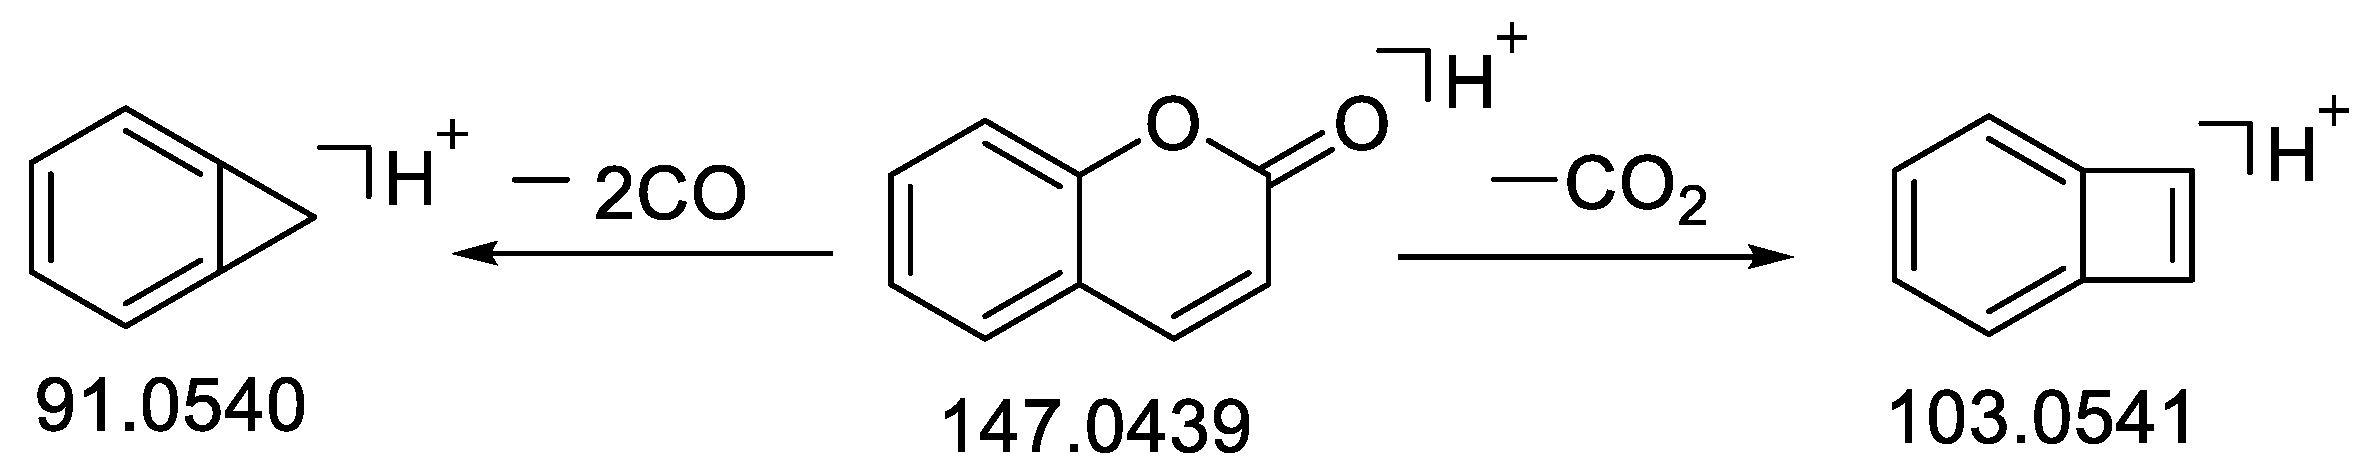
| 31 | Coumarin | 15.18 | C9H6O2 | 146.0366 | −1.33 | 147.0441 [M + H]+ | 147.0439 [M + H]+ | 127.0543, 103.0541 [M − CO2 + H]+, 91.0540 [M − 2CO + H]+, 43.0242 | 96.8 | Standard, [46] | CR, CC, C. cassia leaves |
| 32 | Quercetin | 15.36 | C15H10O7 | 302.0424 | −0.98 | 303.0499 [M + H]+ | 303.0496 [M + H]+ | 303.0496, 275.0399 [M − CO + H]+, 257.0446 [M − CO − H2O + H]+, 247.0590, 229.0491 [M − 2CO − H2O + H]+, 199.0434 [M − 3CO − H2O + H]+, 165.0178, 163.0389, 153.0183 [M − CO − C7H6O2 + H]+, 133.0231 [M − CO − C7H4O2 − H2O + H]+, 121.0297, 111.0075 | 99.8 | [29,35] | CR |
| 33 | Quercitrin | 15.36 | C21H20O11 | 448.1003 | −0.58 | 449.1089 [M + H]+ | 449.1087 [M + H]+ | 431.0983, 369.0594, 345.0606, 315.0494, 303.0497 [M + H − C6H9O4]+, 257.0439 [M − C6H9O4 − CO − H2O + H] +, 229.0492 [M − C6H9O4 − 2CO − H2O + H]+, 129.0548, 85.0283, 71.0490 | 82.8 | Standard | |
| 34 | Graveobioside A | 15.36 | C26H28O15 | 580.1402 | −4.46 | 579.1344 [M − H]− | 579.1325 [M − H]− | 476.1080, 417.1531 [M − C6H10O5 − H]−, 300.0259 [M − C6H8O4 − C5H10O4 − H]−, 271.0235 [M − C11H16O10 − H]−, 178.9979 [M − C17H20O11 − H]− | 85.3 | ||
| 35 | Libertellenone B | 15.74 | C20H26O4 | 330.1830 | −0.32 | 331.1903 [M + H]+ | 331.1902 [M + H]+ | 313.1796 [M − H2O + H]+, 295.1676, 271.1686, 243.1763, 165.0911, 125.0565 [M − C12H14O3 + H]+ | 75.2 | ||
| 36 | Yucalexin P-17 | 16.06 | C17H20O3 | 272.1412 | 0.27 | 273.1485 [M + H]+ | 273.1488 [M + H]+ | 255.1391 [M − H2O + H]+, 245.1534, 227.1441 [M − H2O − CO + H]+, 203.1070, 149.0964 [M − CH3 − C6H6O2 + H] +, 82.8045 [M − C11H10O3 + H]+ | 86.6 | ||
| 37 | Azelaic acid | 16.24 | C9H16O4 | 188.1040 | 0.12 | 187.0965 [M − H]− | 187.0966 [M − H]− | 169.0861, 143.1072, 125.0966 [M − COOH − OH − H]−, 123.0811, 97.0654 [M − 2COOH − H]−, 57.0343 | 95.4 | [15,47] | CR |
| 38 | Kaempferol | 16.27 | C15H10O6 | 286.0475 | −0.89 | 287.0550 [M + H]+ | 287.0548 [M + H]+ | 287.0548, 258.0511 [M − CO + H]+, 183.0288, 165.0183, 153.0189 [M − CO − C7H6O + H]+, 133.0292,121.0281 | 99.2 | [35] | CR, CC, C. cassia leaves |
| 39 | 1-(Carboxymethyl) cyclohexane carboxylic acid | 16.36 | C9H14O4 | 186.0884 | 1.06 | 185.0808 [M − H]− | 185.0819 [M − H]− | 141.0916 [M − COO − H]−, 104.0775 [M − C6H9 − H]− | 87.2 | ||
| 40 | Kaempferol-3-O-α-L-arabinopyranosyl-7-O-α-L-rhamnopyranoside | 16.64 | C26H28O14 | 564.1456 | −4.12 | 563.1393 [M − H]− | 563.1384 [M − H]− | 435.2045, 285.0416 [M − C6H8O4 − C5H10O4 − H]−, 284.0316, 255.0286, 147.5166, 70.7867 | [48] | ||
| 41 | 2-Methoxy benzaldehyde | 16.67 | C8H8O2 | 136.0522 | −0.16 | 137.0597 [M + H]+ | 137.0596 [M + H]+ | 109.0647, 107.0490 [M − OCH2 + H]+, 93.0698 [M − CO − CH3 + H]+, 81.0697, 79.0512 [M − CO − OCH3 + H]+ | 90.9 | [28] | CR, C. cassia leaves |
| 42 | Cinnamyl alcohol | 17.22 | C9H10O | 134.0726 | −0.89 | 117.0698 [M + H − H2O]+ | 117.0696 [M + H − H2O]+ | 117.0696 [M − H2O + H]+, 91.0540 [M − C2H4O + H] 78.2648 [M − C3H5O + H]+, 63.4672, 49.4958 | standard | CR, CC, C. cassia leaves | |
| 43 | 4-Methylumbelliferyl-α-D-glucopyranoside | 17.37 | C16H18O8 | 338.1002 | 0.21 | 339.1074 [M + H]+ | 339.1075 [M + H]+ | 321.0970 [M − OH + H]+, 177.0546 [M − C6H10O5 + H]+, 145.0284 [M − C6H10O5 − CH3 − OH + H]+, 127.0389 [M − C6H10O 5− CH3 − OH + H]+, 97.0280 | 94.6 | ||
| 44 | (±)-Abscisic acid | 17.55 | C15H20O4 | 264.1359 | −0.85 | 265.1484 [M + H]+ | 265.1481 [M + H]+ | 247.1332 [M − H2O + H]+, 229.1216 [M − 2H2O + H]+, 187.1108 [M − O − CH2 − COO + H]+ | 90.2 | ||
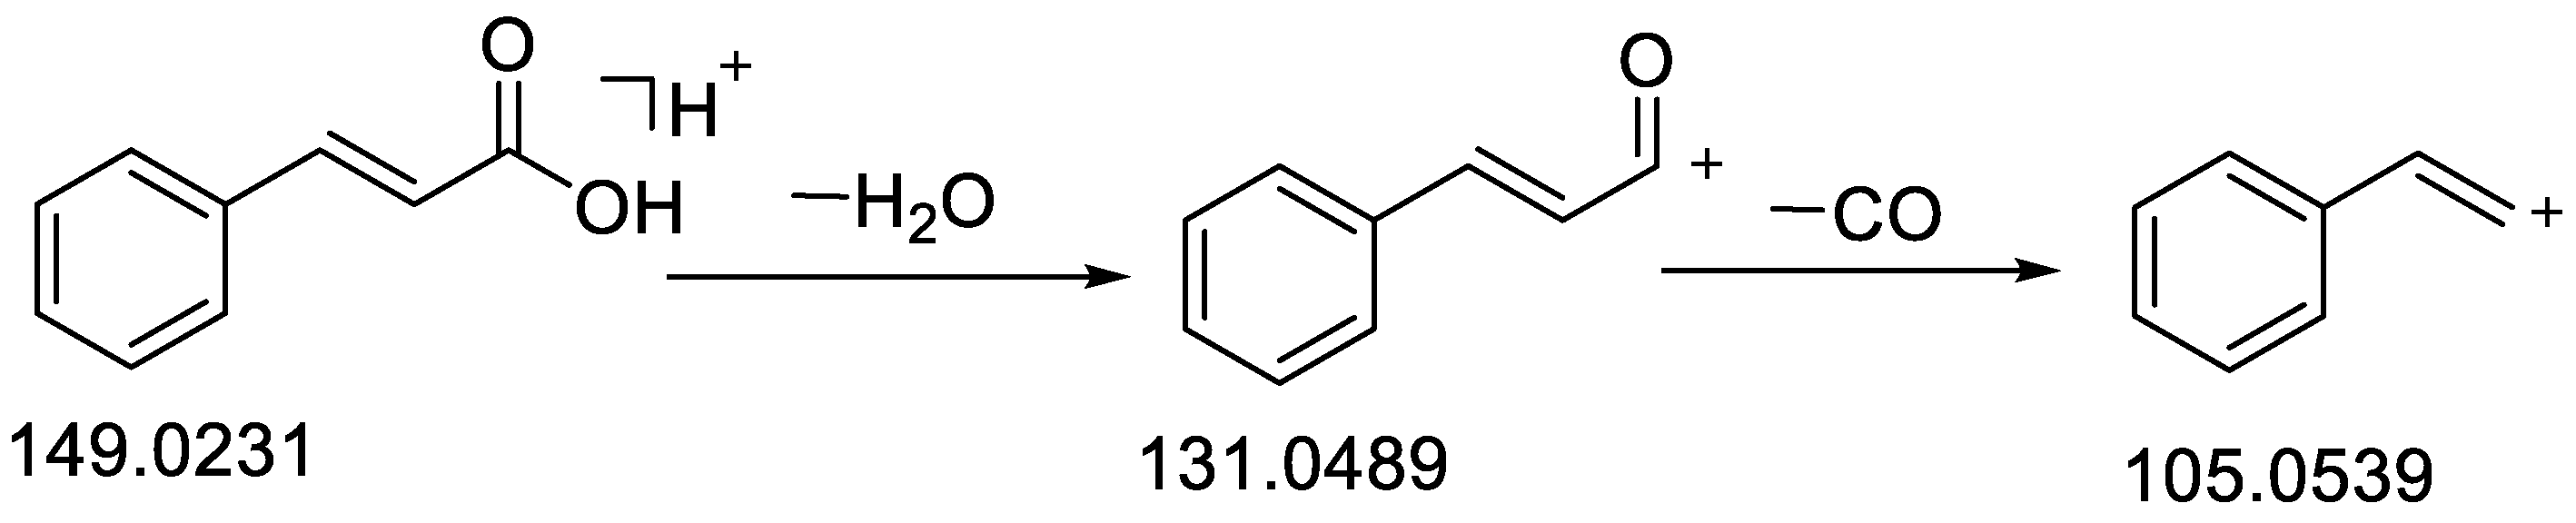
| 45 | trans-Cinnamic acid | 18.16 | C9H8O2 | 148.0518 | −0.60 | 149.0232 [M + H]+ | 149.0231 [M + H]+ | 144.9817, 131.0493 [M − H2O + H]+, 121.0282, 116.9669, 107.0491, 105.0539 [M − CO + H]+, 93.0698, 79.0545 | Standard [28,30] | CR, CC, C. cassia leaves | |
| 46 | 4-Phenyl-3-buten-2-one | 18.31 | C10H10O | 146.0730 | −1.03 | 147.0803 [M + H]+ | 147.0803 [M + H]+ | 132.0567 [M − CH3 + H]+, 129.0699, 119.0854, 117.0698, 107.0489 [M − CH − CO + H]+, 91.0541 [M − C3H4O + H]+, 79.0542 | 95.3 | [32,49] | C. verum |
| 47 | 3-Tert-butyladipic acid | 18.32 | C10H18O4 | 202.1196 | −1.36 | 201.1121 [M − H]− | 201.1120 [M − H]− | 183.1021 [M − OH − H]−, 156.8982 [M − COO − H]−, 139.1124 | 70.0 | [30] | |
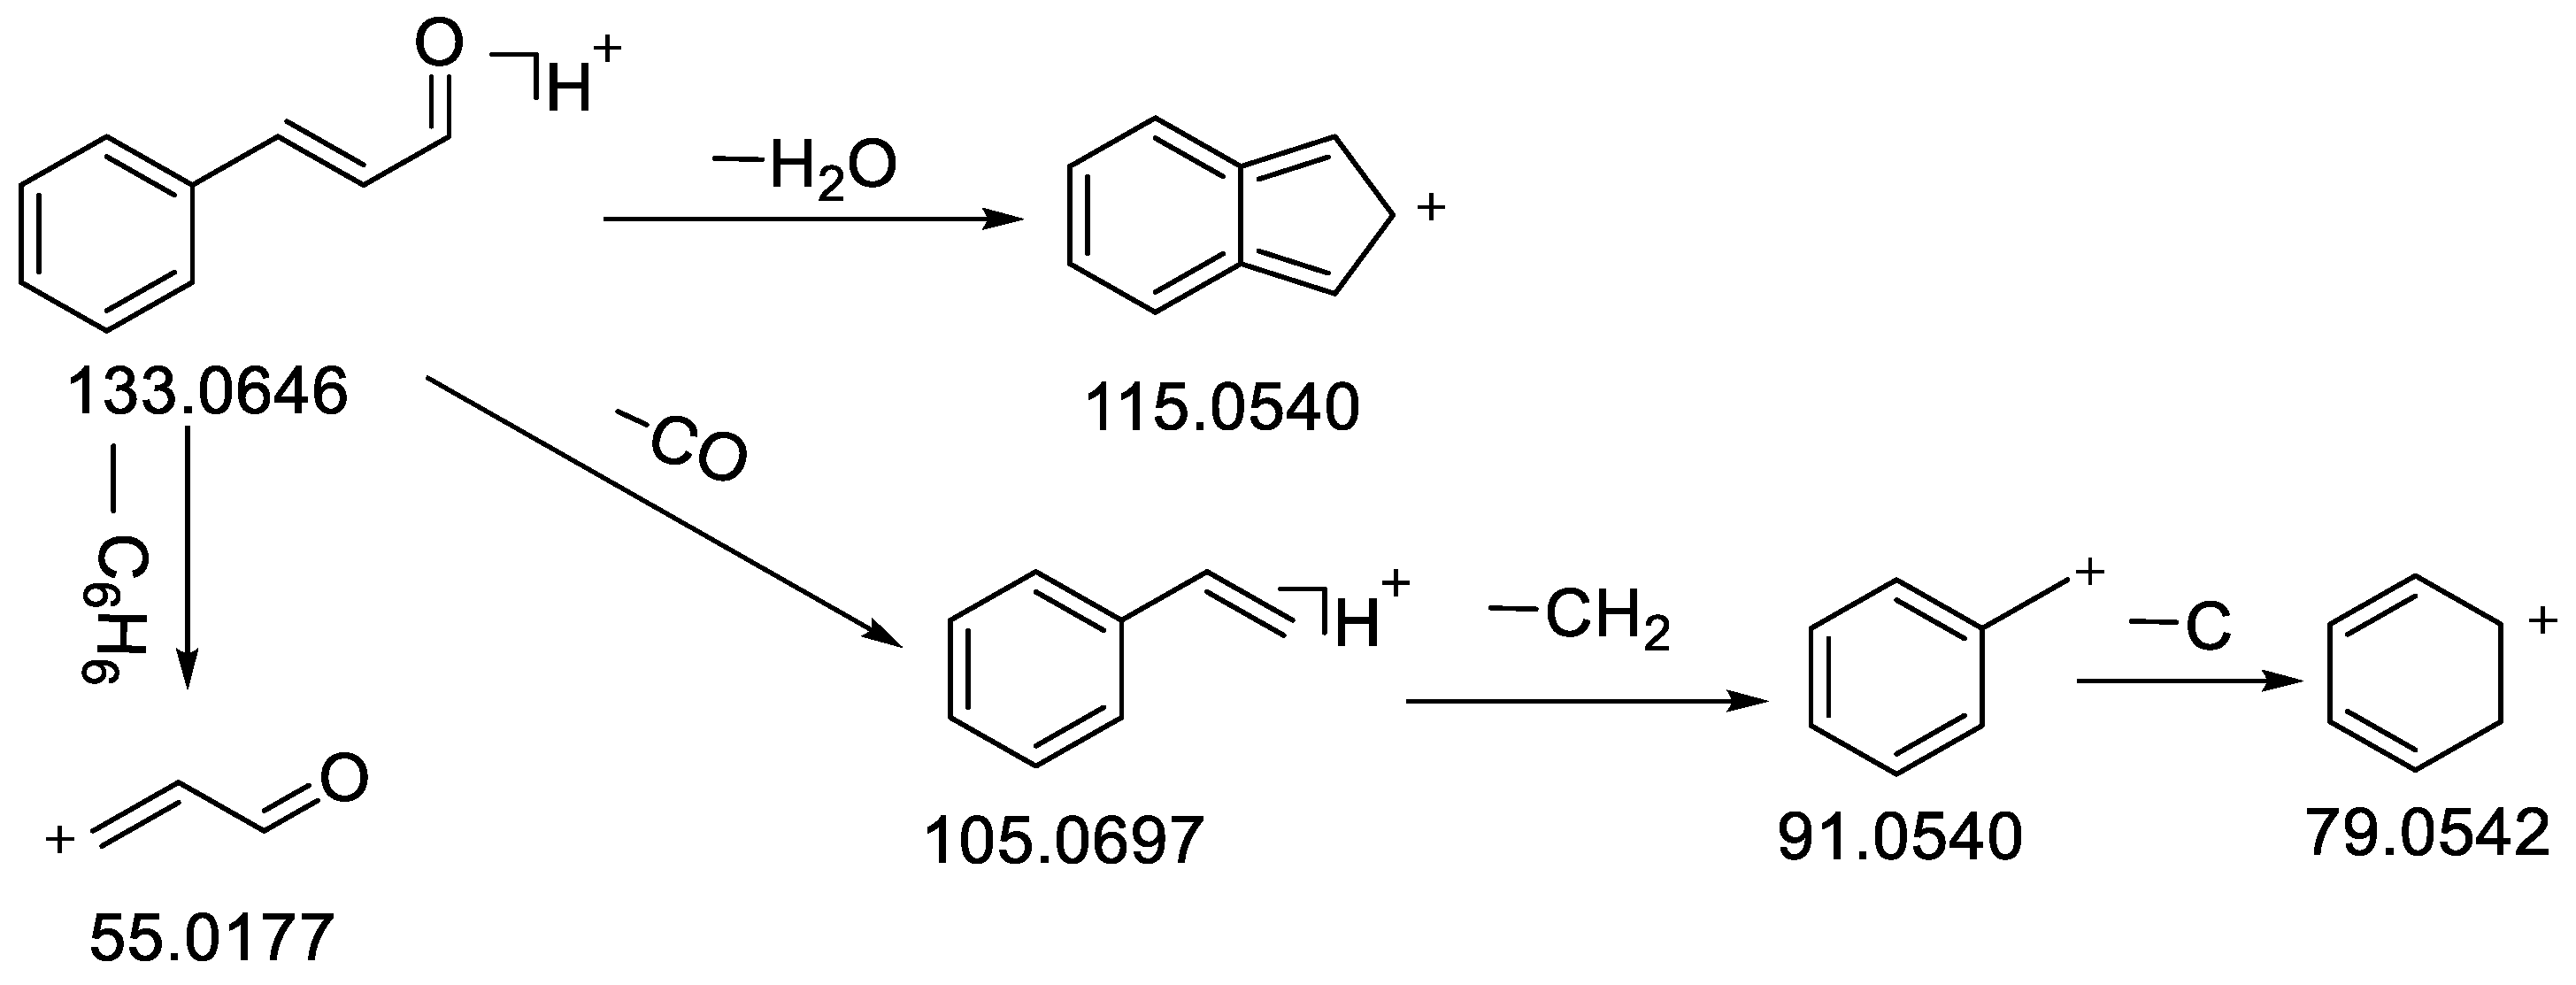
| 48 | trans-Cinnamaldehyde | 18.84 | C9H8O | 132.0573 | −0.19 | 133.0647 [M + H]+ | 133.0646 [M + H]+ | 115.0540 [M − H2O + H]+, 105.0697 [M − CO + H]+, 103.0542, 91.0541 [M − CO − CH2 + H]+, 79.0542 [M − CO − C2H2 + H]+, 55.0178 [M − C6H6 + H]+ | 97.9 | Standard, [30] | CR, CC |
| 49 | 2-Methoxycinnamic acid | 19.54 | C10H10O3 | 178.0629 | −0.51 | 161.0597 [M + H − H2O]+ | 161.0596 [M + H − H2O]+ | 146.0366, 133.1011 [M − H2O − CO + H]+, 119.0855 [M − CHO − OCH3 + H]+, 105.0698 [M − COOH − CH + H] +, 91.0544 [M − CO − CH2 − OCH3 + H]+ | Standard, [30] | CR, CC, C. cassia leaves | |
| 50 | 9S,13R-12-Oxophytodienoic acid | 20.08 | C18H28O3 | 292.2037 | −0.68 | 293.2111 [M + H]+ | 293.2104 [M + H]+ | 275.2003 [M − H2O + H]+, 257.1893, 239.1799 [M − C4H6 + H]+, 229.1953, 163.1117, 159.1167, 147.1163 [M − C7H14 + H]+, 133.1012, 107.0855, 95.0853, 81.0698 [M − C12H20O3 + H]+, 69.0699 | 91.0 | [50] | |
| 51 | Corchorifatty acid F | 20.43 | C18H32O5 | 328.2237 | −0.10 | 327.2166 [M − H]− | 327.2165 [M − H]− | 309.2062, 291.1955, 242.9845 [M − C5H4 − OH − H]−, 239.1283, 229.1435, 221.1171, 211.1313, 185.1173, 183.1374, 171.101 [M − C9H16O2 − H]−, 137.0968, 97.0655, 85.0290 [M − C13H22O4 − H]−, 57.0343 | [34,51] | ||
| 52 | Deoxyphomalone | 20.47 | C13H18O4 | 238.1204 | −0.29 | 239.1277 [M + H]+ | 239.1275 [M + H]+ | 221.1171, 205.1192 [M − 2OH + H]+, 179.0705 [M − C2H5 − OCH3 + H]+, 174.0678, 163.0750, 151.0753 [M − C2H5 − C3H7O + H]+, 137.0598 [M − 2OH − 2OCH3 − C2H4 − C3H3+H]+, 135.0799, 107.0481, 95.0861 [M − OH − 2OCH3 − C2H5 − C4H3O + H]+, 59.0490 | 74.4 | ||
| 53 | 4-Ethylbenzaldehyde | 20.73 | C9H10O | 134.0730 | −0.14 | 135.0804 [M + H]+ | 135.0803 [M + H]+ | 120.0567, 107.0490 [M − CO + H]+, 105.0697 [M − C2H6 + H]+, 103.0542, 79.0542 [M − C2H6 − CO + H]+ | 92 | [52] | CR |
| 54 | 1-Naphthol | 21.00 | C10H8O | 144.0573 | −0.09 | 145.0648 [M + H]+ | 145.0647 [M + H]+ | 116.0575 [M − C − OH + H]+, 115.0541, 102.0468 [M − C2H2 − OH + H]+, 91.0539 [M − C3H2 − OH + H]+, 84.9598 | 89 | [53,54] | CR |
| 55 | 4-Methoxy cinnamaldehyde | 21.02 | C10H10O2 | 162.0679 | 0.04 | 163.0753 [M + H]+ | 163.0754 [M + H]+ | 145.0650, 135.0805 [M − CO + H]+, 133.0648, 110.0203 [M − C3H3O + H]+, 107.0491, 105.0699 [M − CO − OCH3 + H]+, 91.0542, 79.0542 [M − C3H3O − OCH3 + H]+, 55.0178 | 88.4 | [46] | CR, CC |
| 56 | 9,12,13-Trihydroxy-15-octadecenoic acid | 21.72 | C18H34O5 | 330.2393 | −0.05 | 329.2322 [M − H]− | 329.2322 [M − H]− | 311.2227 [M − H2O −H]−, 293.2102 [M − 2H2O − H]−, 229.1433, 211.1331, 183.1383, 171.1018, 139.1123, 127.1120, 125.0975, 99.0812, 57.0342 | 90.0 | ||
| 57 | (−)-Caryophyllene oxide | 22.32 | C15H24O | 220.1826 | −0.53 | 221.1899 [M + H]+ | 221.1900 [M + H]+ | 203.1795, 175.1483 [M − O − 2CH2 −C + H]+, 161.1323 [M − 2CH3 − CO − CH + H]+, 147.1169 [M − 2CH3 − CO − CH − CH2 + H]+, 133.1010, 119.0855, 95.0855 | 92.9 | [55] | CR, CC, C. cassia leaves |
| 58 | 4-Methoxychalcone | 28.61 | C16H14O2 | 238.0992 | 0.66 | 239.1066 [M + H]+ | 239.1073 [M + H]+ | 221.0961, 193.1012, 178.0875, 161.0595 [M − C6H6 + H]+,133.0647 [M − C7H6O + H]+, 115.054, 105.0333 [M − C6H6 − C2H − OCH3 + H]+ | 86.7 | [56] | C. cassia |
2.2.2. Identification of Flavonoids
2.2.3. Identification of Coumarins
2.3. Statistical Analysis
2.3.1. Principal Component Analysis (PCA)
2.3.2. Orthogonal Partial Least Squares-Discriminant Analysis (OPLS-DA)
2.3.3. Semi-Quantitative Analysis of CR and CC
2.4. Method Validation
2.5. Quantitative Determination of the Major Constituents in CR and CC Using HPLC
2.6. Cluster Analysis
2.7. Molecular Docking
3. Materials and Methods
3.1. Materials and Reagents
3.2. Preparation of Sample Solutions
3.3. Preparation of Reference Solutions
3.4. Chromatography and Mass Spectrometry Conditions
3.4.1. UPLC Method for Qualitative Analysis
3.4.2. UPLC-MS Method for Qualitative Analysis
3.4.3. HPLC Method for Quantitative Analysis
3.4.4. LC-MS Data Processing and Statistics
3.4.5. Molecular Docking
4. Conclusions
Supplementary Materials
Author Contributions
Funding
Institutional Review Board Statement
Informed Consent Statement
Data Availability Statement
Conflicts of Interest
References
- Liu, J.; Zhang, Q.; Li, R.L.; Wei, S.J.; Huang, C.Y.; Gao, Y.X.; Pu, X.F. The traditional uses, phytochemistry, pharmacology and toxicology of Cinnamomi ramulus: A review. J. Pharm. Pharmacol. 2020, 72, 319–342. [Google Scholar] [CrossRef] [Green Version]
- Xiang, H.J.; Zhang, L.S.; Song, J.N.; Fan, B.; Nie, Y.L.; Bai, D.; Lei, H.M. The profiling and identification of the absorbed constituents and metabolites of Guizhi decoction in rat plasma and urine by rapid resolution liquid chromatography combined with quadrupole-time-of-flight mass spectrometry. Int. J. Mol. Sci. 2016, 17, 1409. [Google Scholar] [CrossRef] [PubMed] [Green Version]
- Liu, L.; Chu, X.Q.; Tian, C.L.; Xia, M.Q.; Zhang, L.; Jiang, J.Q.; Gui, S.Y. Chemo proling and simultaneous analysis of different combinations of Sinomenii caulis and Ramulus cinnamomi using UHPLC-Q-TOF-MS, GC-MS and HPLC methods. J. Chromatogr. Sci. 2021, 59, 606–661. [Google Scholar] [CrossRef] [PubMed]
- Wang, D.; Wu, X.M.; Zhang, D.D.; Zhu, B.R.; Wang, S.C.; Wang, C.X.; Jia, Q.; Li, Y.M. Study on chemical constituents of Cinnamomi ramulus. J. Chin. Mat. Med. 2020, 45, 124–132. [Google Scholar]
- Wu, X.X.; He, J.; Xu, H.R.; Bi, K.S.; Li, Q. Quality assessment of Cinnamomi ramulus by the simultaneous analysis of multiple active components using high-performance thin-layer chromatography and high-performance liquid chromatography. J. Sep. Sci. 2014, 37, 2490–2498. [Google Scholar] [CrossRef] [PubMed]
- Gong, Z.; Gong, L.; Hu, L.L.; Han, J.; Gong, Y.Y.; Xing, Y. Comparative Study on volatile oil components of Rimulus cinnamon and Cinnamon. J. Liaoning Tradit. Chin. Med. Mag. 2014, 41, 2199–2201. [Google Scholar]
- Chen, P.Y.; Yu, J.W.; Lu, F.L.; Lin, M.C.; Cheng, H.F. Differentiating parts of Cinnamomum cassia using LC-QTOF-MS in conjunction with principal component analysis. Biomed. Chromatogr. 2016, 30, 1449–1457. [Google Scholar] [CrossRef]
- Guo, Z.L.; Zhu, P.X.; He, X.A.; Yan, T.H.; Liang, X.R. Components identification and isomers differentiation in pigeon pea (Cajanus cajan L.) leaves by LC-MS. J. Sep. Sci. 2021, 44, 2510–2523. [Google Scholar] [CrossRef]
- Gao, X.; Sun, W.J.; Fu, Q.; Niu, X.F. Ultra-performance liquid chromatography coupled with electrospray ionization/quadrupole time-of-flight mass spectrometry for the rapid analysis of constituents in the traditional Chinese medical formula Danggui San. J. Sep. Sci. 2014, 37, 53–60. [Google Scholar] [CrossRef]
- Li, J.F.; Chen, W.J.; Wang, Y.H.; Yin, H. An LC-MS/MS method for simultaneous quantification of 11 components of Xian-Xiong-Gu-Kang in the plasma of osteoarthritic rats and pharmacokinetic analysis. J. Sep. Sci. 2021, 44, 3386–3397. [Google Scholar] [CrossRef]
- Lei, H.B.; Zhang, Y.H.; Ye, J.; Cheng, T.F.; Liang, Y.L.; Zu, X.P.; Zhang, W.D. A comprehensive quality evaluation of Fuzi and its processed product through integration of UPLC-QTOF/MS combined MS/MS-based mass spectral molecular networking with multivariate statistical analysis and HPLC-MS/MS. J. Ethnopharmacol. 2021, 266, 113455. [Google Scholar] [CrossRef] [PubMed]
- Zheng, Y.Y.; Zeng, X.; Peng, W.; Wu, Z.; Su, W.W. Characterisation and classification of Citri Reticulatae Pericarpium varieties based on UHPLC-Q-TOF-MS/MS combined with multivariate statistical analyses. Phytochem. Anal. 2019, 30, 278–291. [Google Scholar] [CrossRef] [PubMed]
- Wang, G.Y.; Shang, J.; Wu, Y.; Ding, G.; Xiao, W. Rapid characterization of the major chemical constituents from Polygoni multiflori caulis by liquid chromatography tandem mass spectrometry and comparative analysis with Polygoni multiflori radix. J. Sep. Sci. 2017, 40, 2107–2116. [Google Scholar] [CrossRef] [PubMed]
- Zeng, L.S.; OuYang, C.X. Effect of integrated traditional Chinese and western medicine on diabetic peripheral neuropathy and its influence on serum levels of homocysteine and cystatin-C. Chin. Mod. Med. 2019, 26, 151–153,156. [Google Scholar]
- Liu, J.; Zhang, Q.; Li, R.L.; Wei, S.J.; Gao, Y.X.; Ai, L.; Wu, C.J.; Pu, X.F. Anti-proliferation and anti-migration effects of an aqueous extract of Cinnamomi ramulus on MH7A rheumatoid arthritis-derived fibroblast-like synoviocytes through induction of apoptosis, cell arrest and suppression of matrix metalloproteinase. Pharm. Biol. 2020, 58, 863–877. [Google Scholar] [CrossRef]
- Han, Y.; Jung, H.W.; Bae, H.S.; Kang, J.S.; Park, Y.K. The extract of Cinnamomum cassia twigs inhibits adipocyte differentiation via activation of the insulin signaling pathway in 3T3-L1 preadipocytes. Pharm. Biol. 2013, 51, 961–967. [Google Scholar] [CrossRef] [Green Version]
- Zhao, N.; Li, J.; Li, L.; Niu, X.Y.; Jiang, M.; He, X.J.; Bian, Z.X.; Zhang, G.; Lu, A.P. Molecular network-based analysis of guizhi-shaoyao-zhimu decoction, a TCM herbal formula, for treatment of diabetic peripheral neuropathy. Acta Pharmacol. Sin. 2015, 36, 716–723. [Google Scholar] [CrossRef] [Green Version]
- Shen, F.H.; Yang, W.L.; Zhang, M.J. Clinical Effect of Huangqi Guizhi Wuwu Decoction Modified Combined with Western Medicine in the Treatment of Early Diabetic Foot. Chin. Foreign Med. Res. 2021, 19, 146–149. [Google Scholar]
- Price, D.E.; Alani, S.M.; Carrington, A.; Stickland, M.H.; Wales, J.K. The relationship between peripheral nerve resistance to ischaemia and diabetic control. J. Neurol. Neurosurg. Psychiatry. 1987, 50, 1671–1673. [Google Scholar] [CrossRef] [Green Version]
- Fen, N. Correlation between glycosylated hemoglobin, C-peptide levels and type 2 diabetes peripheral neuropathy. Med. J. Chin. People’s Health 2020, 32, 134–135. [Google Scholar]
- Yu, X.Y.; Zhang, L.; Yang, X.Y.; Huang, H.K.; Huang, Z.G.; Zhang, H.A.; Du, G.H. Salvianolic acid A protects the peripheral nerve function in diabetic rats through regulation of the AMPK-PGC1α-Sirt3 axis. Molecules 2012, 17, 11216–11228. [Google Scholar] [CrossRef] [PubMed] [Green Version]
- Liang, K.; Cui, S.J.; Zhang, Q.; Bi, K.S.; Qian, Z.Z.; Jia, Y. UPLC simultaneous determination of five active components in Cinnamomi ramulus. Chin. J. Chin. Mater. Med. 2011, 36, 3298–3301. [Google Scholar]
- Jiang, Y.P.; Liu, R.; Chen, J.J.; Liu, M.H.; Liu, M.; Liu, B.; Yi, L.Z.; Liu, S. Application of multifold characteristic ion filtering combined with statistical analysis for comprehensive profiling of chemical constituents in anti-renal interstitial fibrosis I decoction by ultra-high performance liquid chromatography coupled with hybrid quadrupole-orbitrap high resolution mass spectrometry. J. Chromatogr. A 2019, 1600, 197–208. [Google Scholar] [PubMed]
- Ye, X.Y.; Wu, J.M.; Yang, J.; Kantawong, F.; Kumsaiyai, W.; Zeng, J. Research progress on chemical constituents of Gynura divaricate and mass spectrometry-based fragmentation rules of representative components. Chin. Tradit. Herb. Drugs 2021, 52, 6687–6700. [Google Scholar]
- Zhou, W.W.; Liang, Z.T.; Li, P.; Zhao, Z.Z.; Chen, J. Tissue-specific chemical profiling and quantitative analysis of bioactive components of Cinnamomum cassia by combining laser-microdissection with UPLC-Q/TOF-MS. Chem. Cent J. 2018, 12, 71–80. [Google Scholar] [CrossRef] [PubMed]
- Cheng, X.; Bi, L.W.; Zeng, W.X.; Zhai, Z.D.; Chen, Y.X.; Zhang, Z.H. Chemical constituents of distillation residues from Cinnamon twigs and leaves by using UHPLC-QTOF-MS. Chem. Ind. Forest Prod. 2020, 40, 50–60. [Google Scholar]
- Kacem, N.; Hay, A.E.; Marston, A.; Zellagui, A.; Rhouati, S.; Hostettmann, K. Antioxidant compounds from Algerian Convolvulus tricolor (Convolvulaceae) seed husks. Nat Prod. Commun. 2012, 7, 873–874. [Google Scholar] [CrossRef] [Green Version]
- Wang, K.H.; Tian, J.Y.; Li, Y.S.; Liu, M.S.; Chao, Y.X.; Cai, Y.; Zeng, G.D.; Fang, Y. Identification of components in Citri Sarcodactylis Fructus from different origins via UPLC-Q-Exactive Orbitrap/MS. ACS Omega. 2021, 6, 17045–17057. [Google Scholar] [CrossRef]
- Weng, Q.Q.; Yang, B.; Li, B.; Deng, A.P.; Zhao, J.C.; Lin, W.M.; Zhan, Z.L.; Huang, L.Q. Analysis of chemical constituents in Paullinia cupana dried seeds by UPLC-Q-TOF-MS. Chin. J. Exp. Tradit. Med. Form. 2021, 27, 68–75. [Google Scholar]
- Zeng, W.X.; Cheng, X.; Bi, L.W.; Li, S.N.; Chen, Y.X.; Zhao, Z.D. Effect of biological pretreatment on chemical components from cinnamon cwigs and ceaves. Chem. Indus Forest Produ. 2021, 41, 101–110. [Google Scholar]
- Ma, L.Y.; Wang, Y.M.; Chu, K.; Chen, C.; Wu, S. Determination of phenolic acids and phenol aldehyde compounds in wine by Ultra Performance Liquid Chromatography Tandem Mass Spectrometry. Chem. Reag. 2023, 45, 141–147. [Google Scholar]
- Farag, M.A.; Kabbash, E.M.; Mediani, A.; Döll, S.; Esatbeyoglu, T.; Afifi, S.M. Comparative metabolite fingerprinting of four different cinnamon species analyzed via UPLC-MS and GC-MS and chemometric tools. Molecules 2022, 27, 2935. [Google Scholar] [CrossRef] [PubMed]
- He, M.Z.; Jia, J.; Li, J.M.; Wu, B.; Huang, W.P.; Liu, M.; Li, Y.; Yang, S.L.; Ouyang, H.; Feng, Y. Application of characteristic ion filtering with ultra-high performance liquid chromatography quadrupole time of flight tandem mass spectrometry for rapid detection and identification of chemical profiling in Eucommia ulmoides Oliv. J. Chromatogr. A 2018, 1554, 81–91. [Google Scholar] [CrossRef] [PubMed]
- Abu Bakar, F.I.; Abu Bakar, M.F.; Abdullah, N.; Endrini, S.; Fatmawati, S. Optimization of extraction conditions of phytochemical compounds and anti-Gout activity of euphorbia hirta L. (Ara Tanah) using response surface methodology and liquid chromatography-Mass spectrometry (LC-MS) analysis. Evid. Based Complement. Altern. Med. 2020, 2020, 501261–501283. [Google Scholar] [CrossRef] [PubMed] [Green Version]
- Jia, Q.Q.; Zhang, S.D.; Zhang, H.Y.; Yang, X.J.; Cui, X.L.; Su, Z.H.; Hu, P. A Comparative study on polyphenolic composition of berries from the Tibetan Plateau by UPLC-Q-Orbitrap MS system. Chem. Biodivers. 2020, 17, 2000033–2000053. [Google Scholar] [CrossRef] [PubMed]
- Liu, H.X.; Lin, S.; Huang, C.S.; Sun, C.H.; Huang, K.L. Study on chemical component about cinnamomum cassia oil from the different sections of cinnamomum cassia by gas chromatography-mass spectrometry. Chincondiment 2011, 36, 102–104,110. [Google Scholar]
- Chen, P.; Ruan, A.M.; Zhou, J.; Zhang, X.Z.; Wang, Q.F. Exploration on action mechanism of combination of Ramulus Cinnamoni and Radix Paeoniae Alba in treatment of osteoarthritis based on network pharmacology. Global Trad. Chin. Med. 2021, 14, 403–410. [Google Scholar]
- Yang, Y.L.; Al-Mahdy, D.A.; Wu, M.L.; Zheng, X.T.; Piao, X.H.; Chen, A.L.; Wang, S.M.; Yang, Q.; Ge, Y.W. LC-MS-based identification and antioxidant evaluation of small molecules from the cinnamon oil extraction waste. Food Chem. 2022, 366, 130576. [Google Scholar] [CrossRef]
- Zhang, F.H.; Wang, Z.M.; Liu, Y.T.; Huang, J.S.; Liang, S.; Wu, H.H.; Xu, Y.T. Bioactivities of serotonin transporter mediate antidepressant effects of Acorus tatarinowii Schott. J. Ethnopharmacol. 2019, 241, 111967–111975. [Google Scholar] [CrossRef]
- Liu, J.Y.; Yang, X.D.; Xu, L.Z.; Yang, S.L. Studies on chemical constituents in dried tender stem of Cinnamomum cassia. Chin. Trad. Herb. Drugs 2002, 33, 681–683. [Google Scholar]
- Fu, B.H.; Ji, Y.; Li, J.; Pei, M.; Yang, H.T. Network pharmacology-based mechanism of Guizhi Mahuang Geban decoction in treatment of uraemic pruritus. Trad. Chin. Drug Res. Clinl. Pharm. 2021, 32, 1675–1684. [Google Scholar]
- Yoshimura, M.; Ochi, K.; Sekiya, H.; Tamai, E.; Maki, J.; Tada, A.; Sugimoto, N.; Akiyama, H.; Amakura, Y. Identification of characteristic phenolic constituents in Mousouchiku extract used as food additives. Chem. Pharm. Bull. 2017, 65, 878–882. [Google Scholar] [CrossRef] [PubMed] [Green Version]
- Chang, S.W.; Lee, J.S.; Lee, J.H.; Kim, J.Y.; Hong, J.K.; Kim, S.K.; Lee, D.H.; Jang, D.S. Aromatic and Aliphatic Apiuronides from the Bark of Cinnamomum cassia. J. Nat. Prod. 2021, 84, 553–561. [Google Scholar] [CrossRef] [PubMed]
- Caboni, P.; Sarais, G.; Cabras, M.; Angioni, A. Determination of 4-ethylphenol and 4-ethylguaiacol in wines by LC-MS-MS and HPLC-DAD-fluorescence. J. Agr. Food Chem. 2007, 55, 7288–7293. [Google Scholar] [CrossRef]
- Lam, R.Y.Y.; Lin, Z.X.; Sviderskaya, E.; Cheng, C.H.K. Application of a combined sulphorhodamine B and melanin assay to the evaluation of Chinese medicines and their constituent compounds for hyperpigmentation treatment. J. Ethnopharmacol. 2010, 132, 274–279. [Google Scholar] [CrossRef] [PubMed]
- Wang, Y.F.; Harrington, P.B.; Chen, P. Metabolomic profiling and comparison of major cinnamon species using UHPLC-HRMS. Anal. Bioanal. Chem. 2020, 412, 7669–7681. [Google Scholar] [CrossRef] [PubMed]
- Han, S.; Karłowicz-Bodalska, K.; Potaczek, P.; Wójcik, A.; Ozimek, L.; Szura, D.; Musiał, W. Identification of unknown impurity of azelaic acid in liposomal formulation assessed by HPLC-ELSD, GC-FID, and GC-MS. AAPS Pharm. SciTech. 2014, 15, 111–120. [Google Scholar] [CrossRef] [PubMed] [Green Version]
- Shi, D.H.; Dai, Y.P.; Wang, L.F.; Zhou, Q.; Zhang, X.L.; Zhang, J. Chemical composition analysis of platycladi cacumen before and after being carbonized based on identification by UHPLC-QTOF-MS/MS. Chin. J. Exp. Tradit. Med. Form. 2021, 8, 107–116. [Google Scholar]
- Rius Solé, M.A.; García Regueiro, J.A. Role of 4-phenyl-3-buten-2-one in boar taint: Identification of new compounds related to sensorial descriptors in pig fat. J. Agr. Food Chem. 2001, 49, 5303–5309. [Google Scholar] [CrossRef]
- Razgonova, M.; Zakharenko, A.; Pikula, K.; Manakov, Y.; Ercisli, S.; Derbush, I.; Kislin, E.; Seryodkin, I.; Sabitov, A.; Kalenik, T.; et al. LC-MS/MS screening of phenolic compounds in wild and cultivated grapes Vitis amurensis Rupr. Molecules 2021, 26, 3650. [Google Scholar] [CrossRef]
- Oliw, E.H.; Garscha, U.; Nilsson, T.; Cristea, M. Payne rearrangement during analysis of epoxyalcohols of linoleic and alpha-linolenic acids by normal phase liquid chromatography with tandem mass spectrometry. Anal. Biochem. 2006, 354, 111–126. [Google Scholar] [CrossRef]
- Caviglioli, G.; Valeria, P.; Brunella, P.; Sergio, C.; Attilia, A.; Gaetano, B. Identification of degradation products of ibuprofen arising from oxidative and thermal treatments. J. Pharmaceut. Biomed. 2002, 30, 499–509. [Google Scholar] [CrossRef] [PubMed]
- Xu, F.; Koch, D.E.; Kong, I.C.; Hunter, R.P.; Bhandari, A. Peroxidase-mediated oxidative coupling of 1-naphthol: Characterization of polymerization products. Water Res. 2005, 39, 2358–2368. [Google Scholar] [CrossRef] [PubMed]
- Xu, C.J.; Liang, Y.Z.; Song, Y.Q.; Li, J.S. Resolution of the essential constituents of Ramulus cinnamomi by an evolving chemometric approach. Fresen J. Anal. Chem. 2001, 371, 331–336. [Google Scholar] [CrossRef] [PubMed]
- Yongram, C.; Sungthong, B.; Puthongking, P.; Weerapreeyakul, N. Chemical composition, antioxidant and cytotoxicity activities of leaves, bark, twigs and oleo-resin of dipterocarpus alatus. Molecules 2019, 24, 3083. [Google Scholar] [CrossRef] [PubMed] [Green Version]
- Mueller, M.; Beck, V.; Jungbauer, A. PPARα activation by culinary herbs and spices. Planta Med. 2011, 77, 497–504. [Google Scholar] [CrossRef] [PubMed]
- Guo, Y.P.; Yang, H.; Wang, Y.L.; Chen, X.X.; Zhang, K.; Wang, Y.L.; Sun, Y.F.; Huang, J.; Yang, L.; Wang, J.H. Determination of Flavonoids Compounds of Three Species and Different Harvesting Periods in Crataegi folium Based on LC-MS/MS. Molecules 2021, 26, 1602. [Google Scholar] [CrossRef]
- Liang, H.B.; Jiang, Y.J.; Yuan, X.M.; Yao, J.C.; Qiu, R.Y.; Yang, M.; Zhang, G.M.; Li, F. Chemical constituents of Jingfang granules based on GC-MS and UPLC-Q Exactive MS. Chin. Tradit. Herb. Drugs 2022, 53, 1697–1708. [Google Scholar]
- Qiao, X.; Li, R.; Song, W.; Miao, W.J.; Liu, J.; Chen, H.B.; Guo, D.A.; Ye, M. A targeted strategy to analyze untargeted mass spectral data: Rapid chemical profiling of Scutellaria baicalensis using ultra-high performance liquid chromatography coupled with hybrid quadrupole orbitrap mass spectrometry and key ion filtering. J. Chromatogr. A 2016, 1441, 83–95. [Google Scholar] [CrossRef]
- Sang, Q.N.; Jia, Q.Q.; Zhang, H.Y.; Lin, C.H.; Zhao, X.D.; Zhang, M.; Wang, Y.R.; Hu, P. Chemical profiling and quality evaluation of Zhishi-Xiebai-Guizhi decoction by UPLC-Q-TOF-MS and UPLC fingerprint. Pharm. Biomed. Anal. 2021, 194, 113771. [Google Scholar] [CrossRef]
- Yang, W.; Ye, M.; Liu, M.; Kong, D.Z.; Shi, R.A.; Shi, X.W.; Zhang, K.R.; Wang, Q.; Zhang, L.T. Practical strategy for the characterization of coumarins in Radix Glehniae by liquid chromatography coupled with triple quadrupole-linear ion trap mass spectrometry. J. Chromatogr. A 2010, 1217, 4587–4600. [Google Scholar] [CrossRef]
- Yang, H.; Jiang, B.; Reynertson, K.A.; Basile, M.J.; Kennelly, E.J. Comparative analyses of bioactive Mammea coumarins from seven parts of Mammea americana by HPLC-PDA with LC-MS. J. Agric. Food Chem. 2006, 54, 4114–4412. [Google Scholar] [CrossRef] [PubMed]
- Liu, C.; Long, H.L.; Wu, X.D.; Hou, J.J.; Gao, L.; Yao, S.A.; Lei, M.; Zhang, Z.J.; Gao, D.A.; Wu, W.Y. Quantitative and fingerprint analysis of proanthocyanidins and phenylpropanoids in Cinnamomum verum bark, Cinnamomum cassia bark, and Cassia twig by UPLC combined with chemometrics. Eur. Food Res. Technol. 2021, 247, 2687–2698. [Google Scholar] [CrossRef]
- Wang, S.H.; Huang, W.L.; Chen, Q.S.; Zeng, L.; Zeng, F.J. Inhibition of rutin and quercetin on α-glycosidase. Chin. Brew Maga 2012, 31, 133–135. [Google Scholar]
- Li, Y.H.; Wei, J.C.; Liang, J.L.; Huang, Q.X.; Huang, R.S.; Lei, P.L. Smiultaneous determination of coumarin, cinnamic acid and cinnamaldehyde in folium cinnamonic by HPLC. Chin. J. Trad. Chin. Med. 2020, 38, 54–57. [Google Scholar]
- Kim, C.; Lee, J.H.; Kim, W.J.; Li, D.X.; Kim, Y.S.; Lee, K.J.; Kim, S.K. The suppressive effects of cinnamomi cortex and its phytocompound coumarin on oxaliplatin-induced neuropathic cold allodynia in rats. Molecules 2016, 21, 1253. [Google Scholar] [CrossRef] [Green Version]
- Chen, K.K.; Liu, J.; Ma, Z.C.; Duan, F.P.; Guo, Z.H.; Xiao, H.B. Rapid identification of chemical constituents of Rhodiola crenulata using liquid chromatography-mass spectrometry pseudotargeted analysis. J. Sep. Sci. 2021, 44, 3747–3776. [Google Scholar] [CrossRef]
- Goodner, K.L.; Rouseff, R.L. Using an ion-trap MS sensor to differentiate and identify individual components in grapefruit juice headspace volatiles. J. Agric. Food Chem. 2001, 49, 250–253. [Google Scholar] [CrossRef]
- Chandra, P.; Rathore, A.S.; Kay, K.L.; Everhart, J.L.; Curtis, P.; Burton-Freeman, B.; Cassidy, A.; Kay, C.D. Contribution of berry polyphenols to the human metabolome. Molecules 2019, 24, 4220. [Google Scholar] [CrossRef] [Green Version]
- Zhang, W.D.; Wang, X.J.; Zhou, S.Y.; Gu, Y.; Wang, R.; Zhang, T.L.; Gan, H.Q. Determination of free and glucuronidated kaempferol in rat plasma by LC-MS/MS: Application to pharmacokinetic study. J. Chromatogr. B 2010, 878, 2137–2140. [Google Scholar] [CrossRef]
- Hu, J.; Zhao, J.P.; Khan, S.I.; Liu, Q.; Liu, Y.; Ali, Z.; Li, X.C.; Zhang, S.H.; Cai, X.; Huang, H.Y.; et al. Antioxidant neolignan and phenolic glucosides from the fruit of Euterpe oleracea. Fitoterapia 2014, 99, 178–183. [Google Scholar] [CrossRef]
- Kim, S.E.; Lee, J.; An, J.U.; Kim, T.H.; Oh, C.W.; Ko, Y.J.; Krishnan, M.; Choi, J.; Yoon, D.Y.; Kim, Y.; et al. Regioselectivity of an arachidonate 9S-lipoxygenase from Sphingopyxis macrogoltabida that biosynthesizes 9S,15S- and 11S,17S-dihydroxy fatty acids from C20 and C22 polyunsaturated fatty acids. BBA-Mol. Cell Biol. Lipids 2022, 1867, 159091. [Google Scholar] [CrossRef] [PubMed]
- Kenari, F.; Molnár, S.; Perjési, P. Reaction of Chalcones with Cellular Thiols. The Effect of the 4-Substitution of Chalcones and Protonation State of the Thiols on the Addition Process. Diastereoselective Thiol Addition. Molecules 2021, 26, 4332. [Google Scholar] [CrossRef] [PubMed]


| No. | Name | Linear | r | Linear Range (μg/mL) | Precision (RSD) n = 6 | Stability (RSD) n = 6 | Repeatability (RSD) n = 6 | Average Recovery (%) | Recovery RSD (%) |
|---|---|---|---|---|---|---|---|---|---|
| 31 | Coumarin | Y = 1118.3X − 1.9591 | 0.9998 | 1.0331~1033.31 | 0.43% | 0.83% | 2.48% | 100.09% | 2.42% |
| 42 | Cinnamyl Alcohol | Y = 1377.2X − 0.0481 | 0.9997 | 0.0187~3.7300 | 2.30% | 1.17% | 2.81% | 98.07% | 2.77% |
| 45 | trans- Cinnamic acid | Y = 3219.7X − 1.3026 | 0.9999 | 0.6667~6.6670 | 0.47% | 0.65% | 1.60% | 95.11% | 2.09% |
| 48 | 2-Methoxy cinnamic acid | Y = 12307X − 0.0527 | 0.9997 | 0.0133~2.6660 | 0.70% | 0.74% | 1.56% | 98.30% | 2.23% |
| 49 | trans- Cinnamaldehyde | Y = 449.01X − 5.4428 | 0.9995 | 108.30~2800 | 2.48% | 3.43% | 2.67% | 97.36% | 3.43% |
| Sample | Coumarin (mg/g) | Cinnamyl Alcohol (mg/g) | trans-Cinnamic Acid (mg/g) | 2-Methoxycinnamic Acid (mg/g) | trans-Cinnamaldehyde (mg/g) |
|---|---|---|---|---|---|
| CR-1 | 1.2038 | 0.0381 | 1.2205 | 0.0180 | 26.9798 |
| CR-2 | 0.8544 | 0.0602 | 0.4867 | 0.0055 | 24.3722 |
| CR-3 | 0.4209 | 0.1431 | 0.2674 | 0.0021 | 17.0832 |
| CR-4 | 0.7392 | 0.0770 | 0.4862 | 0.0057 | 29.9873 |
| CR-5 | 0.4531 | 0.0479 | 0.5113 | 0.0017 | 19.6756 |
| CR-6 | 0.4834 | 0.0839 | 0.5245 | 0.0017 | 16.1460 |
| CR-7 | 0.5107 | 0.0849 | 0.3960 | 0.0016 | 16.4895 |
| CR-8 | 0.3563 | 0.1241 | 0.2769 | 0.0017 | 13.3894 |
| CC-1 | 0.7534 | 0.0141 | 0.4164 | 0.0032 | 49.7582 |
| CC-2 | 0.4307 | 0.0440 | 0.3474 | 0.0006 | 64.4378 |
| CC-3 | 0.1880 | 0.0052 | 0.2370 | 0.0005 | 42.3951 |
| CC-4 | 0.1611 | 0.0130 | 0.2914 | 0.0003 | 52.0785 |
| CC-5 | 0.2030 | 0.0163 | 0.0811 | 0.0003 | 36.8182 |
| CC-6 | 0.5814 | 0.0161 | 0.3301 | 0.0011 | 40.5779 |
| CC-7 | 0.3655 | 0.0177 | 0.2932 | 0.0012 | 52.9302 |
| CC-8 | 0.3851 | 0.0212 | 0.3169 | 0.0014 | 54.7701 |
Disclaimer/Publisher’s Note: The statements, opinions and data contained in all publications are solely those of the individual author(s) and contributor(s) and not of MDPI and/or the editor(s). MDPI and/or the editor(s) disclaim responsibility for any injury to people or property resulting from any ideas, methods, instructions or products referred to in the content. |
© 2023 by the authors. Licensee MDPI, Basel, Switzerland. This article is an open access article distributed under the terms and conditions of the Creative Commons Attribution (CC BY) license (https://creativecommons.org/licenses/by/4.0/).
Share and Cite
Wang, P.; Chi, J.; Guo, H.; Wang, S.-X.; Wang, J.; Xu, E.-P.; Dai, L.-P.; Wang, Z.-M. Identification of Differential Compositions of Aqueous Extracts of Cinnamomi Ramulus and Cinnamomi Cortex. Molecules 2023, 28, 2015. https://doi.org/10.3390/molecules28052015
Wang P, Chi J, Guo H, Wang S-X, Wang J, Xu E-P, Dai L-P, Wang Z-M. Identification of Differential Compositions of Aqueous Extracts of Cinnamomi Ramulus and Cinnamomi Cortex. Molecules. 2023; 28(5):2015. https://doi.org/10.3390/molecules28052015
Chicago/Turabian StyleWang, Pei, Jun Chi, Hui Guo, Shun-Xiang Wang, Jing Wang, Er-Ping Xu, Li-Ping Dai, and Zhi-Min Wang. 2023. "Identification of Differential Compositions of Aqueous Extracts of Cinnamomi Ramulus and Cinnamomi Cortex" Molecules 28, no. 5: 2015. https://doi.org/10.3390/molecules28052015