
Investigation on Antioxidant Activity and Different Metabolites of Mulberry (Morus spp.) Leaves Depending on the Harvest Months by UPLC–Q-TOF-MS with Multivariate Tools

Abstract
:1. Introduction
2. Results and Discussion
2.1. Optimization of Extraction Conditions
2.2. Optimization of UPLC and MS Conditions
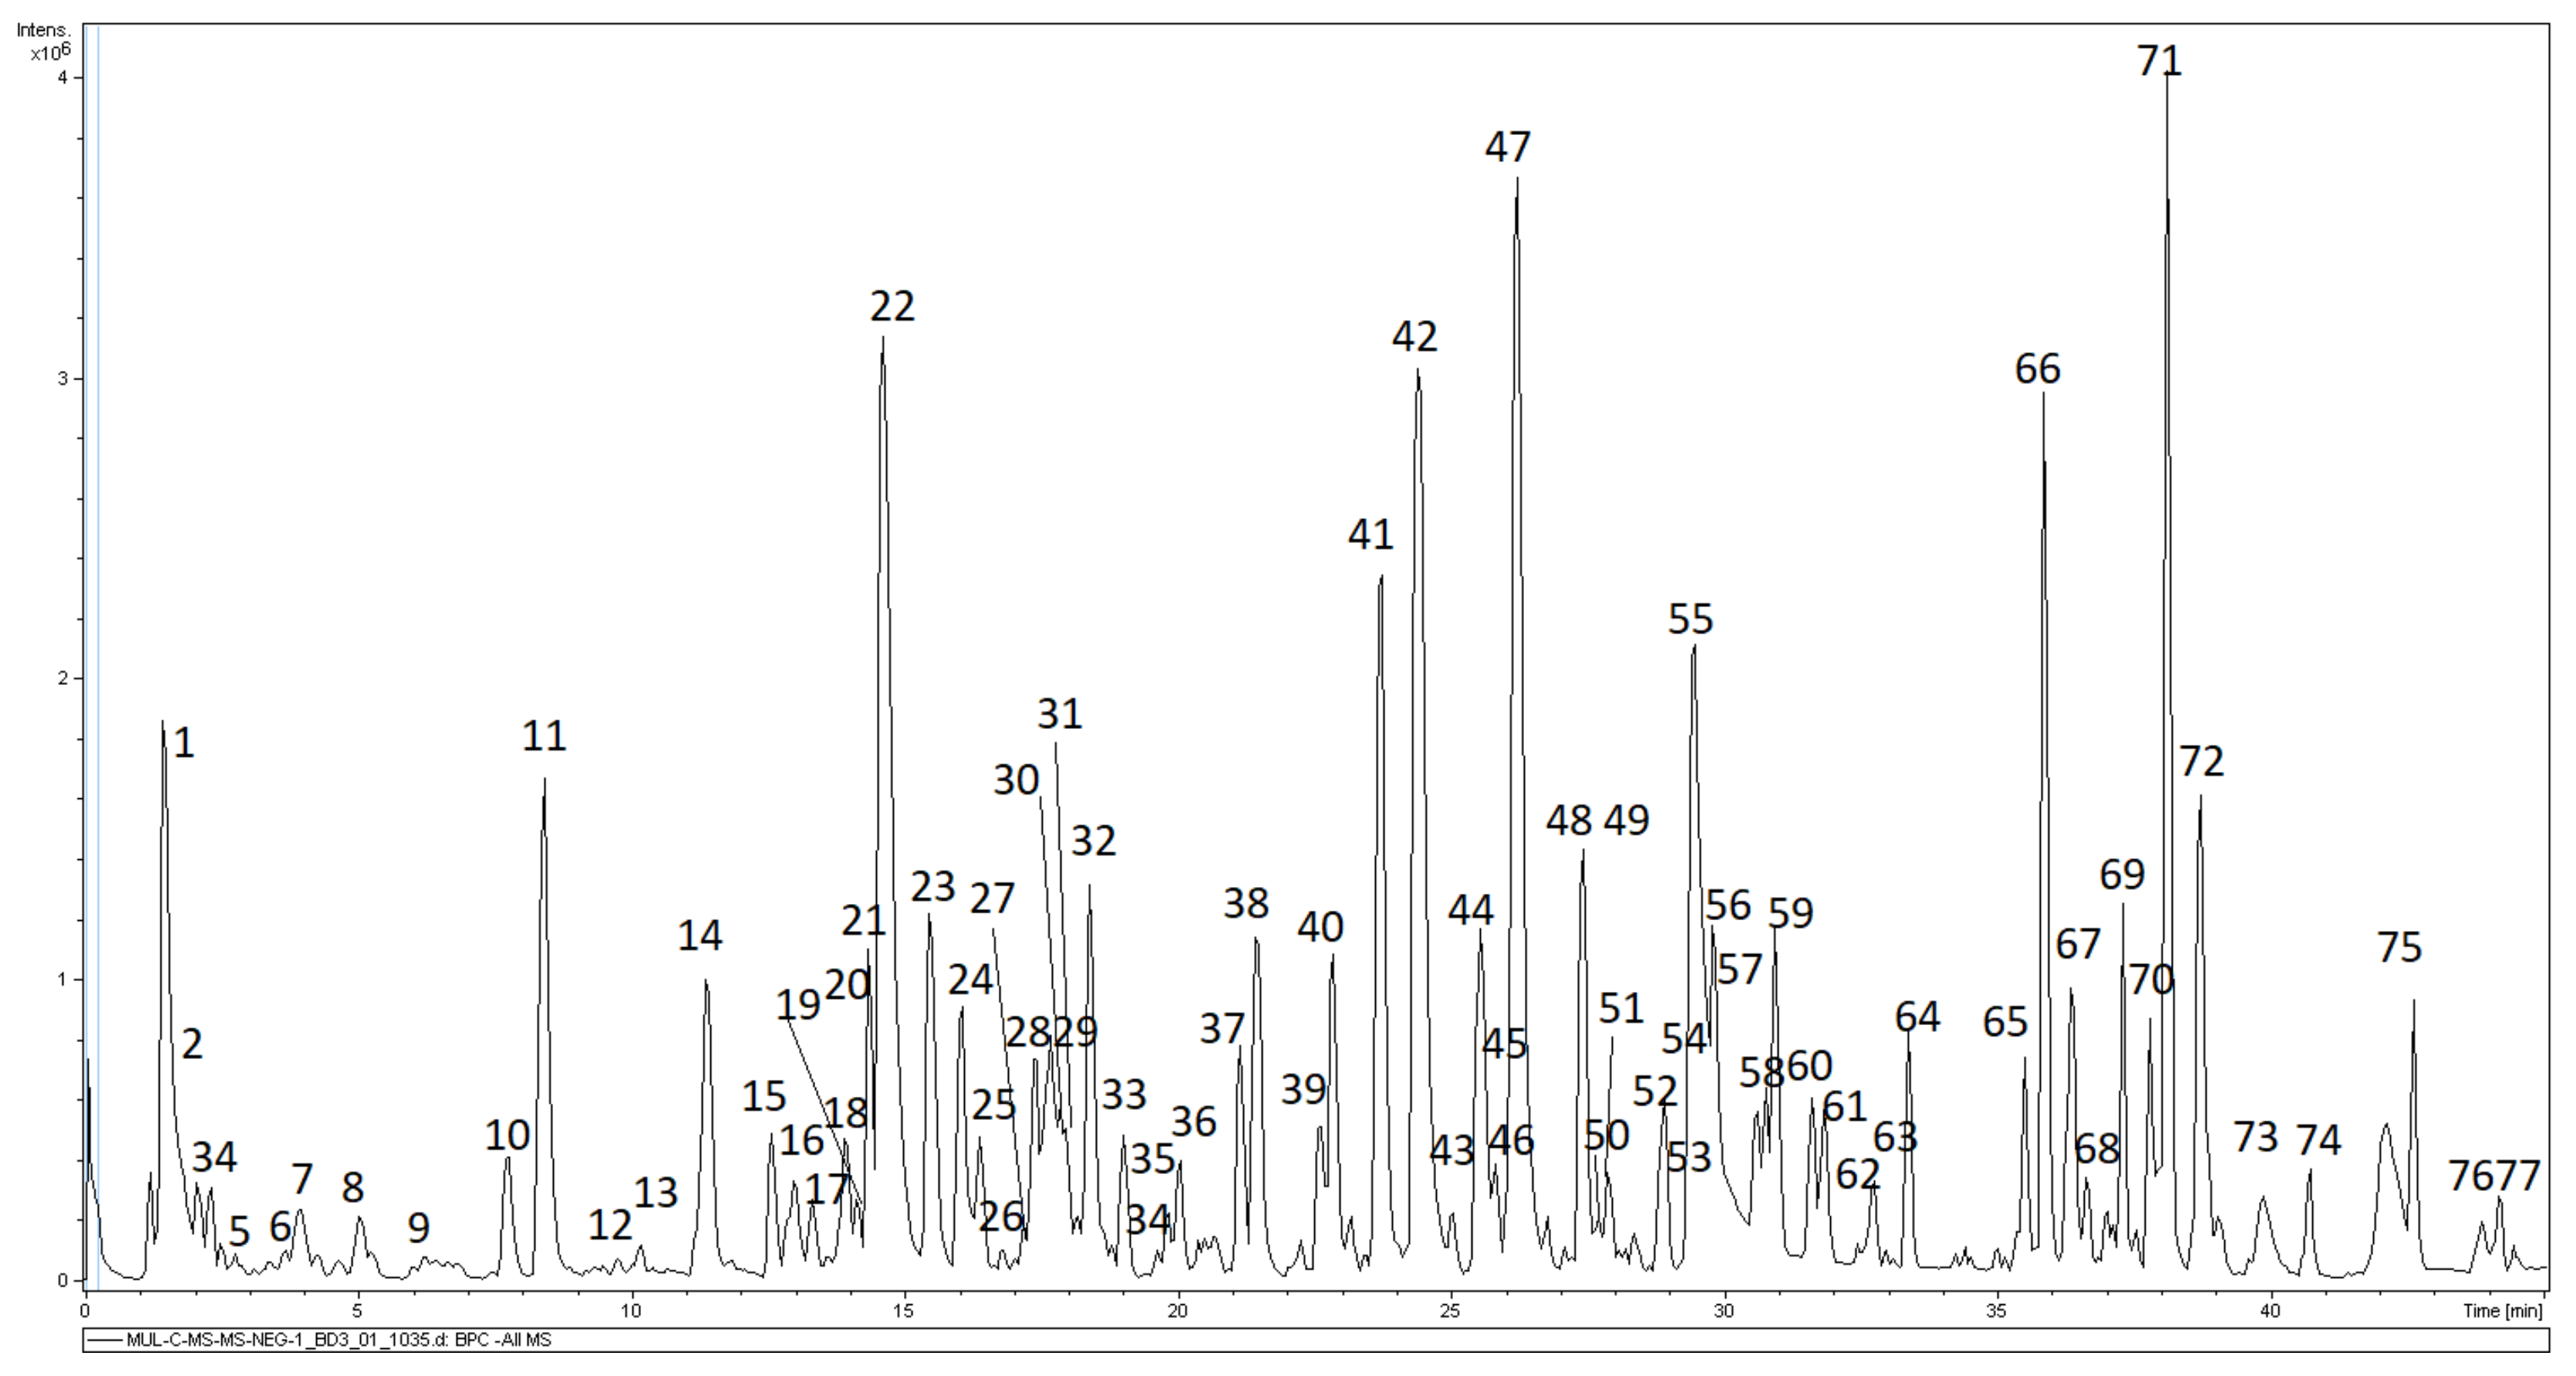
2.3. Identification of the Compounds by UPLC–Q-TOF-MS
2.4. Investigation of the Differential Chemical Constituents of Mulberry Leaves Harvested in Different Months
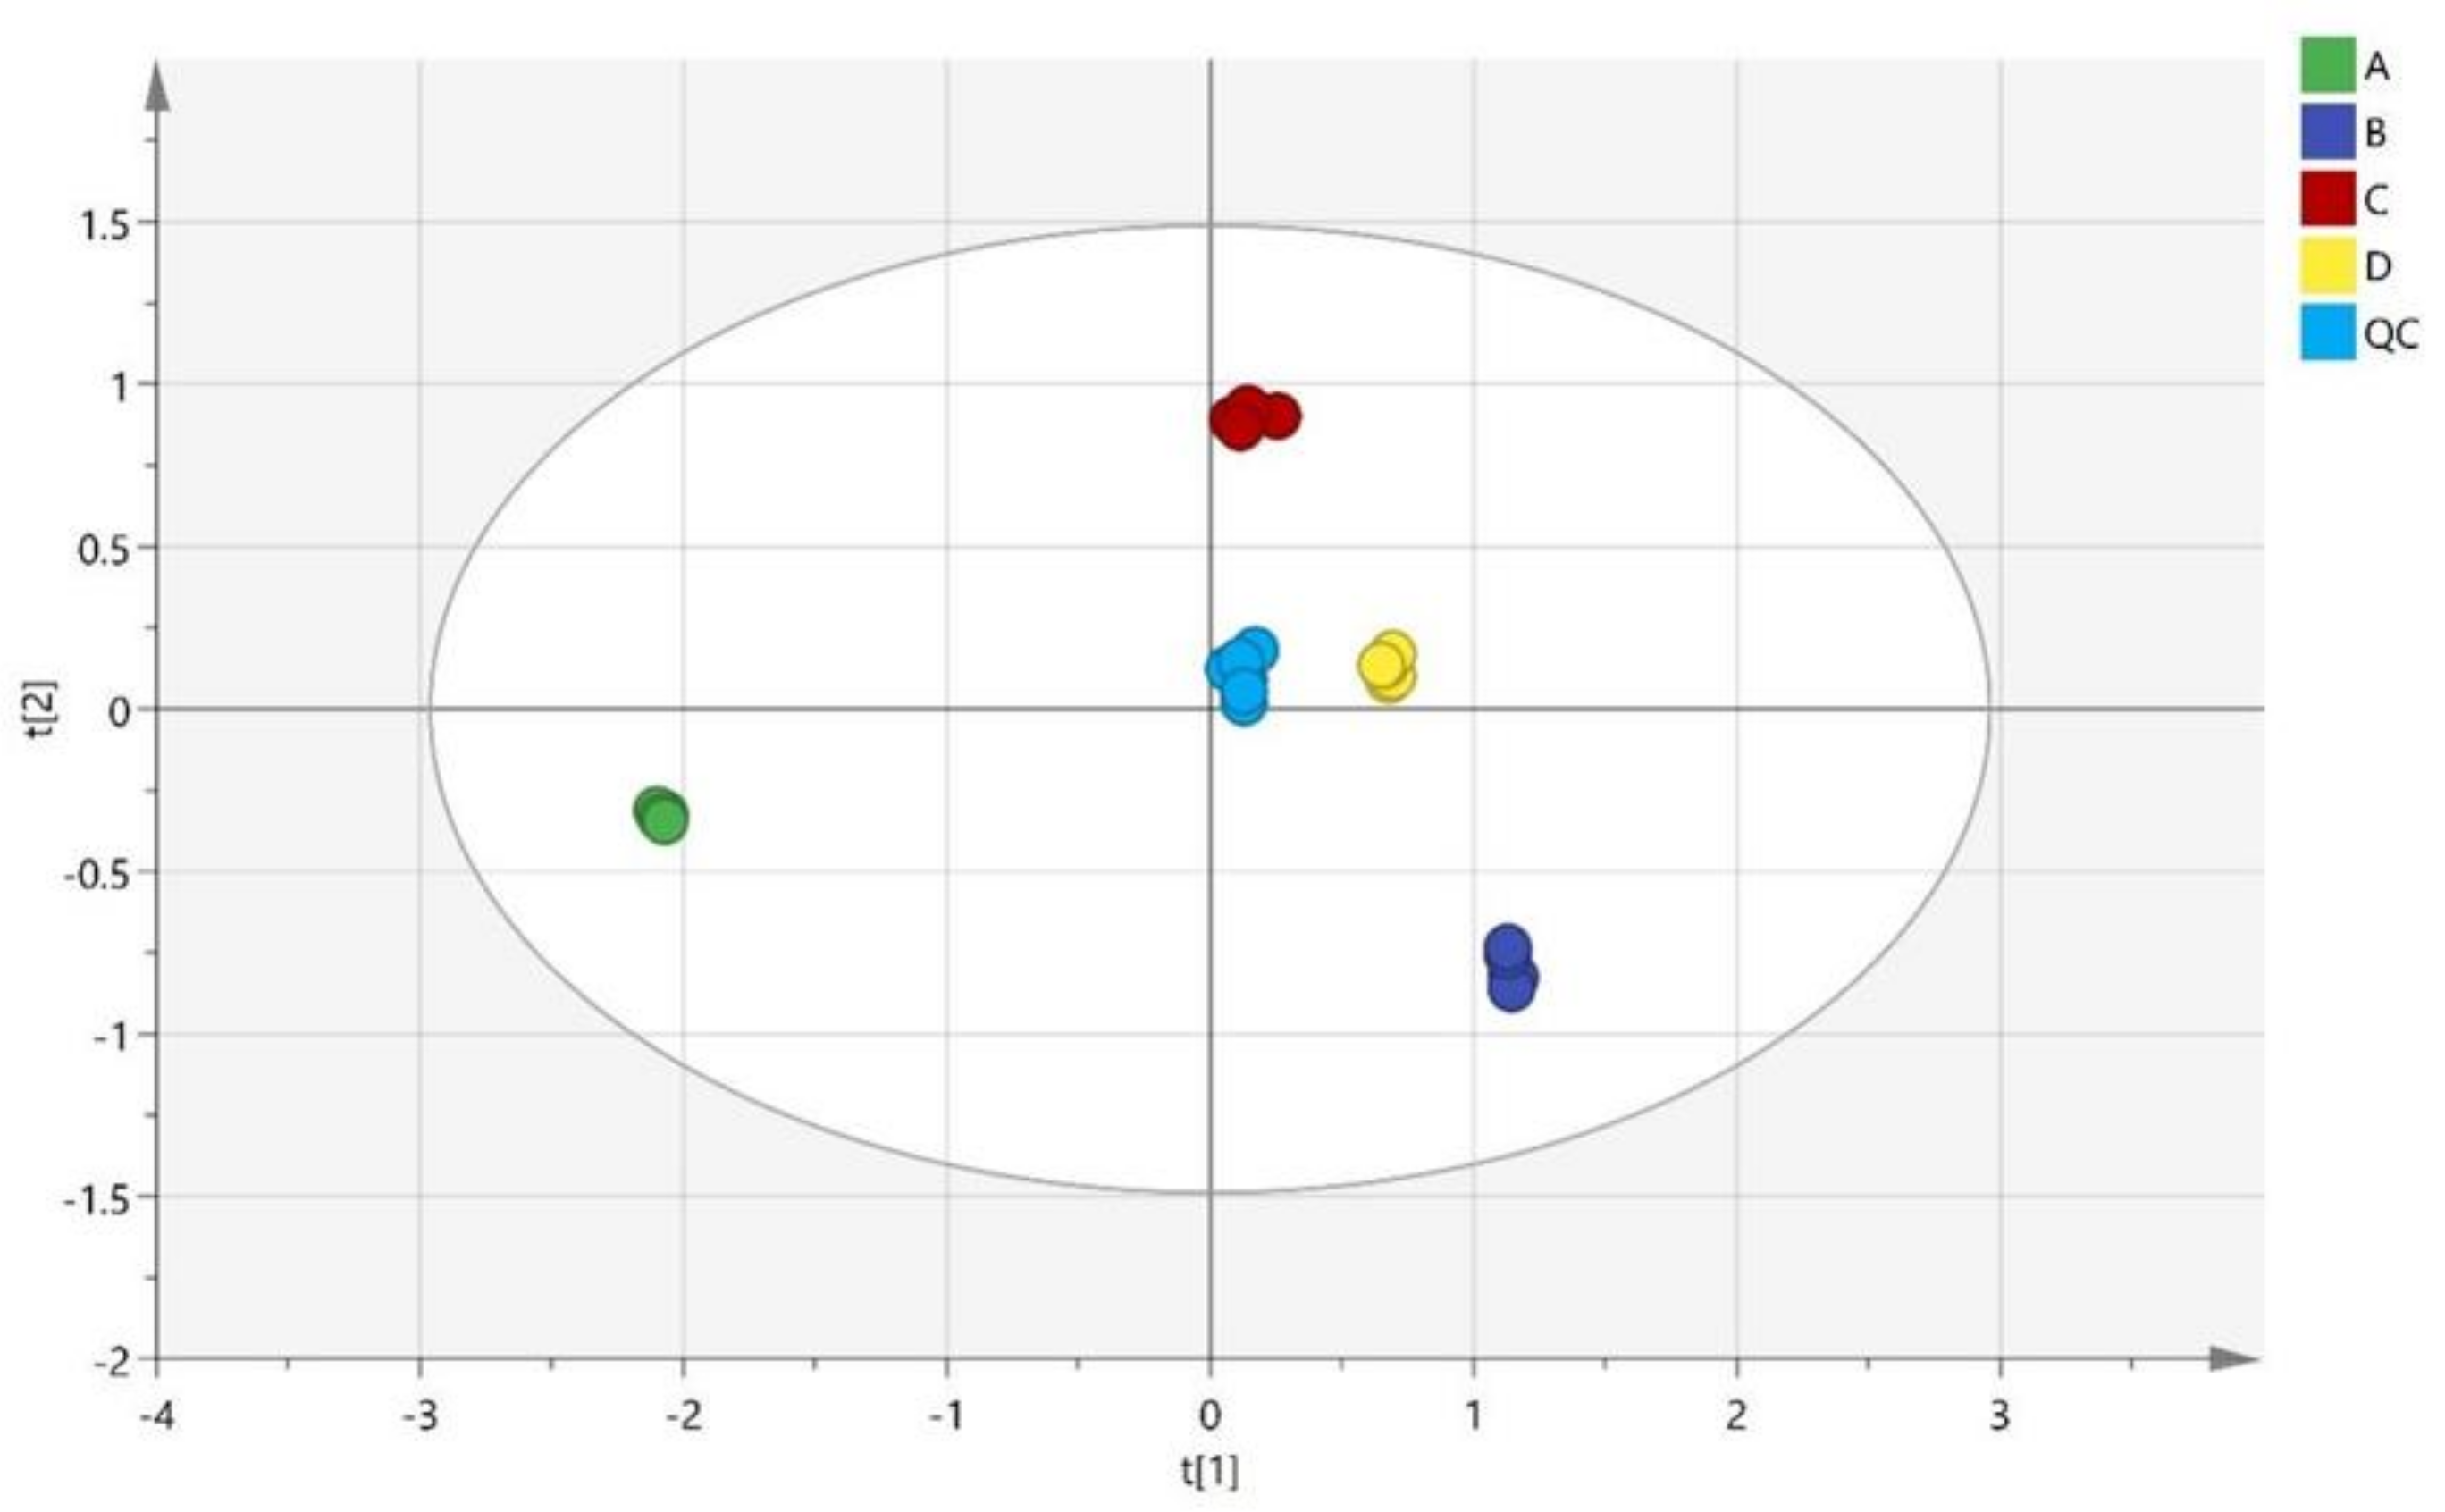
2.4.1. Principal Component Analysis (PCA)
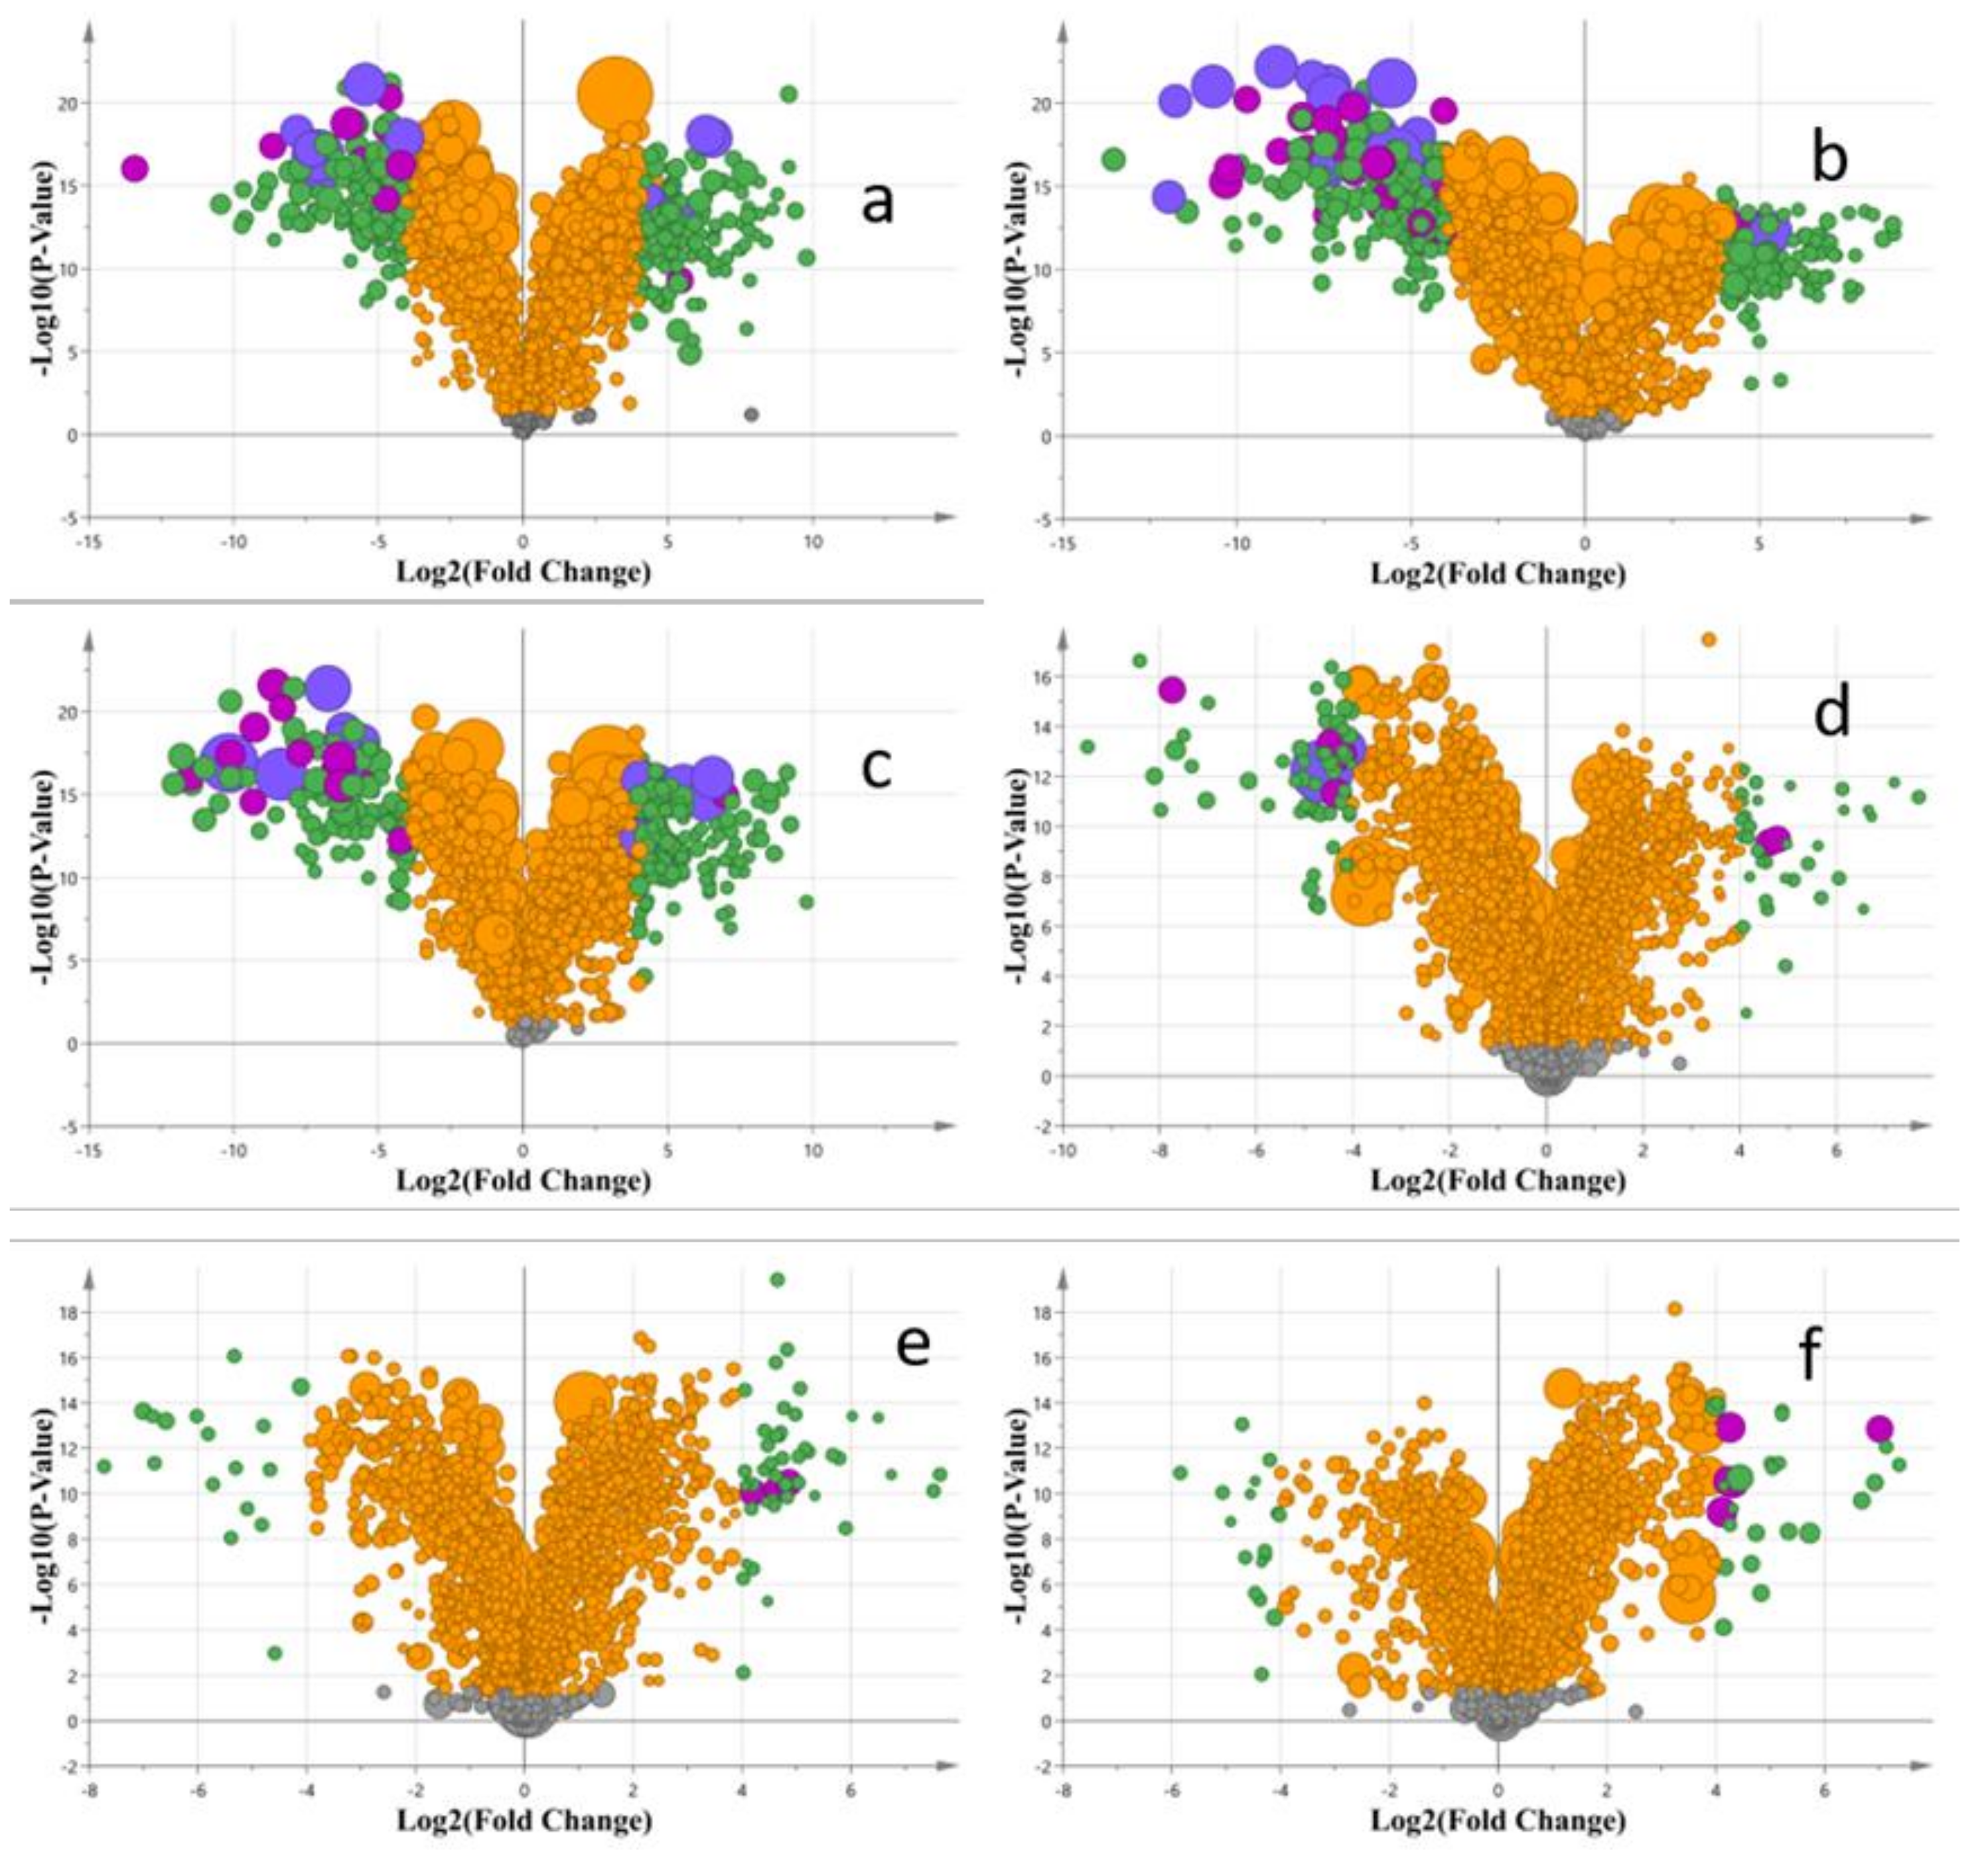
2.4.2. Comparisons of Different Batches of Mulberry Leaves by Orthogonal Partial Least Squares Discriminant Analysis (OPLS-DA)
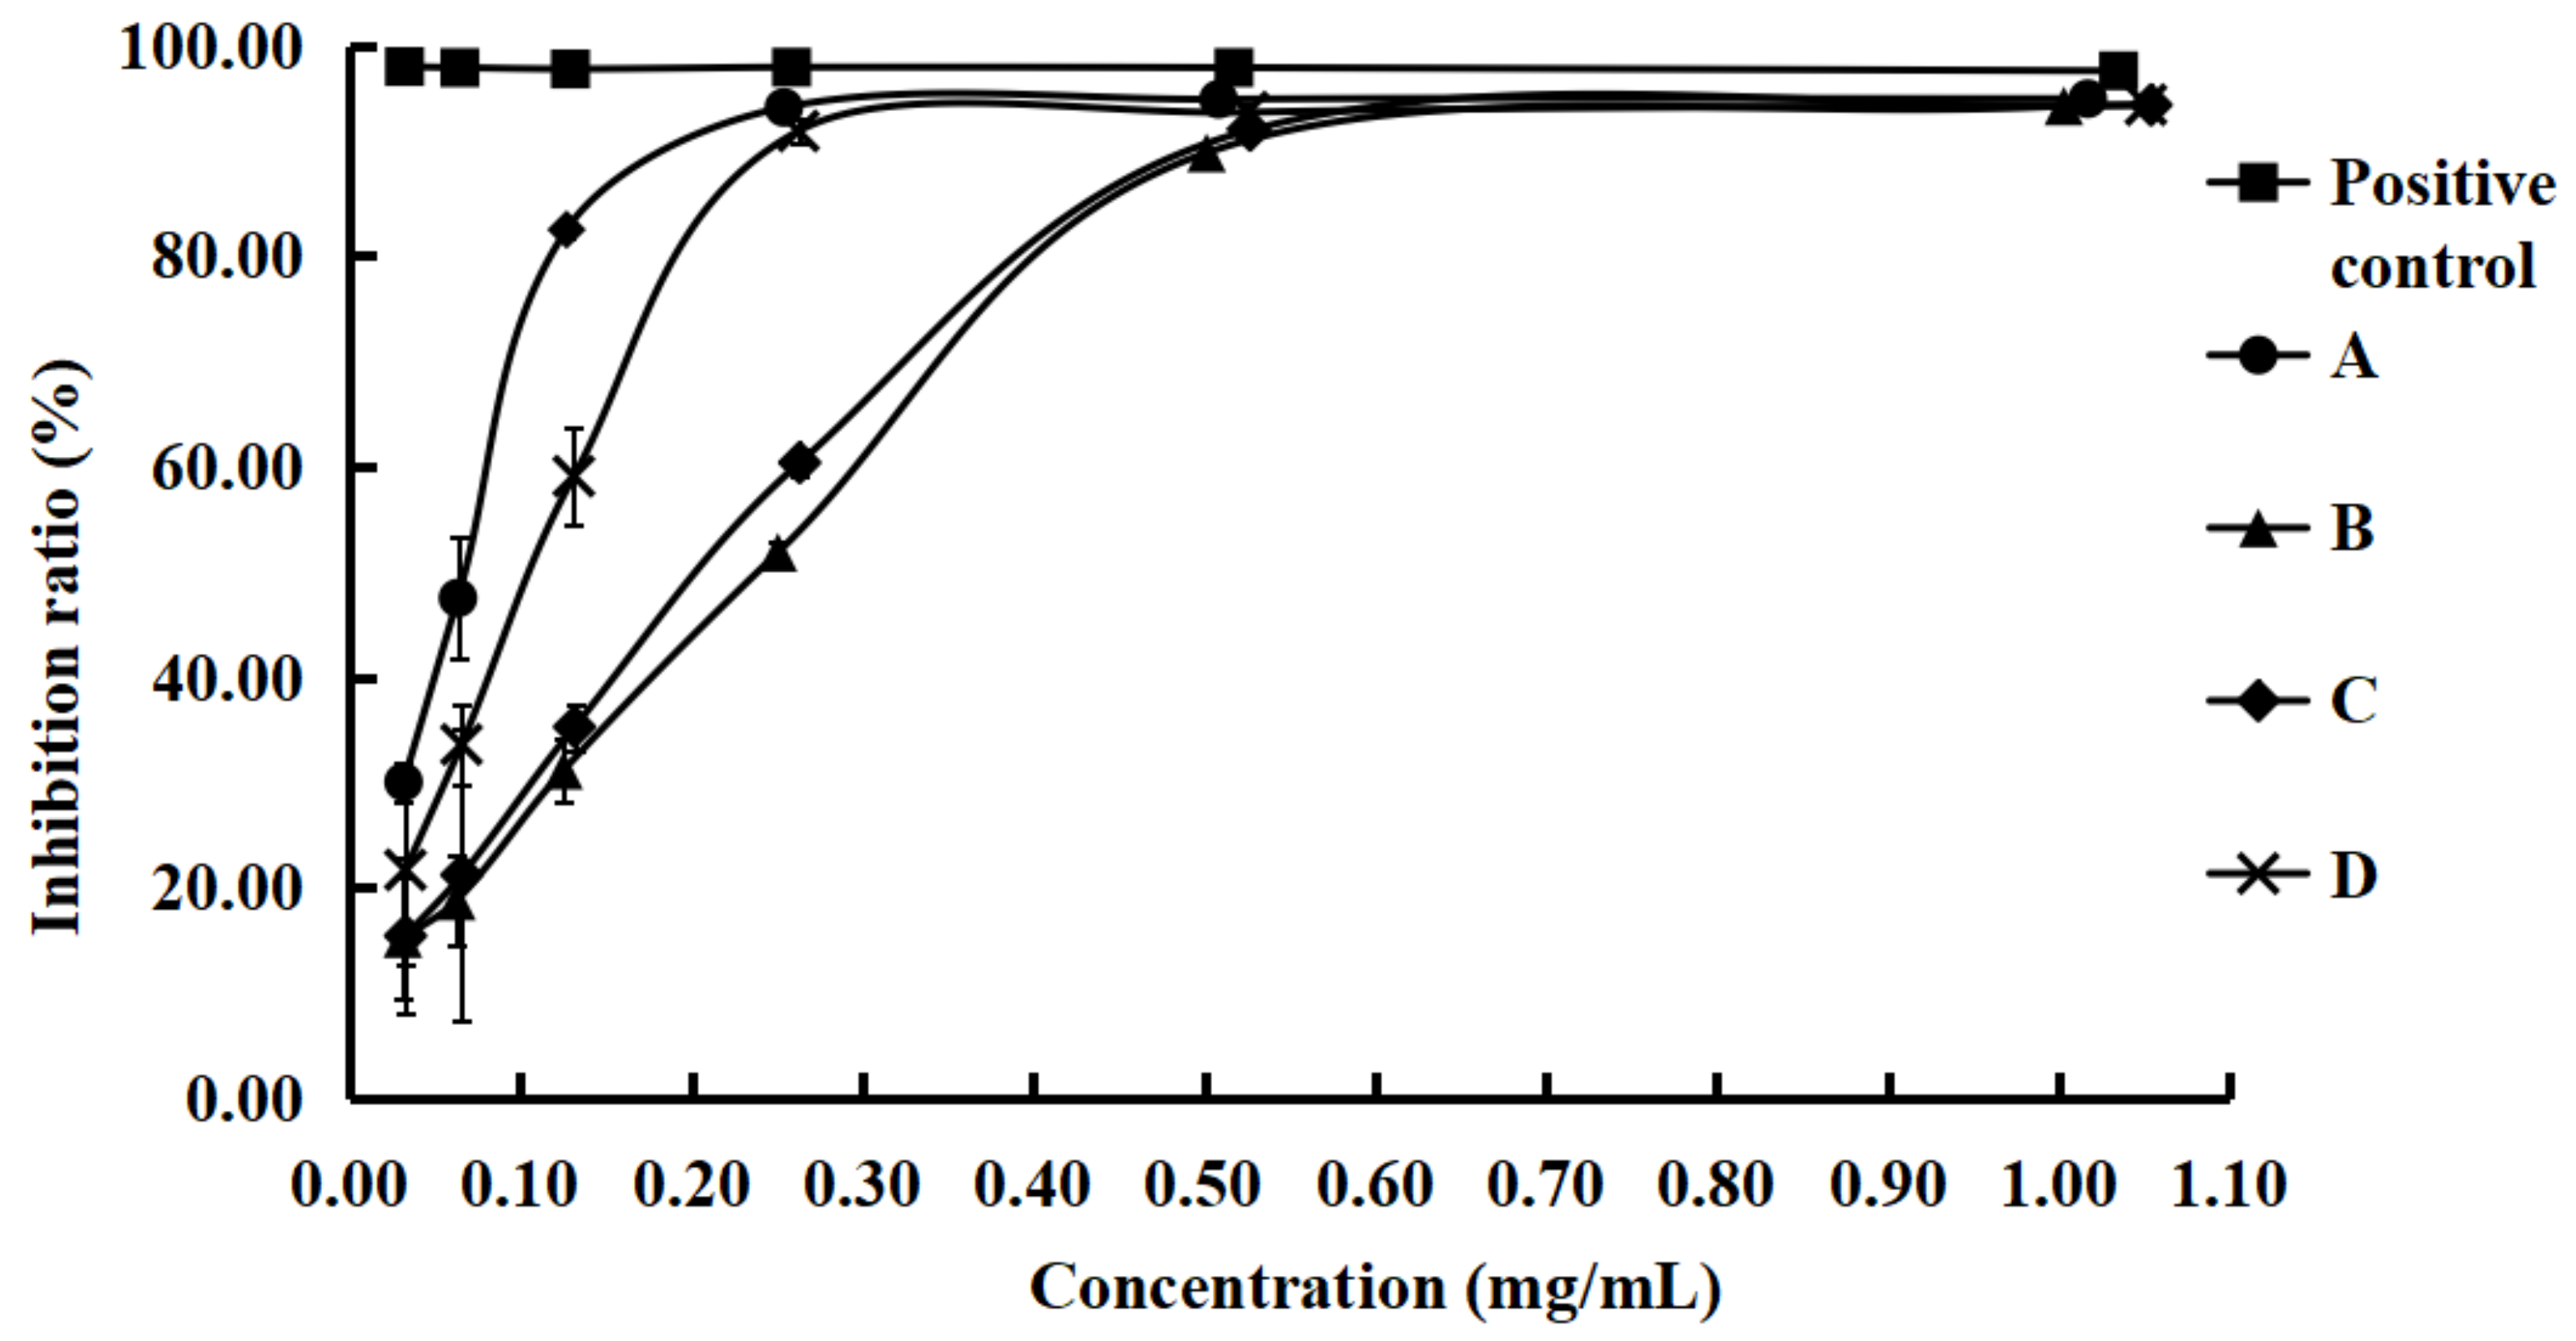
2.5. DPPH Assay and Assays for Total Phenolics
3. Materials and Methods
3.1. Materials and Chemicals
3.2. Sample Preparation
3.2.1. Preparation of Different Batches of Samples
3.2.2. Preparation of QC Samples
3.3. UPLC–Q-TOF-MS Conditions
3.4. Data Processing
3.5. Assay of DPPH Free Radical Scavenging Activity
3.6. Determination of Total Phenolic Content
3.7. Statistical Analysis
4. Conclusions
Supplementary Materials
Author Contributions
Funding
Institutional Review Board Statement
Informed Consent Statement
Data Availability Statement
Acknowledgments
Conflicts of Interest
References
- Vichasilp, C.; Nakagawa, K.; Sookwong, P.; Higuchi, O.; Luemunkong, S.; Miyazawa, T. Development of high 1-deoxynojirimycin (DNJ) content mulberry tea and use of response surface methodology to optimize tea-making conditions for highest DNJ extraction. LWT-Food Sci. Technol. 2012, 45, 226–232. [Google Scholar] [CrossRef]
- Hu, X.Q.; Jiang, L.; Zhang, J.G.; Deng, W.; Wang, H.L.; Wei, Z.J. Quantitative determination of 1-deoxynojirimycin in mulberry leaves from 132 varieties. Ind. Crop. Prod. 2013, 49, 782–784. [Google Scholar] [CrossRef]
- Yu, Y.; Li, H.; Zhang, B.; Wang, J.; Shi, X.; Huang, J.; Yang, J.; Zhang, Y.; Deng, Z. Nutritional and functional components of mulberry leaves from different varieties: Evaluation of their potential as food materials. Int. J. Food Prop. 2018, 21, 1495–1507. [Google Scholar] [CrossRef] [Green Version]
- Jia, Z.S.; Tang, M.C.; Wu, J.M. The determination of flavonoid contents in mulberry and their scavenging effects on superoxide radicals. Food Chem. 1999, 64, 555–559. [Google Scholar]
- Gryn-Rynko, A.; Bazylak, G.; Olszewska-Slonina, D. New potential phytotherapeutics obtained from white mulberry (Morus alba L.) leaves. Biomed. Pharmacother. 2016, 84, 628–636. [Google Scholar] [CrossRef] [PubMed]
- Arabshahi-Delouee, S.; Urooj, A. Antioxidant properties of various solvent extracts of mulberry (Morus indica L.) leaves. Food Chem. 2007, 102, 1233–1240. [Google Scholar] [CrossRef]
- Katsube, T.; Imawaka, N.; Kawano, Y.; Yamazaki, Y.; Shiwaku, K.; Yamane, Y. Antioxidant flavonol glycosides in mulberry (Morus alba L.) leaves isolated based on LDL antioxidant activity. Food Chem. 2006, 97, 25–31. [Google Scholar] [CrossRef]
- Lawal, U.; Leong, S.W.; Shaari, K.; Ismail, I.S.; Khatib, A.; Abas, F. α-Glucosidase inhibitory and antioxidant activities of different ipomoea aquatica cultivars and LC-MS/MS profiling of the active cultivar. J. Food Biochem. 2017, 41, e12303. [Google Scholar] [CrossRef]
- Park, E.; Lee, S.-M.; Lee, J.E.; Kim, J.-H. Anti-inflammatory activity of mulberry leaf extract through inhibition of NF-κB. J. Funct. Foods 2013, 5, 178–186. [Google Scholar] [CrossRef]
- Gao, X.H.; Zhang, S.D.; Wang, L.T.; Yu, L.; Zhao, X.L.; Ni, H.Y.; Wang, Y.Q.; Wang, J.D.; Shan, C.H.; Fu, Y.J. Anti-inflammatory effects of neochlorogenic acid extract from mulberry leaf (Morus alba L.) against LPS-stimulated inflammatory response through mediating the AMPK/Nrf2 signaling pathway in A549 cells. Molecules 2020, 25, 1385. [Google Scholar] [CrossRef] [Green Version]
- Lim, H.H.; Lee, S.O.; Kim, S.Y.; Yang, S.J.; Lim, Y. Anti-inflammatory and antiobesity effects of mulberry leaf and fruit extract on high fat diet-induced obesity. Exp. Biol. Med. 2013, 238, 1160–1169. [Google Scholar] [CrossRef] [PubMed]
- Chen, J.J.; Liu, F.; Liao, S.T.; Sun, Y.M.; Zou, Y.X.; Wu, Y.M. Study on antibacterial activity and stability of extracts from mulberry (Morus alba L.) leaves. Sci. Technol. Food Ind. 2012, 33, 88–91. [Google Scholar]
- Yang, N.-C.; Jhou, K.-Y.; Tseng, C.-Y. Antihypertensive effect of mulberry leaf aqueous extract containing γ-aminobutyric acid in spontaneously hypertensive rats. Food Chem. 2012, 132, 1796–1801. [Google Scholar] [CrossRef]
- Chan, K.C.; Yang, M.Y.; Lin, M.C.; Lee, Y.J.; Chang, W.C.; Wang, C.J. Mulberry leaf extract inhibits the development of atherosclerosis in cholesterol-fed rabbits and in cultured aortic vascular smooth muscle cells. J. Agric. Food Chem. 2013, 61, 2780–2788. [Google Scholar] [CrossRef] [PubMed]
- Kim, S.Y.; Gao, J.J.; Kang, H.K. Two flavonoids from the leaves of Morus alba induce differentiation of the human promyelocytic leukemia (HL-60) cell line. Biol. Pharm. Bull. 2000, 23, 451–455. [Google Scholar] [CrossRef]
- Kimura, T.; Nakagawa, K.; Satto, Y.; Yamagishi, K.; Suzuki, M.; Yamaki, K.; Shinmoto, H.; Miyazawa, T. Determination of 1-deoxynojirimycin in mulberry leaves using hydrophilic interaction chromatography with evaporative light scattering detection. J. Agric. Food Chem. 2004, 52, 1415–1418. [Google Scholar] [CrossRef]
- Basnet, P.; Kadota, S.; Terashima, S.; Shimizu, M.; Namba, T. Two new 2-arylbenzofuran derivatives from hypoglycemic activity-bearing fractions of Morus insignis. Chem. Pharm. Bull. 1993, 41, 1238–1243. [Google Scholar] [CrossRef] [Green Version]
- Asano, N.; Tomioka, E.; Kizu, H.; Matsui, K. Sugars with nitrogen in the ring isolated from the leaves of Morus bombycis. Carbohyd. Res. 1994, 253, 235–245. [Google Scholar] [CrossRef]
- Wang, F.; Li, J.R. Research progress on chemical constituents, physiological function and application of mulberry leaves. Food Sci. 2005, 26, 111–117. [Google Scholar]
- Ouyang, Z.; Chen, J.; Li, Y.H. Separation, purification and composition analysis of polysaccharides in leaves of Morus alba L. Food Sci. 2005, 26, 181–184. [Google Scholar]
- Zou, Y.; Liao, S.; Shen, W.; Liu, F.; Tang, C.; Chen, C.Y.; Sun, Y. Phenolics and antioxidant activity of mulberry leaves depend on cultivar and harvest month in Southern China. Int. J. Mol. Sci. 2012, 13, 16544–16553. [Google Scholar] [CrossRef] [PubMed]
- Lee, W.J.; Choi, S.W. Quantitative changes of polyphenolic compounds in mulberry (Morus alba L.) leaves in relation to varieties, harvest period, and heat processing. Prev. Nutr. Food Sci. 2012, 17, 280–285. [Google Scholar] [CrossRef] [PubMed] [Green Version]
- Pothinuch, P.; Tongchitpakdee, S. Phenolic analysis for classification of mulberry (Morus spp.) leaves according to cultivar and leaf age. J. Food Quality 2019, 2019, 2807690. [Google Scholar] [CrossRef] [Green Version]
- Sugiyama, M.; Katsube, T.; Koyama, A.; Itamura, H. Seasonal changes in functional component contents in mulberry (Morus alba L.) leaves. Horticult. J. 2017, 86, 534–542. [Google Scholar] [CrossRef] [Green Version]
- Wu, F.A.; Yang, Q.; Wang, J.; Xia, T.; Wang, M.; Wu, T.; Liang, Y.; Fang, S.Q.; Jiang, X. In vitro antioxidant activities of mulberry (Morus alba L.) leaves and mulberry black teas. In Proceedings of the 2009 International Conference of Natural Products and Traditional Medicine 2009; WHO: Geneva, Switzerland; Volume 9, pp. 636–640.
- Gao, J.; Mao, Y.; Xiang, C.; Cao, M.; Ren, G.; Wang, K.; Ma, X.; Wu, D.; Xie, H. Preparation of β-lactoglobulin/gum arabic complex nanoparticles for encapsulation and controlled release of EGCG in simulated gastrointestinal digestion model. Food Chem. 2021, 354, 129516. [Google Scholar] [CrossRef] [PubMed]
- Sanchez-Salcedo, E.M.; Tassotti, M.; Del Rio, D.; Hernandez, F.; Martinez, J.J.; Mena, P. (Poly)phenolic fingerprint and chemometric analysis of white (Morus alba L.) and black (Morus nigra L.) mulberry leaves by using a non-targeted UHPLC-MS approach. Food Chem. 2016, 212, 250–255. [Google Scholar] [CrossRef]
- Nastić, N.; Borrás-Linares, I.; Lozano-Sánchez, J.; Švarc-Gajić, J.; Segura-Carretero, A. Optimization of the extraction of phytochemicals from black mulberry (Morus nigra L.) leaves. J. Ind. Eng. Chem. 2018, 68, 282–292. [Google Scholar] [CrossRef]
- Natic, M.M.; Dabic, D.C.; Papetti, A.; Fotiric Aksic, M.M.; Ognjanov, V.; Ljubojevic, M.; Tesic, Z. Analysis and characterisation of phytochemicals in mulberry (Morus alba L.) fruits grown in Vojvodina, North Serbia. Food Chem. 2015, 171, 128–136. [Google Scholar] [CrossRef]
- Yu, Y.; Zhang, B.; Xia, Y.; Li, H.; Shi, X.; Wang, J.; Deng, Z. Bioaccessibility and transformation pathways of phenolic compounds in processed mulberry (Morus alba L.) leaves after in vitro gastrointestinal digestion and faecal fermentation. J. Funct. Foods 2019, 60, 103406–103415. [Google Scholar] [CrossRef]
- Saez, V.; Riquelme, S.; Baer, D.V.; Vallverdu-Queralt, A. Phenolic profile of grape canes: Novel compounds identified by LC-ESI-LTQ-Orbitrap-MS. Molecules 2019, 24, 3763. [Google Scholar] [CrossRef] [Green Version]
- Bao, T.; Xu, Y.; Gowd, V.; Zhao, J.; Xie, J.; Liang, W.; Chen, W. Systematic study on phytochemicals and antioxidant activity of some new and common mulberry cultivars in China. J. Funct. Foods 2016, 25, 537–547. [Google Scholar] [CrossRef]
- Bakr, R.O.; Mohamed, S.A.E.H.; Ayoub, N. Phenolic profile of Centaurea aegyptiaca L. growing in Egypt and its cytotoxic and antiviral activities. Afr. J. Tradit. Complement Altern Med. 2016, 13, 135–143. [Google Scholar] [CrossRef] [PubMed]
- Wang, C.; Dai, S.; Gong, L.; Fu, K.; Ma, C.; Liu, Y.; Zhou, H.; Li, Y. A review of pharmacology, toxicity and pharmacokinetics of 2,3,5,4′-tetrahydroxystilbene-2-O-β-D-glucoside. Front. Pharmacol. 2022, 12, 791214. [Google Scholar] [CrossRef] [PubMed]
- Qin, Y.; Gao, B.; Shi, H.; Cao, J.; Yin, C.; Lu, W.; Yu, L.; Cheng, Z. Characterization of flavonol mono-, di-, tri- and tetra- O -glycosides by ultra-performance liquid chromatography-electrospray ionization-quadrupole time-of-flight mass spectrometry and its application for identification of flavonol glycosides in Viola tianschanica. J. Pharmaceut. Biomed. 2017, 142, 113–124. [Google Scholar]
- Zhou, F.; Zhao, Y.; Peng, J.; Jiang, Y.; Li, M.; Jiang, Y.; Lu, B. Origin discrimination of Osmanthus fragrans var. thunbergii flowers using GC-MS and UPLC-PDA combined with multivariable analysis methods. Phytochem. Anal. 2017, 28, 305–315. [Google Scholar] [CrossRef]
- Xu, M.; Deng, Y.; Huang, R.; He, Q.; Sun, C. Rapid characterization of compounds in fupo ganmao granules by high-performance liquid chromatography tandem mass spectrometry. J. Pharm. Biomed. Anal. 2019, 176, 112819–112831. [Google Scholar] [CrossRef]
- Wang, C.S.; Chen, C.S.; Yang, T.T.; Lou, F.C. In vitro radix salviae miltiorrhizae action on blood anticoagulation and fibrinogenolysis. Chin. Med. J. 1979, 8, 58–63. [Google Scholar]
- Guo, Z.L.; Liang, X.R.; Xie, Y.Y. Qualitative and quantitative analysis on the chemical constituents in Orthosiphon stamineus Benth. using ultra high-performance liquid chromatography coupled with electrospray ionization tandem mass spectrometry. J. Pharm. Biomed. Anal. 2019, 164, 135–147. [Google Scholar] [CrossRef]
- Quifer-Rada, P.; Vallverdu-Queralt, A.; Martinez-Huelamo, M.; Chiva-Blanch, G.; Jauregui, O.; Estruch, R.; Lamuela-Raventos, R. A comprehensive characterisation of beer polyphenols by high resolution mass spectrometry (LC-ESI-LTQ-Orbitrap-MS). Food Chem. 2015, 169, 336–343. [Google Scholar] [CrossRef]
- Gao, D.; Wang, B.; Huo, Z.; He, Y.; Polachi, N.; Lei, Z.; Liu, X.; Song, Z.; Qi, L.W. Analysis of chemical constituents in an herbal formula Jitong Ning Tablet. J. Pharm. Biomed. Anal. 2017, 140, 301–312. [Google Scholar] [CrossRef]
- Kim, K.-H.; Matsuyama, N. A novel phytoalexin formed in mulberry leaves at the infection of Phloeospora maculans, causal agent of leaf spot. J. Fac. Agr. Kyushu Univ. 1998, 43, 89–93. [Google Scholar] [CrossRef] [PubMed]
- Sun, Y.; Qin, Y.; Li, H.; Peng, H.; Chen, H.; Xie, H.R.; Deng, Z. Rapid characterization of chemical constituents in Radix Tetrastigma, a functional herbal mixture, before and after metabolism and their antioxidant/antiproliferative activities. J. Funct. Foods 2015, 18, 300–318. [Google Scholar] [CrossRef]
- Bushra; Ullah, H.; Khan, D.; Rehman, F.U.; Ahmad, N.; Khan, S. Three new compounds isolated from Bauhinia variegata plant. Pharm. Chem. J. 2021, 55, 76–80. [Google Scholar] [CrossRef]
- Chen, J.; Ni, Y.; Zhang, P.; Liang, X.; Fang, S. Acidic natural deep eutectic solvents as dual solvents and catalysts for the solubilization and deglycosylation of soybean isoflavone extracts: Genistin as a model compound. Food Chem. 2023, 406, 134999. [Google Scholar] [CrossRef] [PubMed]
- Kachlicki, P.; Piasecka, A.; Stobiecki, M.; Marczak, Ł. Structural characterization of flavonoid glycoconjugates and their derivatives with mass spectrometric techniques. Molecules 2016, 21, 1494. [Google Scholar] [CrossRef] [Green Version]
- Liang, X.; Jiang, Y.; Guo, Z.; Fang, S. Separation, UPLC-QTOF-MS/MS analysis, and antioxidant activity of hydrolyzable tannins from water caltrop (Trapa quadrispinosa) pericarps. LWT 2020, 133, 110010. [Google Scholar] [CrossRef]
- Perez de Souza, L.; Alseekh, S.; Naake, T.; Fernie, A. Mass spectrometry-based untargeted plant metabolomics. Curr. Protoc. Plant Biol. 2019, 4, e20100. [Google Scholar] [CrossRef]
- Tsugawa, H.; Cajka, T.; Kind, T.; Ma, Y.; Higgins, B.; Ikeda, K.; Kanazawa, M.; VanderGheynst, J.; Fiehn, O.; Arita, M. MS-DIAL: Data-independent MS/MS deconvolution for comprehensive metabolome analysis. Nat. Methods 2015, 12, 523–526. [Google Scholar] [CrossRef]
- Sarikurkcu, C.; Tepe, B.; Daferera, D.; Polissiou, M.; Harmandar, M. Studies on the antioxidant activity of the essential oil and methanol extract of Marrubium globosum subsp. globosum (lamiaceae) by three different chemical assays. Bioresour. Technol. 2008, 99, 4239–4246. [Google Scholar] [CrossRef]


| No. | RT (min) | Measured m/z | [M − H]− | Theoretical m/z | Error (ppm) | Fragments | Identification |
|---|---|---|---|---|---|---|---|
| Organic acids and vitamin derivatives | |||||||
| 1 | 1.6 | 191.0561 | C7H11O6 | 191.0561 | 0.1 | 137,127 | Quinic acid [27] |
| 2 | 1.7 | 133.0143 | C4H5O5 | 133.0142 | −0.7 | / | L-Malic acid [27] |
| 3 | 2.1 | 337.0781 | C12H17O11 | 337.0776 | −1.3 | 277,174,157,114 | L-Ascorbic acid glucoside [28] |
| 4 | 2.3 | 191.0202 | C6H7O7 | 191.0197 | −2.3 | 111 | Citric acid [28] |
| 5 | 2.8 | 292.1407 | C12H22NO7 | 292.1402 | −1.8 | 130 | N-Fructosyl isoleucine (MS DIAL) |
| 6 | 3.7 | 282.0844 | C10H12N5O5 | 282.0844 | −2.2 | 150,133 | Guanosine (MS DIAL) |
| Phenolic compounds | |||||||
| 7 | 4.0 | 331.0679 | C13H15O10 | 331.0671 | −2.6 | 169,151,125 | Gallic acid glucoside |
| 8 | 5.0 | 315.0724 | C13H15O9 | 315.0722 | −0.8 | 153 | Protocatechuic acid glucoside isomer 1 [28] |
| 9 | 6.3 | 153.0199 | C7H5O4 | 153.0193 | 1.9 | / | Protocatechuic acid [29] |
| 10 | 7.8 | 315.0730 | C13H15O9 | 315.0722 | 0.3 | 153,152,135,109 | Protocatechuic acid glucoside [28] |
| 11 | 8.4 | 315.0720 | C13H15O9 | 315.0722 | 0.4 | 153,152 | Protocatechuic acid glucoside isomer 2 [28] |
| 12 | 9.8 | 515.1412 | C22H27O14 | 515.1406 | −0.4 | 312,311,221,179,135 | Dicaffeoylquinic acid [30] |
| 13 | 10.2 | 359.0990 | C15H19O10 | 359.0984 | −1.6 | 197,179,166,153,135,123 | Syringic acid hexoside [31] |
| 14 | 11.4 | 353.0881 | C16H17O9 | 353.0878 | −0.9 | 191,179,135 | 3-O-Caffeoylquinic acid [29] |
| 15 | 12.6 | 339.0733 | C15H15O9 | 339.0722 | −3.4 | 177 | Aesculin [29] |
| 16 | 12.9 | 299.0772 | C13H15O8 | 299.0772 | 0.1 | 137 | Hydroxybenzoyl hexoside [31] |
| 17 | 13.3 | 515.1412 | C22H27O14 | 515.1406 | −1.1 | 324,323, 191,161 | 3,5-dicaffeoylquinic acid [32] |
| 18 | 14.0 | 339.0731 | C15H15O9 | 339.0722 | −2.9 | 177 | Aesculin isomer 1 [28] |
| 22 | 14.6 | 353.0883 | C16H17O9 | 353.0878 | −1.5 | 191 | Chlorogenic acid a |
| 23 | 15.5 | 353.0878 | C16H17O9 | 353.0878 | 0.0 | 191,179,173,135 | 5-O-Caffeoylquinic acid [29] |
| 64 | 33.3 | 315.1246 | C18H19O5 | 315.1238 | −2.5 | 175,163,160,148,135 | Protocatechuic acid hexoside [33] |
| Flavonoids | |||||||
| 19 | 14.2 | 465.1050 | C21H21O12 | 465.1038 | −2.5 | 343,303,299,286,285,275,181,179,177,153,151,125 | Taxifolin-O-glucoside [32] |
| 21 | 14.4 | 639.2878 | C28H47O16 | 639.2870 | −1.3 | 550,549,387,179,161,149,119 | Quercetin C-hexoside glucuronide [33] |
| 24 | 16.1 | 625.1407 | C27H29O17 | 625.1410 | 0.5 | 464,463,462,301,299 | Quercetin hexosylhexoside [29] |
| 25 | 16.4 | 431.1928 | C20H31O10 | 431.1923 | −1.3 | 387,315,297,153,152 | Apigenin hexoside [33] |
| 27 | 17.2 | 449.1098 | C21H21O11 | 449.1089 | −1.9 | 287,269,260,259,179,151,125 | Cyanidin hexoside [29] |
| 28 | 17.4 | 431.1931 | C20H31O10 | 431.1923 | −1.9 | 153,152 | Apigenin C-glucoside [29] |
| 30 | 17.9 | 611.1614 | C27H31O16 | 611.1618 | 0.5 | 241 | Taxifolin-O-rutinoside [32] |
| 31 | 18.0 | 711.1422 | C30H31O20 | 711.1414 | −1.1 | 668,667,505,463,462,301,299 | Quercetin malonyl-dihexoside [27] |
| 32 | 18.4 | 609.1462 | C27H29O16 | 609.1461 | −0.1 | 448,447,446,286,285,284,283 | Kaempferol hexosylhexoside [29] |
| 34 | 19.7 | 405.1200 | C20H21O9 | 405.1191 | −2.2 | 243,225,201,199,175 | 2,3,5,4′-Tetrahydroxystilbene-2-O-β-D-glucoside [34] |
| 37 | 21.1 | 625.1411 | C27H29O17 | 625.1410 | −0.2 | 301,300 | Quercetin di-O-glucoside [28] |
| 38 | 21.5 | 463.0895 | C21H19O12 | 463.0882 | −2.7 | 302,301,300,151 | Quercetin 3-O-hexoside [29] |
| 39 | 22.6 | 285.0772 | C16H13O5 | 285.0768 | −1.4 | 268,267,255,225,213,211,187,183,171 | Kaempferol a |
| 40 | 22.9 | 609.1472 | C27H29O16 | 609.1461 | −1.8 | 285,284 | Kaempferol 3-O-sophoroside [35] |
| 41 | 23.7 | 609.1473 | C27H29O16 | 609.1461 | −1.9 | 302,301,300 | Rutin a |
| 42 | 24.4 | 463.0884 | C21H19O12 | 463.0882 | −0.3 | 301,300 | Isoquercitrin a [28] |
| 43 | 25.6 | 549.0897 | C24H21O15 | 549.0886 | −2.0 | 301,300 | Quercetin 3-O-malonyl-glucoside [27] |
| 44 | 25.6 | 505.0998 | C23H21O13 | 505.0988 | −2.1 | 301,300 | Quercetin-3-O-glucosyl-6″-acetate [28] |
| 45 | 25.5 | 593.1523 | C27H29O15 | 593.1512 | −1.9 | 286,285,284 | Kaempferol-3-O-rutinoside [28] |
| 47 | 26.2 | 447.0942 | C21H19O11 | 447.0933 | −2.1 | 285,284,255,227 | Kaempferol-3-O-glucoside [28] |
| 48 | 27.4 | 489.1042 | C23H21O12 | 489.1038 | −0.6 | 286,285,284 | Kaempferol-3-O-6″-O-acetyl-B-D-glucopyranoside [28] |
| 49 | 27.4 | 533.0940 | C24H21O14 | 533.0937 | −0.6 | 286,285,284 | Kaempferol-malonyl-glucoside [30] |
| 50 | 27.7 | 489.1048 | C23H21O12 | 489.1038 | −1.9 | 285,284 | Kaempferol-acetyl-glucoside [30] |
| 51 | 27.9 | 521.1313 | C24H25O13 | 521.1301 | −2.4 | 353,315,223,205,191,190,153,152 | Quercetagenin acetyl hexoside [33] |
| 52 | 28.8 | 477.1781 | C24H29O10 | 477.1766 | −3.1 | 316,315,180,179,165,161,153,149,135 | Isorhamnetin 3-O-hexoside [33] |
| 53 | 28.8 | 523.1838 | C25H31O12 | 523.1821 | −3.2 | 316,315,179,165,161,153 | Ligustroside [36] |
| 54 | 30.4 | 301.0355 | C15H9O7 | 301.0354 | −0.3 | 151,121 | Quercetin [28] |
| 55 | 29.3 | 463.1620 | C23H27O10 | 463.1610 | −2.2 | 300,194,193 | Quercetin-O-hexoside [33] |
| 56 | 29.8 | 477.1773 | C24H29O10 | 477.1766 | −1.3 | 315,193,179,135 | Quercetin glucuronide [33] |
| 58 | 30.3 | 519.1870 | C26H31O11 | 519.1872 | 0.3 | 317,316,315,193,179,175,165,161,153,149,135 | Isorhamnetin acetyl hexoside [33] |
| 60 | 30.9 | 519.1890 | C26H31O11 | 519.1872 | −3.6 | 310,309,307,297,193,135 | Matairesinoside [37] |
| Fatty acid derivatives | |||||||
| 61 | 31.8 | 327.2168 | C18H31O5 | 327.2177 | 2.7 | 229,211,183,171 | Trihydroxy-octadecadienoic acid [28] |
| 63 | 32.6 | 329.2344 | C18H33O5 | 329.2333 | −3.3 | 267,256,255,229,213,211,187,183,171,139 | Trihydroxy-octadecenoic acid [28] |
| 65 | 35.3 | 309.2055 | C18H29O4 | 309.2071 | 5.4 | 171,137 | Linolenic acid hydroperoxide isomer 1 [28] |
| 70 | 37.8 | 293.2126 | C18H29O3 | 293.2122 | −1.4 | 276,275,235,183,172,171,121 | Hydroxy-octadecatrienoic acid [28] |
| 75 | 42.6 | 277.2173 | C18H29O2 | 277.2173 | −0.1 | / | Linolenic acid [28] |
| 77 | 44.2 | 279.2330 | C18H31O2 | 279.2330 | −0.3 | / | Linoleic acid [28] |
| Quinonoids | |||||||
| 66 | 35.8 | 309.1138 | C19H17O4 | 309.1132 | −2.0 | 286,254,209 | Tanshinone IIB [38] |
| 68 | 36.6 | 307.0977 | C19H15O4 | 307.0976 | −0.5 | 289,279,277,265,263,261,248,247,224,223,157 | Tanshinoldehyde [39] |
| Terpenoids | |||||||
| 67 | 36.3 | 339.1237 | C20H19O5 | 339.1238 | 0.3 | 307,292,291,203,199,177,161,135,122 | 8-Prenylnaringenin [40] |
| 69 | 37.3 | 339.1610 | C21H23O4 | 339.1602 | −2.3 | 204,203,177,149,148,134 | 6-Prenylnaringenin [41] |
| 71 | 38.1 | 339.1613 | C21H23O4 | 339.1602 | −3.3 | 217,159,147,135 | A novel terpenoid-type phytoalexin [42] |
| Terpene | |||||||
| 73 | 39.8 | 571.2899 | C32H43O9 | 571.2913 | 2.3 | 391,315,283,256,255,241,152 | Ganoderic acid H [43] |
| Lignan | |||||||
| 74 | 40.7 | 353.1771 | C22H25O4 | 353.1758 | −3.6 | 218,217,202,159,149,147,134 | Variegat C [44] |
| Unknown | |||||||
| 20 | 14.4 | 549.2557 | C25H41O13 | 549.2553 | −0.7 | 339 | n.a. b |
| 26 | 16.8 | 399.1308 | C18H23O10 | 399.1297 | −2.7 | 237,220,219,193,175,63 | n.a. |
| 29 | 17.7 | 433.2079 | C20H33O10 | 433.2079 | 0.1 | 387,225,207,189,163,161,153,152,123 | n.a. |
| 33 | 19.0 | 579.2656 | C26H43O14 | 579.2658 | 0.4 | 534,533,369,179,161,149,143,131,119,113 | n.a. |
| 35 | 19.9 | 579.2668 | C26H43O14 | 579.2658 | −1.6 | 313,179,161,149,143,131,119,113 | n.a. |
| 36 | 20.0 | 533.2614 | C25H41O12 | 533.2604 | −1.9 | 195 | n.a. |
| 46 | 25.8 | 579.2083 | C28H35O13 | 579.2096 | 3.8 | 417,402,181 | n.a. |
| 57 | 29.8 | 523.1834 | C25H31O12 | 523.1821 | −3.2 | 316,315,193,135 | n.a. |
| 59 | 30.9 | 477.1782 | C24H29O10 | 477.1766 | −3.3 | 298,297,135 | n.a. |
| 62 | 32.7 | 227.1296 | C12H19O4 | 227.1289 | −3.3 | 183 | n.a. |
| 72 | 38.7 | 647.2305 | C39H35O9 | 647.2287 | −2.9 | 469,360,359,241,227,177 | n.a. |
| 76 | 43.9 | 621.4376 | C36H61O8 | 621.4372 | −0.6 | 311 | n.a. |
| No. | RT (min) | Compound | A&B | A&C | A&D | B&C | B&D | C&D |
|---|---|---|---|---|---|---|---|---|
| 40 | 22.9 | Kaempferol 3-O-sophoroside | ++ | |||||
| 32 | 18.4 | Kaempferol hexosylhexoside | ++ | |||||
| 69 | 37.3 | 6-Prenylnaringenin | ++ | ++ | ||||
| 66 | 35.8 | Tanshinone IIB | -- | + | ||||
| 72 | 38.7 | n.a. | ++ | ++ | ++ | - | ||
| 18 | 14.0 | Aesculin isomer 1 | + | + | + | |||
| 37 | 21.1 | Quercetin di-O-glucoside | + | ++ | ||||
| 30 | 17.9 | Taxifolin-O-rutinoside | + | + | + | |||
| 60 | 30.9 | Matairesinoside | ++ | |||||
| 59 | 30.9 | n.a. | ++ | |||||
| 38 | 21.5 | Quercetin 3-O-hexoside | ++ | |||||
| 64 | 33.3 | Protocatechuic acid hexoside | ++ | |||||
| 58 | 30.3 | Isorhamnetin acetyl hexoside | ++ | - | ||||
| 65 | 35.3 | Linolenic acid hydroperoxide isomer 1 | -- | -- | ||||
| 39 | 22.6 | Kaempferol | + | |||||
| 8 | 5.0 | Protocatechuic acid glucoside isomer 1 | + | |||||
| 51 | 27.9 | Quercetagenin acetyl hexoside | + | - | ||||
| 53 | 28.8 | Ligustroside | + | - | ||||
| 22 | 14.6 | Chlorogenic acid | - | |||||
| 31 | 18.0 | Quercetin malonyl-dihexoside | - | |||||
| 41 | 23.7 | Rutin | ++ | |||||
| 1 | 1.6 | Quinic acid | ++ | |||||
| 63 | 32.6 | Trihydroxy-octadecenoic acid | - | |||||
| 40 | 22.9 | Kaempferol 3-O-sophoroside | ++ | |||||
| 10 | 7.8 | Protocatechuic acid glucoside | + | + |
| Batch | Harvest Time | Average Temperature and Precipitation |
|---|---|---|
| A | December 2019 | 2–11 °C and 46 mm |
| B | March 2020 | 6–14 °C and 132 mm |
| C | April 2020 | 11–20 °C and 107 mm |
| D | May 2020 | 17–26 °C and 120 mm |
Disclaimer/Publisher’s Note: The statements, opinions and data contained in all publications are solely those of the individual author(s) and contributor(s) and not of MDPI and/or the editor(s). MDPI and/or the editor(s) disclaim responsibility for any injury to people or property resulting from any ideas, methods, instructions or products referred to in the content. |
© 2023 by the authors. Licensee MDPI, Basel, Switzerland. This article is an open access article distributed under the terms and conditions of the Creative Commons Attribution (CC BY) license (https://creativecommons.org/licenses/by/4.0/).
Share and Cite
Guo, Z.; Lai, J.; Wu, Y.; Fang, S.; Liang, X. Investigation on Antioxidant Activity and Different Metabolites of Mulberry (Morus spp.) Leaves Depending on the Harvest Months by UPLC–Q-TOF-MS with Multivariate Tools. Molecules 2023, 28, 1947. https://doi.org/10.3390/molecules28041947
Guo Z, Lai J, Wu Y, Fang S, Liang X. Investigation on Antioxidant Activity and Different Metabolites of Mulberry (Morus spp.) Leaves Depending on the Harvest Months by UPLC–Q-TOF-MS with Multivariate Tools. Molecules. 2023; 28(4):1947. https://doi.org/10.3390/molecules28041947
Chicago/Turabian StyleGuo, Zili, Jiangxuan Lai, Yiwen Wu, Sheng Fang, and Xianrui Liang. 2023. "Investigation on Antioxidant Activity and Different Metabolites of Mulberry (Morus spp.) Leaves Depending on the Harvest Months by UPLC–Q-TOF-MS with Multivariate Tools" Molecules 28, no. 4: 1947. https://doi.org/10.3390/molecules28041947