

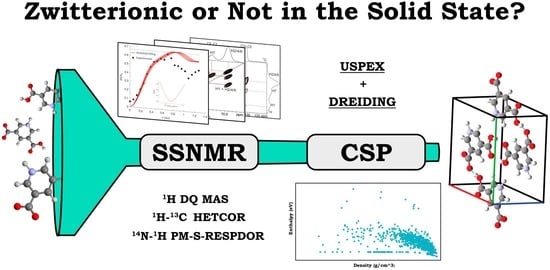
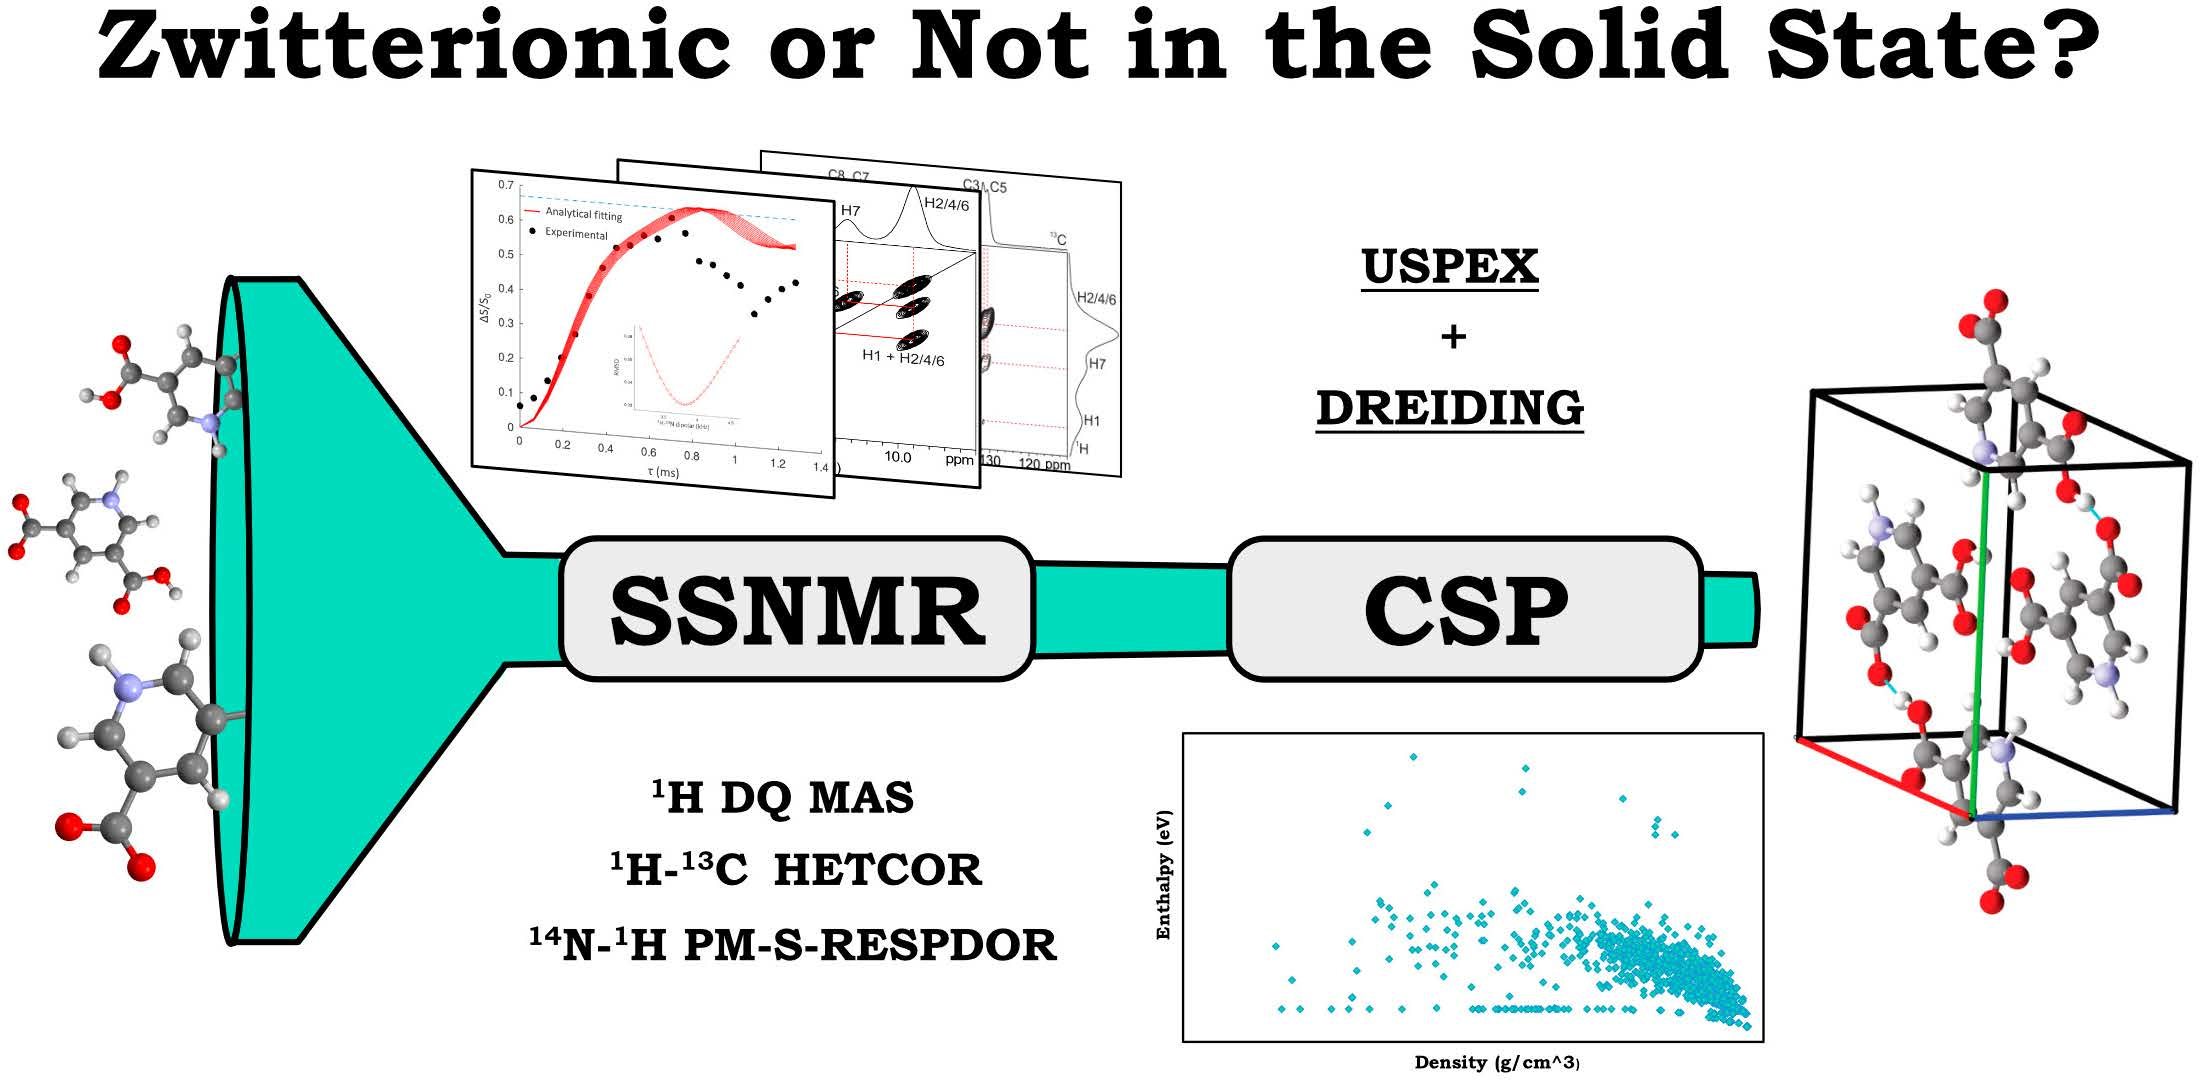
Zwitterionic or Not? Fast and Reliable Structure Determination by Combining Crystal Structure Prediction and Solid-State NMR
 , , , , and
Abstract
:
1. Introduction
- -
- The development of a method for rapid determination of crystal structures of possible zwitterionic systems, with the extent of applicability of this approach being nonetheless much broader than that of zwitterionic systems, since it covers, in general, organic, organometallic and inorganic compounds for which the crystal structure is not available and which have uncertain proton positions;
- -
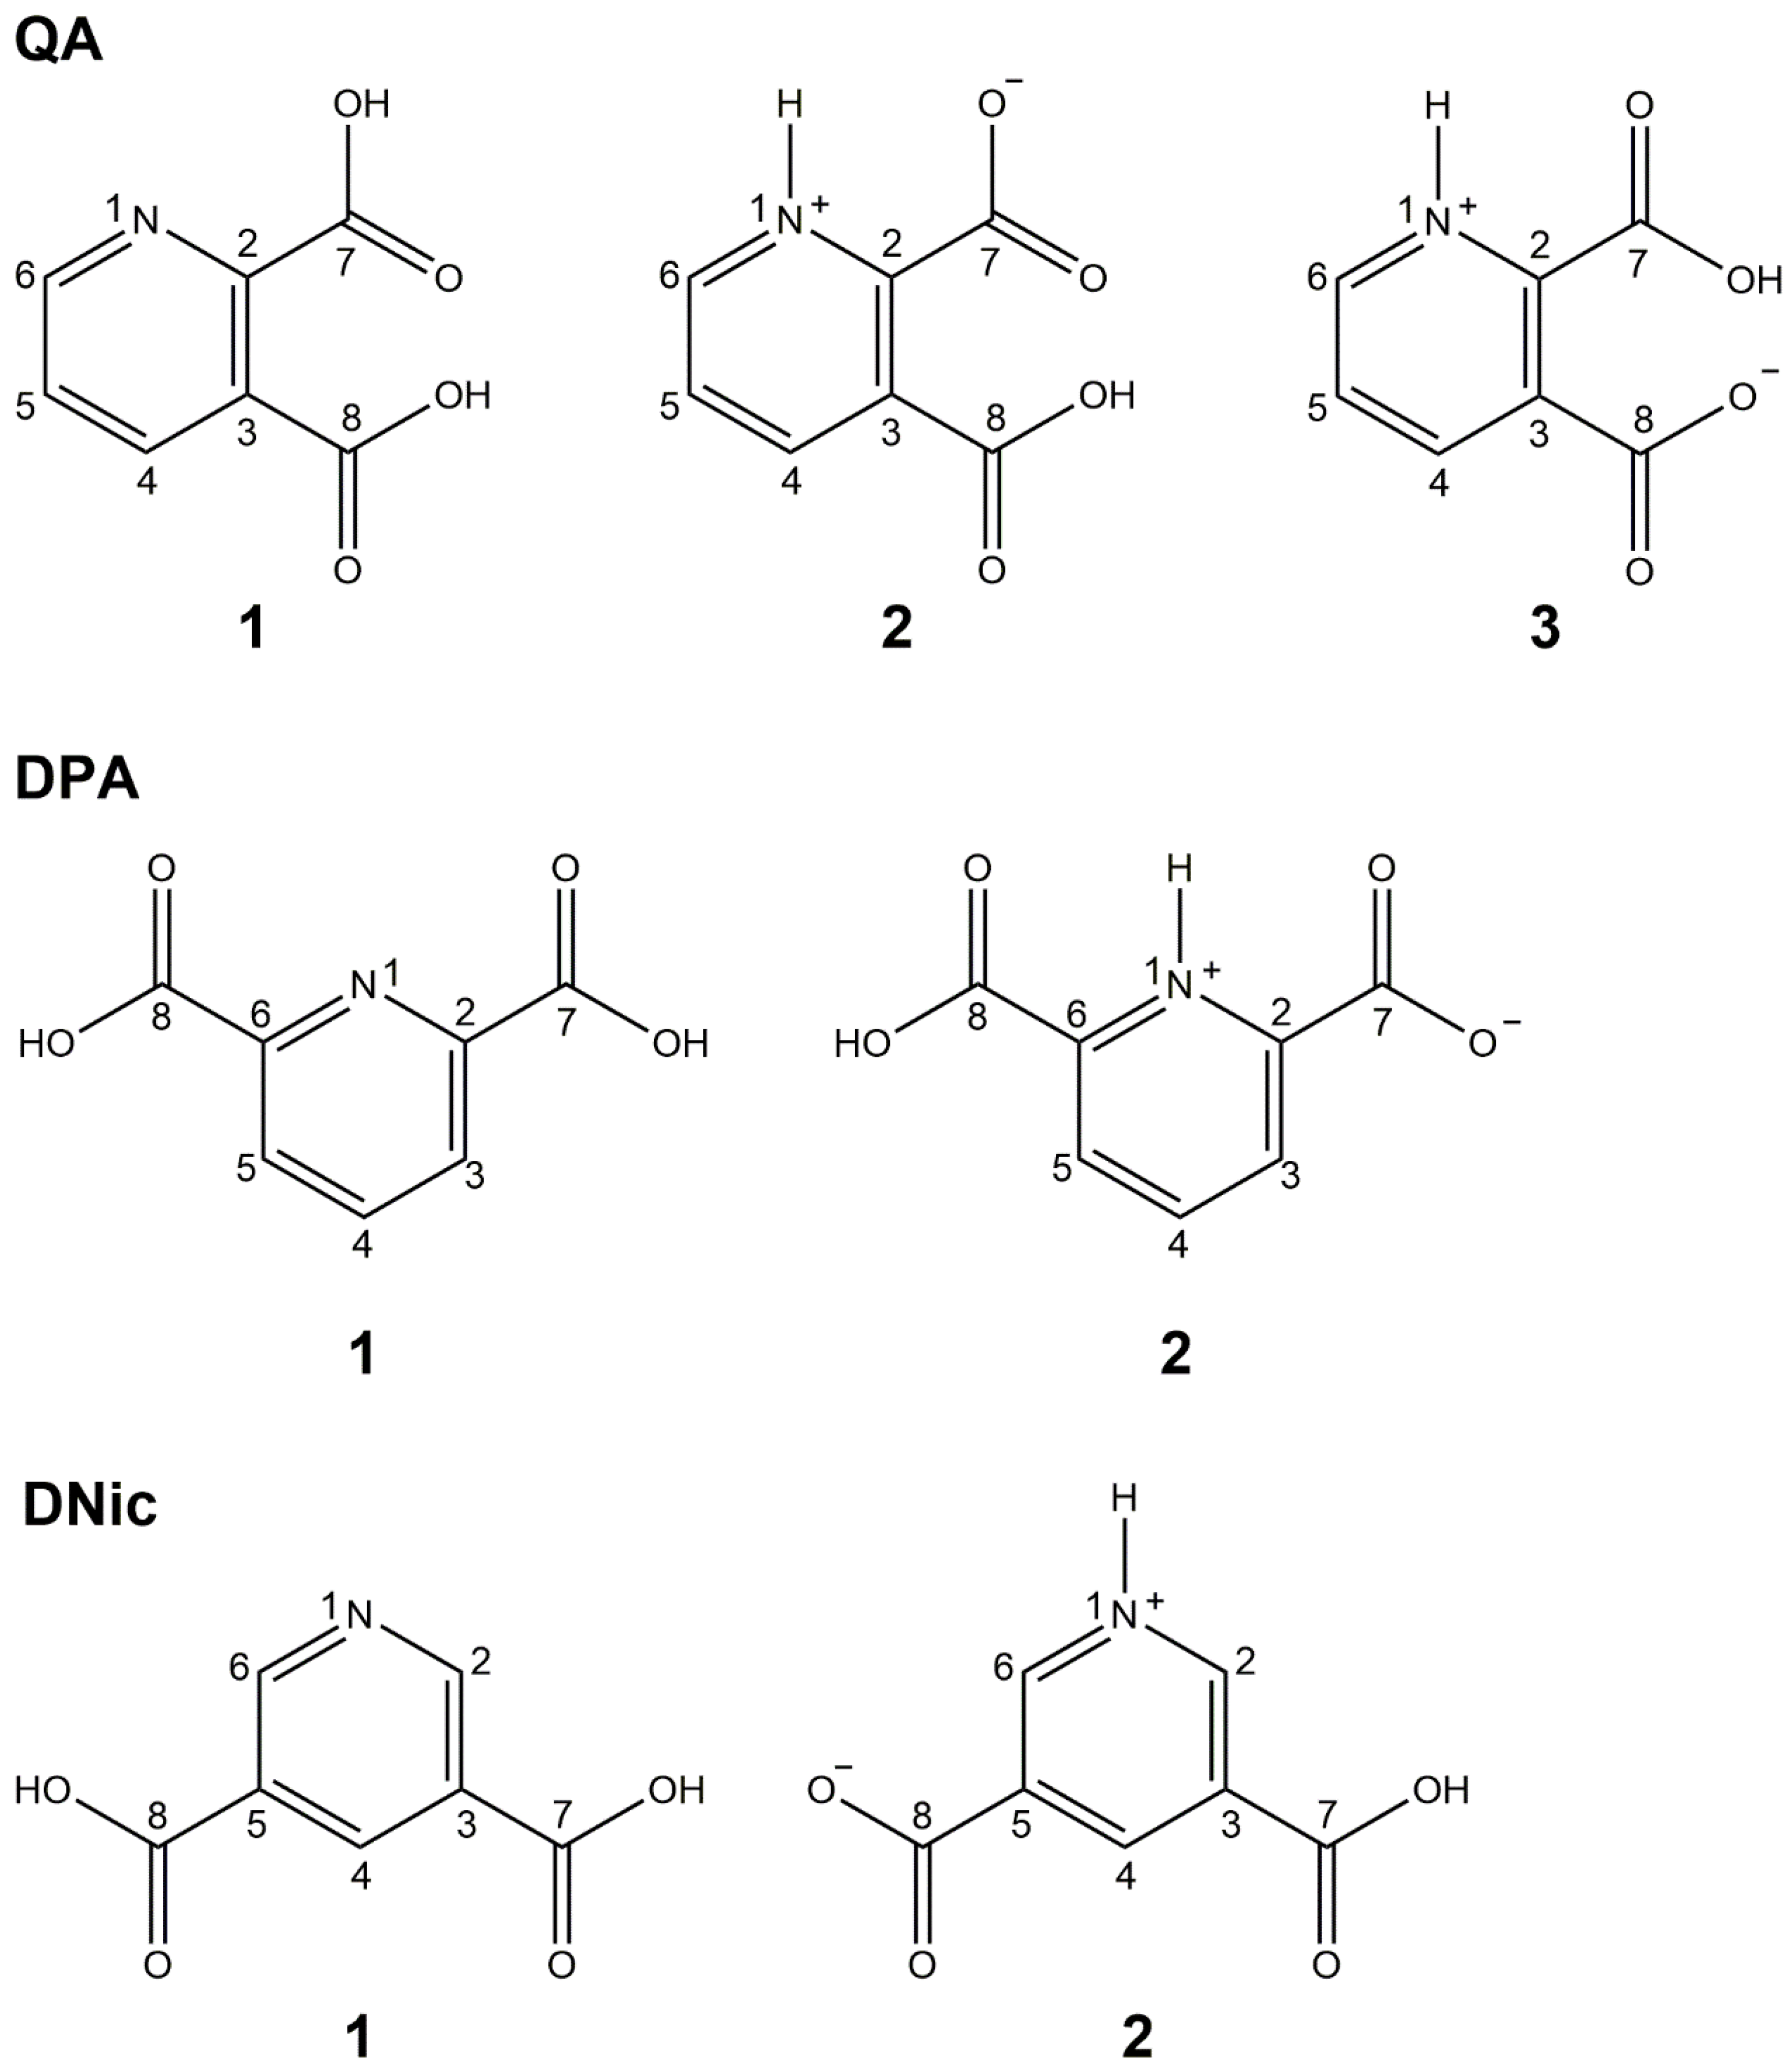
- The unambiguous elucidation of the zwitterionic character of the three structural isomers of pyridine dicarboxylic acid;
- -
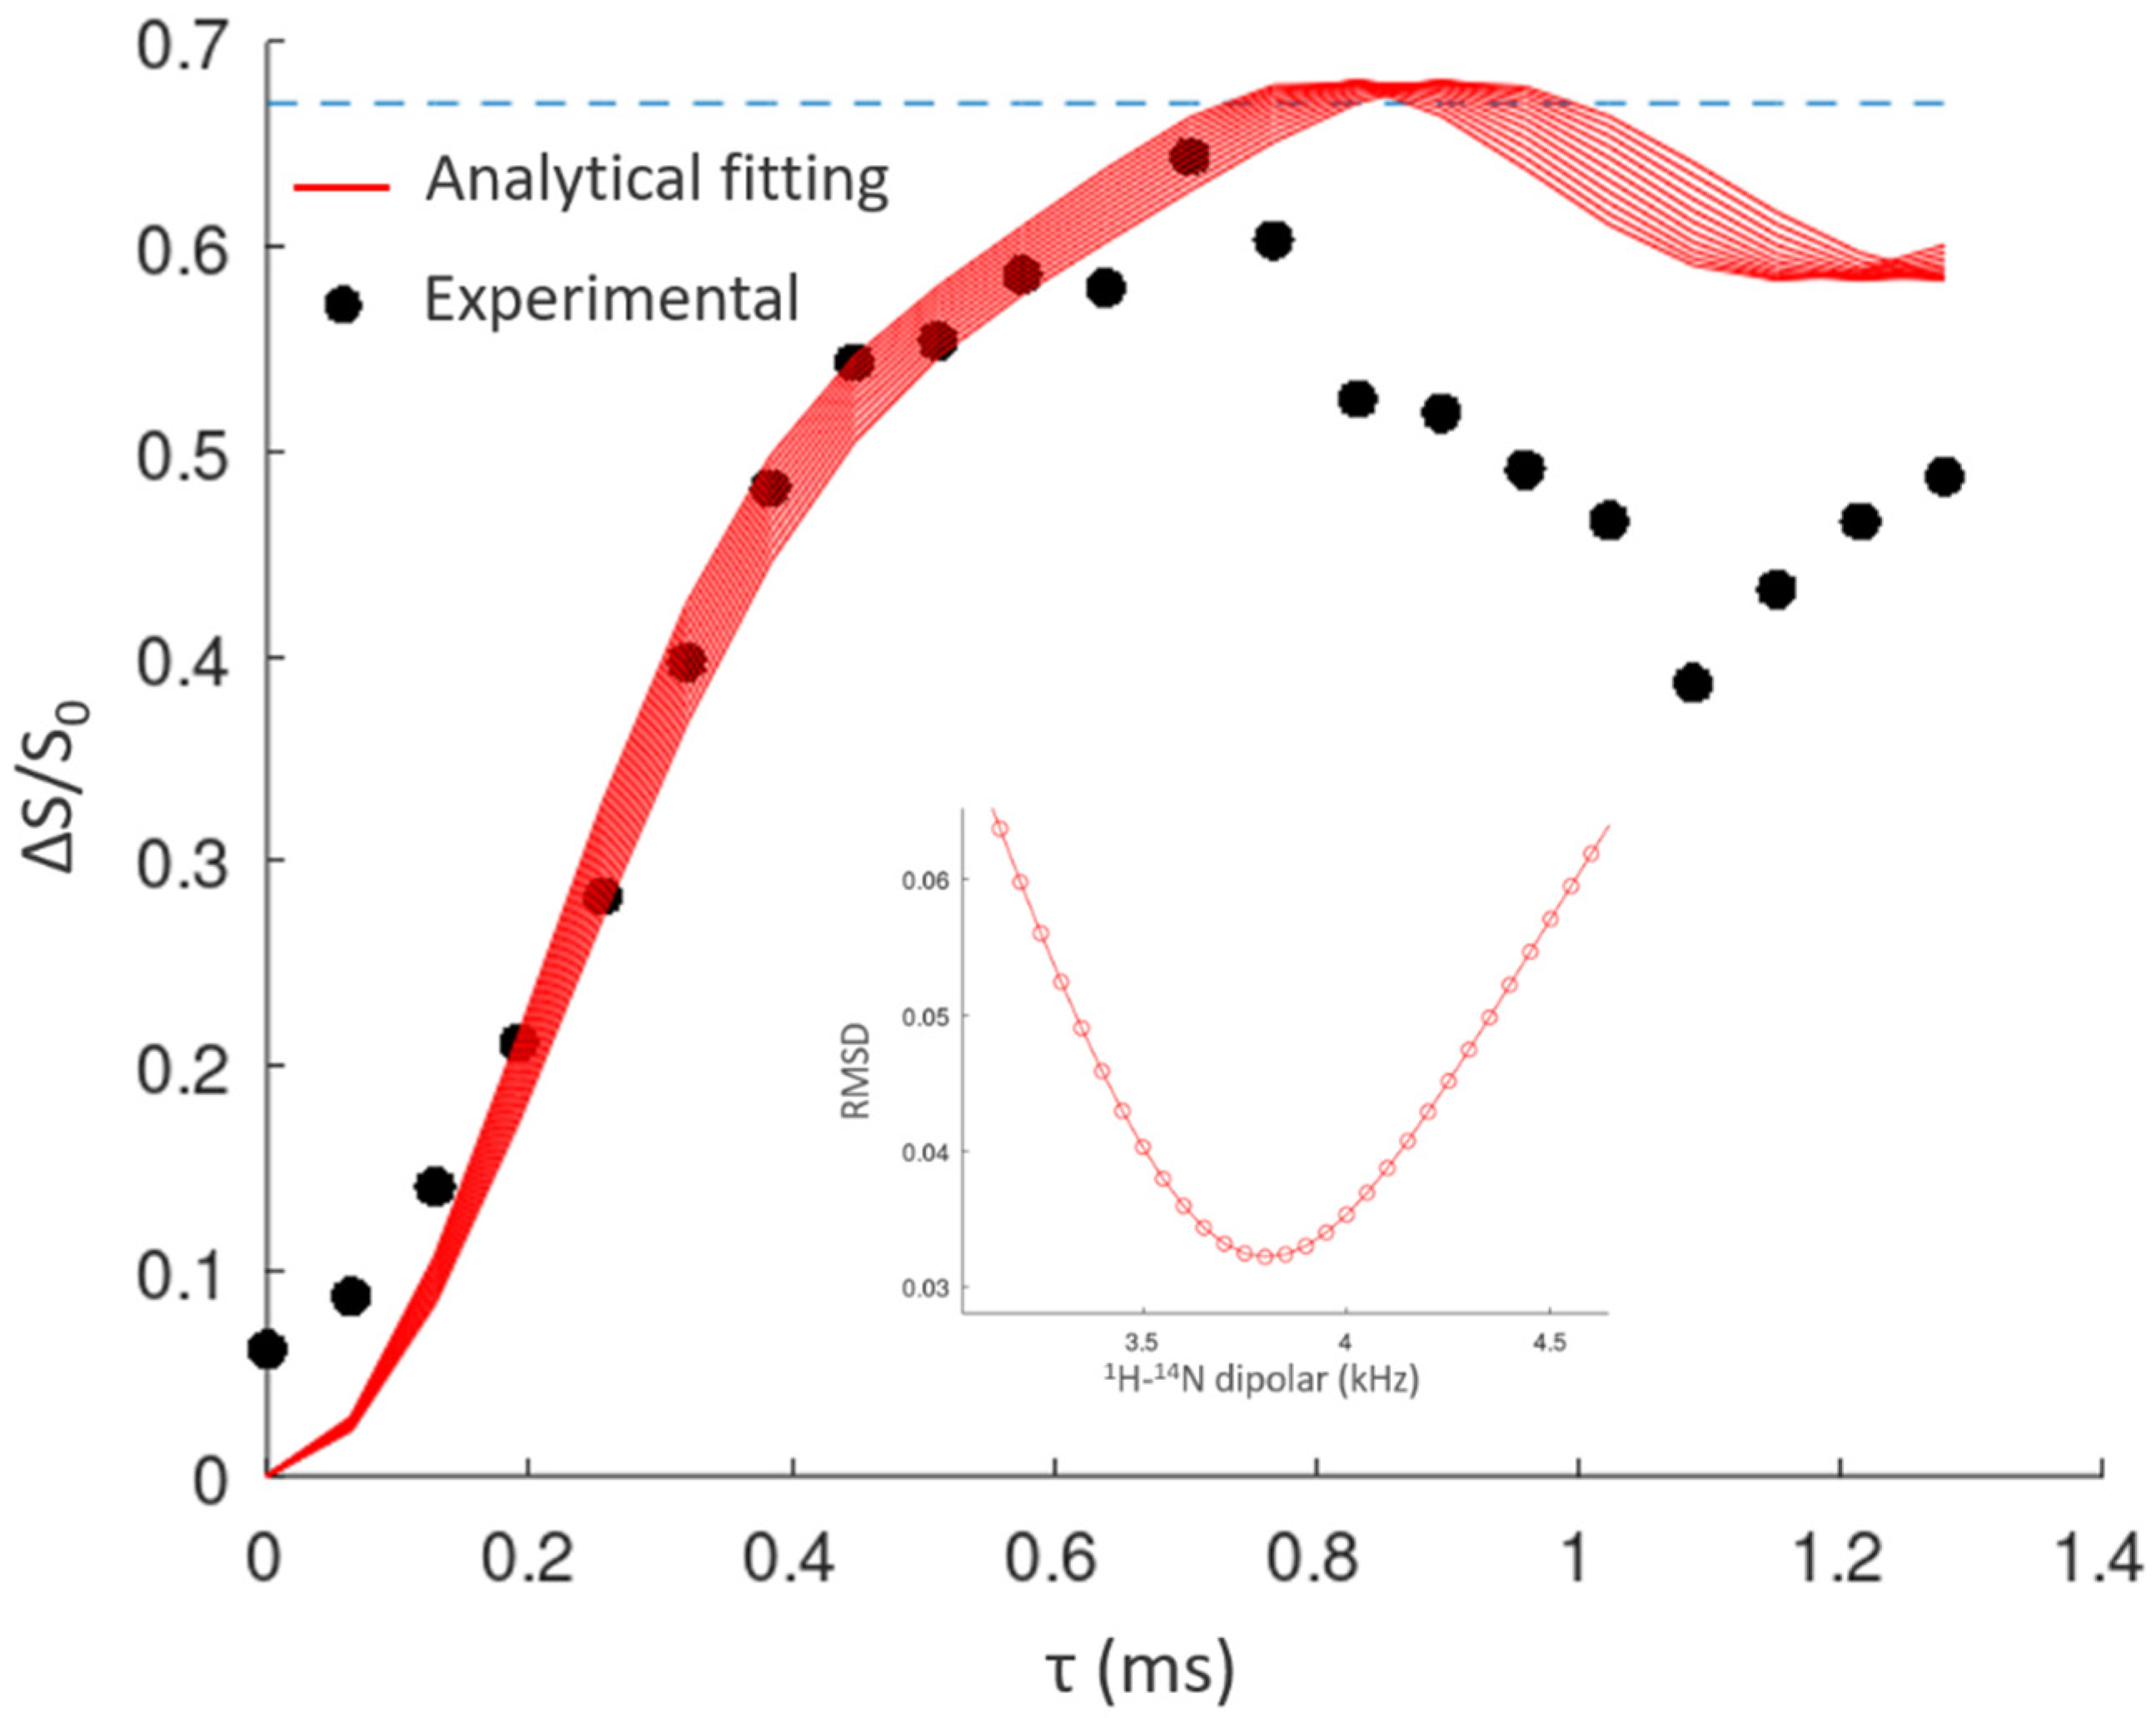
- The evaluation of the “zwitterionic–non-zwitterionic continuum state” in dinicotinic acid with very accurate NMR measurements of the N-H distance. Also in this case, the method can be easily applied to other known situations, such as, for instance, the “salt-cocrystal continuum”.
2. Results and Discussion
2.1. SSNMR Analysis: Zwitterionic Character
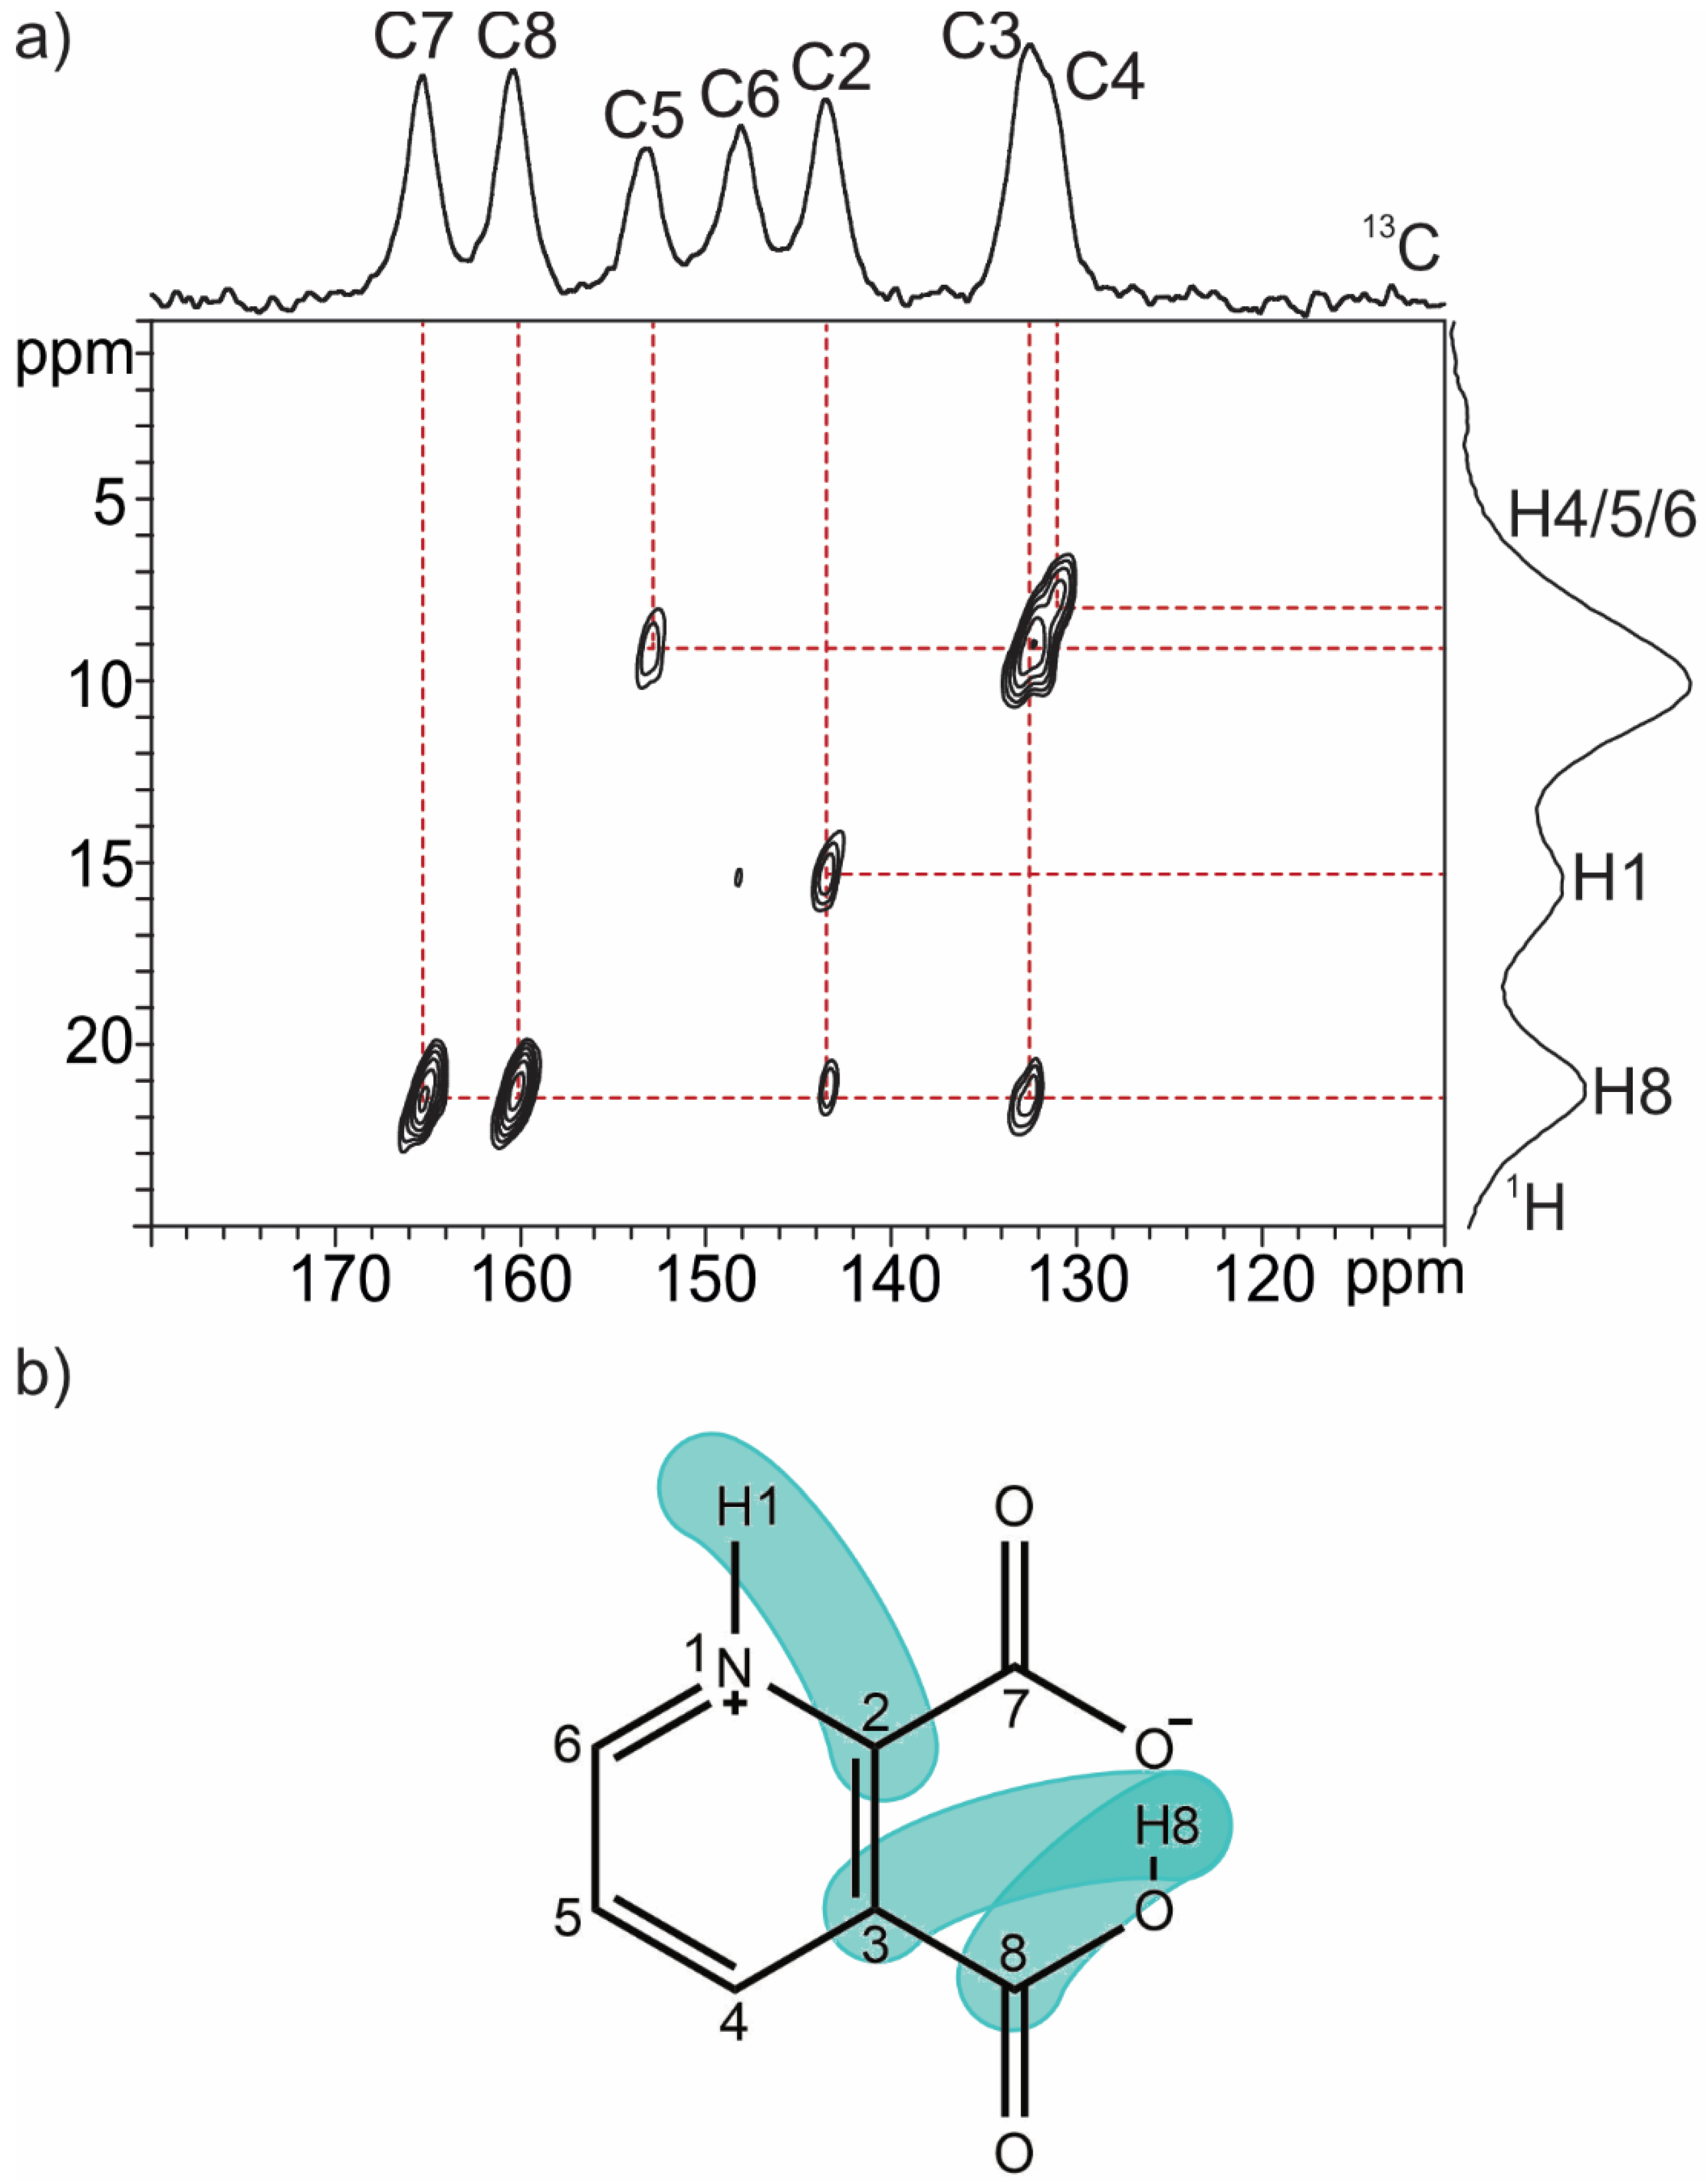
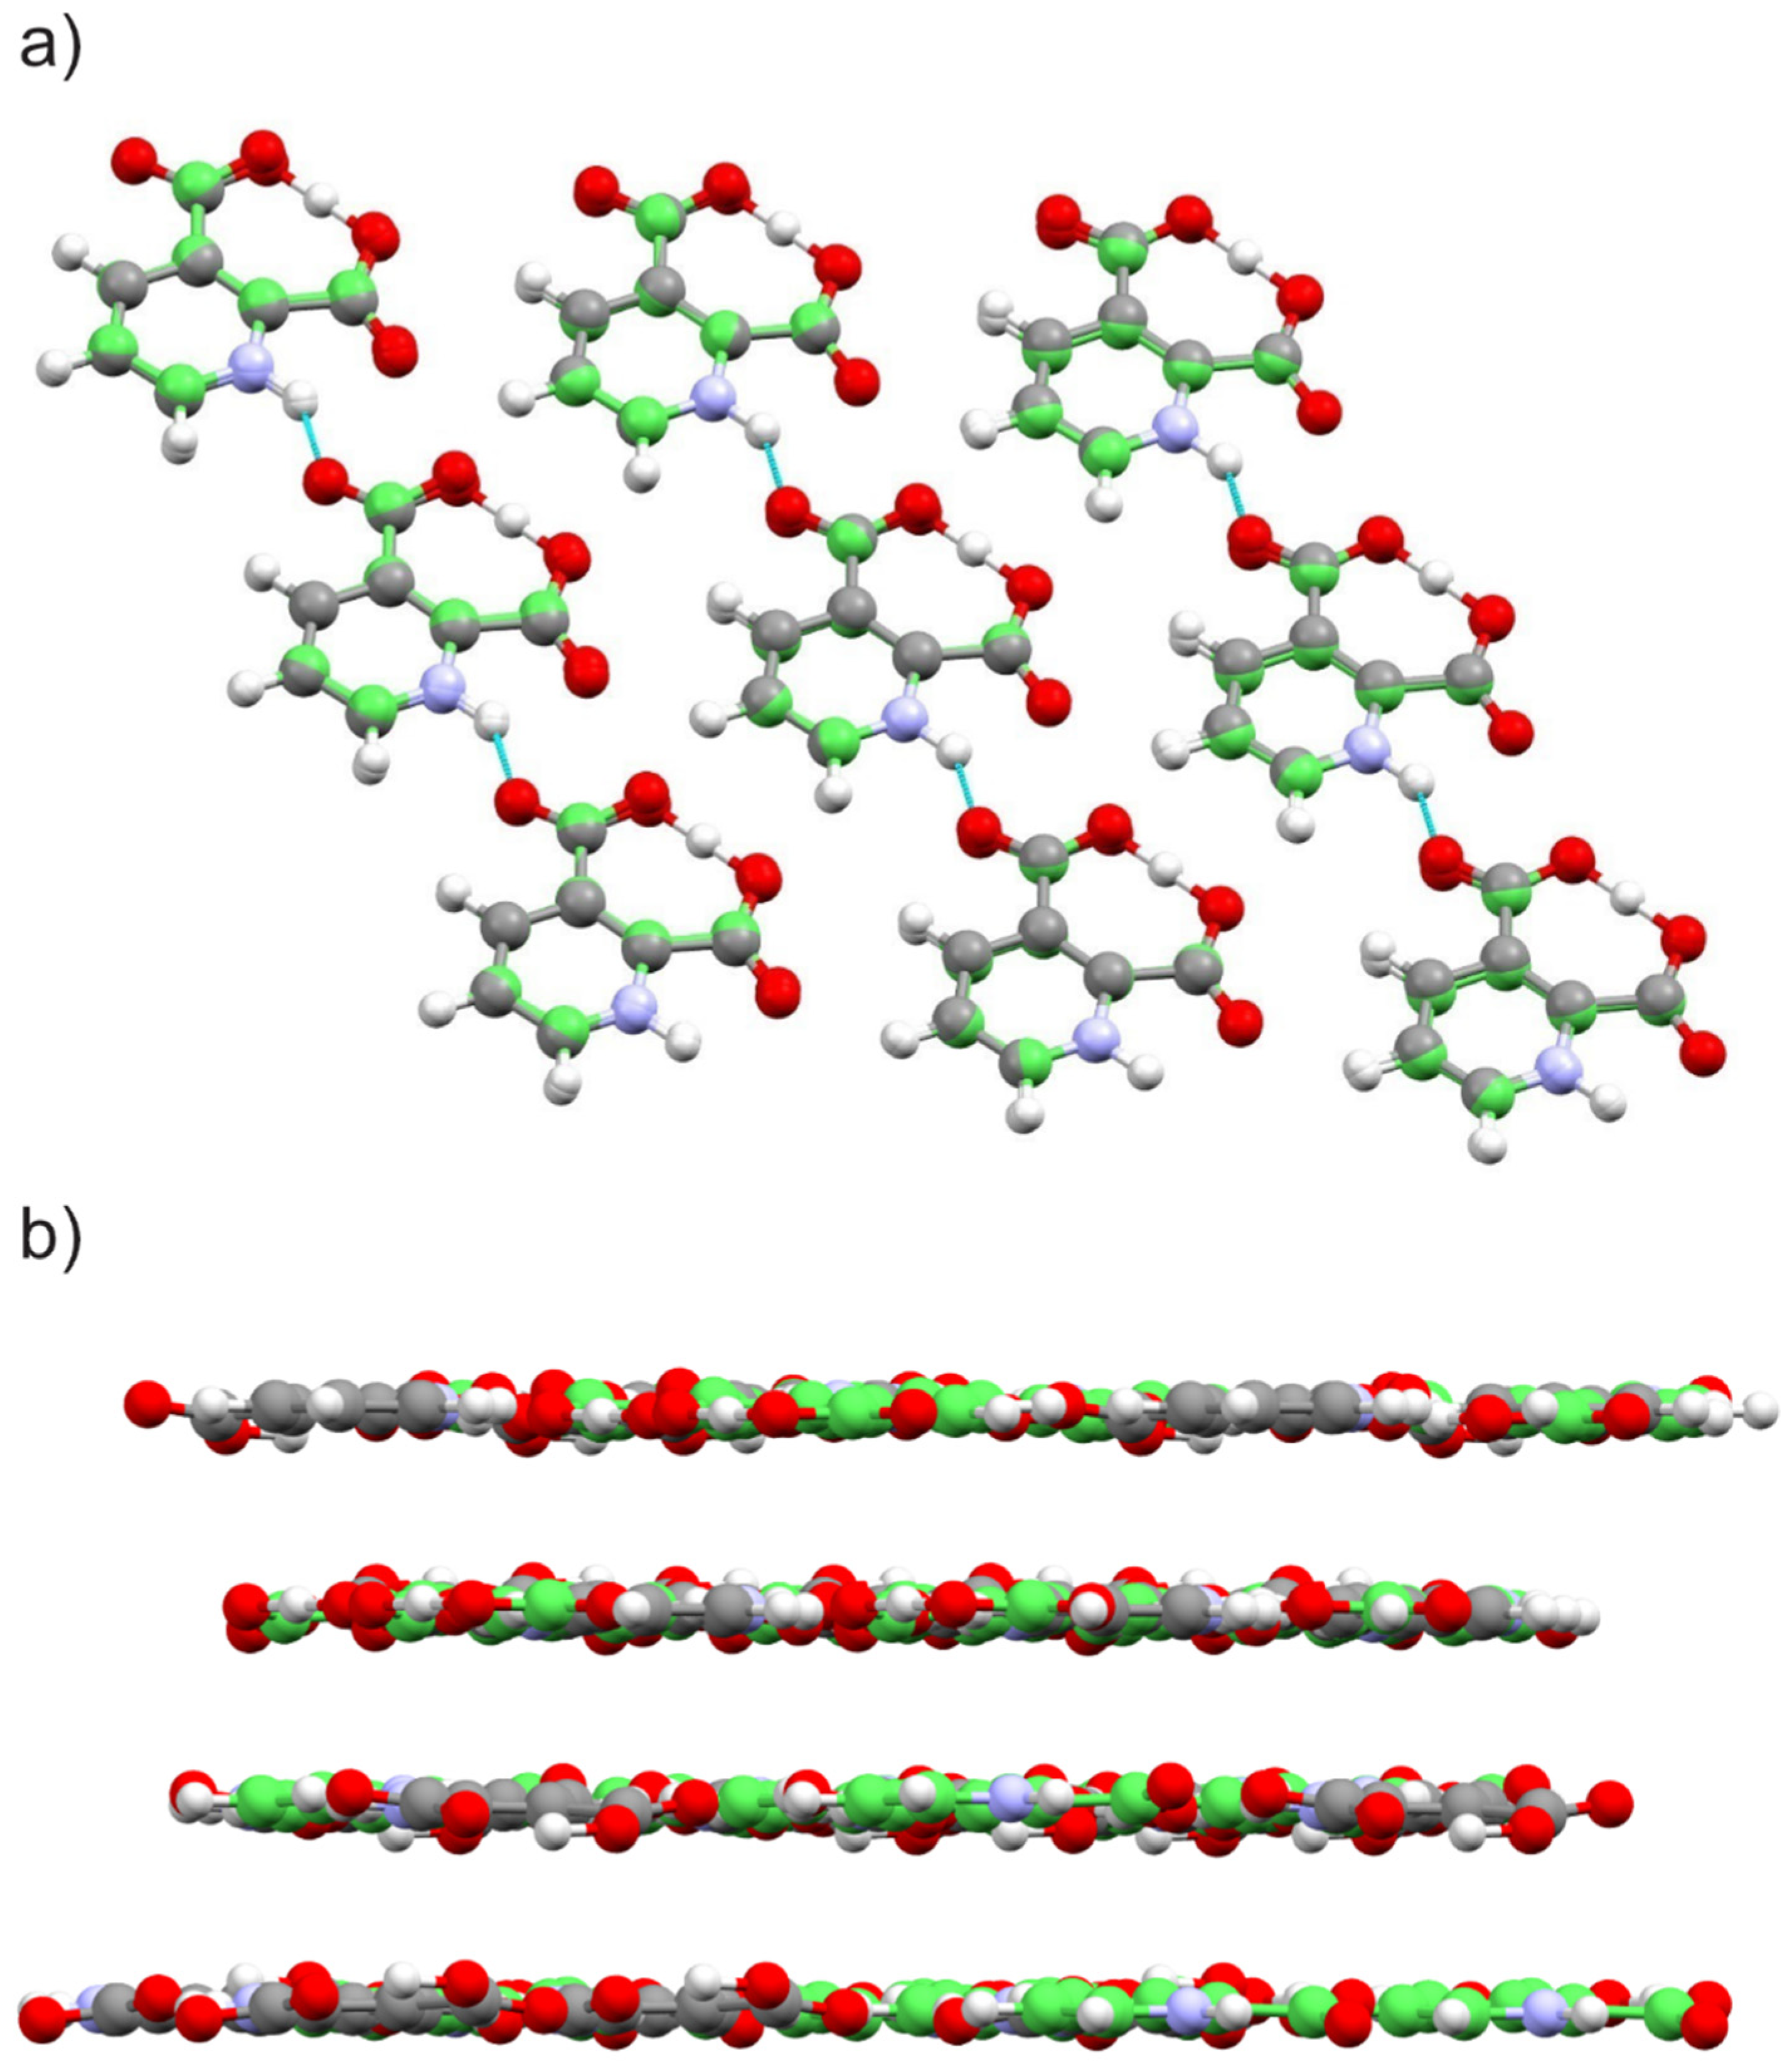
2.1.1. Quinolinic Acid
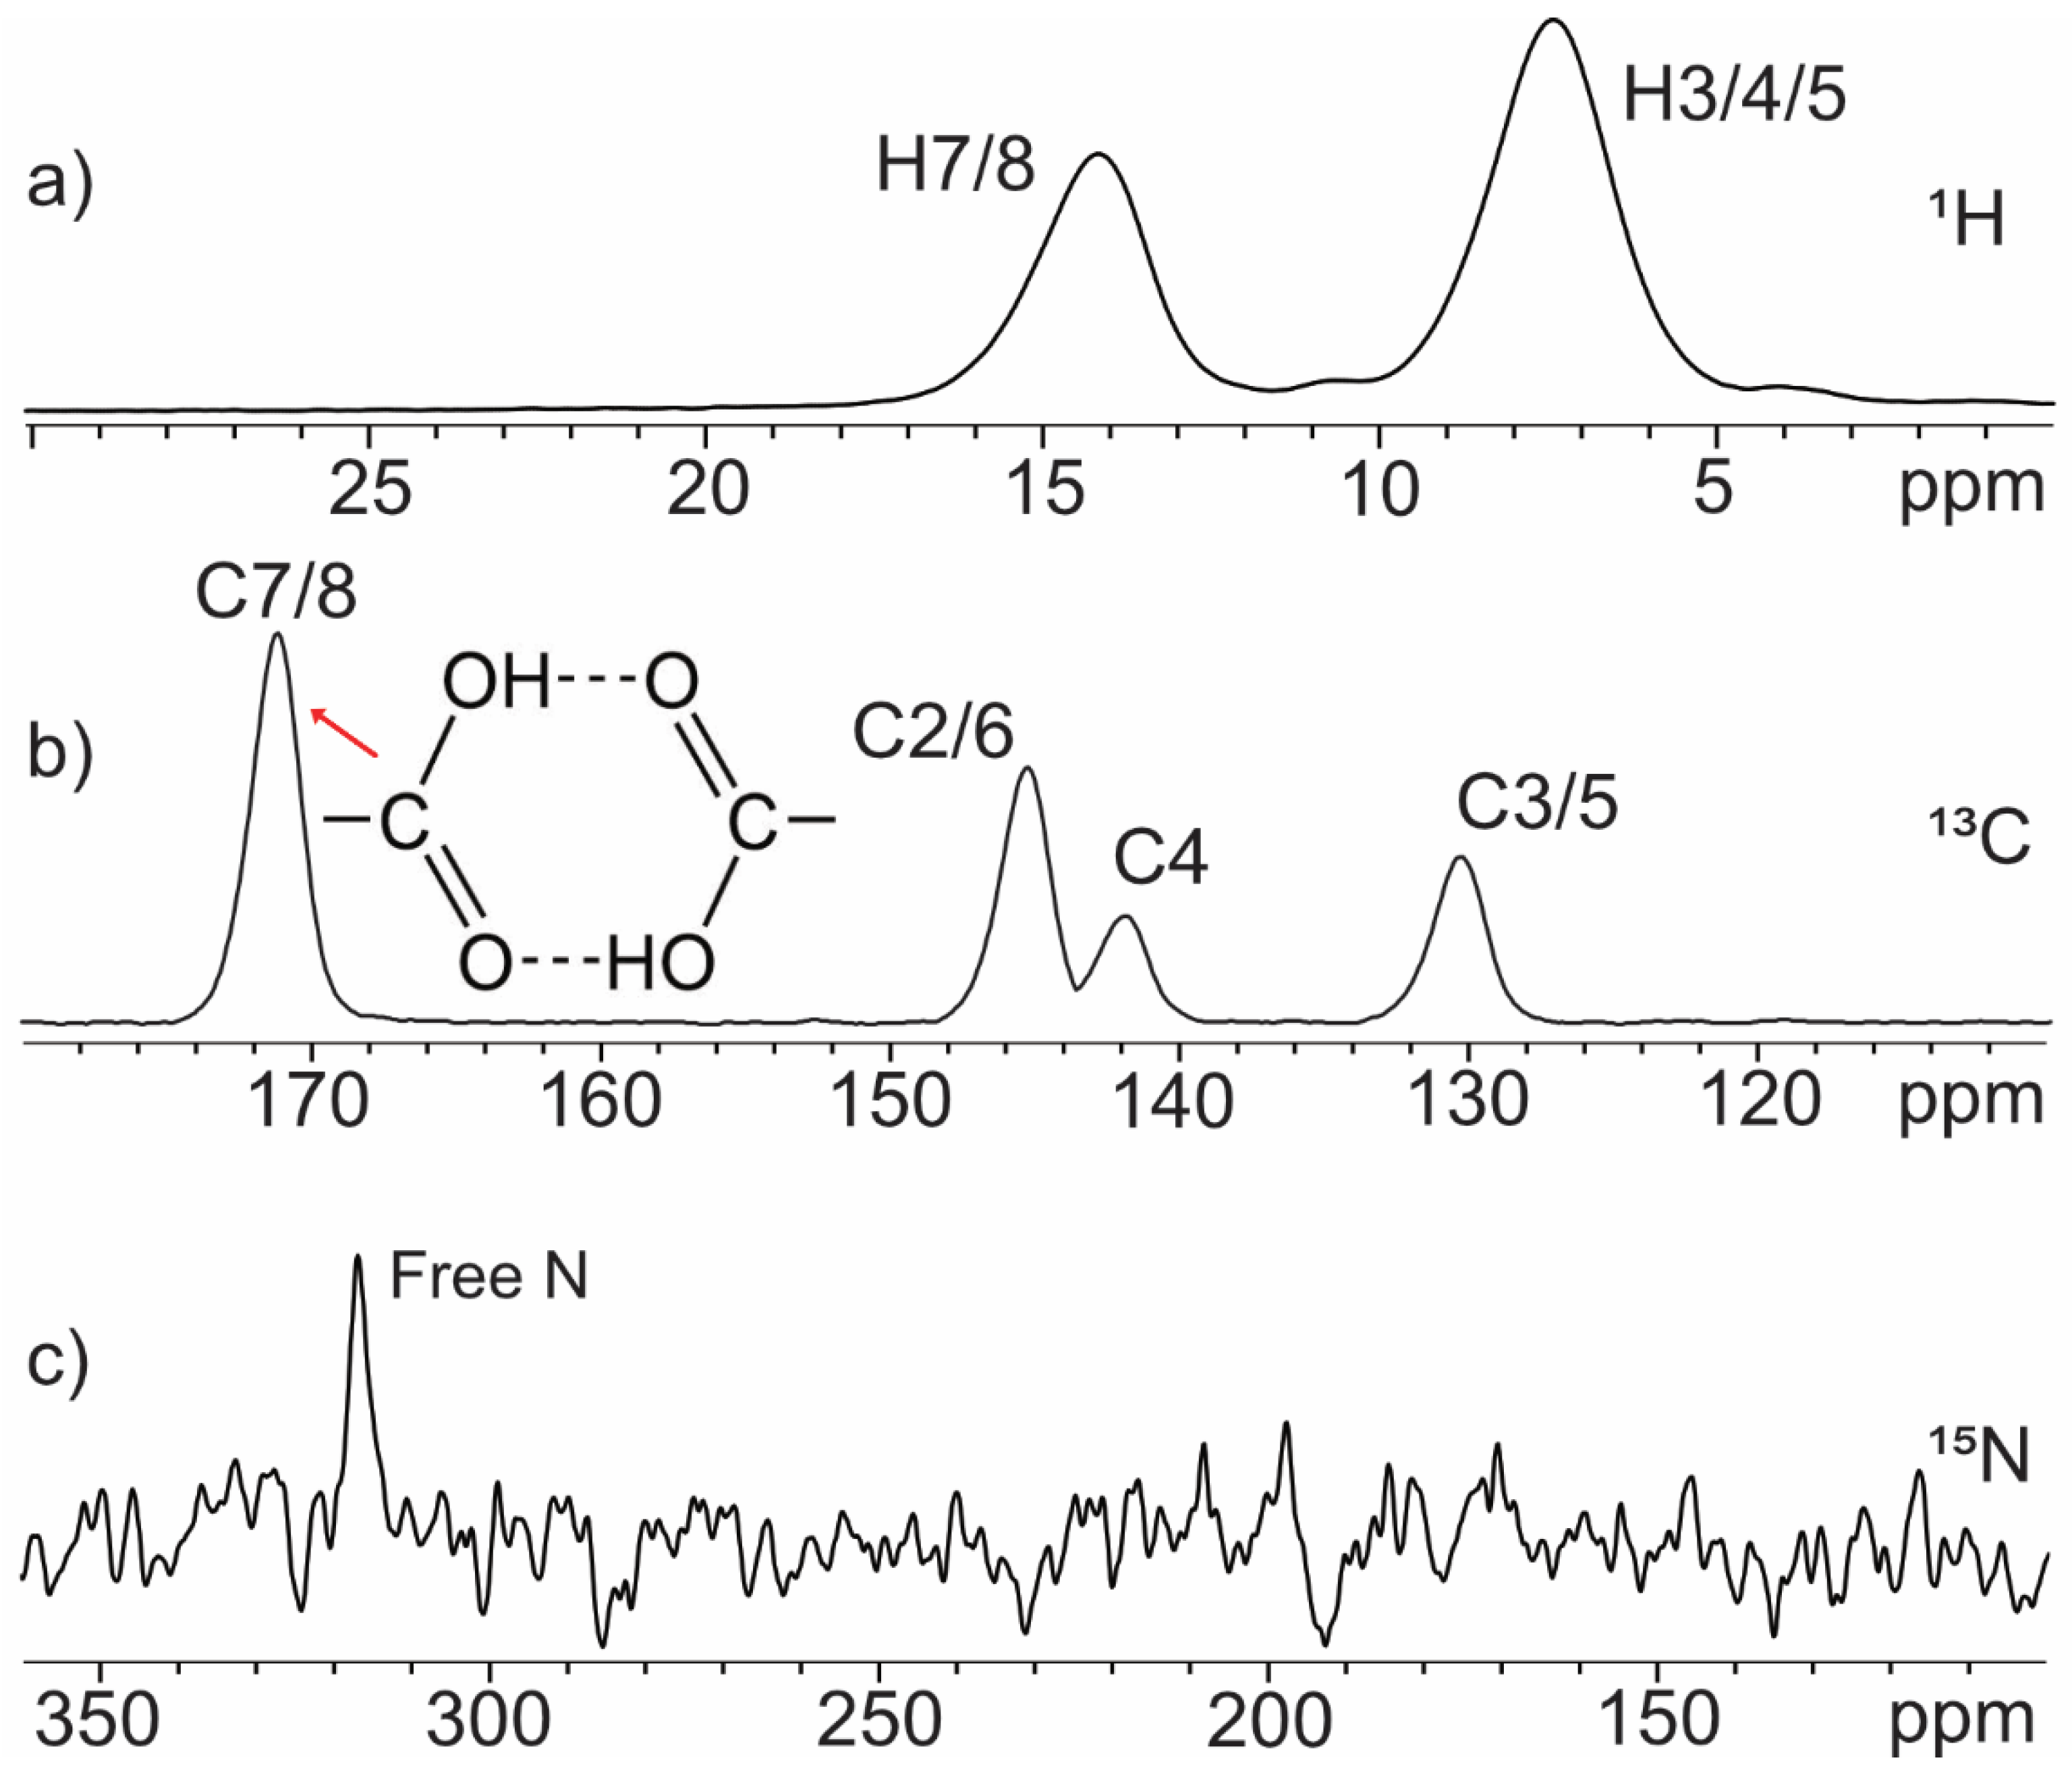
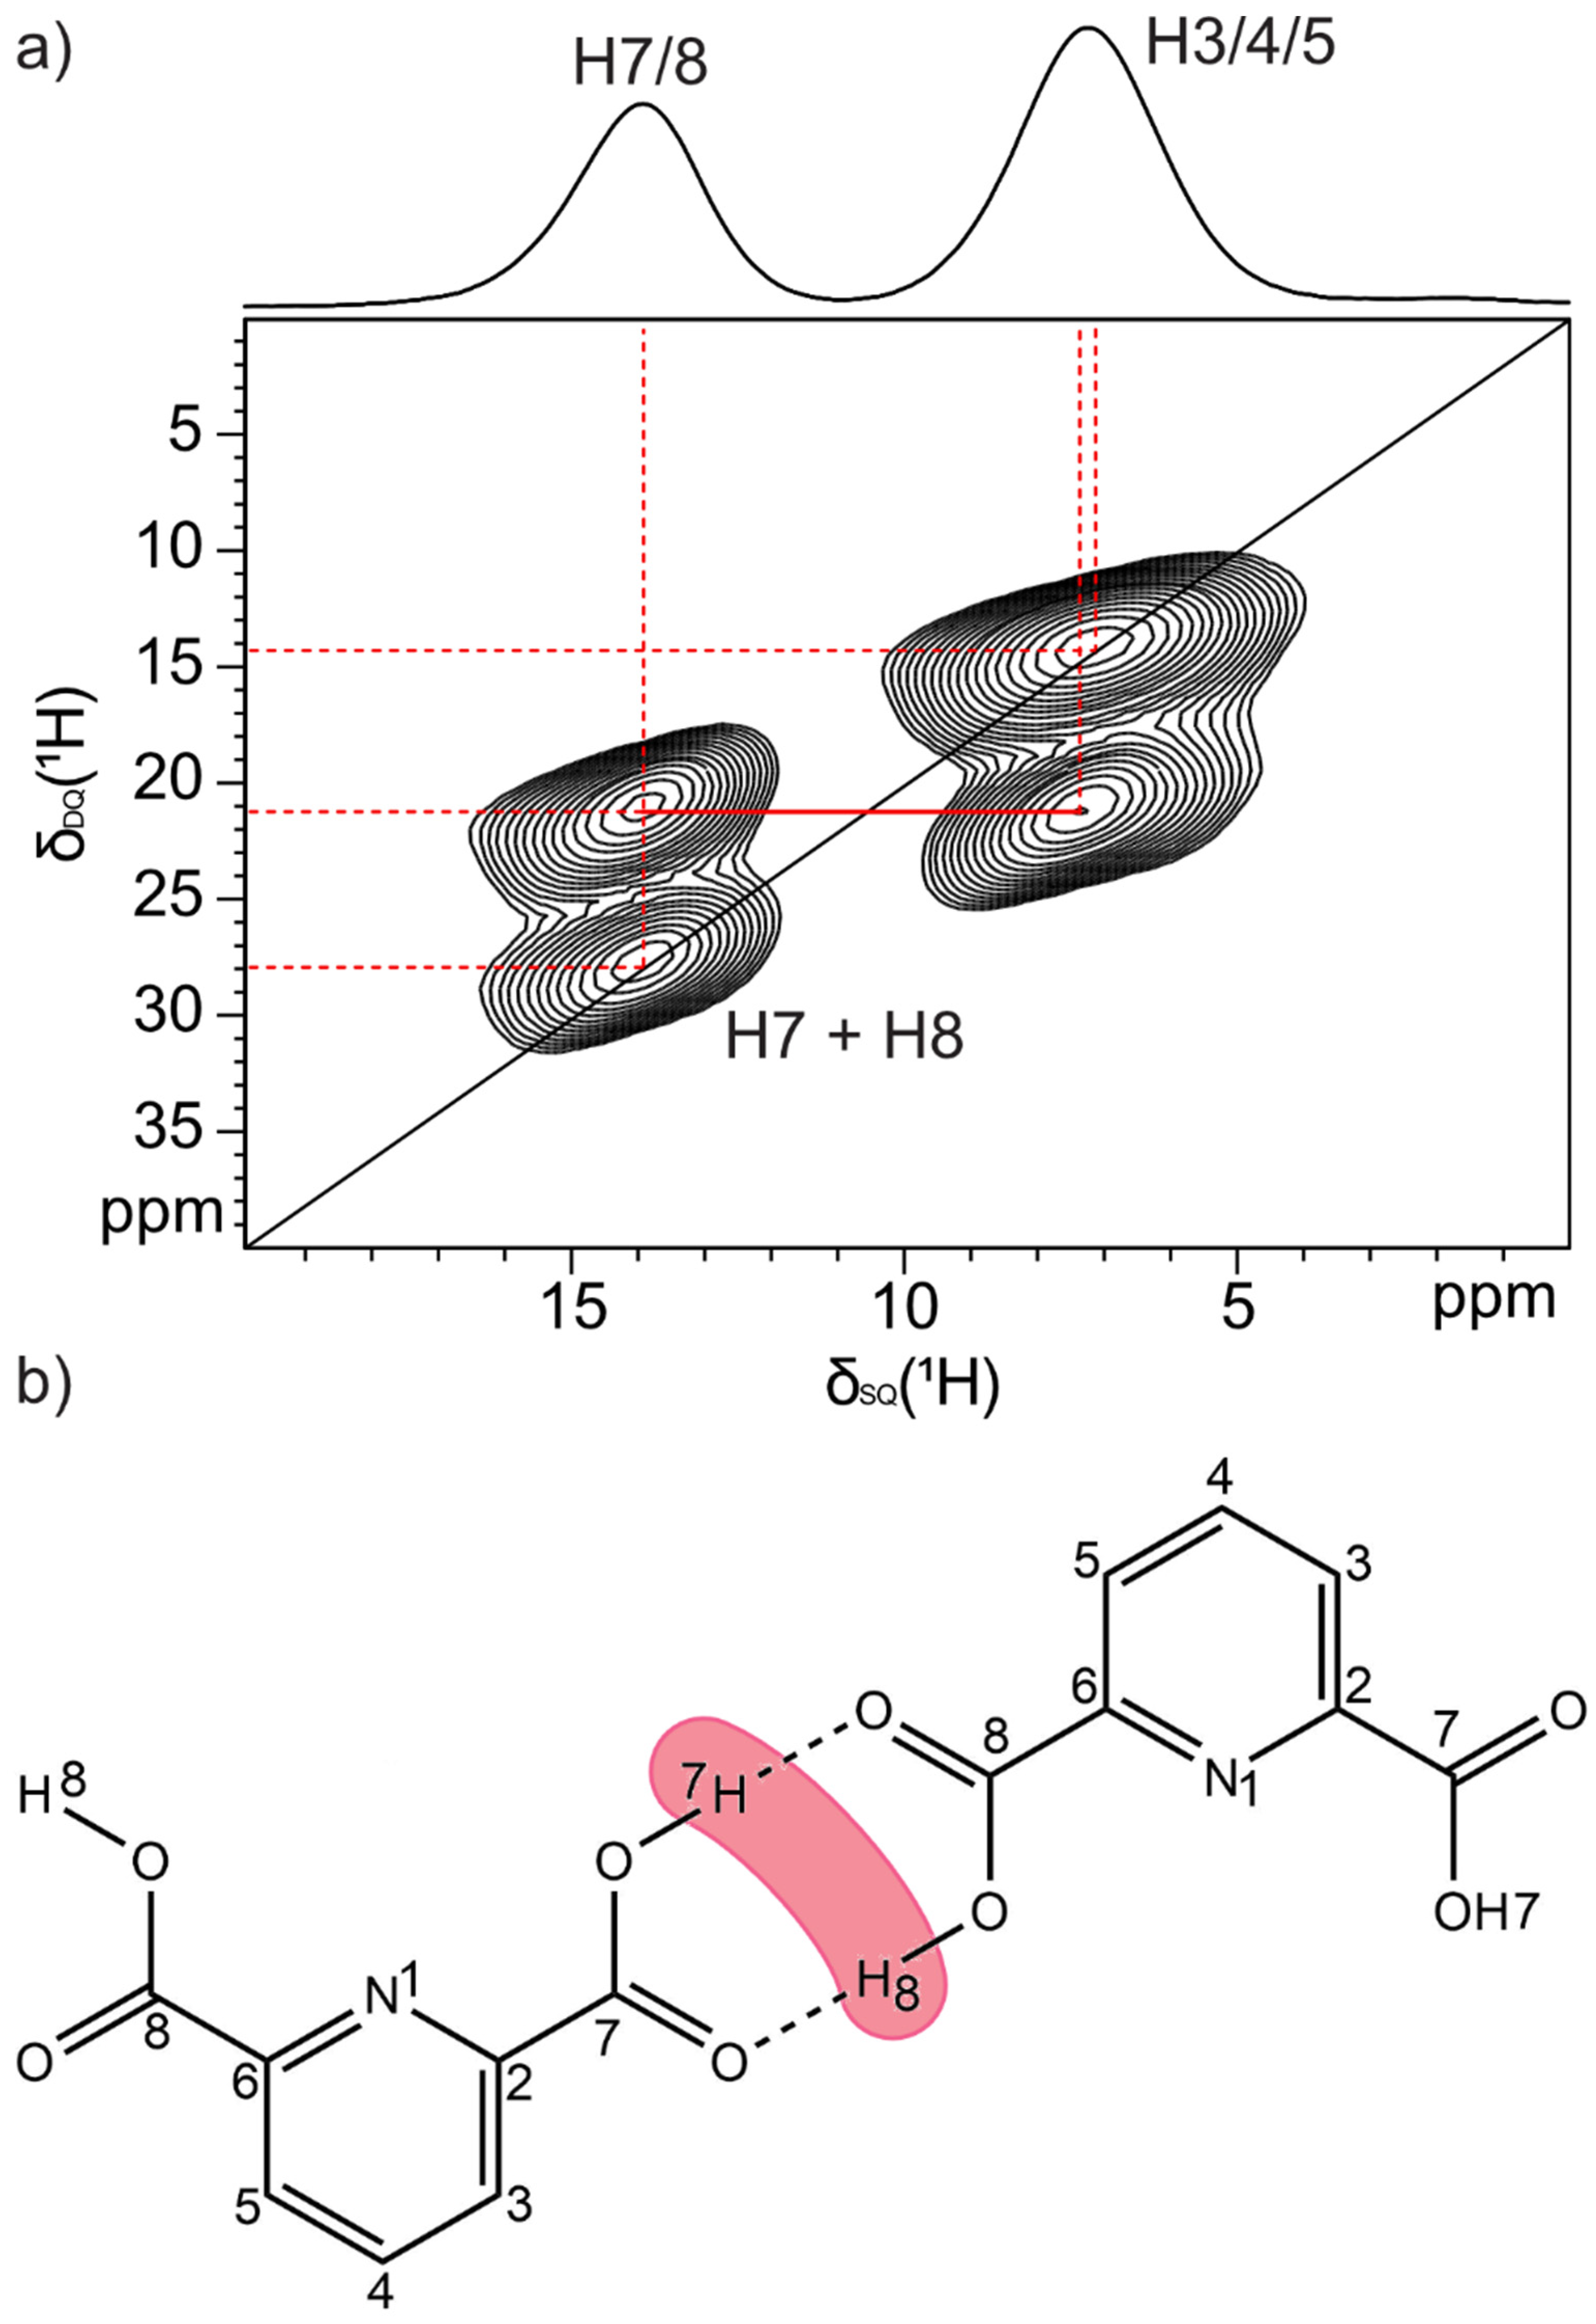
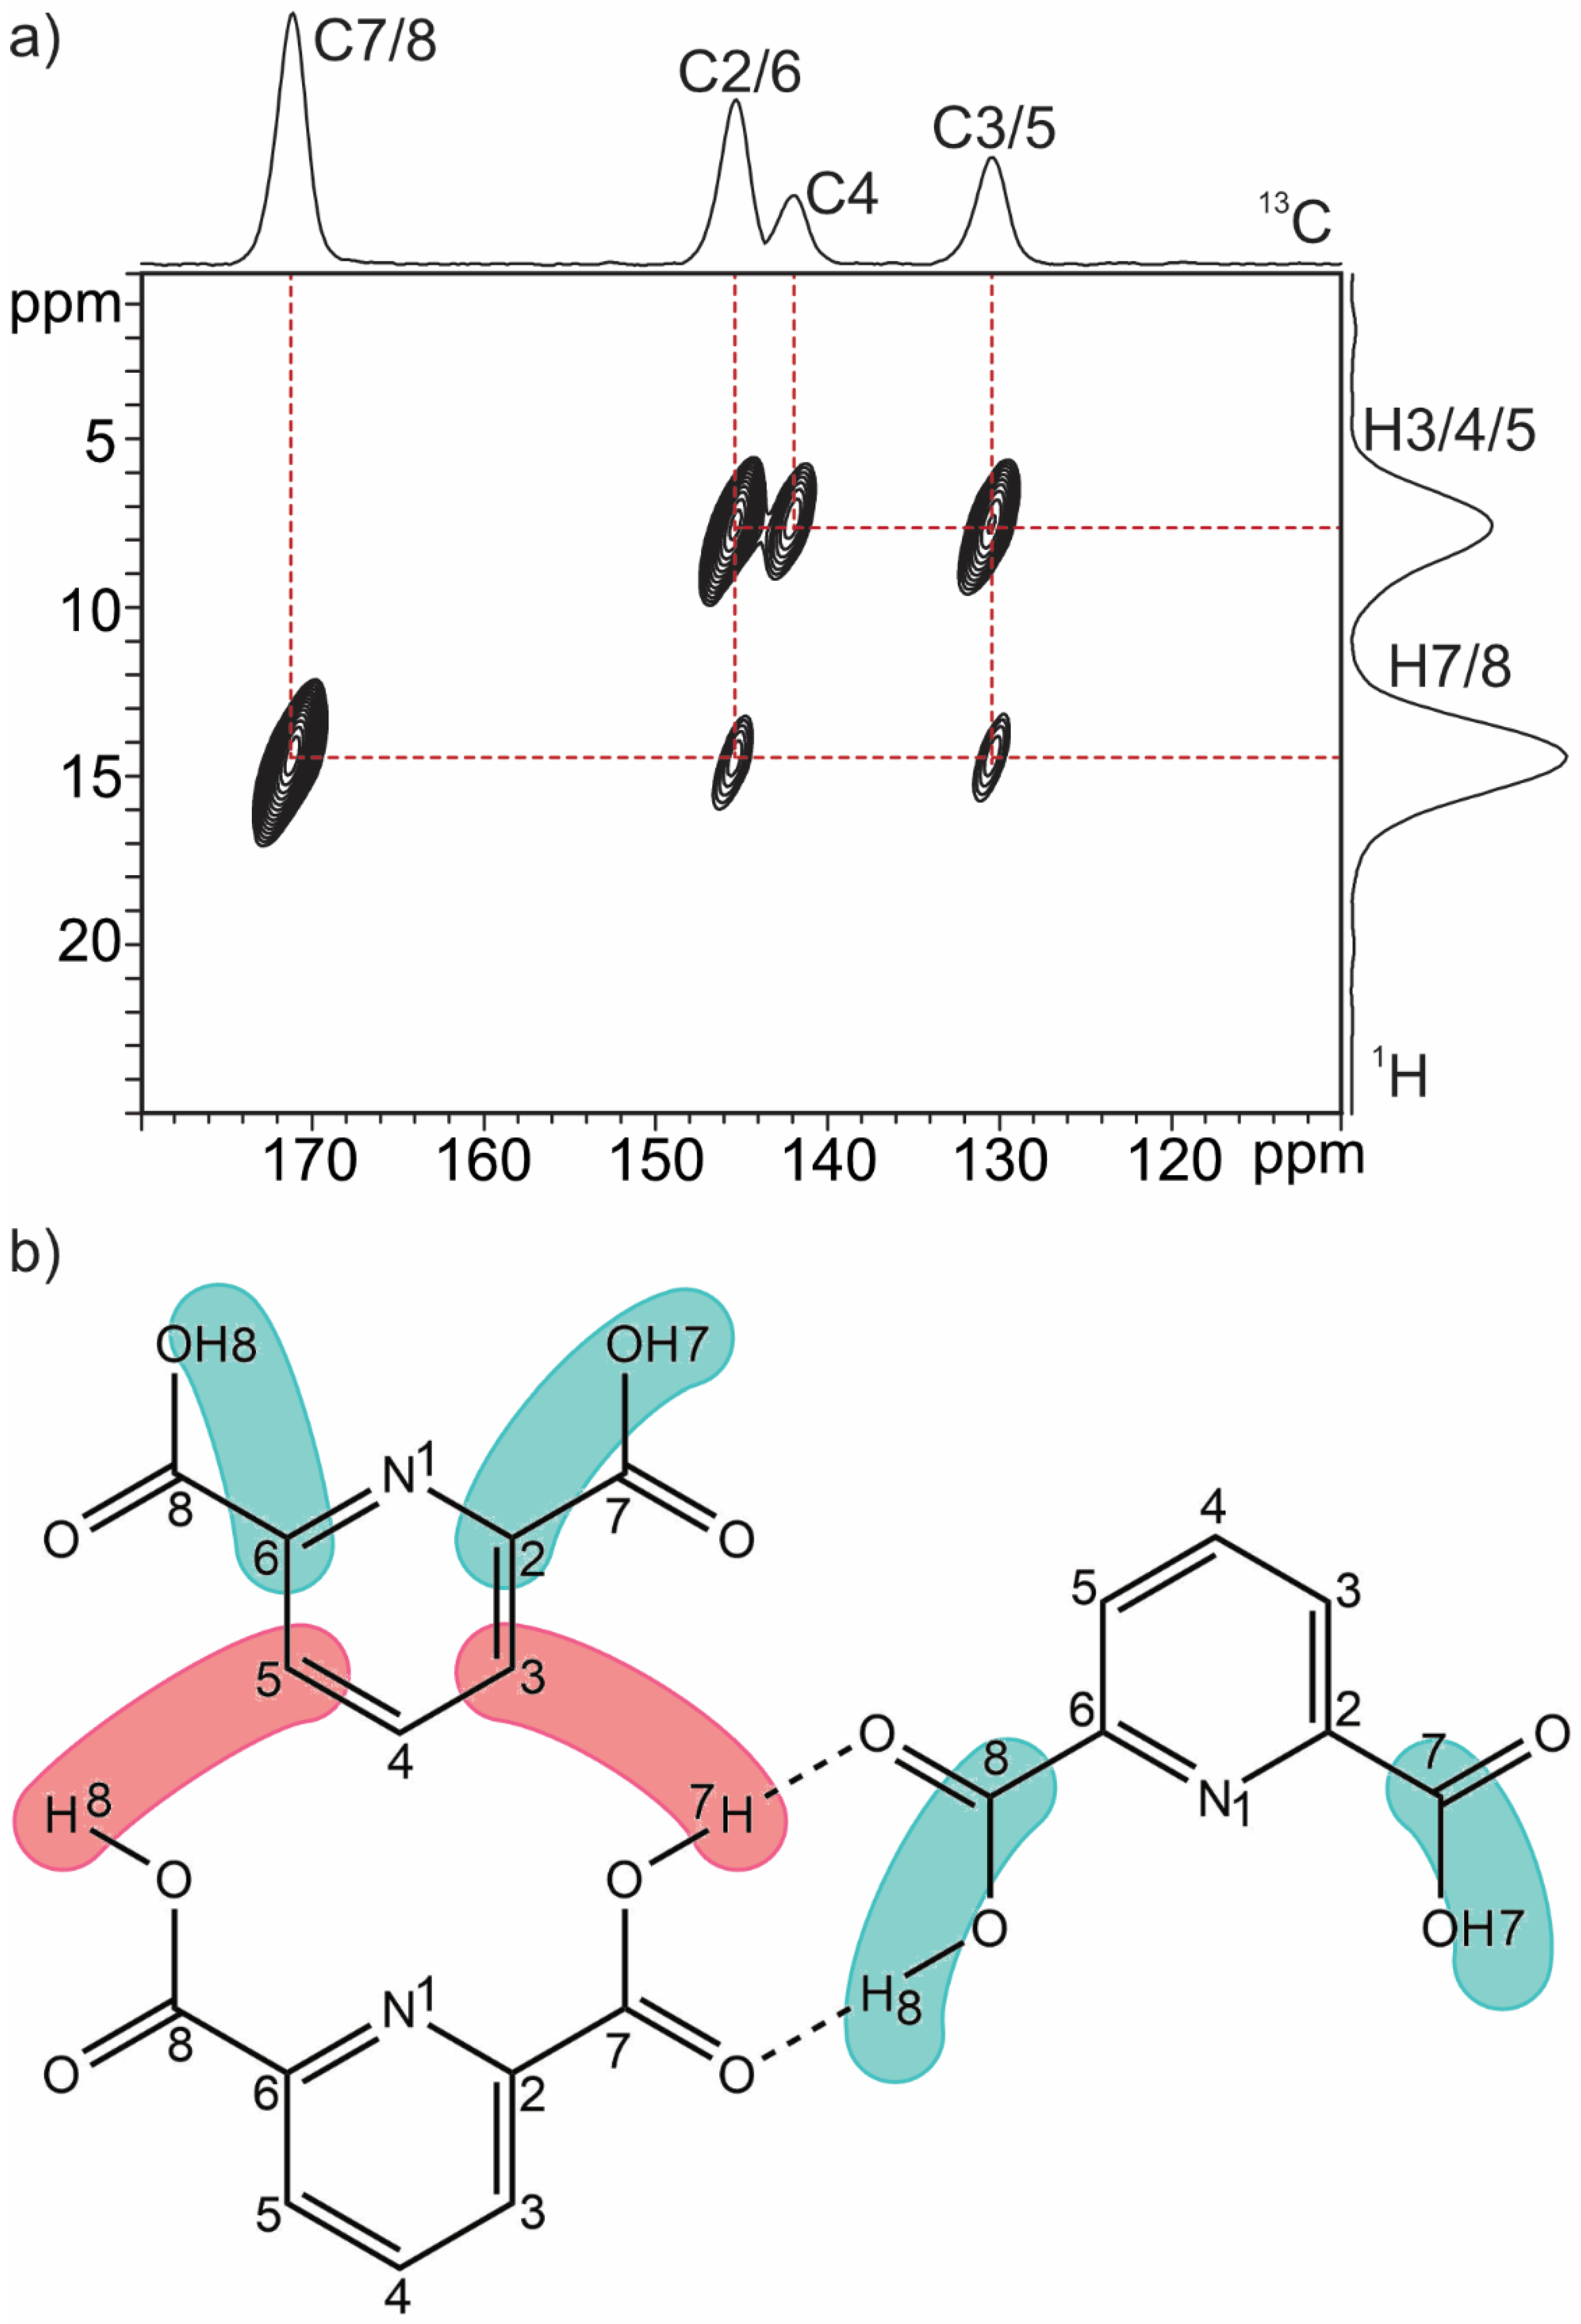
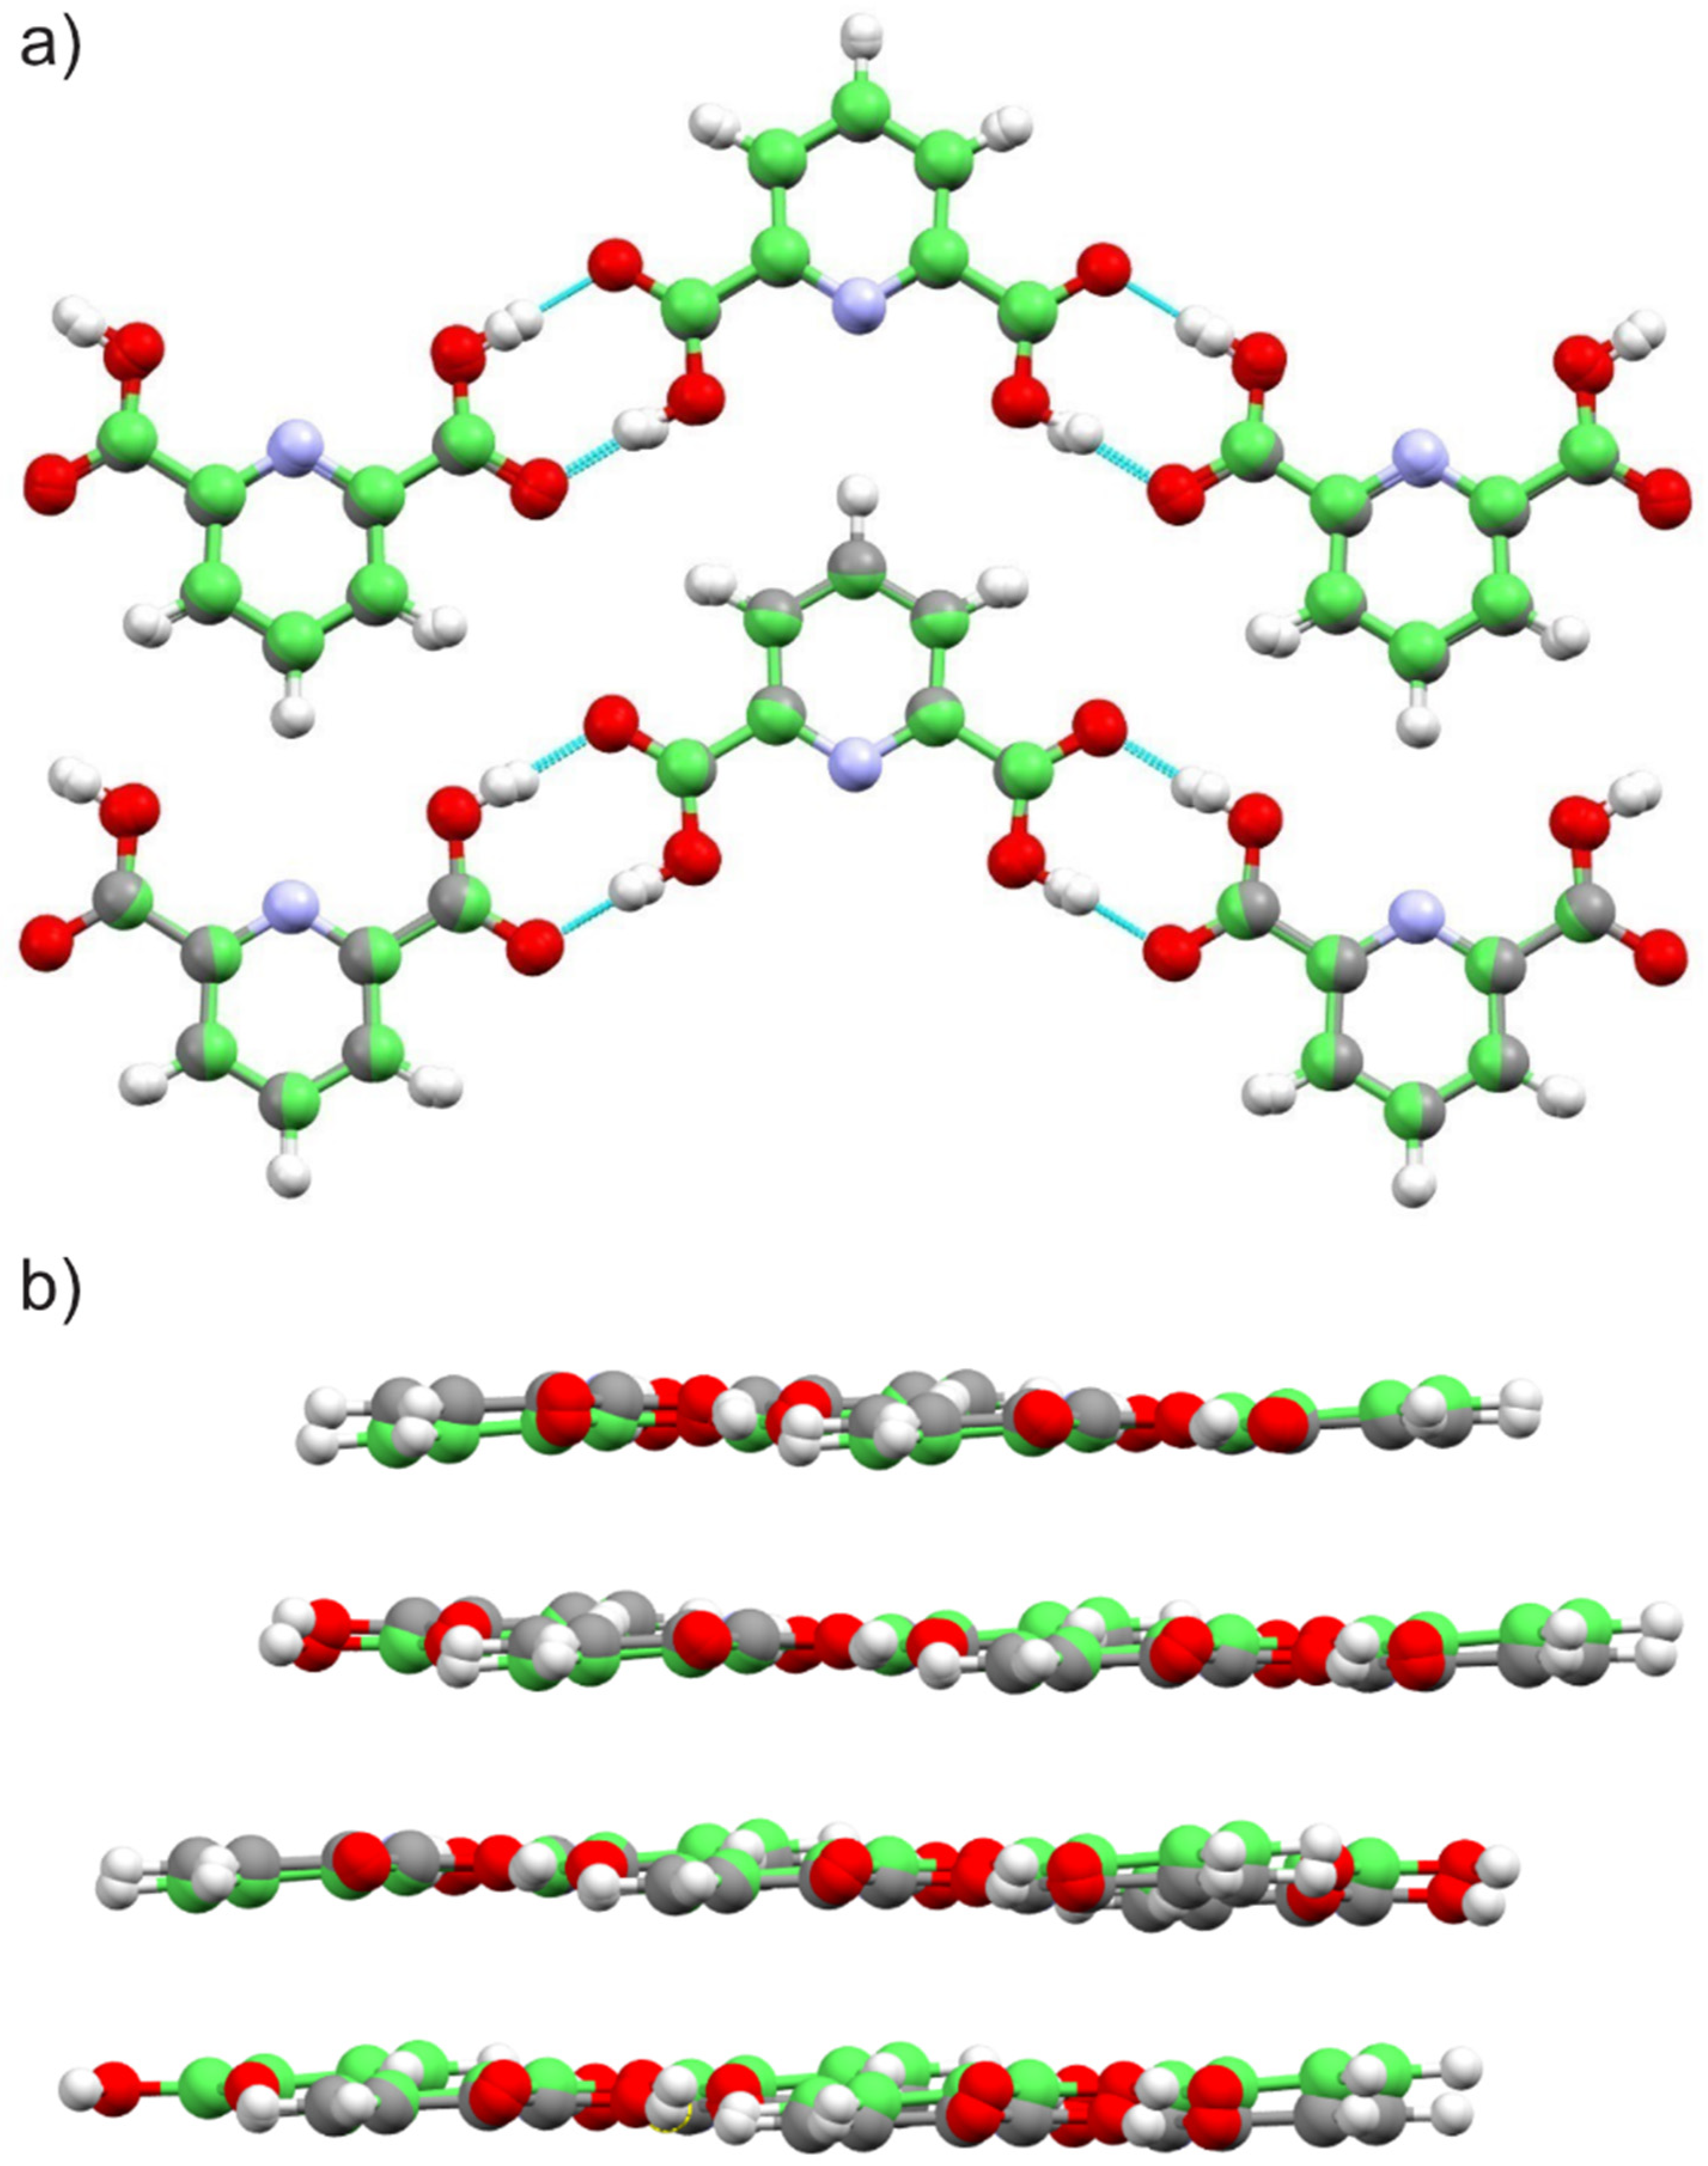
2.1.2. Dipicolinic Acid
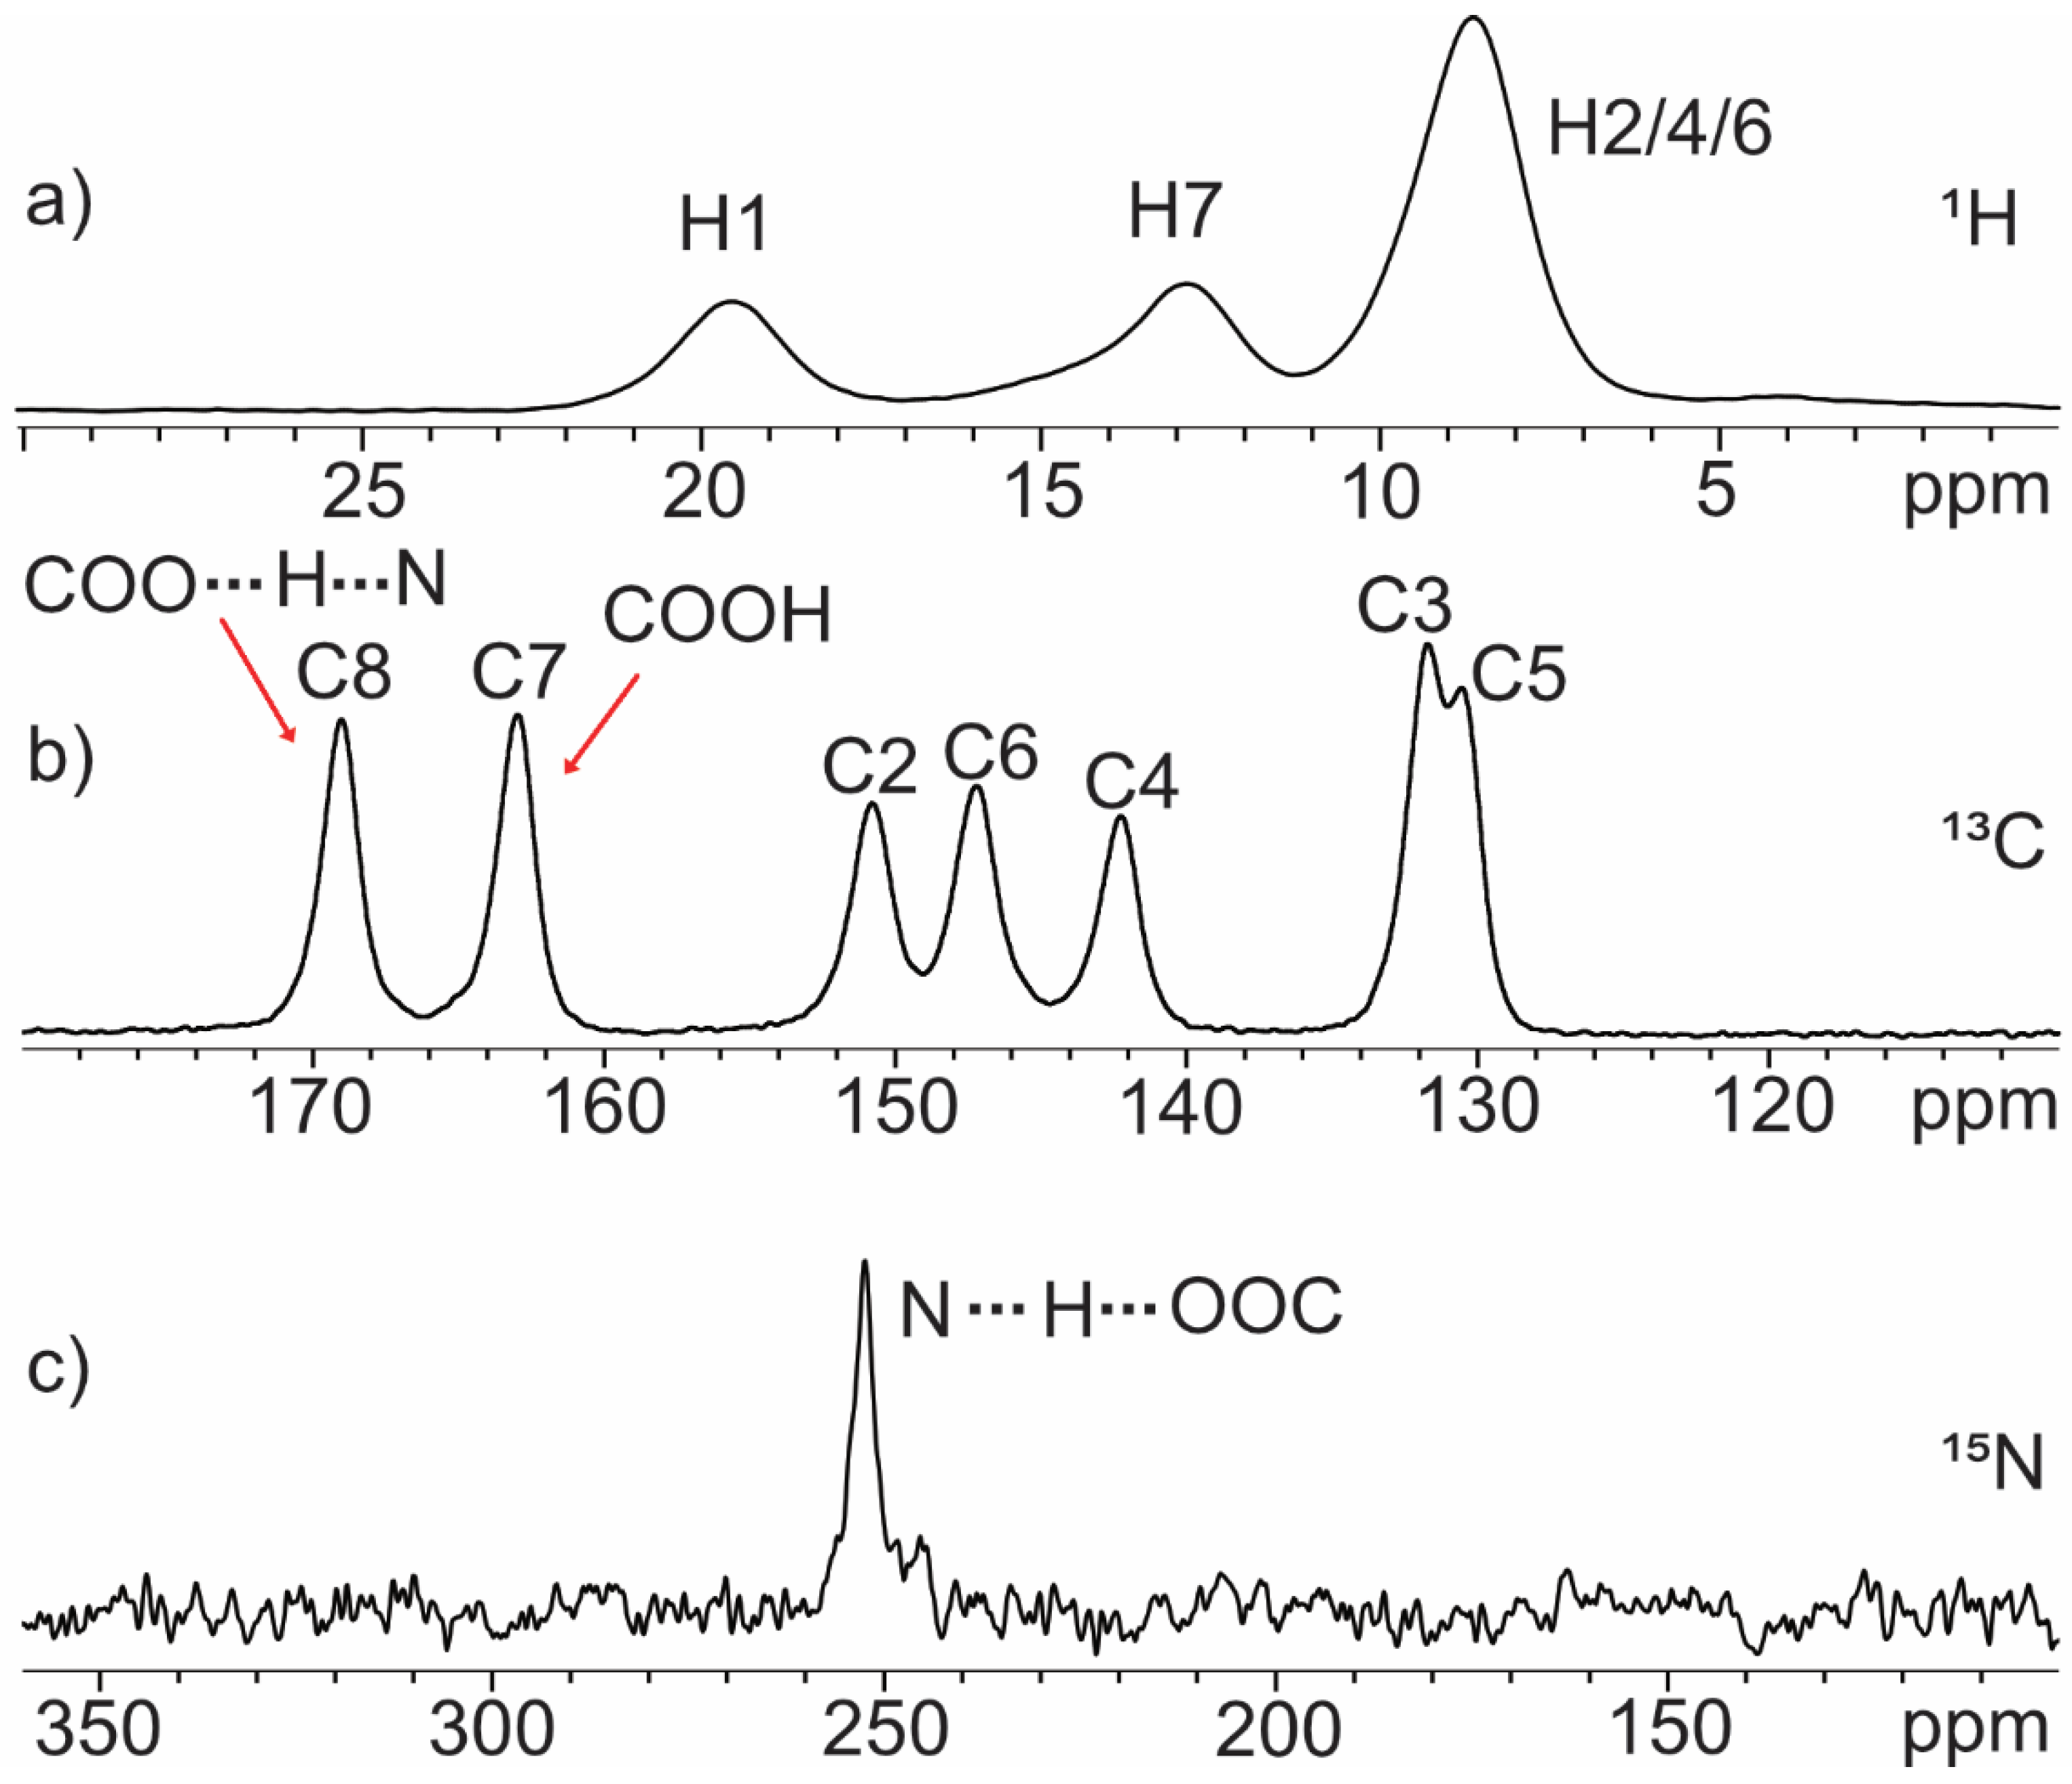
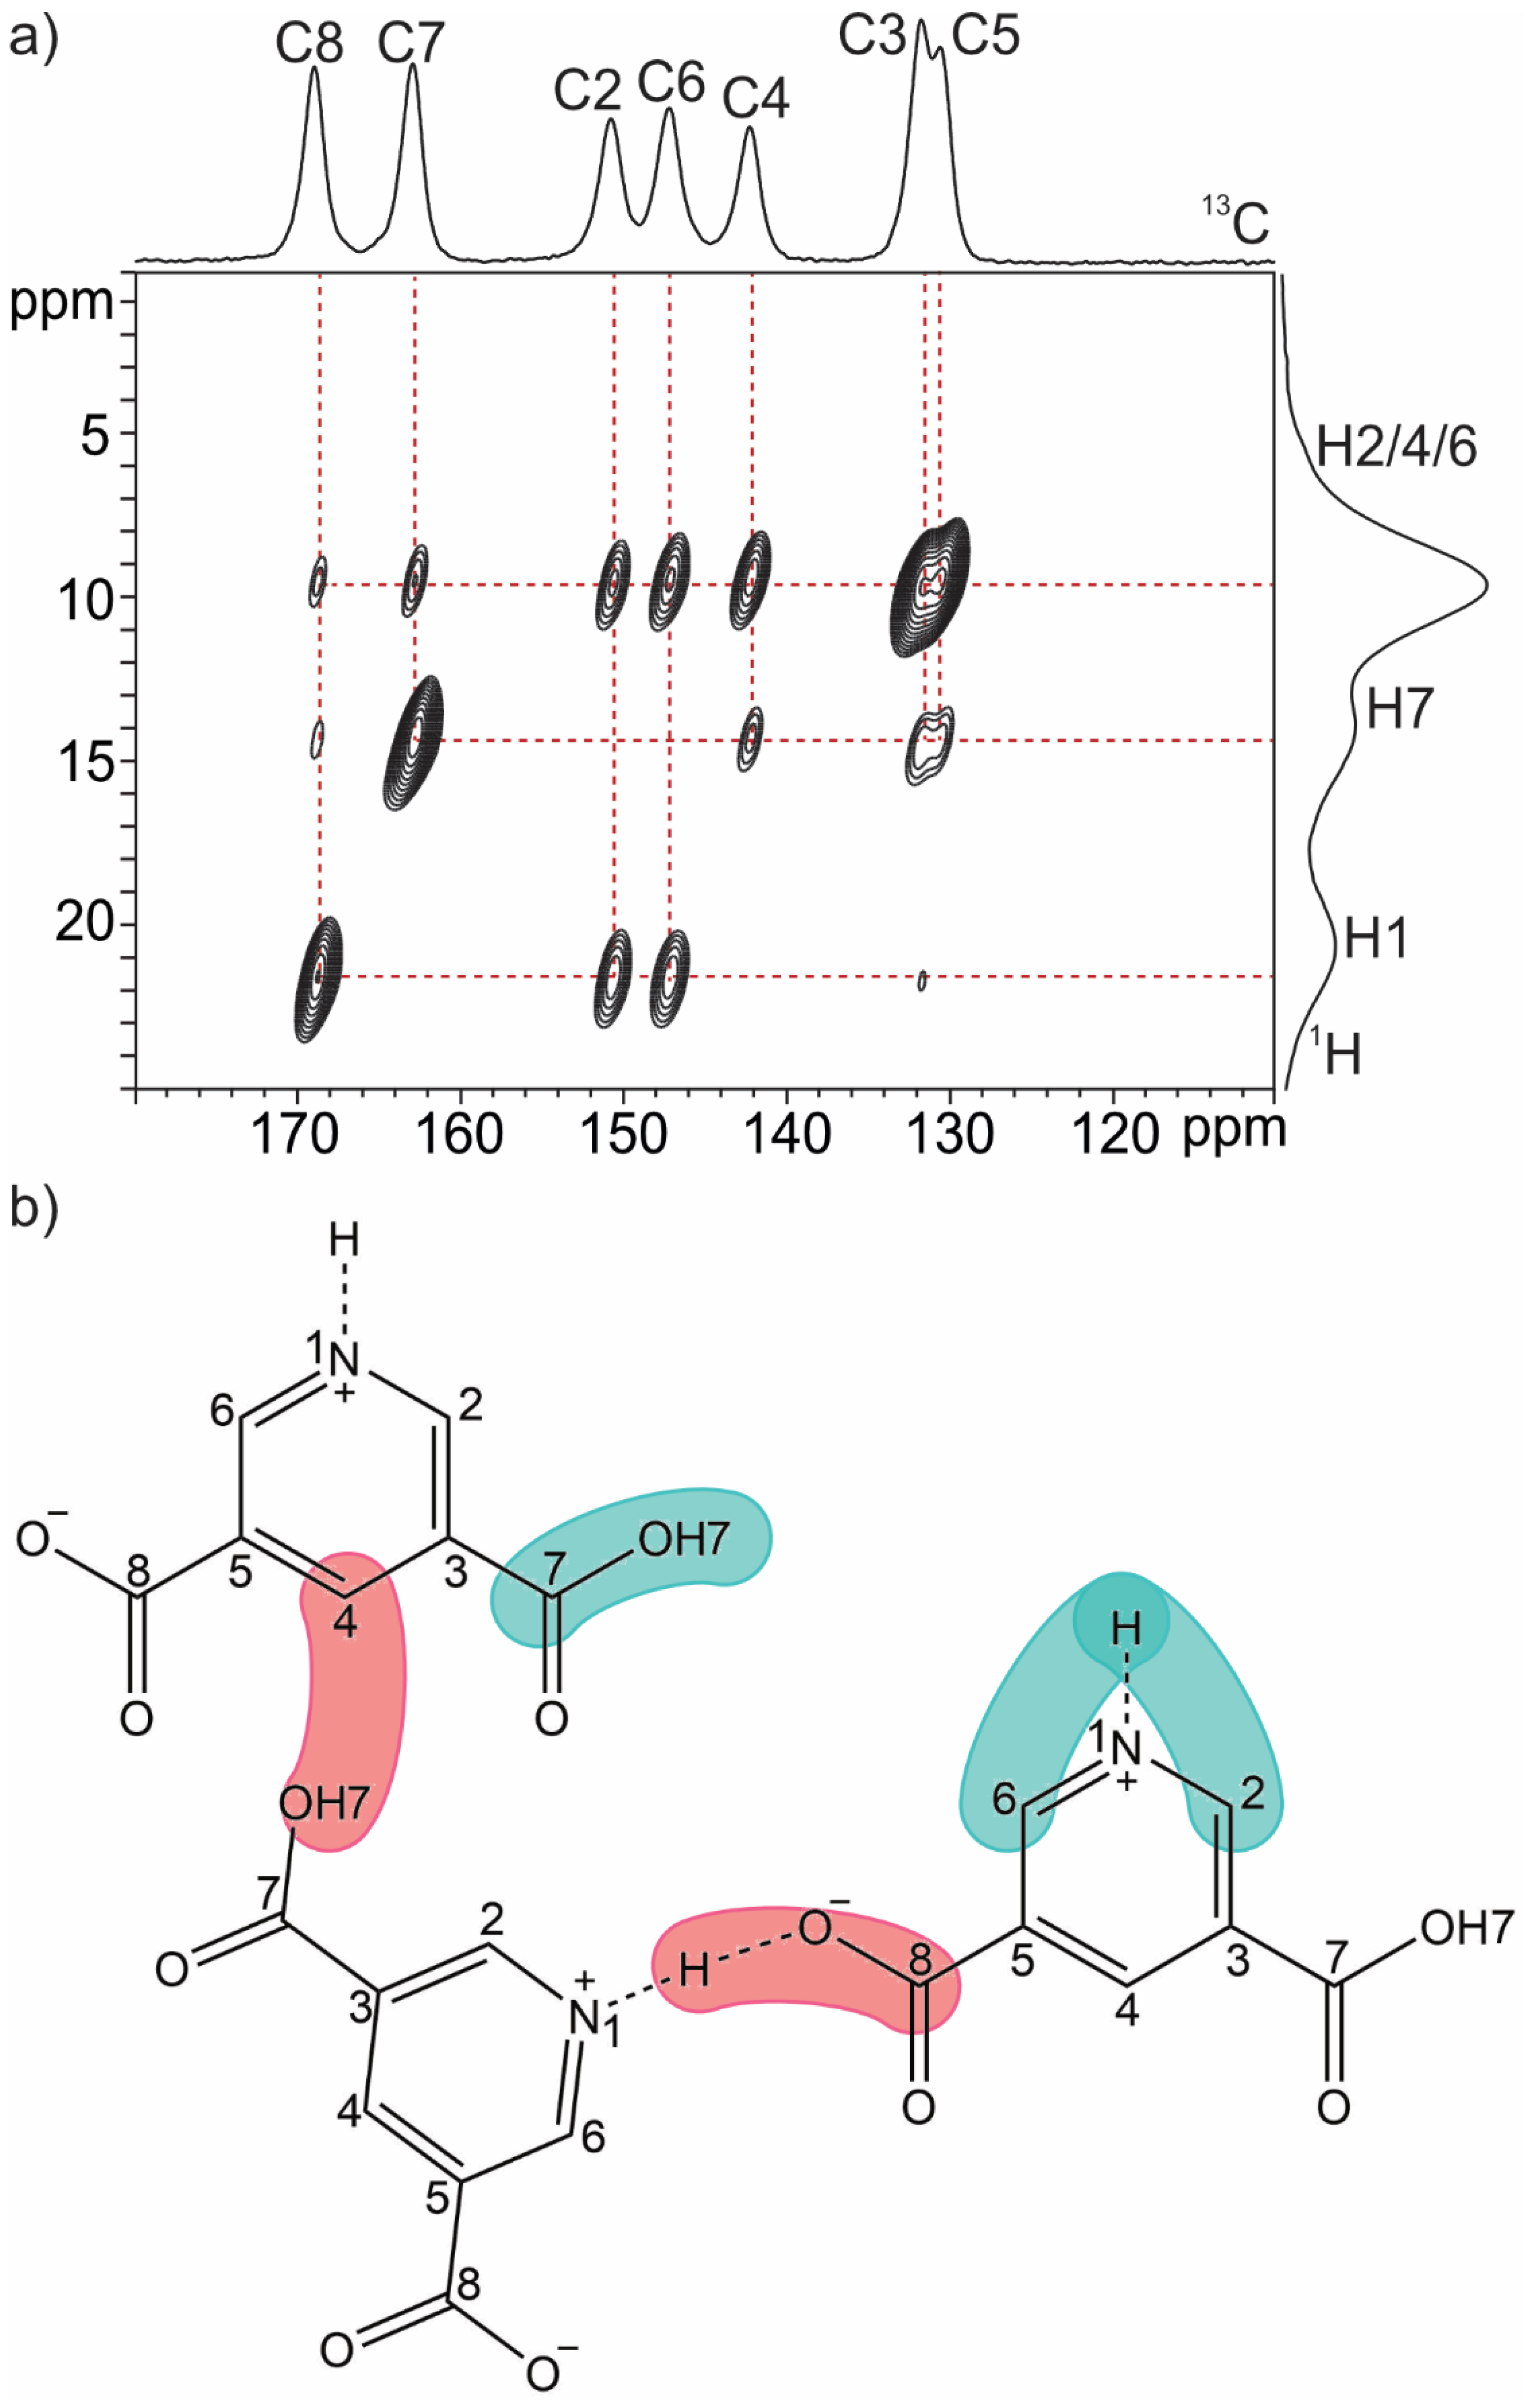
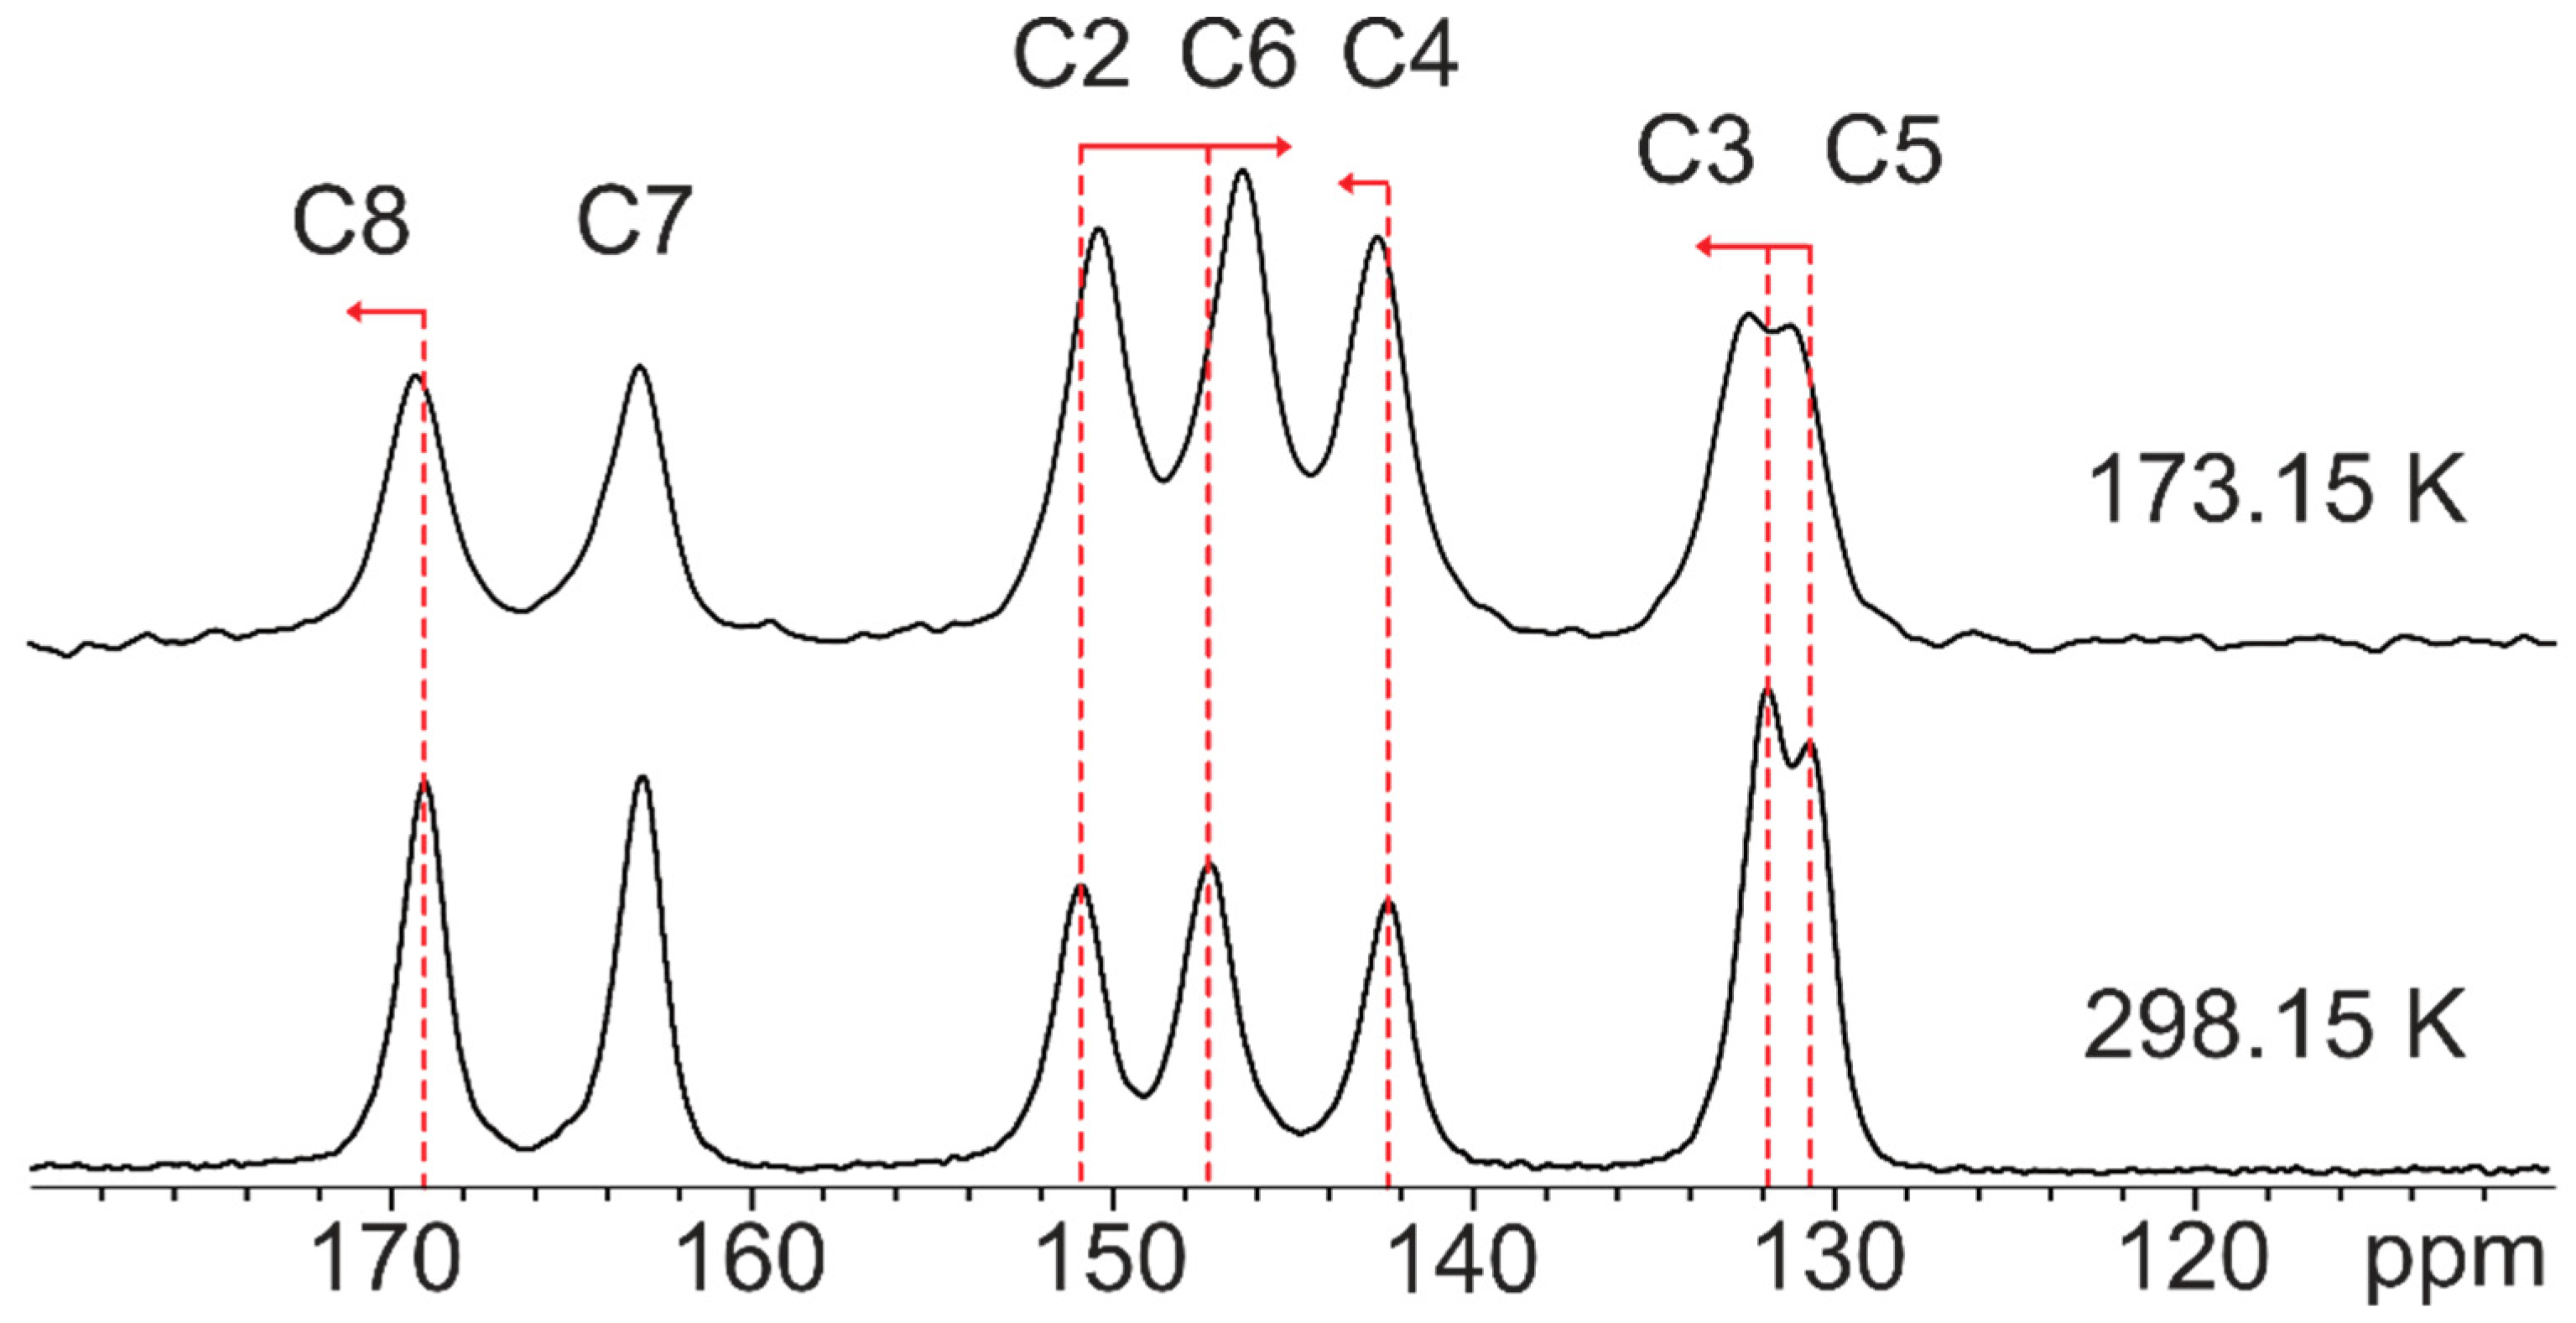
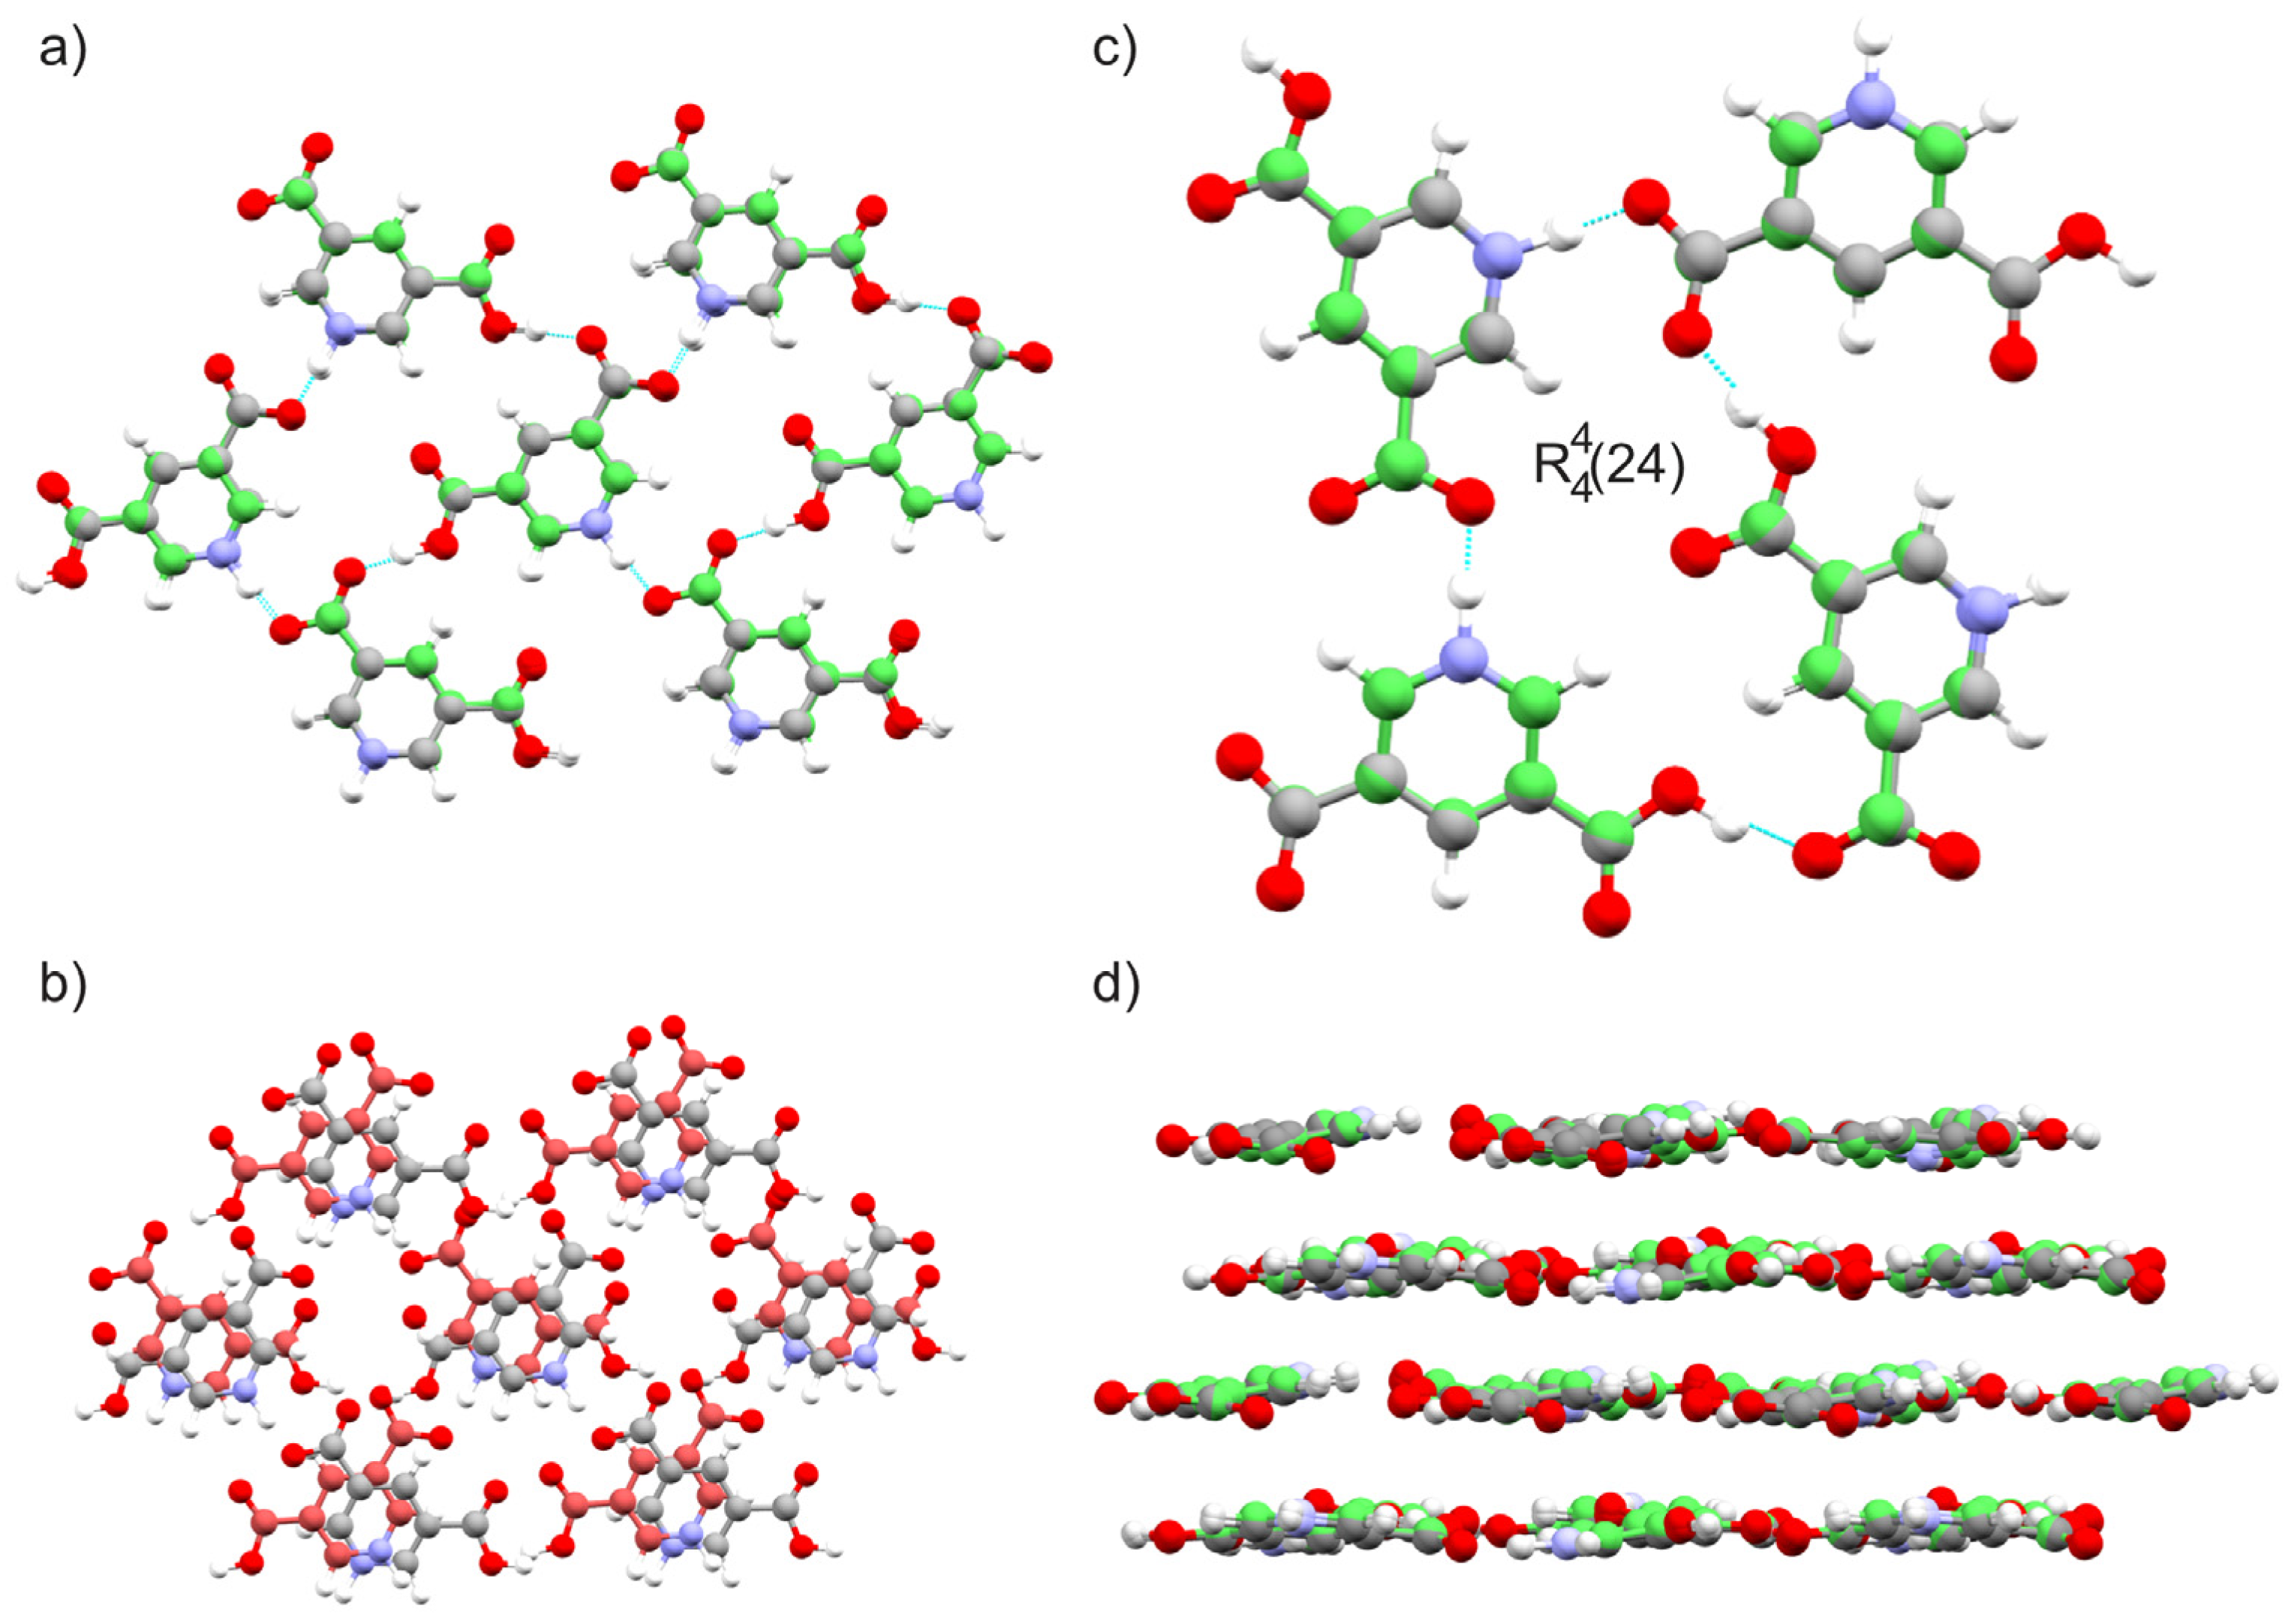
2.1.3. Dinicotinic Acid
2.2. CSP
2.2.1. CSP of QA
2.2.2. CSP of DPA
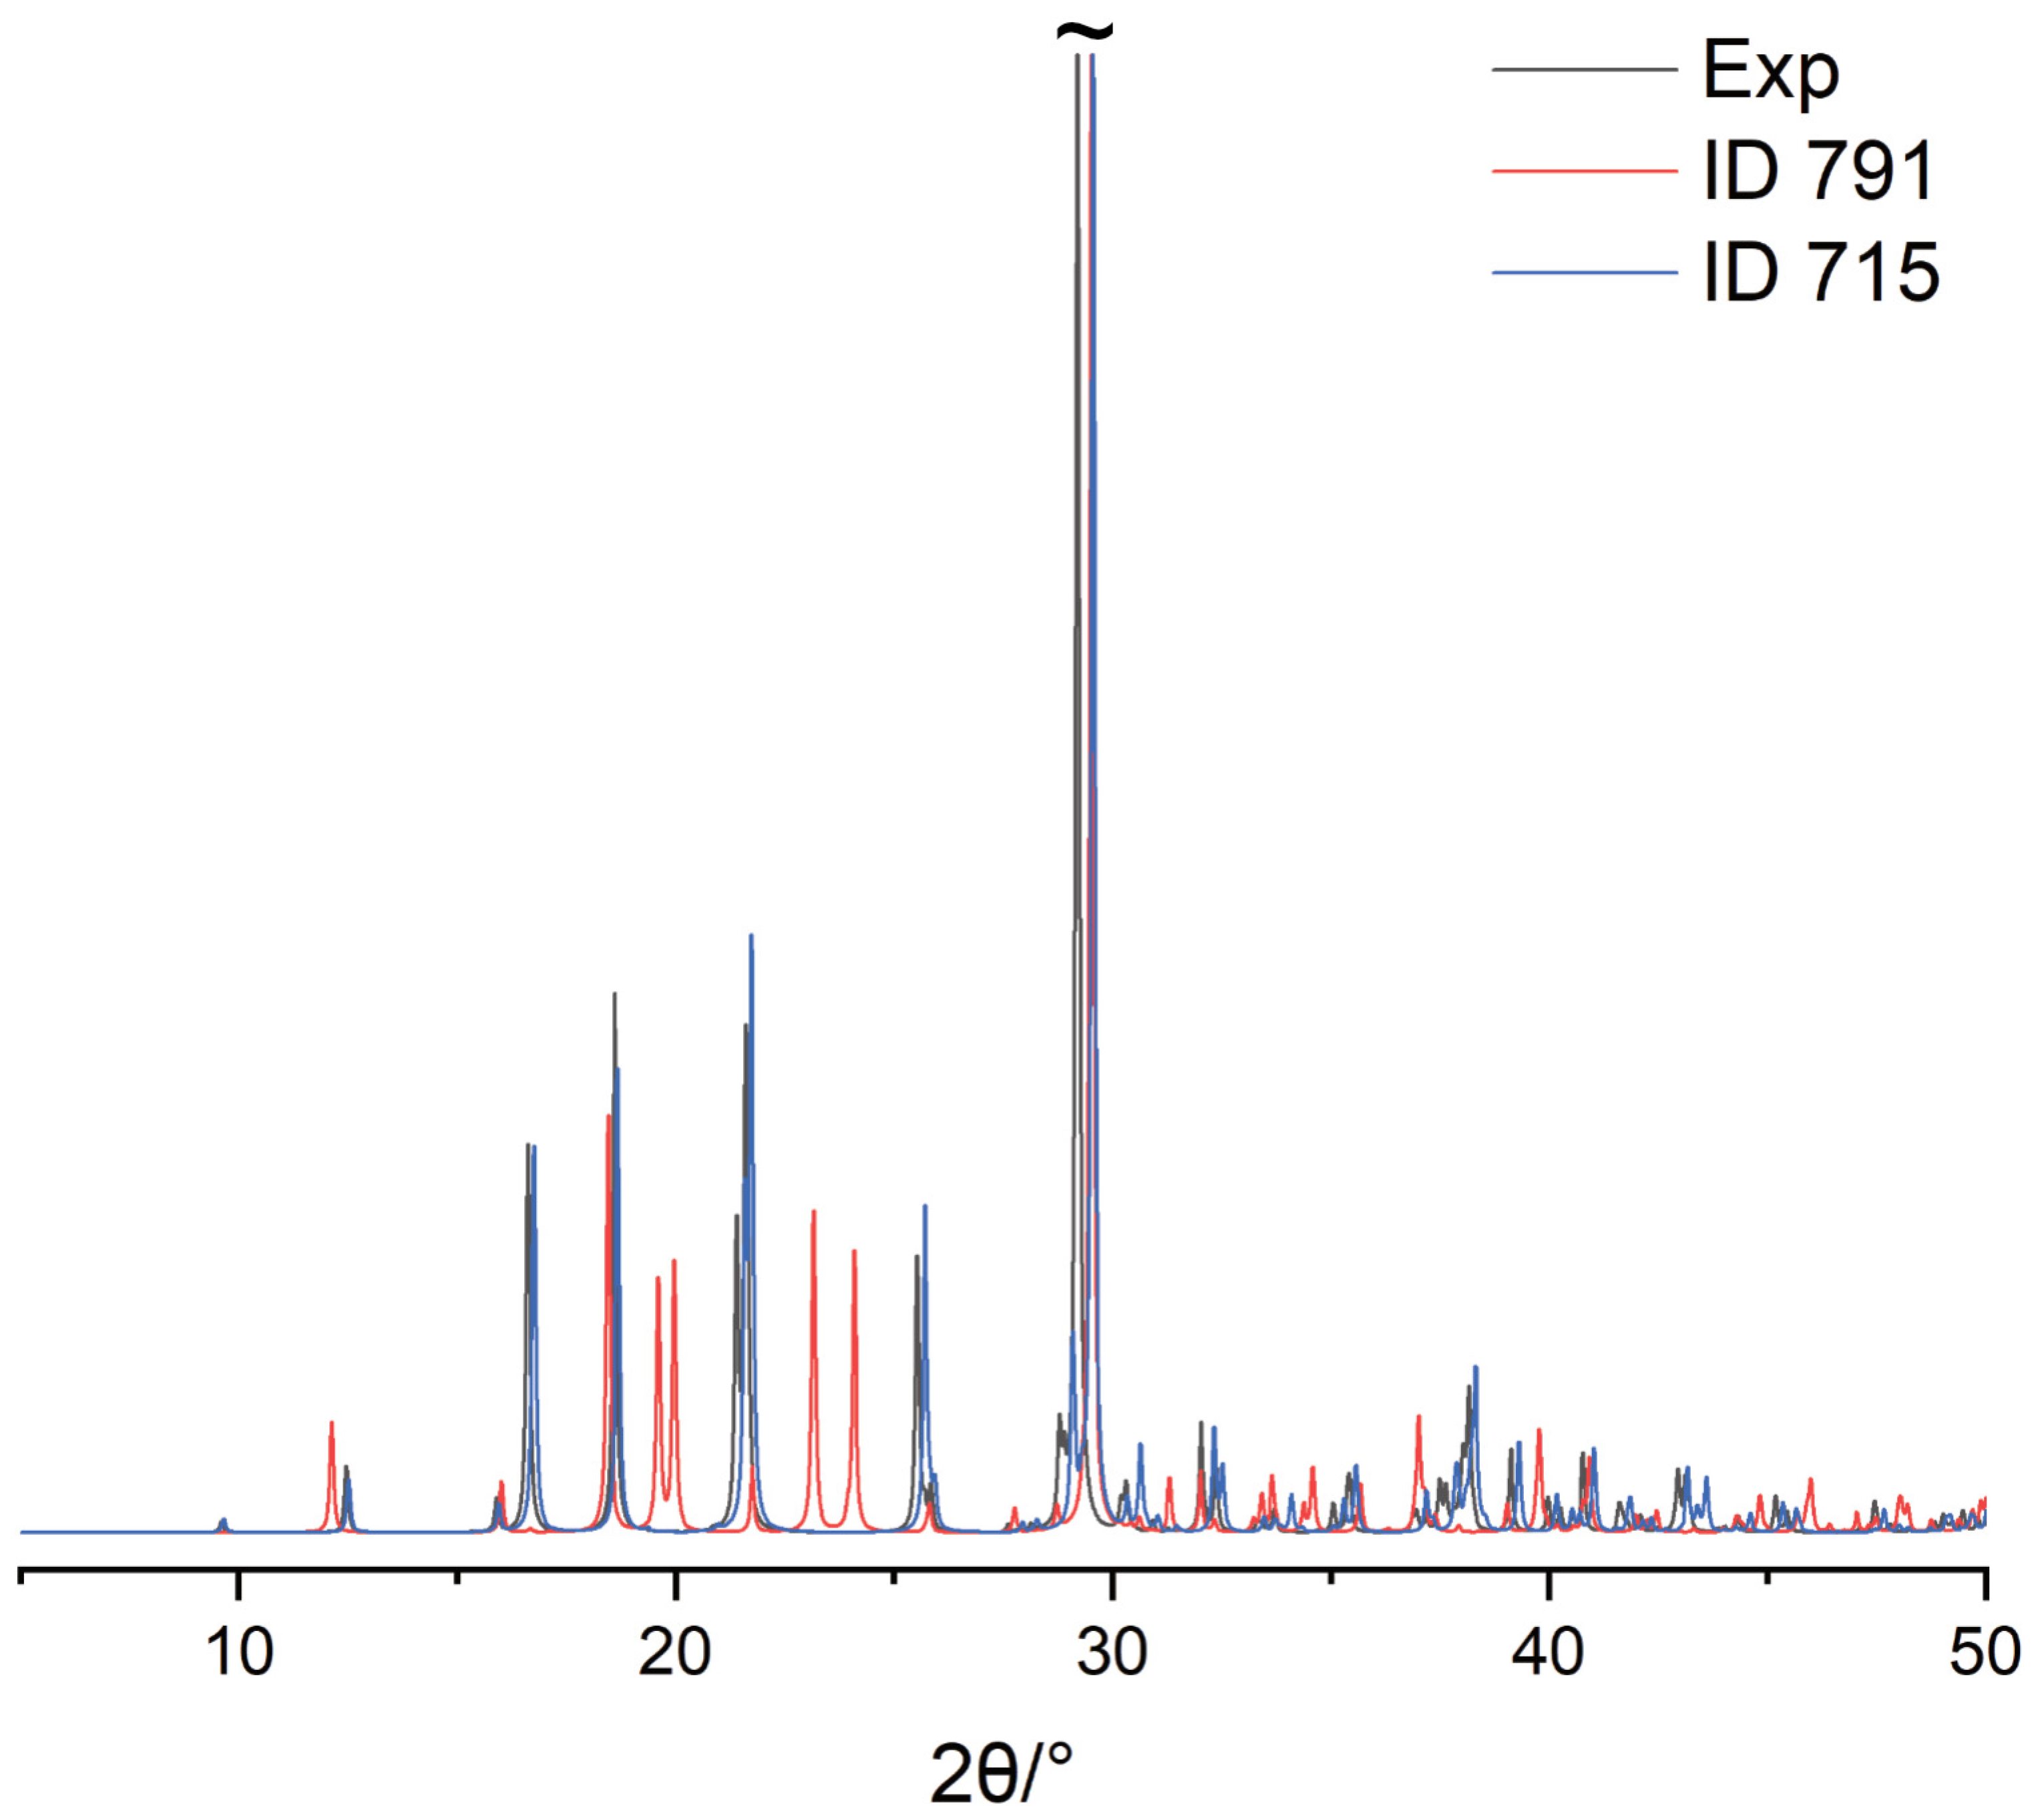
2.2.3. CSP of DNic
3. Materials and Methods
3.1. Materials
3.2. SSNMR Experiments
3.3. Crystal Structure Prediction
3.4. Crystal Structures Comparison and Visualisation
4. Conclusions
Supplementary Materials
Author Contributions
Funding
Institutional Review Board Statement
Informed Consent Statement
Data Availability Statement
Acknowledgments
Conflicts of Interest
Sample Availability
References
- Schlesinger, C.; Habermehl, S.; Prill, D. Structure Determination of Organic Compounds by a Fit to the Pair Distribution Function from Scratch without Prior Indexing. J. Appl. Crystallogr. 2021, 54, 776–786. [Google Scholar] [CrossRef] [PubMed]
- Neumann, M.A.; Leusen, F.J.J.; Kendrick, J. A Major Advance in Crystal Structure Prediction. Angew. Chem. Int. Ed. 2008, 47, 2427–2430. [Google Scholar] [CrossRef] [PubMed]
- Perrin, M.-A.; Neumann, M.A.; Elmaleh, H.; Zaske, L. Crystal Structure Determination of the Elusive Paracetamol Form III. Chem. Commun. 2009, 22, 3181–3183. [Google Scholar] [CrossRef] [PubMed]
- Price, S.L. The Computational Prediction of Pharmaceutical Crystal Structures and Polymorphism. Adv. Drug Deliv. Rev. 2004, 56, 301–319. [Google Scholar] [CrossRef]
- Price, S.L. Predicting Crystal Structures of Organic Compounds. Chem. Soc. Rev. 2014, 43, 2098–2111. [Google Scholar] [CrossRef] [Green Version]
- Braun, D.E.; Orlova, M.; Griesser, U.J. Creatine: Polymorphs Predicted and Found. Cryst. Growth Des. 2014, 14, 4895–4900. [Google Scholar] [CrossRef]
- Li, X.; Ou, X.; Wang, B.; Rong, H.; Wang, B.; Chang, C.; Shi, B.; Yu, L.; Lu, M. Rich Polymorphism in Nicotinamide Revealed by Melt Crystallization and Crystal Structure Prediction. Commun. Chem. 2020, 3, 152. [Google Scholar] [CrossRef]
- Bhowal, R.; Chopra, D. Investigating the Role of Weak Interactions to Explore the Polymorphic Diversity in Difluorinated Isomeric N-Phenylcinnamamides. Cryst. Growth Des. 2021, 21, 4162–4177. [Google Scholar] [CrossRef]
- Reilly, A.M.; Cooper, R.I.; Adjiman, C.S.; Bhattacharya, S.; Boese, A.D.; Brandenburg, J.G.; Bygrave, P.J.; Bylsma, R.; Campbell, J.E.; Car, R.; et al. Report on the Sixth Blind Test of Organic Crystal Structure Prediction Methods. Acta Crystallogr. Sect. B Struct. Sci. Cryst. Eng. Mater. 2016, 72, 439–459. [Google Scholar] [CrossRef]
- Heit, Y.N.; Beran, G.J.O. How Important Is Thermal Expansion for Predicting Molecular Crystal Structures and Thermochemistry at Finite Temperatures? Acta Crystallogr. Sect. B Struct. Sci. Cryst. Eng. Mater. 2016, 72, 514–529. [Google Scholar] [CrossRef] [Green Version]
- Bryce, D.L. NMR Crystallography: Structure and Properties of Materials from Solid-State Nuclear Magnetic Resonance Observables. IUCrJ 2017, 4, 350–359. [Google Scholar] [CrossRef] [PubMed] [Green Version]
- Hodgkinson, P. NMR Crystallography of Molecular Organics. Prog. Nucl. Magn. Reson. Spectrosc. 2020, 118–119, 10–53. [Google Scholar] [CrossRef] [PubMed]
- Harris, R.K. Applications of Solid-State NMR to Pharmaceutical Polymorphism and Related Matters. J. Pharm. Pharmacol. 2007, 59, 225–239. [Google Scholar] [CrossRef] [PubMed]
- Dudek, M.K.; Wielgus, E.; Paluch, P.; Śniechowska, J.; Kostrzewa, M.; Day, G.M.; Bujacz, G.D.; Potrzebowski, M.J. Understanding the Formation of Apremilast Cocrystals. Acta Crystallogr. Sect. B Struct. Sci. Cryst. Eng. Mater. 2019, 75, 803–814. [Google Scholar] [CrossRef] [PubMed] [Green Version]
- Khalaji, M.; Paluch, P.; Potrzebowski, M.J.; Dudek, M.K. Narrowing down the Conformational Space with Solid-State NMR in Crystal Structure Prediction of Linezolid Cocrystals. Solid State Nucl. Magn. Reson. 2022, 121, 101813. [Google Scholar] [CrossRef]
- Pawlak, T.; Sudgen, I.; Bujacz, G.; Iuga, D.; Brown, S.P.; Potrzebowski, M.J. Synergy of Solid-State NMR, Single-Crystal X-Ray Diffraction, and Crystal Structure Prediction Methods: A Case Study of Teriflunomide (TFM). Cryst. Growth Des. 2021, 21, 3328–3343. [Google Scholar] [CrossRef]
- Dudek, M.K.; Paluch, P.; Śniechowska, J.; Nartowski, K.P.; Day, G.M.; Potrzebowski, M.J. Crystal Structure Determination of an Elusive Methanol Solvate—Hydrate of Catechin Using Crystal Structure Prediction and NMR Crystallography. CrystEngComm 2020, 22, 4969–4981. [Google Scholar] [CrossRef]
- Dudek, M.K.; Paluch, P.; Pindelska, E. Crystal Structures of Two Furazidin Polymorphs Revealed by a Joint Effort of Crystal Structure Prediction and NMR Crystallography. Acta Crystallogr. Sect. B Struct. Sci. Cryst. Eng. Mater. 2020, 76, 322–335. [Google Scholar] [CrossRef]
- Rossi, F.; Cerreia Vioglio, P.; Bordignon, S.; Giorgio, V.; Nervi, C.; Priola, E.; Gobetto, R.; Yazawa, K.; Chierotti, M.R. Unraveling the Hydrogen Bond Network in a Theophylline–Pyridoxine Salt Cocrystal by a Combined X-Ray Diffraction, Solid-State NMR, and Computational Approach. Cryst. Growth Des. 2018, 18, 2225–2233. [Google Scholar] [CrossRef]
- Chierotti, M.R.; Ferrero, L.; Garino, N.; Gobetto, R.; Pellegrino, L.; Braga, D.; Grepioni, F.; Maini, L. The Richest Collection of Tautomeric Polymorphs: The Case of 2-Thiobarbituric Acid. Chem.–Eur. J. 2010, 16, 4347–4358. [Google Scholar] [CrossRef]
- Thureau, P.; Carvin, I.; Ziarelli, F.; Viel, S.; Mollica, G. A Karplus Equation for the Conformational Analysis of Organic Molecular Crystals. Angew. Chem. Int. Ed. 2019, 58, 16047–16051. [Google Scholar] [CrossRef] [PubMed] [Green Version]
- Bernasconi, D.; Bordignon, S.; Rossi, F.; Priola, E.; Nervi, C.; Gobetto, R.; Voinovich, D.; Hasa, D.; Duong, N.T.; Nishiyama, Y.; et al. Selective Synthesis of a Salt and a Cocrystal of the Ethionamide–Salicylic Acid System. Cryst. Growth Des. 2020, 20, 906–915. [Google Scholar] [CrossRef]
- Chierotti, M.R.; Gaglioti, K.; Gobetto, R.; Braga, D.; Grepioni, F.; Maini, L. From Molecular Crystals to Salt Co-Crystals of Barbituric Acid via the Carbonate Ion and an Improvement of the Solid State Properties. CrystEngComm 2013, 15, 7598–7605. [Google Scholar] [CrossRef]
- Thureau, P.; Sturniolo, S.; Zilka, M.; Ziarelli, F.; Viel, S.; Yates, J.R.; Mollica, G. Reducing the Computational Cost of NMR Crystallography of Organic Powders at Natural Isotopic Abundance with the Help of 13C-13C Dipolar Couplings. Magn. Reson. Chem. 2019, 57, 256–264. [Google Scholar] [CrossRef] [Green Version]
- Salager, E.; Day, G.M.; Stein, R.S.; Pickard, C.J.; Elena, B.; Emsley, L. Powder Crystallography by Combined Crystal Structure Prediction and High-Resolution 1H Solid-State NMR Spectroscopy. J. Am. Chem. Soc. 2010, 132, 2564–2566. [Google Scholar] [CrossRef]
- Harris, R.K.; Hodgkinson, P.; Zorin, V.; Dumez, J.-N.; Elena-Herrmann, B.; Emsley, L.; Salager, E.; Stein, R.S. Computation and NMR Crystallography of Terbutaline Sulfate. Magn. Reson. Chem. MRC 2010, 48 (Suppl. S1), S103–S112. [Google Scholar] [CrossRef]
- Hofstetter, A.; Balodis, M.; Paruzzo, F.M.; Widdifield, C.M.; Stevanato, G.; Pinon, A.C.; Bygrave, P.J.; Day, G.M.; Emsley, L. Rapid Structure Determination of Molecular Solids Using Chemical Shifts Directed by Unambiguous Prior Constraints. J. Am. Chem. Soc. 2019, 141, 16624–16634. [Google Scholar] [CrossRef]
- Bravetti, F.; Bordignon, S.; Alig, E.; Eisenbeil, D.; Fink, L.; Nervi, C.; Gobetto, R.; Schmidt, M.U.; Chierotti, M.R. Solid-State NMR-Driven Crystal Structure Prediction of Molecular Crystals: The Case of Mebendazole. Chem.-Eur. J. 2022, 28, e202103589. [Google Scholar] [CrossRef]
- Kumar, S.; Chawla, G.; Sobhia, M.E.; Bansal, A.K. Characterization of Solid-State Forms of Mebendazole. Die Pharm.-Int. J. Pharm. Sci. 2008, 63, 136–143. [Google Scholar]
- Braga, D.; Maini, L.; Fagnano, C.; Taddei, P.; Chierotti, M.R.; Gobetto, R. Polymorphism in Crystalline Cinchomeronic Acid. Chem.-Eur. J. 2007, 13, 1222–1230. [Google Scholar] [CrossRef]
- Fang, S.-M.; Hu, M.; Zhang, Q.; Du, M.; Liu, C.-S. Ag(I) and Zn(II) Coordination Polymers with a Bulky Naphthalene-Based Dicarboxyl Tecton and Different 4,4′-Bipyridyl-like Bridging Co-Ligands: Structural Regulation and Properties. Dalton Trans. 2011, 40, 4527–4541. [Google Scholar] [CrossRef] [PubMed]
- Takusagawa, F.; Hirotsu, K.; Shimada, A. The Crystal Structure of Quinolinic Acid. Bull. Chem. Soc. Jpn. 1973, 46, 2372–2380. [Google Scholar] [CrossRef]
- Takusagawa, F.; Koetzle, T.F. Neutron Diffraction Study of Quinolinic Acid Recrystallized from D2O: Evaluation of Temperature and Isotope Effects in the Structure. Acta Crystallogr. Sect. B: Struct. Crystallogr. Cryst. Chem. 1979, 35, 2126–2135. [Google Scholar] [CrossRef] [Green Version]
- Carranza Téllez, V.; Sánchez Gaytán, B.; Bernès, S.; González Vergara, E. The Supramolecular Structure of Pyridine-2,6-Dicarboxylic Acid. Acta Crystallogr. C 2002, 58 Pt 4, O228–O230. [Google Scholar] [CrossRef]
- Takusagawa, F.; Hirotsu, K.; Shimada, A. The Crystal Structure of Dinicotinic Acid. Bull. Chem. Soc. Jpn. 1973, 46, 2292–2299. [Google Scholar] [CrossRef] [Green Version]
- Cowan, J.A.; Howard, J.A.K.; McIntyre, G.J.; Lo, S.M.-F.; Williams, I.D. Variable-Temperature Neutron Diffraction Studies of the Short, Strong Hydrogen Bonds in the Crystal Structure of Pyridine-3,5-Di carboxylic Acid. Acta Crystallogr. 2005, 61, 724–730. [Google Scholar] [CrossRef]
- Cerreia Vioglio, P.; Chierotti, M.R.; Gobetto, R. Pharmaceutical Aspects of Salt and Cocrystal Forms of APIs and Characterization Challenges. Adv. Drug Delivery Rev. 2017, 117, 86–110. [Google Scholar] [CrossRef]
- Dalvit, C.; Veronesi, M.; Vulpetti, A. 1H and 19F NMR Chemical Shifts for Hydrogen Bond Strength Determination: Correlations between Experimental and Computed Values. J. Magn. Reson. Open 2022, 12–13, 100070. [Google Scholar] [CrossRef]
- Maruyoshi, K.; Iuga, D.N.; Antzutkin, O.; Alhalaweh, A.; P. Velaga, S.; P. Brown, S. Identifying the Intermolecular Hydrogen-Bonding Supramolecular Synthons in an Indomethacin–Nicotinamide Cocrystal by Solid-State NMR. Chem. Commun. 2012, 48, 10844–10846. [Google Scholar] [CrossRef]
- Duong, N.T.; Rossi, F.; Makrinich, M.; Goldbourt, A.; Chierotti, M.R.; Gobetto, R.; Nishiyama, Y. Accurate 1H-14N Distance Measurements by Phase-Modulated RESPDOR at Ultra-Fast MAS. J. Magn. Reson. 2019, 308, 106559. [Google Scholar] [CrossRef]
- Duong, N.T.; Gan, Z.; Nishiyama, Y. Selective 1H-14N Distance Measurements by 14N Overtone Solid-State NMR Spectroscopy at Fast MAS. Front. Mol. Biosci. 2021, 8. [Google Scholar] [CrossRef] [PubMed]
- Duong, N.T.; Nishiyama, Y. Detection of Remote Proton–Nitrogen Correlations by 1H-Detected 14N Overtone Solid-State NMR at Fast MAS. Phys. Chem. Chem. Phys. 2022, 24, 10717–10726. [Google Scholar] [CrossRef] [PubMed]
- Childs, S.L.; Stahly, G.P.; Park, A. The Salt−Cocrystal Continuum: The Influence of Crystal Structure on Ionization State. Mol. Pharmaceutics 2007, 4, 323–338. [Google Scholar] [CrossRef] [PubMed] [Green Version]
- Steiner, T.; Majerz, I.; Wilson, C.C. First O-H-N Hydrogen Bond with a Centered Proton Obtained by Thermally Induced Proton Migration. Angew. Chem., Int. Ed. Engl. 2001, 40, 2651–2654. [Google Scholar] [CrossRef] [PubMed]
- Nyman, J.; Day, G.M. Static and Lattice Vibrational Energy Differences between Polymorphs. CrystEngComm 2015, 17, 5154–5165. [Google Scholar] [CrossRef] [Green Version]
- Guan, X.; Stark, R.E. A General Protocol for Temperature Calibration of MAS NMR Probes at Arbitrary Spinning Speeds. Solid State Nucl. Magn. Reson. 2010, 38, 74–76. [Google Scholar] [CrossRef] [Green Version]
- Available online: https://gaussian.com/ (accessed on 2 March 2020).
- Weigend, F.; Ahlrichs, R. Balanced Basis Sets of Split Valence, Triple Zeta Valence and Quadruple Zeta Valence Quality for H to Rn: Design and Assessment of Accuracy. Phys. Chem. Chem. Phys. 2005, 7, 3297–3305. [Google Scholar] [CrossRef]
- Weigend, F. Accurate Coulomb-Fitting Basis Sets for H to Rn. Phys. Chem. Chem. Phys. 2006, 8, 1057–1065. [Google Scholar] [CrossRef]
- Grimme, S.; Ehrlich, S.; Goerigk, L. Effect of the Damping Function in Dispersion Corrected Density Functional Theory. J. Comput. Chem. 2011, 32, 1456–1465. [Google Scholar] [CrossRef]
- Oganov, A.R.; Glass, C.W. Crystal Structure Prediction Using Ab Initio Evolutionary Techniques: Principles and Applications. J. Chem. Phys. 2006, 124, 244704. [Google Scholar] [CrossRef] [Green Version]
- Oganov, A.R.; Lyakhov, A.O.; Valle, M. How Evolutionary Crystal Structure Prediction Works—And Why. Acc. Chem. Res. 2011, 44, 227–237. [Google Scholar] [CrossRef] [PubMed]
- Mayo, S.L.; Olafson, B.D.; Goddard, W.A. DREIDING: A Generic Force Field for Molecular Simulations. J. Phys. Chem. 1990, 94, 8897–8909. [Google Scholar] [CrossRef]
- Kresse, G.; Joubert, D. From Ultrasoft Pseudopotentials to the Projector Augmented-Wave Method. Phys. Rev. B 1999, 59, 1758–1775. [Google Scholar] [CrossRef]
- Giannozzi, P.; Baroni, S.; Bonini, N.; Calandra, M.; Car, R.; Cavazzoni, C.; Ceresoli, D.; Chiarotti, G.L.; Cococcioni, M.; Dabo, I.; et al. QUANTUM ESPRESSO: A Modular and Open-Source Software Project for Quantum Simulations of Materials. J. Phys. Condens. Matter 2009, 21, 395502. [Google Scholar] [CrossRef]
- Lee, K.; Murray, É.D.; Kong, L.; Lundqvist, B.I.; Langreth, D.C. Higher-Accuracy van Der Waals Density Functional. Phys. Rev. B 2010, 82, 081101. [Google Scholar] [CrossRef] [Green Version]
- Hamada, I. Van Der Waals Density Functional Made Accurate. Phys. Rev. B 2014, 89, 121103. [Google Scholar] [CrossRef]
- Prandini, G.; Marrazzo, A.; Castelli, I.E.; Mounet, N.; Marzari, N. Precision and Efficiency in Solid-State Pseudopotential Calculations. NPJ Comput. Mater. 2018, 4, 72. [Google Scholar] [CrossRef] [Green Version]
- Lejaeghere, K.; Bihlmayer, G.; Björkman, T.; Blaha, P.; Blügel, S.; Blum, V.; Caliste, D.; Castelli, I.E.; Clark, S.J.; Dal Corso, A.; et al. Reproducibility in Density Functional Theory Calculations of Solids. Science 2016, 351, aad3000. [Google Scholar] [CrossRef] [Green Version]
- Charpentier, T. The PAW/GIPAW Approach for Computing NMR Parameters: A New Dimension Added to NMR Study of Solids. Solid State Nucl. Magn. Reson. 2011, 40, 1–20. [Google Scholar] [CrossRef]
- Corso, A. Pseudopotentials Periodic Table: From H to Pu. Comput. Mater. Sci. 2014, 95, 337–350. [Google Scholar] [CrossRef]
- Franco, F.; Baricco, M.; Chierotti, M.R.; Gobetto, R.; Nervi, C. Coupling Solid-State NMR with GIPAW Ab Initio Calculations in Metal Hydrides and Borohydrides. J. Phys. Chem. C 2013, 117, 9991–9998. [Google Scholar] [CrossRef]
- Harris, R.K.; Hodgkinson, P.; Pickard, C.J.; Yates, J.R.; Zorin, V. Chemical Shift Computations on a Crystallographic Basis: Some Reflections and Comments. Magn. Reson. Chem. 2007, 45 (Suppl. S1), S174–S186. [Google Scholar] [CrossRef] [PubMed]
- Reddy, G.N.M.; Huqi, A.; Iuga, D.; Sakurai, S.; Marsh, A.; Davis, J.T.; Masiero, S.; Brown, S.P. Co-Existence of Distinct Supramolecular Assemblies in Solution and in the Solid State. Chem.–Eur. J. 2017, 23, 2315–2322. [Google Scholar] [CrossRef] [PubMed]
- Nimmo, J.K.; Lucas, B.W. Solid-State Phase Transition in Triethylenediamine, N(CH2CH2)3N. I. The Crystal Structure of Phase II at 298 K. Acta Crystallogr. B 1976, 32, 348–353. [Google Scholar] [CrossRef] [Green Version]


| O∙∙∙O (Å) | δ 1H (ppm) | O∙∙∙N (Å) | δ 1H (ppm) | |
|---|---|---|---|---|
| QA | 2.399 | 20.4 | 2.725 | 14.7 |
| DPA | 2.625 | 14.2 | ||
| DNic | 2.594 a | 12.8 | 2.515 a | 19.5 |
| ID | ΔE Dreiding FF (kJ/mol) | Space Group | |
|---|---|---|---|
| 315 | 0.0 | P21 21 21 (19) | |
| 1059 | 7.3 | P(2) | |
| 630 | 8.0 | P21/c (14) | |
| 567 | 8.3 | P(2) | |
| ID | ΔE PBE vdW-df2 (kJ/mol) | 13C RMSE (ppm) | 1H RMSE (ppm) |
| 315 | 0.00 | 2.8 | 0.6 |
| 630 | 4.66 | 1.8 | 0.4 |
| Space Group | Volume/Å3 | a/Å | b/Å | c/Å | α/° | β/° | γ/° | |
|---|---|---|---|---|---|---|---|---|
| Exp | P21/c (14) | 658.495 | 7.4218 | 12.7050 | 7.8342 | 90.000 | 116.950 | 90.000 |
| ID 630 | P21/c (14) | 653.542 | 7.8209 | 12.5746 | 8.0365 | 90.000 | 124.218 | 90.000 |
| ID 315 | P212121 (19) | 663.373 | 14.0748 | 6.7988 | 6.9324 | 90.000 | 90.000 | 90.000 |
| ID | ΔE Dreiding FF (kJ/mol) | ΔE PBE vdW-df2 (kJ/mol) | Space Group | 13C RMSE (ppm) | 1H RMSE (ppm) |
|---|---|---|---|---|---|
| 80 | 0.9 | 0.00 | P21/m (11) | 1.1 | 1.4 |
| 448 | 0.0 | 7.91 | P(2) | 2.7 | 2.9 |
| Space Group | Volume/Å3 | a/Å | b/Å | c/Å | α/° | β/° | γ/° | |
|---|---|---|---|---|---|---|---|---|
| Exp | P21/m (11) | 338.666 | 3.7663 | 16.1667 | 5.5705 | 90.000 | 93.160 | 90.000 |
| 80 | P21/m (11) | 324.968 | 3.6202 | 16.0829 | 5.5819 | 90.000 | 90.759 | 90.000 |
| 448 | P (2) | 323.144 | 7.6977 | 7.4146 | 6.6543 | 70.364 | 83.685 | 110.698 |
| ID | ΔE PBE vdW-df2 (kJ/mol) | Space Group | 13C RMSE 298 K (ppm) | 13C RMSE 173.15 K (ppm) | 1H RMSE (ppm) |
|---|---|---|---|---|---|
| 715 | 0 | P21/c (14) | 2.2 | 1.8 | 1.7 |
| 791 | 1.0 | P21/c (14) | 1.5 | 1.4 | 1.4 |
| Space Group | Volume/Å3 | a/Å | b/Å | c/Å | α/° | β/° | γ/° | |
|---|---|---|---|---|---|---|---|---|
| Exp | P21/c (14) | 660.255 | 9.7116 | 11.1347 | 6.4421 | 90.000 | 108.600 | 90.000 |
| 715 | P21/c (14) | 649.278 | 9.7225 | 11.1105 | 6.3827 | 90.000 | 109.583 | 90.000 |
| 791 | P21/c (14) | 651.722 | 11.8823 | 11.0653 | 6.0679 | 90.000 | 125.226 | 90.000 |
Disclaimer/Publisher’s Note: The statements, opinions and data contained in all publications are solely those of the individual author(s) and contributor(s) and not of MDPI and/or the editor(s). MDPI and/or the editor(s) disclaim responsibility for any injury to people or property resulting from any ideas, methods, instructions or products referred to in the content. |
© 2023 by the authors. Licensee MDPI, Basel, Switzerland. This article is an open access article distributed under the terms and conditions of the Creative Commons Attribution (CC BY) license (https://creativecommons.org/licenses/by/4.0/).
Share and Cite
Bravetti, F.; Russo, R.E.; Bordignon, S.; Gallo, A.; Rossi, F.; Nervi, C.; Gobetto, R.; Chierotti, M.R. Zwitterionic or Not? Fast and Reliable Structure Determination by Combining Crystal Structure Prediction and Solid-State NMR. Molecules 2023, 28, 1876. https://doi.org/10.3390/molecules28041876
Bravetti F, Russo RE, Bordignon S, Gallo A, Rossi F, Nervi C, Gobetto R, Chierotti MR. Zwitterionic or Not? Fast and Reliable Structure Determination by Combining Crystal Structure Prediction and Solid-State NMR. Molecules. 2023; 28(4):1876. https://doi.org/10.3390/molecules28041876
Chicago/Turabian StyleBravetti, Federica, Raffaele E. Russo, Simone Bordignon, Angelo Gallo, Federica Rossi, Carlo Nervi, Roberto Gobetto, and Michele R. Chierotti. 2023. "Zwitterionic or Not? Fast and Reliable Structure Determination by Combining Crystal Structure Prediction and Solid-State NMR" Molecules 28, no. 4: 1876. https://doi.org/10.3390/molecules28041876