2.1. Sol–Gel Synthesis (TiO2@SS_S)
Data from colloidal characterization of TiO
2@SS_S samples, differing for the TiO
2:SS weight ratio (details in
Section 3.2.1), are reported in
Table 1. We observed an increase in hydrodynamic diameters, determined by DLS analysis (
Figure S1 and
Table 1), as a function of the SS amount. This was justified by the increase in the steric hindrance of the SS shell and by the destabilization of colloidal dispersion, which were caused by free, non-adsorbing molecules in solution (depletion flocculation) [
19]. The zeta-potential curves as a function of pH, reported in
Figure 1, show an abrupt change in colloidal properties, passing from a 1:1 to 1:2 TiO
2:SS ratio. Two populations are clustered around the curves of the two separate components: one with nanometric hydrodynamic diameters, positive zeta potential, and an isoelectric point comparable with that of the TiO
2 reference sample (TiO
2@TX) and the other with micrometric hydrodynamic diameters, negative zeta potential, and an isoelectric point similar that of SS. This result offered a clear indication of which design option to select if we wish to prioritize the TiO
2 or the SS colloidal identity in the hybrid system.
A breaking point, passing from the 1: 1 and 1: 2 TiO
2:SS ratios, was also observed in the XRD diffractograms (
Figure 2). The peaks of TiO
2 anatase with small traces of brookite were observed up to the TiO
2:SS 1:1 weight ratio. In the group of samples with higher SS content, the characteristic peaks of the anatase phase disappeared. In this case, we can hypothesize the formation of very small clusters where the ionic phase is still in equilibrium with the solid [
20,
21] or the presence of amorphous titania phase [
22]. In this group of samples, in relation to the high content of SS, we noticed the formation of NaCl as a by-product of the synthesis. This was identifiable based on peaks at 2
θ = 32° and 47°. At 2
θ = 18°, a broad peak, which was attributable to the organic phase, confirmed the presence of the high concentration of SS.
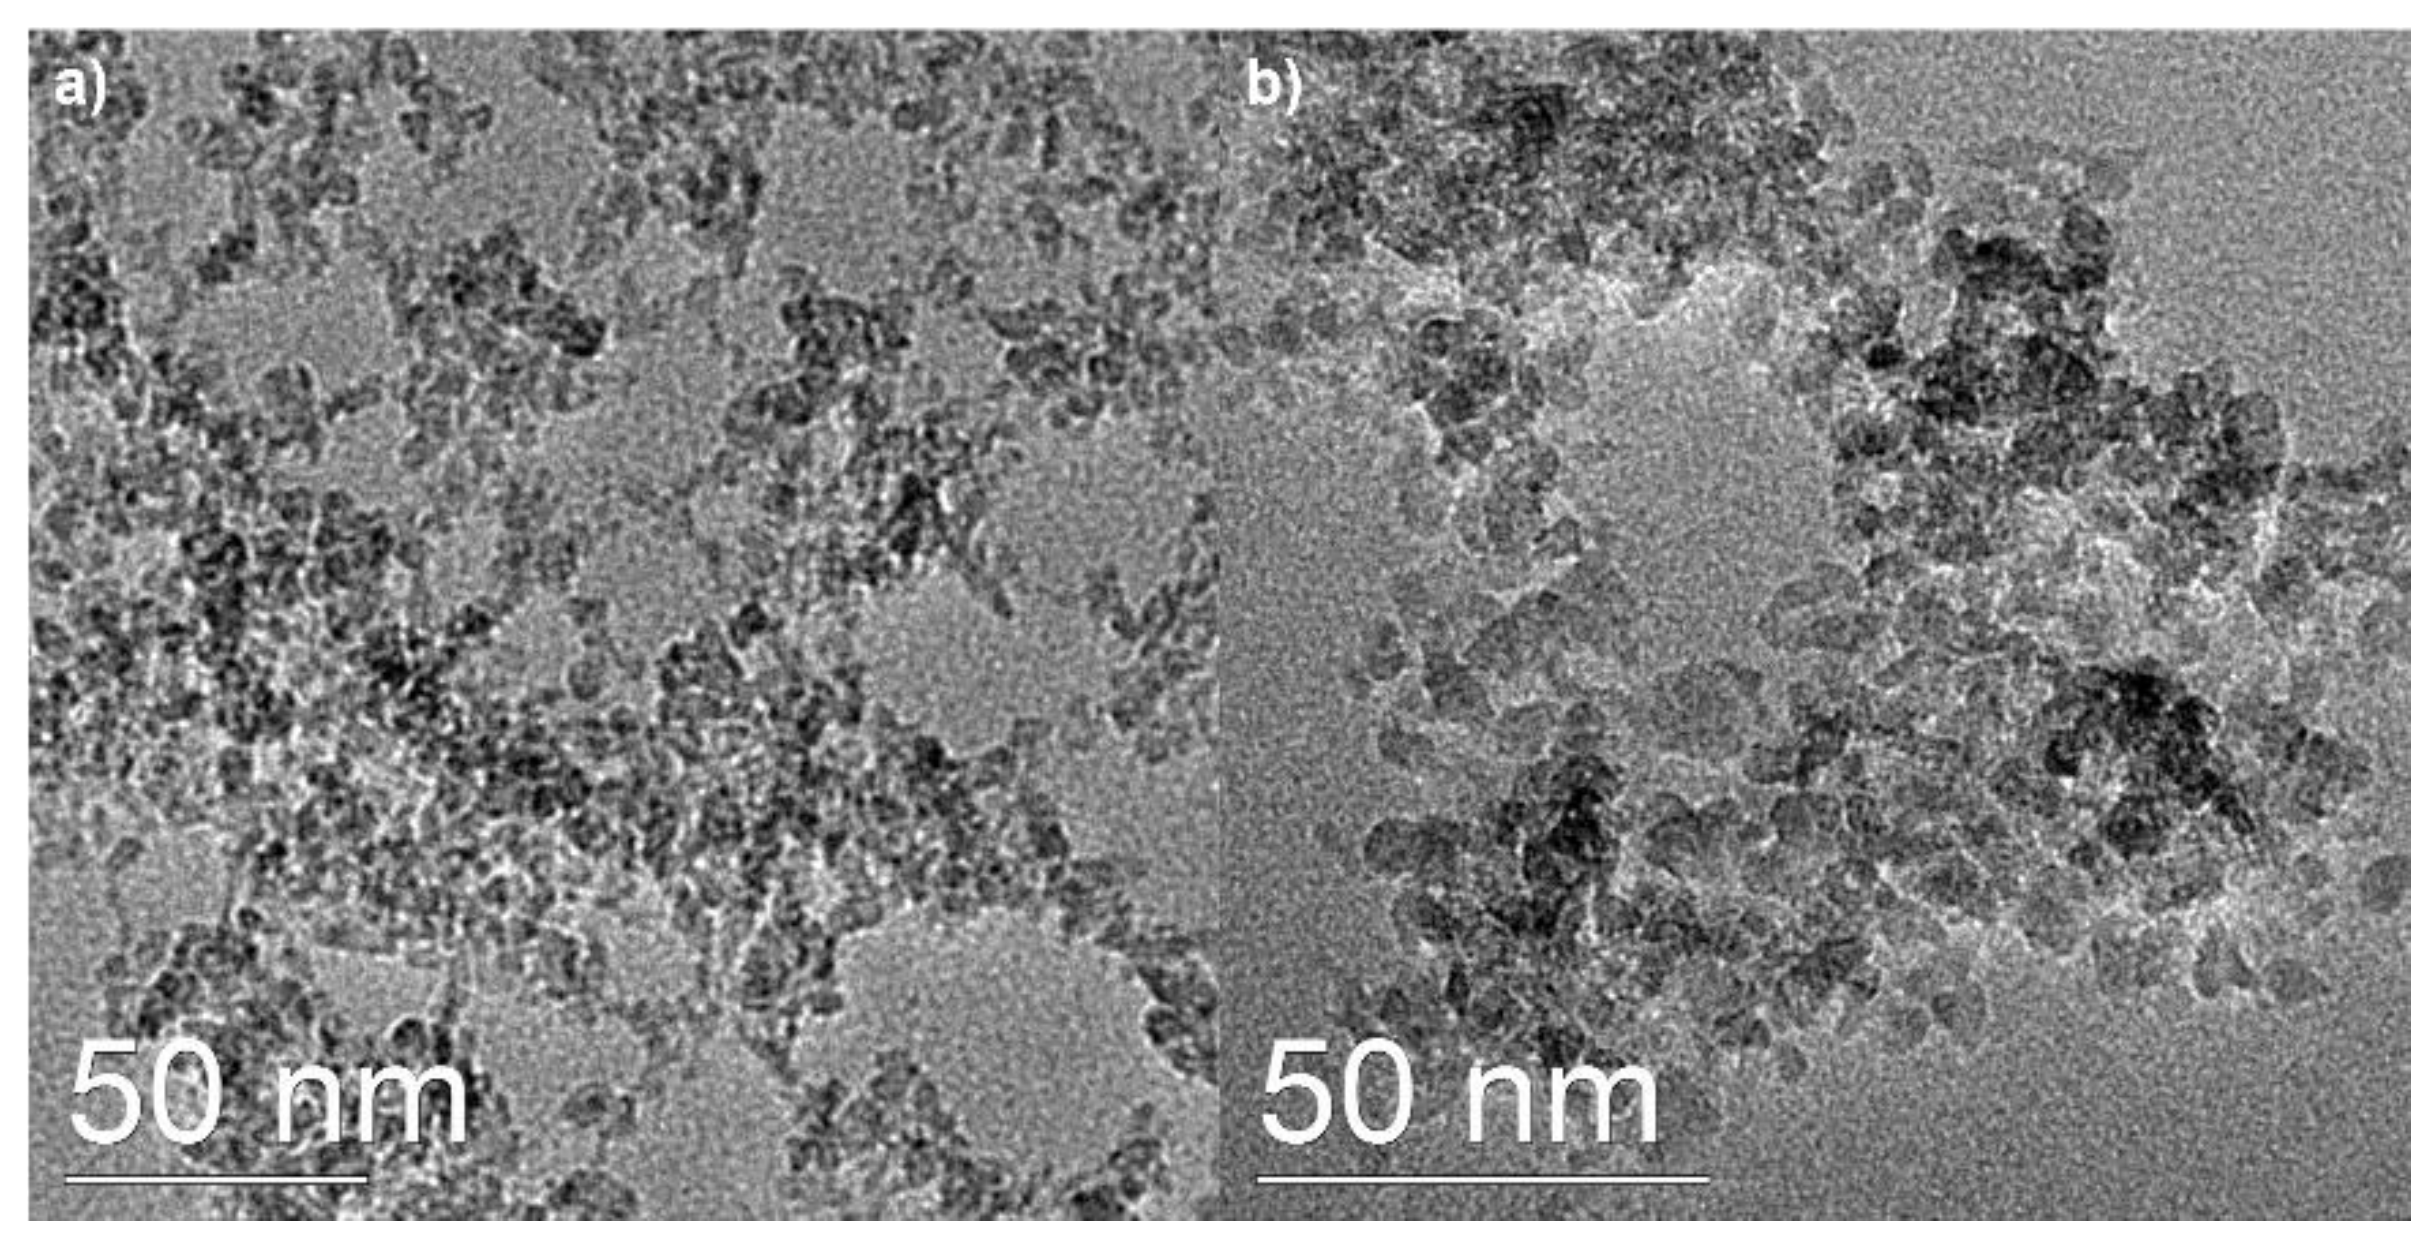
In order to verify the formation of TiO
2 NPs, TEM analysis was carried out.
Figure 3 reports the TEM images of TiO
2@SS_S_1:0.1 and TiO
2@SS_S_1:1 sample, confirming the presence of crystalline well-dispersed TiO
2 NPs, with sizes ranging from 3 to 12 nm and from 2 to 10 nm, respectively. The selected area electron diffraction (SAED) pattern and the relative rotational average (
Figure S2) showed that all rings can be indexed as a mixture of anatase (majority phase) and brookite nanocrystals, confirming the data obtained via XRD analysis (
Figure 2). By increasing the content of SS in TiO
2@SS_S_1:2 and TiO
2@SS_S_1:6 samples, no evidence of the presence of TiO
2 NPs could be found via TEM analysis. Moreover, no evidence of the presence of crystalline NPs could be detected by SAED patterns. The TEM results confirm the hypothesis that very small clusters in equilibrium with their ionic phase should form at a high SS concentration, as the presence of SS hindered the growth of the as-formed nuclei.
2.2. Heterocoagulation Process (TiO2/SS_E)
The physical mixing of oppositely charged TiO
2@TX_S and SS (
Table 2) provided the heterocoagulated samples TiO
2/SS_E, whose components are mainly bound by electrostatic attractive interactions [
23]. The samples were prepared at different TiO
2:SS weight ratios (see
Section 3.2.2 for details). Additionally, in this case, we investigated the colloidal behavior of DLS and zeta-potential measurements and noted an increase in the hydrodynamic size of the multicomponent system with the increase in SS content. In particular, the sample corresponding to the TiO
2:SS 1:1 weight ratio was the first to reverse the positive zeta potential of TiO
2, which had dramatic consequences for the colloidal stability (DLS size around 1 μm), as reported in
Table 2 and
Figure S3a. With higher content of SS, the hydrodynamic diameter decreased, and the negative zeta potential of the composite increased due to the electrosteric contribution of S which, in the case of heterocoagulated samples, acts as a dispersing agent. As was the case for sol–gel samples, the isoelectric points (pH
iep) of the heterocoagulated samples at high content of SS (1:6 and 1:8 TiO
2:SS weight ratio) are coincident to that of SS (
Figure S3b) even if the breaking point is not so evident, as in the previous case.
The XRD diffractograms showed the presence of both phases, as expected (
Figure 4). TiO
2 (anatase phase) was recognized from characteristic peaks at 2
θ = 25°, 38, 48, and 54°. Additionally, small traces of brookite were detected at 2
θ = 26°. The SS organic phase showed a broad peak at 2
θ = 18°. We observed a proportional increase in intensity of the SS peak as the SS content in the samples increased; this passed from TiO
2/SS_1:1_E to TiO
2/SS_1:8_E. The formation of a synthesis by-product, NaCl, was also identifiable, with peaks at 2
θ = 32° and 47°.
2.3. Comparison between TiO2@SS_1:1_S and TiO2/SS_1:1_E
The TiO2@SS_1:1_S and TiO2/SS_1:1_E samples are the most representative for both synthesis methods of hybrid systems; in fact, they represent the breaking point, with a shift of properties from TiO2 to the SS component. Therefore, these samples were further investigated by additional characterization techniques (FTIR spectroscopy and BET analysis).
In
Figure 5a, comparison between the FTIR spectra of TiO
2@SS_1:1_S and TiO
2/SS_1:1_E samples with single components (TiO
2@TX and SS) is reported. The reference TiO
2@TX (black curve) showed a broad band at 500–800 cm
−1 corresponding to the vibration of Ti-O-O bond [
24] and Ti-O stretching [
25], confirming the presence of TiO
2. Moreover, we observed some peaks in the wavenumber range 1100–1600 cm
−1; these are attributable to Triton X. Their low intensity is due to the high TiO
2:Triton X weight ratio (
Table S1). The peaks at 1100 and 1243 cm
−1 correspond to the asymmetric stretch of aromatic ether; those in the range 1360–1450 cm
−1 are related to the C-H bending vibration; and peaks at 1511 and 1610 cm
−1 correspond to the stretching vibration of the benzene group [
26]. The light-blue curve in
Figure 5a shows the FTIR spectrum of the SS component, which clearly highlights the typical peaks of lipopeptide biosurfactant, with peaks at 3350 and 1528 cm
−1 attributed to NH-stretching mode and peaks at 2956–2870 cm
−1 and 1467–1368 cm
−1 representative of the C–H group of aliphatic chains (–CH
3; –CH
2–) with symmetric stretching at 2870 cm
−1.
The FTIR analysis on hybrid TiO
2@SS_1:1_S and TiO
2/SS_1:1_E samples allowed us to confirm the presence of typical functional groups of both TiO
2 and SS. The main characteristic peaks of TiO
2 and SS were observed in both TiO
2@SS_1:1_S and TiO
2/SS_1:1_E samples (
Figure 5a). Through detailed comparison of the two samples, we can observe a lower intensity of peaks corresponding to the SS and the absence of characteristic bands of SS at high wavenumber in the TiO
2@SS_1:1_S sample (blue curve). On the other hand, in the TiO
2/SS_1:1_E sample (dark-green curve), obtained by heterocoagulation, all characteristic peaks of SS were recognized. These observations could be justified by a stronger interaction between TiO
2 NPs and SS in the sample obtained by sol–gel synthesis method, with the formation of a new hybrid phase slightly different from the single component.
The specific surface areas (SSAs) of spray-freeze-dried (SFD) powders are reported in
Figure 5b. Samples synthesized using a sol–gel method at a low SS concentration show high values of surface area comparable with that of the TiO
2 component. The SSA of TiO
2:SS_1:1_S sample is five-fold higher than the corresponding heterocoagulated sample. This result is most likely due to intimate molecular interaction between the two components in the sol–gel-synthesized samples, which promotes a real dispersing action of SS over TiO
2 NPs. The abrupt decrease in surface area that occurs as a result of the increasing TiO
2:SS weight ratio is in agreement with the increased agglomeration caused by the SS depletion action discussed previously (
Table 1). Additionally, the low surface area of the heterocoagulated sample is justified by the high degree of agglomeration of this sample, which decreases the number of TiO
2-accessible surface sites.

 ,
, 


