Article

Natural Zeolites for the Sorption of Ammonium: Breakthrough Curve Evaluation and Modeling

Institute of Water Chemistry, Technische Universität Dresden, 01062 Dresden, Germany
*
Author to whom correspondence should be addressed.
Molecules 2023, 28(4), 1614; https://doi.org/10.3390/molecules28041614
Submission received: 17 January 2023 / Revised: 1 February 2023 / Accepted: 3 February 2023 / Published: 7 February 2023
(This article belongs to the Section Natural Products Chemistry)

Abstract

:
The excessive use of ammonium fertilizer and its associated leakage threatens aquatic environments around the world. With a focus on the treatment of drinking water, the scope of this study was to evaluate and model the breakthrough curves for NH4+ in zeolite-filled, fixed-bed columns. Breakthrough experiments were performed in single- and multi-sorbate systems with the initial K+ and NH4+ concentrations set to 0.7 mmol/L. Breakthrough curves were successfully modeled by applying the linear driving force (LDF) and Thomas models. Batch experiments revealed that a good description of NH4+ sorption was provided by the Freundlich sorption model (R2 = 0.99), while unfavorable sorption was determined for K+ (nF = 2.19). Intraparticle diffusion was identified as the rate limiting step for NH4+ and K+ during breakthrough. Compared to ultrapure water, the use of tap, river, and groundwater matrices decreased the treated bed volumes by between 25% and 69%—as measured at a NH4+ breakthrough level of 50%. The concentrations of K+ and of dissolved organic carbon (DOC) were identified as the main parameters that determine NH4+ sorption in zeolite-filled, fixed-bed columns. Based on our results, the LDF and Thomas models are promising tools to predict the breakthrough curves of NH4+ in zeolite-filled, fixed-bed columns.

1. Introduction

To meet worldwide food demands, the use of nitrogen (N) fertilizer in agricultural applications has increased by 985% between 1961 and 2020 [1]. The use of N fertilizer (mainly in the form of ammonium—NH4+) has several advantages: increased crop qualities; increased yields; and increased resistance to environmental stresses (e.g., limited water availability) [2,3].
Farmers in threshold and developing countries often use excessive amounts of N fertilizer because of difficulties in predicting the requirements of each specific plant and soil condition. This leads to N leakage of between 40% and 50% on average globally and has major impacts on both soil and water environments (e.g., increased oxygen demand and simulation of eutrophication) [4,5]. Under anaerobic groundwater conditions, NH4+ concentrations as high as 390 mg/L have been recorded in a coastal aquifer-aquitard system in the Pearl River Delta, China [6]. Considering that global food demands continue to increase, it is reasonable to assume that NH4+ levels will also increase across various water matrices and environmental niches.
Compliance with local threshold values is the determining factor when selecting a suitable process for the removal of NH4+ from drinking water. NH4+ is only considered harmful to humans at levels above 100 mg/kg body weight per day [7]. During drinking water treatment processes, the formation of toxicologically relevant NO2 species (via nitrification) and harmful chlorination side products must also be considered. In addition, NO3 can be reduced to NO2 in the stomach, which causes methemoglobinemia in infants. Finally, NO3 is a precursor of a variety of carcinogenic and teratogenic N-nitroso compounds [8].
To overcome these threats to human health, NH4+ contaminated water can be treated using a range of technologies and processes. Such processes include: biological treatment processes (activated sludge and biofilm); air-stripping; membrane processes; and ion exchange [9,10]. When considering the treatment processes listed above, high energy expenditures can be avoided by excluding aeration processes. The use of additional chemicals and high pressures can be bypassed by using natural zeolites as sorbents.
Natural zeolites, particularly clinoptilolite, are promising sorbents for use in the processing of drinking water. Natural zeolites are abundantly available and cheap [11,12,13]; they can be subsequently used as a sustainable, slow-release fertilizer in agriculture [14]; they can be regenerated in a cost-effective manner through a simple brine treatment [15,16,17]; they have a broad range of applications; and most importantly, they demonstrate outstanding NH4+ removal efficiencies [18].
Natural zeolites consist of three-dimensional AlO4- and SiO4-tetrahedrons covalently connected through oxygen atoms, which feature a negative surface charge. This surface charge can be selectively compensated by NH4+, which exchanges with Na+, K+, Ca2+, and Mg2+ ions [19].
Previous studies have thoroughly investigated the use of natural zeolites with respect to the removal of heavy metals [20,21,22], organic contaminants [23], and high NH4+ loads during wastewater treatment [23]. It has been reported that K+ is the main competitor to NH4+ due to their similar hydrated ionic radii and charge densities [24].
Recently, we investigated granular natural zeolites in fixed-bed columns for the removal of NH4+ from drinking water sources [18,25]. Here, we investigate the NH4+ breakthrough curves of finer zeolite particles in order to reduce the dimensions and run time of the zeolite columns.
Modeling of the NH4+ breakthrough curves promises to further reduce time-consuming laboratory investigations. To date, different models have been used to calculate breakthrough curves. These models include: the LDF model, the Thomas model, the Yoon–Nelson model and the dose response model. With the exception of the LDF model, all of these models were previously applied to the modeling of NH4+ breakthrough curves in zeolite-filled, fixed-bed columns. These previous studies investigated the influence of model water and wastewater matrices and, in doing so, enabled the extrapolation of zeolite sorption performance for a variety of NH4+ removal scenarios [26,27]. The weakness of these models is that the description of the sorption mechanisms is reduced to simplified mathematical relationships. The LDF model also makes simplified assumptions, but it also includes a detailed evaluation of equilibrium and kinetic behavior. To the best of our knowledge, applying the LDF model for the modeling of NH4+ breakthrough curves in zeolite-filled, fixed-bed columns has not previously been reported in the literature. To date, the LDF model is best known for modeling the sorption performance of activated carbon [28].
The main objective of this study was to investigate the influence of single- and multi-sorbate systems and of natural water matrices on the NH4+ breakthrough curves in natural zeolite-filled, fixed-bed columns. In a departure from previous studies, the LDF and Thomas models were used to model the breakthrough curves for NH4+ and to investigate the influence of its main competitor—K+. To achieve this, batch experiments and kinetic studies were conducted to determine the parameters necessary to model breakthrough curves. Furthermore, the influence of various water matrices (single- and multi-sorbate systems in ultrapure water, tap-, surface-, river- and groundwater) on the breakthrough curve of NH4+ was investigated. Here, we demonstrate a promising tool with which to predict the NH4+ breakthrough curves and to improve drinking water quality, using cost-effective techniques. Improving the quality of drinking water is increasingly relevant, especially in threshold and developing countries.

2. Results and Discussion

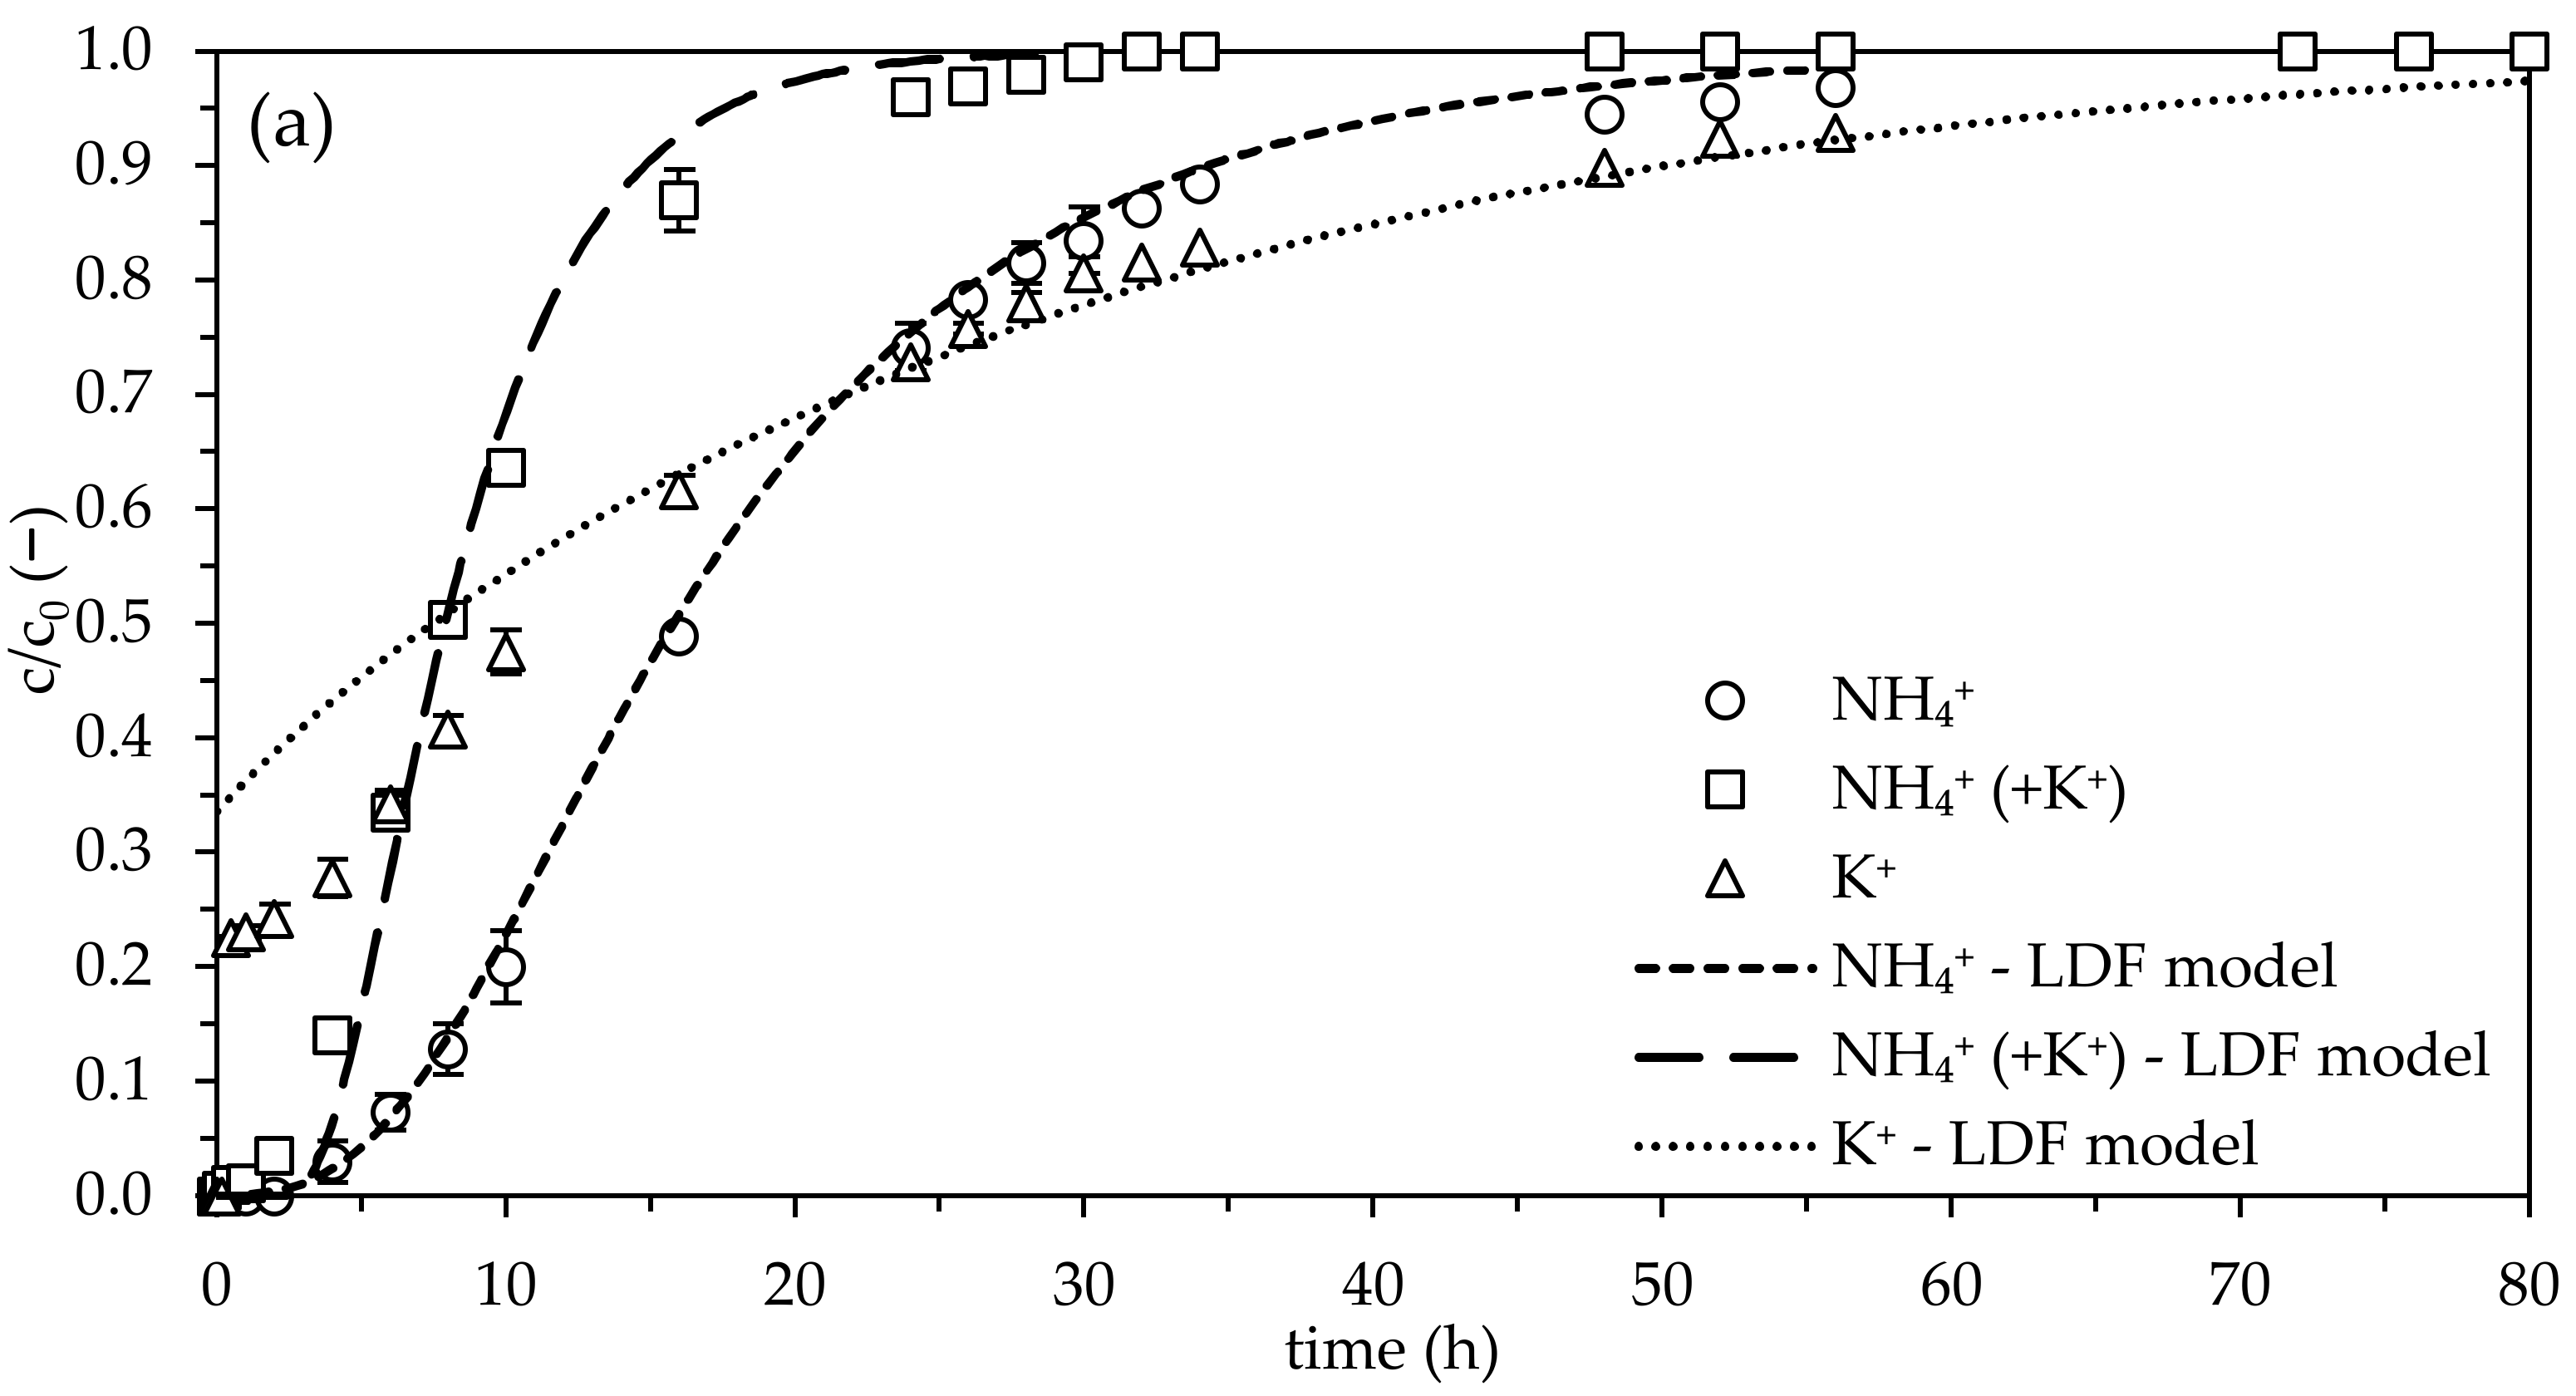
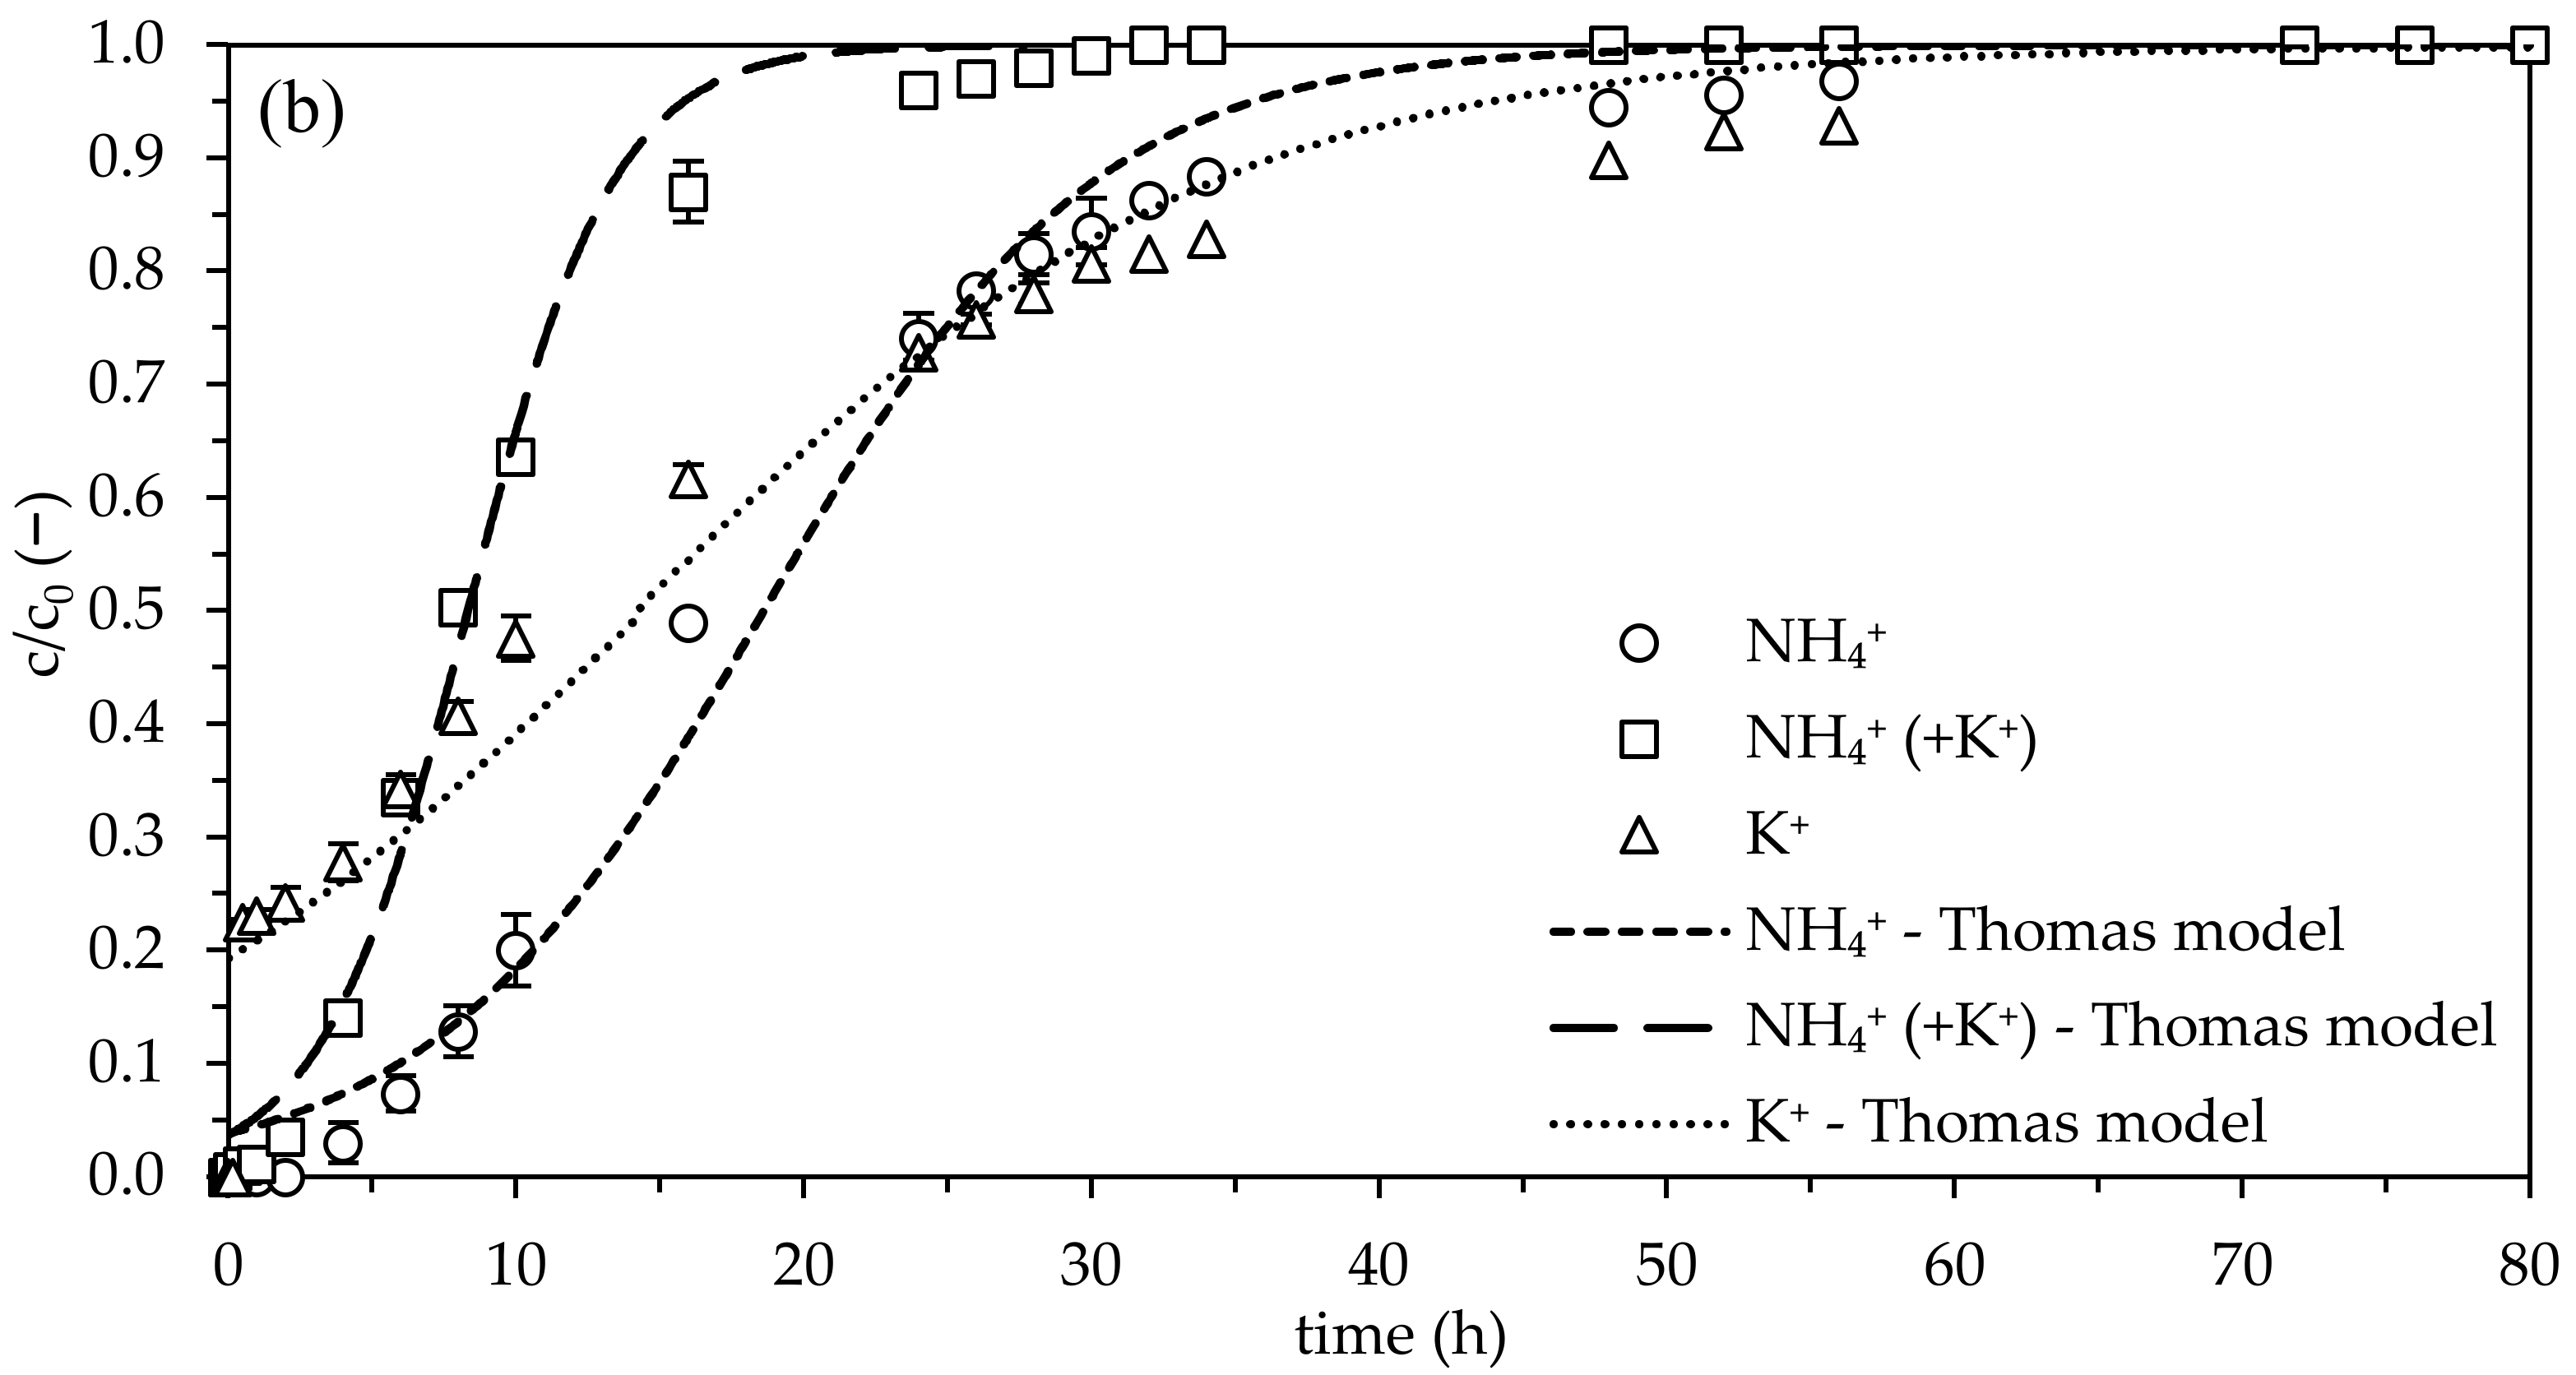
2.1. Modeling and Experimental Validation

Initially, the parameters of the Freundlich sorption model and for intraparticle diffusion were determined (see Table 1). The experimental isotherm and kinetic data can be found in Figures S1 and S2.
By comparing the correlation coefficients (R2, Table 1) for each water matrix, it can be seen that NH4+ sorption is well described by the Freundlich sorption model. Several studies propose the Langmuir sorption model for a better correlation [15,29,30,31], while others describe the Freundlich sorption model as more convenient [14,23,32,33]. As Lin et al. and Chen et al. described, it is most likely that ion exchange is the predominant sorption mechanism at NH4+ concentrations below 1000 mgN/L for clinoptilolite-like zeolites [29,34]. In a previous study, we added support to this assumption by balancing the initial and end point ion equivalents for the same NH4+ concentration (0.7 mmol/L) used in this study [18]. The Langmuir sorption model was not investigated here because the LDF model is based on Freundlich parameters.
It is notable that the Freundlich parameters, KF and nF, differ greatly between the isotherms investigated. Comparatively low KF values indicate a weak sorption of the sorbate to the sorbent, which is the case for K+ (sorbent loading is low at low concentrations). Jaskūnas et al. determined similar values for KF (1.73 × 10⁻⁵  L 0 . 23 * mg 0 . 77 /g) and nF (4.28) by investigating the sorption of K+ to a natural zeolite (clinoptilolite) [35]. The low ability of K+ to exchange charge balancing cations in the natural zeolite’s framework can be related to the following characteristics: (1) after Ca2+, K+ represents the second highest concentration (Table 2); and (2) K+ is able to exchange Ca2+, Mg2+ and Na+, but due to its comparatively large hydrated radii, Ca2+ (highest concentration in the zeolite’s framework) and Mg2+ cannot be easily exchanged. In contrast, NH4+ is able to exchange all of the charge-balancing cations (Ca2+, Mg2+, Na+, K+) in the zeolite’s framework, which also results in higher KF values.
Comparing the NH4+ isotherm without the influence of competing K+ ions (NH4+: KF = 1.02 L 1 . 02 * mg 0 . 07 /g) with the isotherm where K+ is present (NH4+, (+K+): KF = 1.21 L 1 . 21 * mg 0 . 37 /g) suggests that the presence of K+ strengthens the sorption of NH4+. The nF values (nF(NH4+) = 0.93 > nF(NH4+, (+K+)) = 0.63) imply that a faster breakthrough of NH4+ occurs in the presence of competing K+ ions—see Figure 1a,b.
The isotherm for NH4+ in the absence of K+ displayed almost linear behavior and was reflected in the very similar values for KF and nF. These results support the findings of our previous study, using the same zeolite type (8–16 mm grain size) and over a range of concentrations we deemed relevant to drinking water (c0(NH4+) = 1–110 mgN/L), a linear isotherm shape was observed [18].
In the next step, intraparticle diffusion kinetics were investigated in a differential circuit batch reactor. The impact of film diffusion was negated by operating at a filter velocity of 29 m/h. Without the influence of the competing K+, the fastest intraparticle diffusion rate was determined for NH4+ (ksav = 1.1 × 10⁻⁴ 1/s). As the intraparticle diffusion is dependent on the molecular weight of the sorbate and the temperature, it is not surprising that the diffusion of K+ is comparatively slower (ksav = 3.6 × 10⁻⁵ 1/s). This can be attributed to the (>2 x) greater molecular weight of K+ (39 g/mol) compared to NH4+ (18 g/mol). The molecular weight of K+ results in a hindered K+ transport—as a result of confinement and interaction of K+ with the pore. The use of a constant temperature in each experiment meant that this parameter did not influence intraparticle diffusion. The slowest intraparticle diffusion (ksav = 9.8 × 10⁻⁵ 1/s) was determined for NH4+ in the presence of K+. It is assumed that K+ not only competes for the same sorption sites, but also interacts with and reduces the rate of intraparticle diffusion for NH4+. Furthermore, a dependence on sorbate concentration or sorbent loading may occur as the result of a combined mechanism or as the result of a dependence of loading on the surface diffusion coefficient (DS) [28].
It is also not surprising that the mass transfer coefficients kFav for the film diffusion are much faster than those of the intraparticle diffusion (ksav). The difference in kFav between NH4+ and K+ is related to their diffusion coefficients in the aqueous phase (DL). As the molecular weight of K+ is higher than that of NH4+, DL is comparatively lower for K+, and this results in a reduced rate of film diffusion.
After determining all necessary parameters, the experimental data were compared to the LDF and Thomas models. All of the parameters displayed in Table 1 were implemented in the program LDF 2.6© to obtain the modeled breakthrough curves for NH4+ and K+. The nonlinear Thomas model curve fitting was performed using the program OriginPro 2023© (see also Table S1). Figure 1a,b show comparisons of the experimental data with curves predicted by the LDF and Thomas models, respectively.
After 80 h, each breakthrough curve showed a complete saturation of the zeolites used. The breakthrough curve for NH4+ was represented by a typical S-shape both with and without the influence of K+. In contrast, K+ achieved a breakthrough level of 23% after only 30 min. The offset of approximately 23% and the much faster breakthrough of K+ can be related to its weak sorption onto zeolites (KF = 8.39 × 10⁻³  L 2 . 19 * mg - 1 . 19 /g), high abundance in the zeolite’s framework, partial washout from the zeolite used, and its unfavorable sorption onto the natural zeolites used (nF > 1). In general, K+ concentrations up to 0.7 mmol/L (equivalent to 27 mg/L) are quite unusual in drinking water applications—typically K+ concentrations are found to be between 0.02 mmol/L and 0.1 mmol/L [18]. A relatively high K+ concentration was chosen to simulate a worst case scenario and to investigate the influence of K+ and NH4+ at the same concentrations (i.e., in a 1:1 ratio). It was assumed that the NH4+ breakthrough curve obtained in the presence of concentrations of K+ that were relevant to drinking water would be very similar to the NH4+ breakthrough curve obtained in the absence of K+.
A steady saturation of the zeolite-filled, fixed-bed column was observed in all cases, particularly pronounced for NH4+ in the absence of K+. The relatively delayed breakthrough in all cases indicate that intraparticle diffusion is the diffusion limited step. This outcome is also in accordance with the findings of Damodara Kannan and Parameswaran, who investigated the NH4+ uptake by clinoptilolite from swine wastewater permeate [26].
Even though the intraparticle diffusion rate was 1.12 times higher for NH4+ (without K+), and the sorption was more favorable for NH4+ in the presence of K+ (nF = 0.63), the breakthrough of NH4+ in the absence of K+ was reduced. This is strong evidence for the competing effect of K+ on the sorption of NH4+ onto zeolites. Because NH4+ and K+ compete for many of the same sorption sites, a much faster NH4+ breakthrough occurred in the presence of K+.
With regards to the breakthrough curves for NH4+, both the LDF and Thomas models were successfully validated—the modeled breakthrough curves of NH4+ were in close agreement with the experimentally obtained breakthrough curves. For K+, the modeling was not as accurate. The LDF model did not adequately describe the breakthrough curve for K+ during the first 16 h, whereas the Thomas model was inadequate to describe behavior after 24 h. Furthermore, it was not possible to maintain a typical S-shape breakthrough curve for K+ using the LDF model. The nonlinear Thomas model fitting provided a much better S-shape breakthrough curve for K+. To obtain a better fitting of the Thomas model, mainly in the first 6 h, the empty bed contact time (EBCT) should be increased in future studies—2–5 min EBCT are recommended for drinking water treatment applications [28].
To the best of our knowledge, this study is the first report of the LDF model being applied to NH4+ breakthrough in the presence of K+ in zeolite-filled, fixed-bed columns. The LDF model described the experimental isothermal and kinetic data sufficiently well. Furthermore, the experimental data were successfully fitted using the nonlinear Thomas model.
From a practical point of view, time-consuming and extensive field investigations could be reduced by switching to time-saving laboratory experiments. In turn, these laboratory experiments, which are still time-consuming, can be made easier still—by using simple breakthrough investigations through application of the Thomas model. Thus, accurate predictions of the dimensions of decentralized zeolite filters and their breakthrough characteristics are highly promising areas.

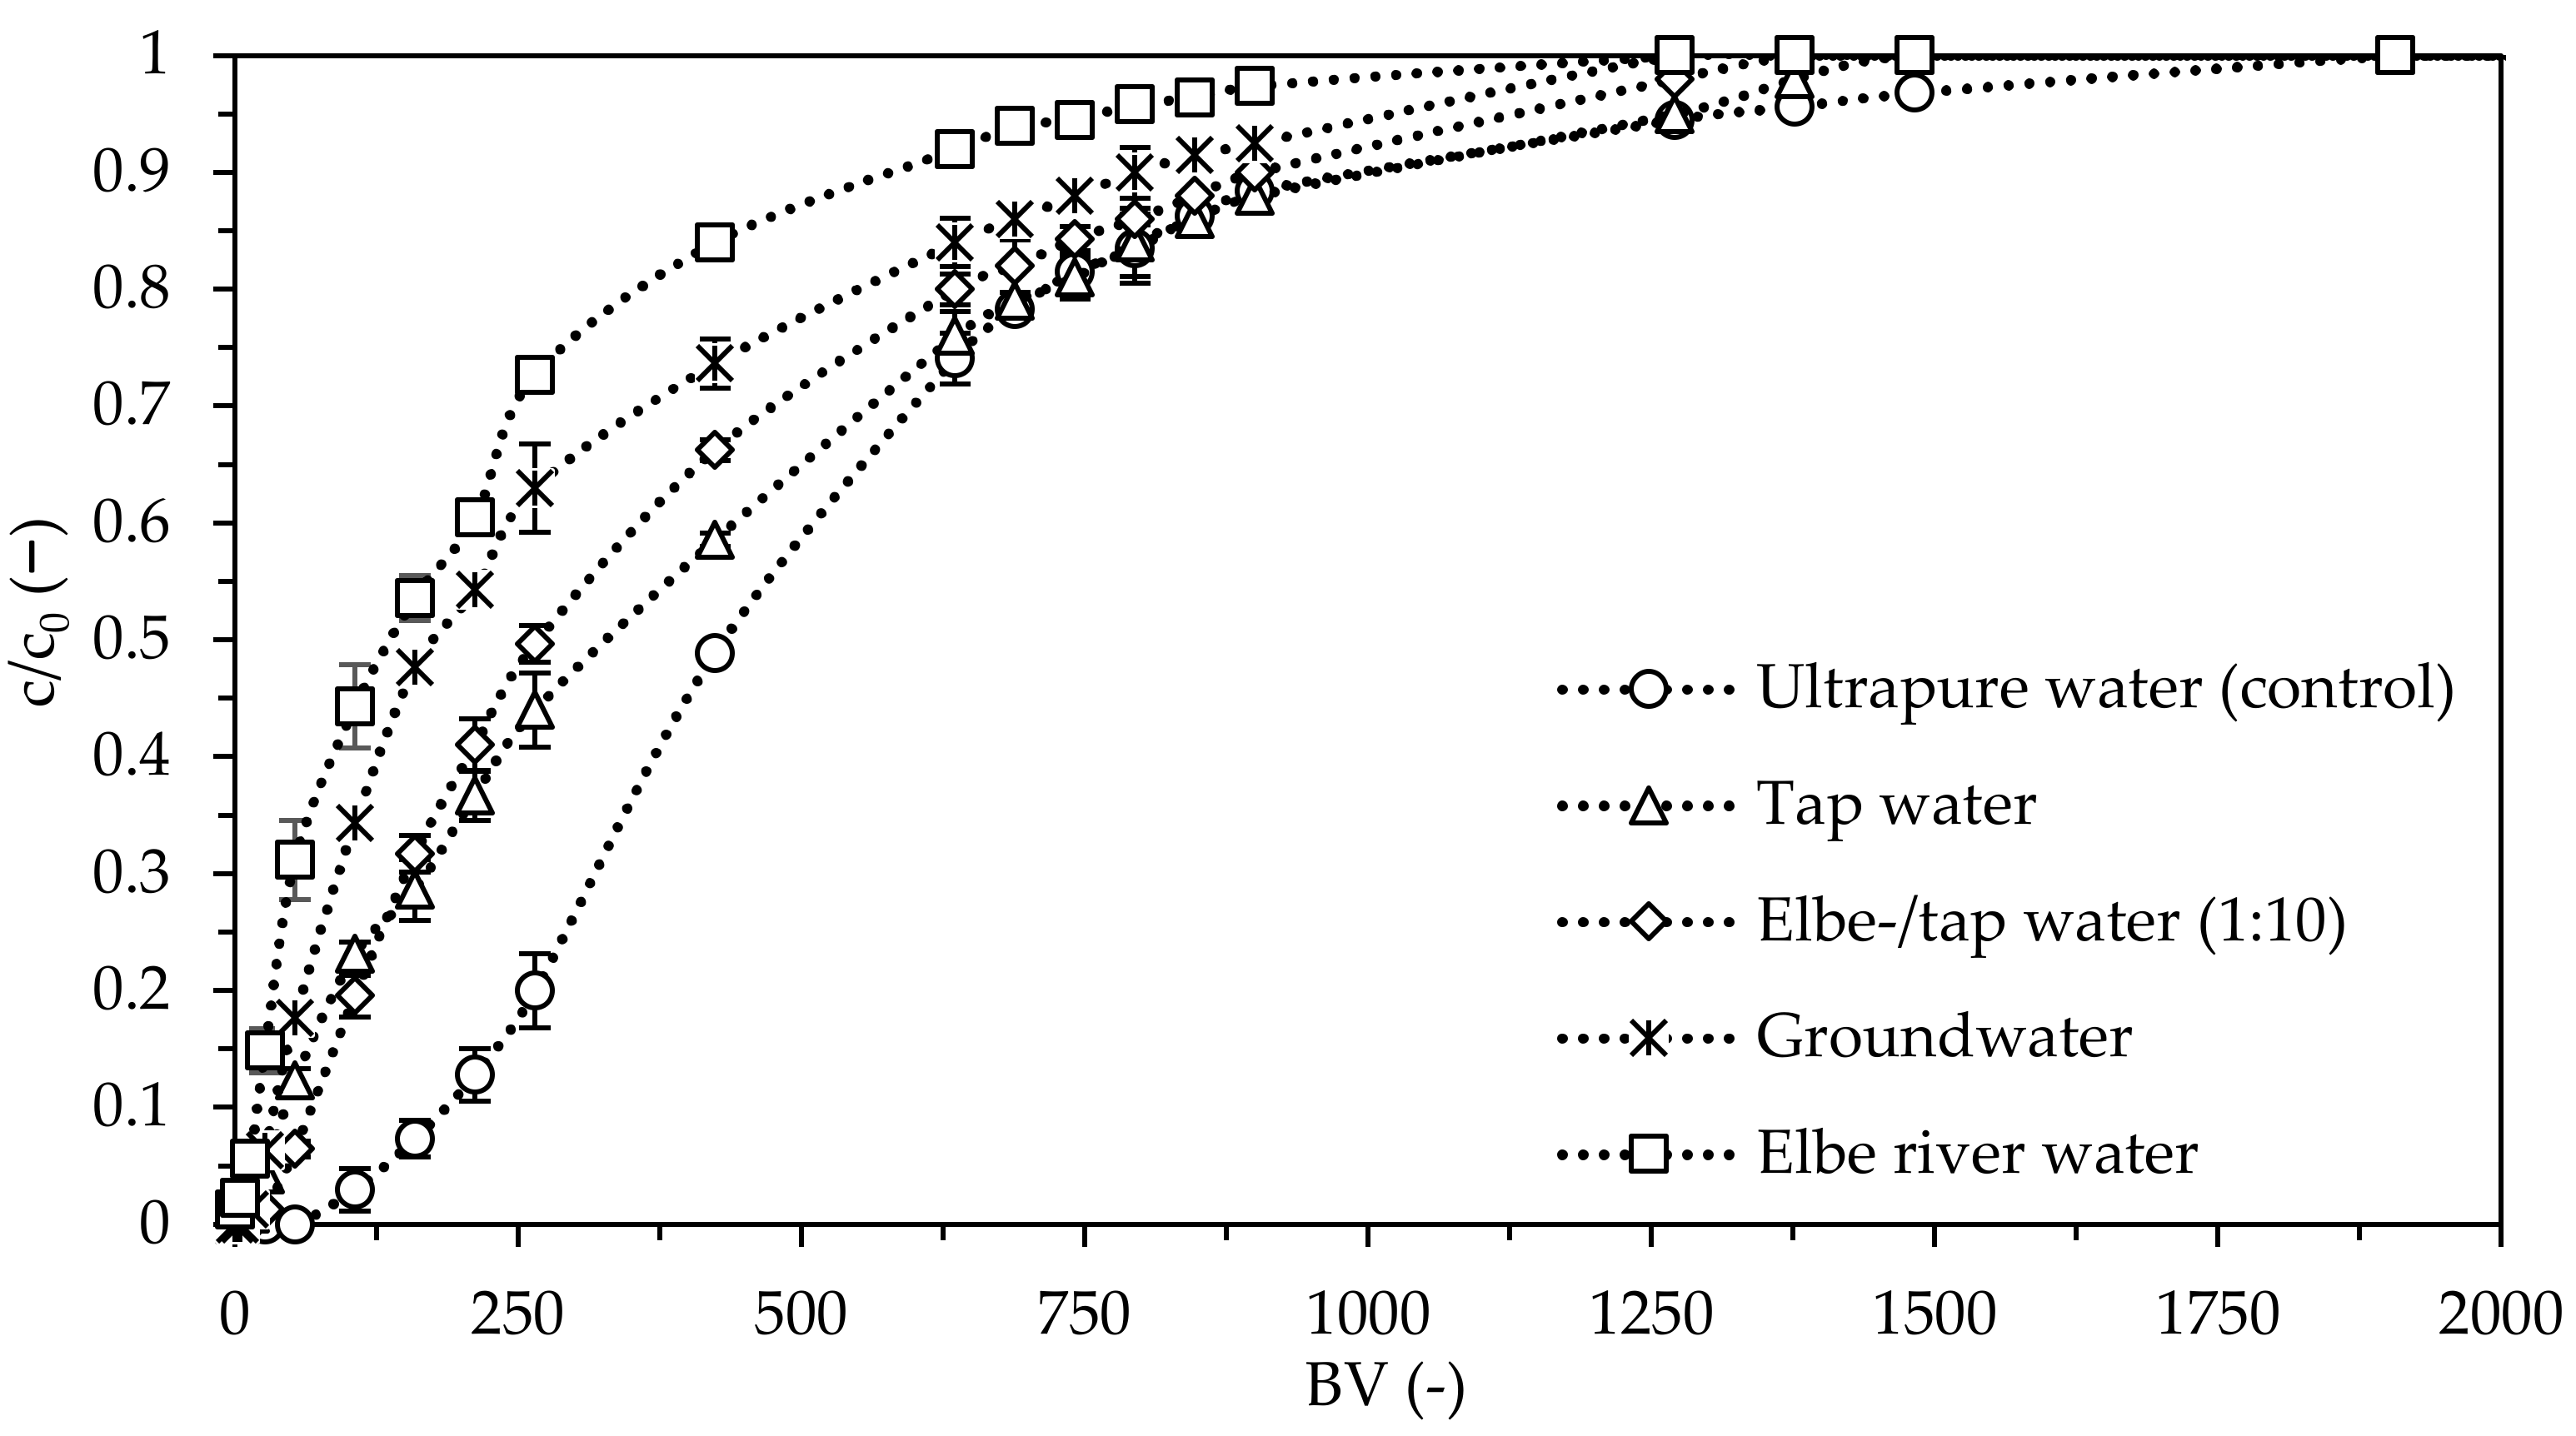
2.2. Ammonium Breakthrough in Natural Water Matrices

In addition to modeling NH4+ breakthrough in zeolite-filled, fixed-bed columns in single- and multi-sorbate systems, the influence of natural water matrices on NH4+ breakthrough characteristics is also of great interest. Therefore, the effects of different alkali metals, earth alkali metals and dissolved organic carbon (DOC) were investigated, at concentrations typically found in natural water matrices, in order to evaluate their influence on NH4+ breakthrough. Here, tap water, a 1:10 mixture of Elbe river water and tap water, Elbe river water, groundwater, and ultrapure water as a control were used as matrices.Table 3 and Table S2 summarize the initial cation and DOC concentrations as well as providing general information on the different matrices investigated.
The cation and DOC concentrations shown in Table 3 represent typical matrix-dependent concentrations. In a previous study, the sorption of NH4+ onto the same natural zeolite was most affected by the presence of K+, followed by Na+, Mg2+, and Ca2+ [18]. This is generally in agreement with other reported studies (although these can differ with respect to Mg2+ and Ca2+ [36,37]). Furthermore, zeolites can be used to remove DOC in a targeted manner [33] and in more complex applications [38]. It is suspected that macromolecular humic compounds function to block zeolite pores, or function as an additional molecular sieve (providing diffusion resistance) for NH4+, resulting in minor equilibrium loadings in batch investigations [18,28]. This is why the parameters that influence NH4+ sorption onto natural zeolites, mainly K+ and DOC concentrations, are of particular interest. The elevated cation concentrations found in groundwater and the higher DOC concentration found in the Elbe river water (see Table 3) can influence the breakthrough of NH4+. The effects of different, natural water matrices on NH4+ breakthrough curves are shown in Figure 2.
Compared to the control with ultrapure water, an accelerated NH4+ breakthrough was observed for all natural water matrices. Tap water and Elbe-/tap water exhibit a very similar breakthrough behavior. As the treated bed volume (BV) increases further, the Elbe-/tap water mixture exhibits a higher rate of breakthrough than tap water. The breakthrough of groundwater and Elbe river water is almost the same over the range of treated BV. To achieve a breakthrough level of 50%, the following matrix-dependent BVs were treated: 435 BV for ultrapure water, 325 BV for tap water, 268 BV for the Elbe-/tap water mixture, 176 BV for groundwater, and 135 BV for Elbe river water. Compared to the control, it is remarkable that the BV that was treated before a breakthrough of 50% was achieved decreased by 25% for tap water, by 38% for the Elbe-/tap water mixture, by 59% for groundwater and by 69% for Elbe river water. The typical S-shapes, observed for the breakthrough curves in single- and multi-sorbate systems (Section 2.1), could barely be seen for natural water matrices and supported the idea of a faster NH4+ breakthrough. An increase in the EBCT, from 2.16 min up to 5 min, should be employed in future studies and especially in field applications.
It is most likely that the concentrations of K+ and DOC were the determining factors in the shift of the breakthrough curves to the left (breakthrough occurring at earlier time points and lower treated BVs in the presence of these materials). The competing effect of K+ on NH4+ breakthrough can be interpreted by considering the physical characteristics of both ions as well as the dimensions of the framework of natural zeolites—shown in Table 4 and Table 5.
Zeolites are three-dimensional solids with well-defined structures. Natural zeolites are built around three ring types, each with different channel dimensions. Different ring types provide different sorption sites for hydrated cations. Ca2+ and Mg2+ possess relatively large hydrated radii compared to the other cations investigated. Due to the larger hydrated radii, as well as the molecular sieving effects that occur within natural zeolites, Ca2+ and Mg2+ cannot diffuse to all possible sorption sites (only to the center of horizontal ten-membered rings and horizontal eight-membered rings). Furthermore, it is thought that electrostatic repulsion of Ca2+ and Mg2+ can occur due to their relatively high charge densities. Similarly to Ca2+ and Mg2+, Na+ can only occupy certain sorption sites [40]. In contrast, NH4+ and K+, with identical hydrated radii and charge densities, can diffuse into and be exchanged within all ring types of natural zeolites [40]. Therefore, K+ is the main competitor to NH4+ and the most important cation to consider when discussing NH4+ breakthrough in zeolite-filled, fixed-bed columns.
The influence of different anions, those that typically occur in natural water matrices, can be excluded. Even at high anion concentrations, far outside what is usually found in drinking water (3.5 mmol/L for NO2, NO3, HPO42−/H2PO4 and SO42−), no significant effect on the loading of NH4+ onto the same natural zeolite was observed in batch experiments [18].
The point of zero charge (pHPZC) of the same natural zeolite was observed to be in the range between pHPZC 6.24 and 6.47 [18], indicating that the surface is mostly positively charged at pH < pHPZC. Since the pH values used in our natural water matrices were higher than the pHPZC, it can be assumed that the zeolites’ surfaces are mostly negatively charged. Thus, the surface will repel the negative zeta potential of humic compounds in the DOC at pHs > 1.6. Nevertheless, it is suspected that the comparatively high DOC concentration in the Elbe river water (due to macromolecular humic compounds) functioned to block pores, or as an additional molecular sieve for NH4+, resulting in faster NH4+ breakthrough [18,28].

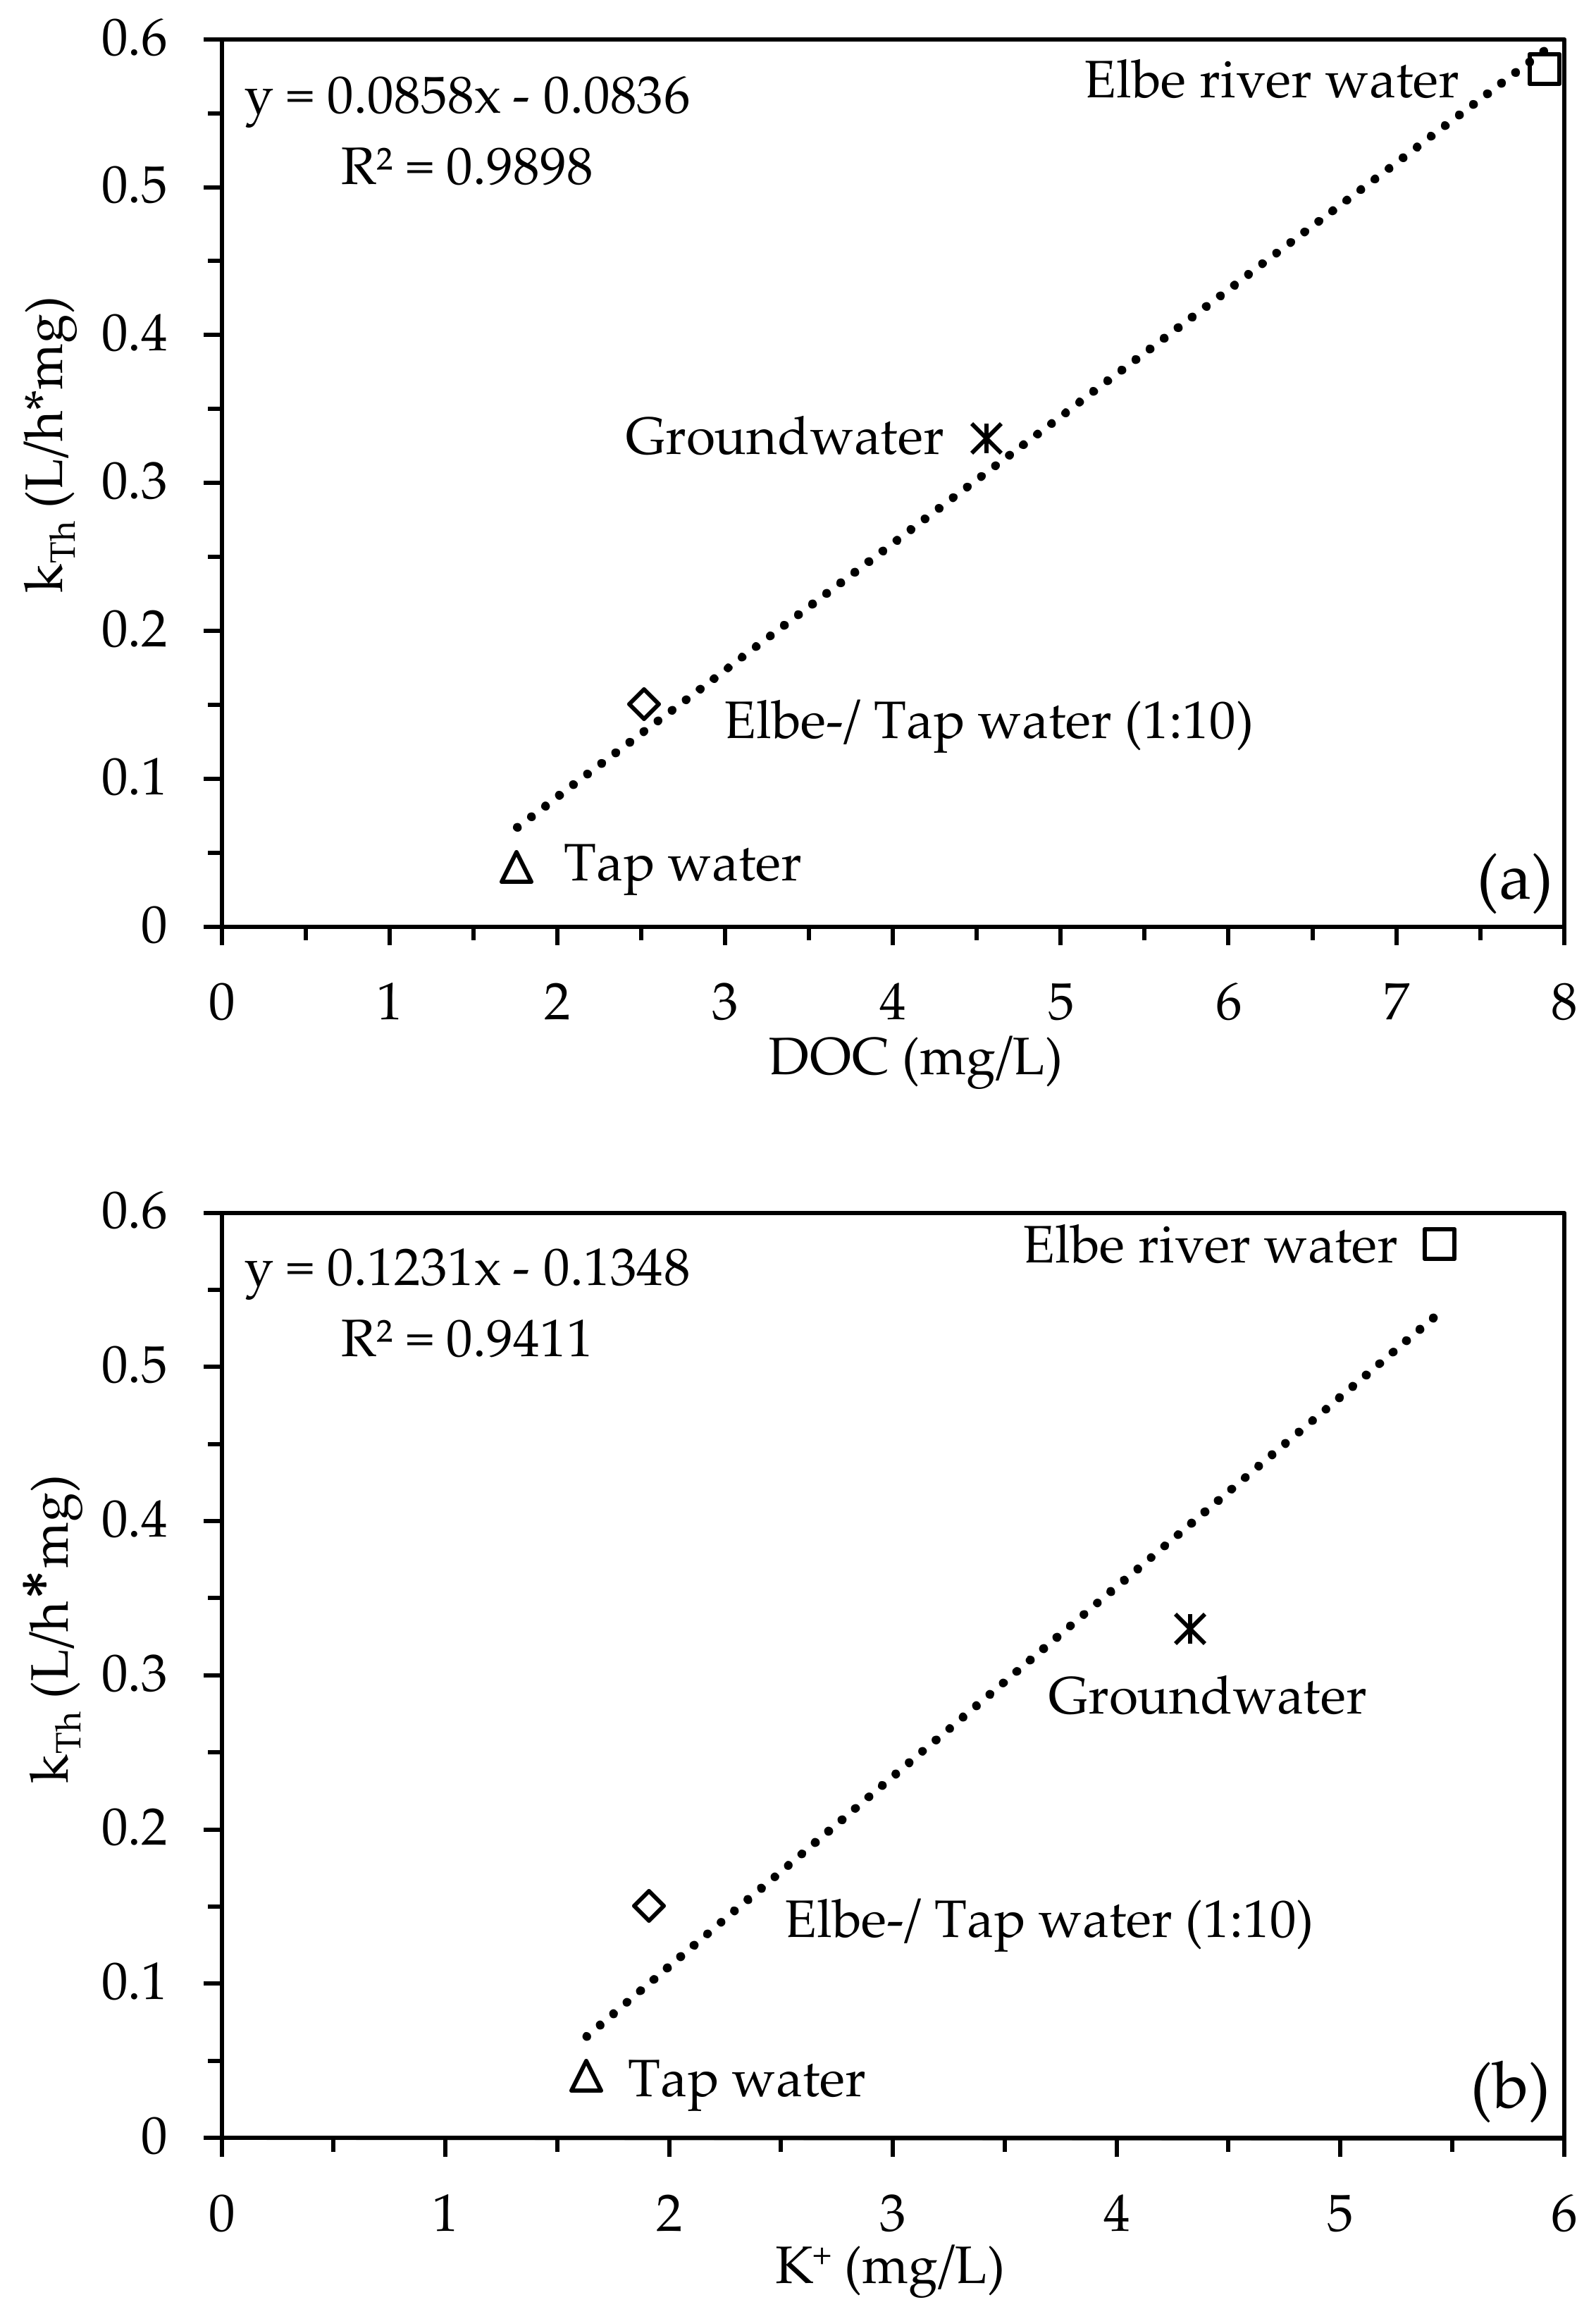
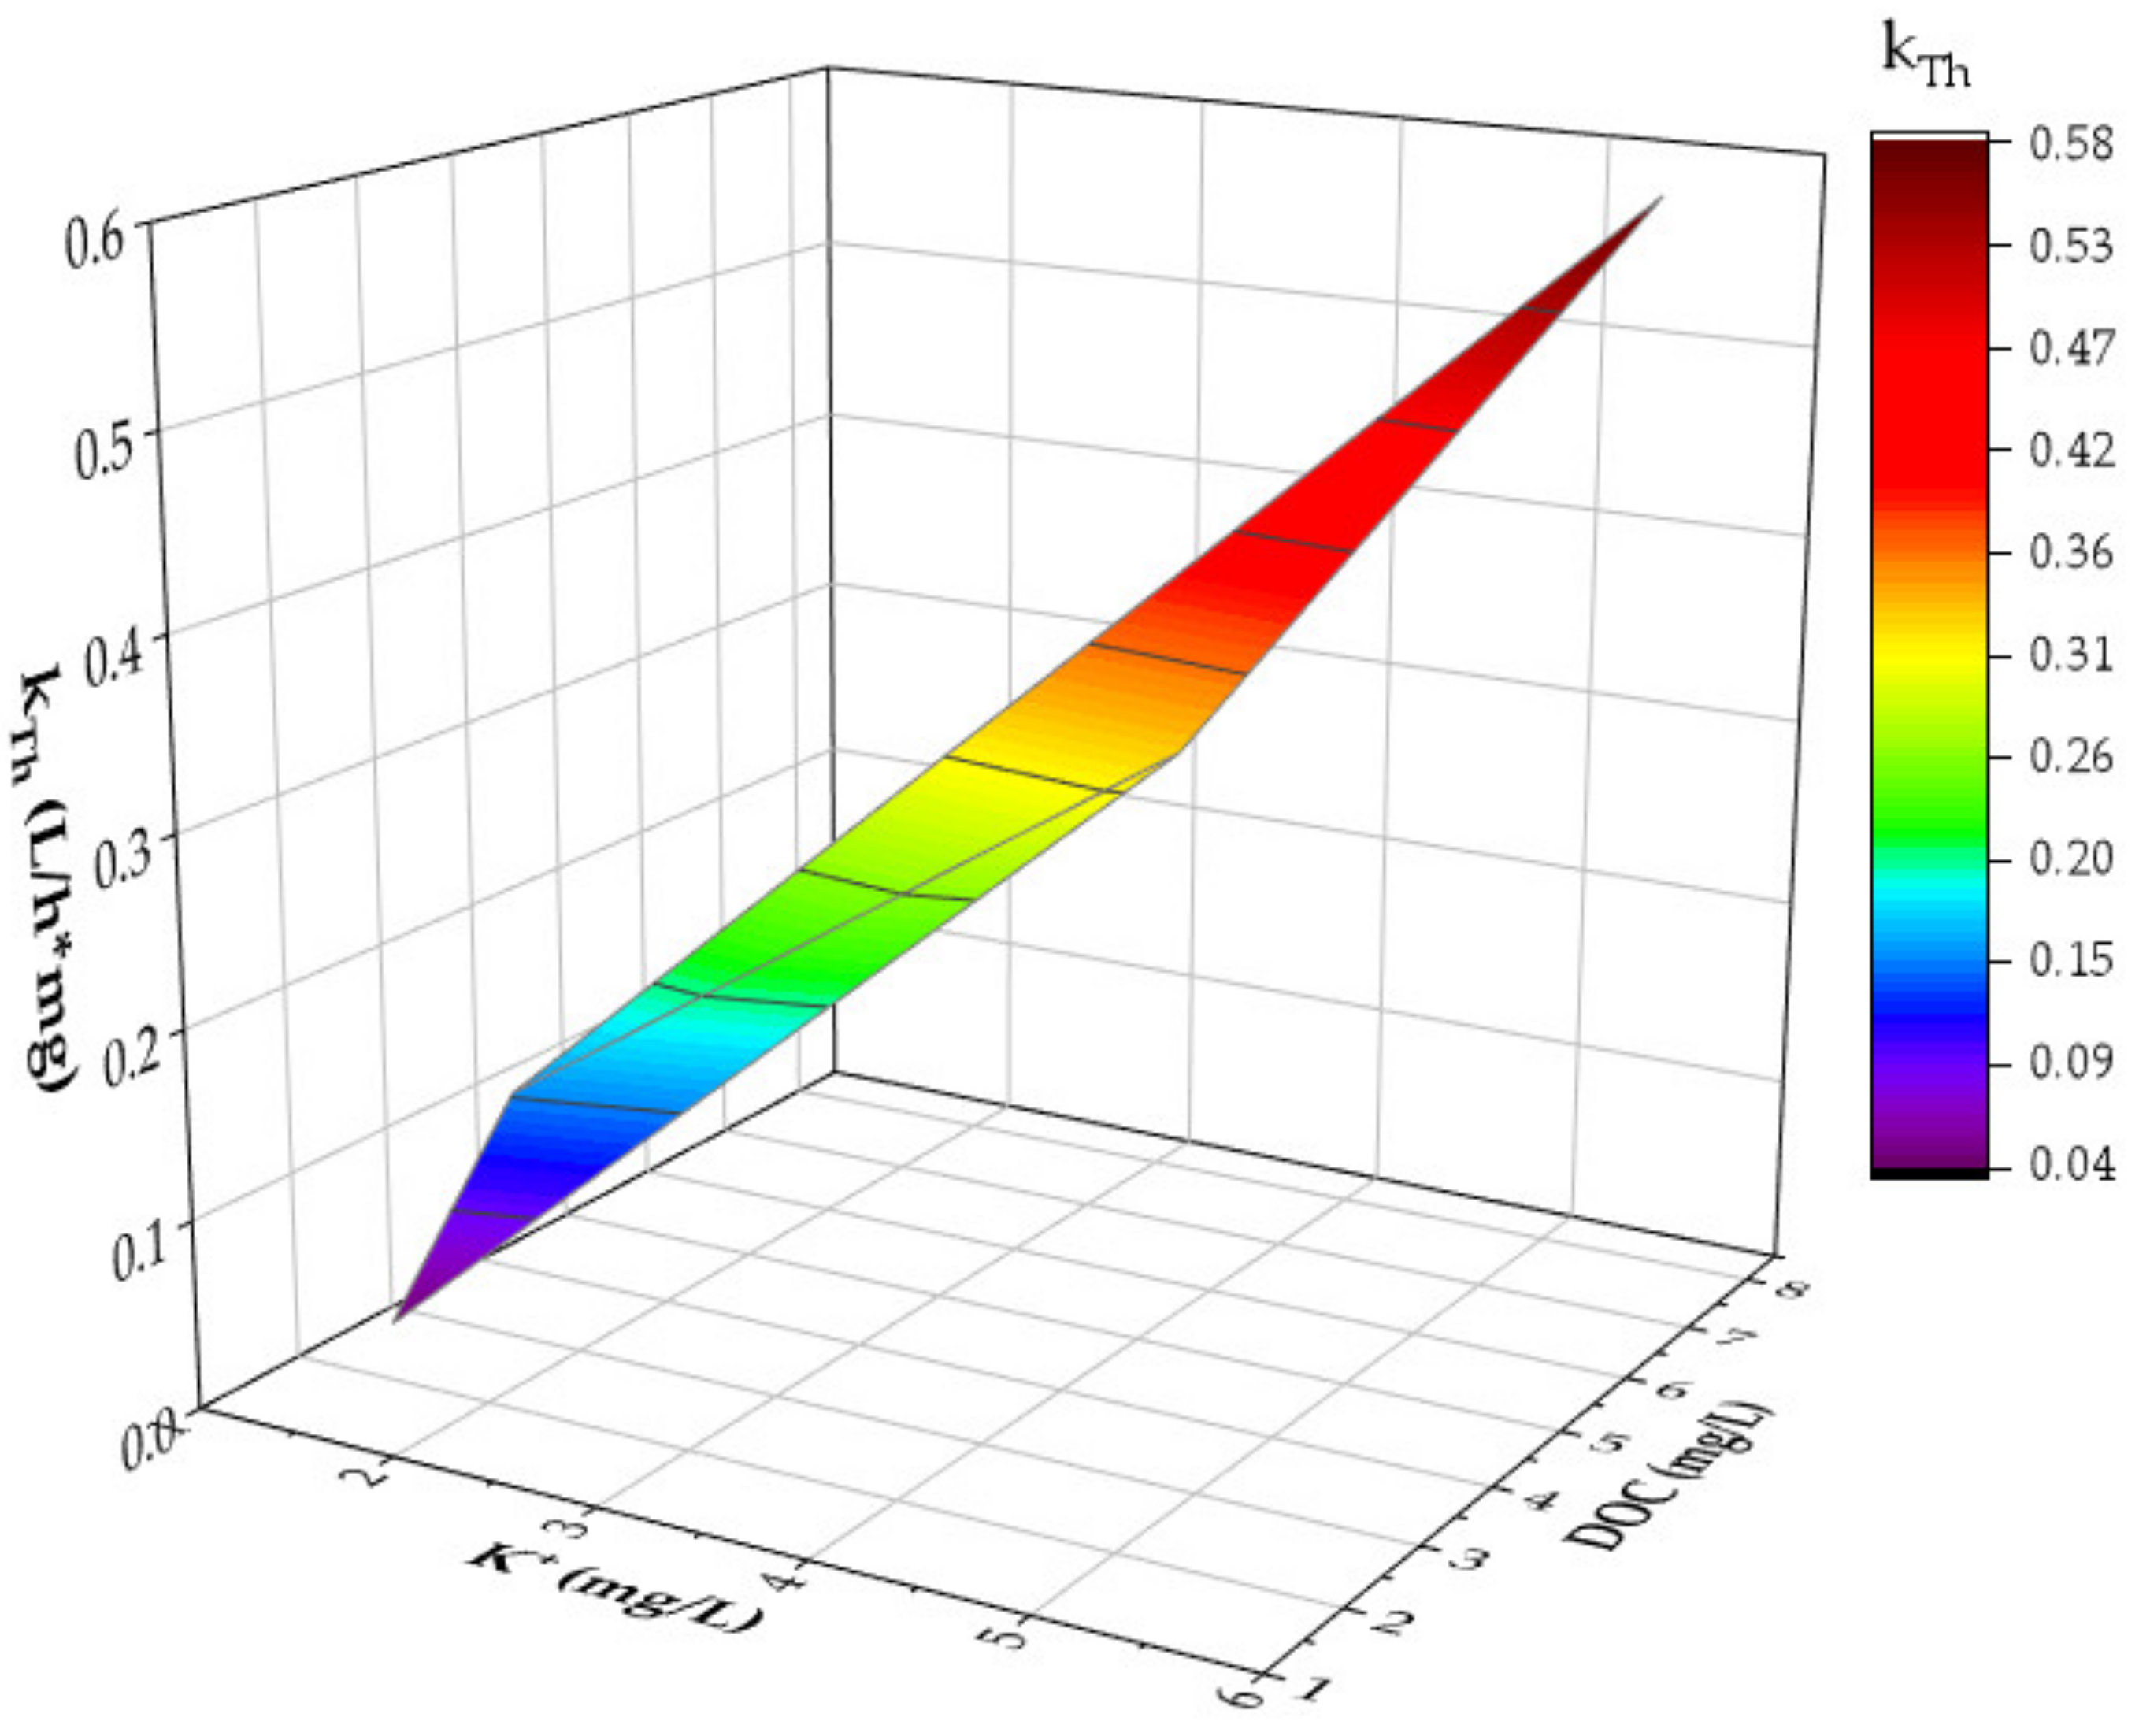
Influence of Potassium and the DOC on the Ammonium Breakthrough Curve

DOC and K+ concentrations in natural water matrices are thought to increase the rate of NH4+ breakthrough in zeolite-filled, fixed-bed columns. Figure 3a,b shows how DOC and K+ influence the Thomas model rate constant kTh, respectively. All Thomas model constant determined and modeled NH4+ breakthrough curves can be found in Table S1 and Figure S3.
The dependency of kTh on the DOC (R2 = 0.98) and K+ (R2 = 0.94) concentration in natural water matrices is well described by a linear fit. According to Figure 3, a higher DOC and K+ concentration results in a higher kTh and an accelerated breakthrough of NH4+. So, in addition to K+ (see Section 2.2), the DOC concentration also has a strong influence on the breakthrough of NH4+ in zeolite-filled, fixed-bed columns.
In order to assess whether K+ or the DOC has a stronger influence on kTh, a two-factor variance analysis was carried out by using the program OriginPro 2023© in Figure 4.
Figure 4 shows that the DOC has a stronger influence on kTh than potassium, especially at concentrations > 6 mg/L. There was a significant dependency between kTh and the DOC concentration, which is an important finding for field applications.
To further confirm the dependency between kTh and K+ and the DOC, more natural water matrices should be investigated.
Nevertheless, due to the complex composition of DOC, it is challenging to describe a precise mechanism for the influence of DOC on kTh and the breakthrough of NH4+ in zeolite-filled, fixed-bed columns. DOC consists of about 50% humic compounds, with relatively large molecular structures (humic and fulvic acids). The remainder is made up of low-molecular acidic and neutral substances and other compounds [28]. Because of the variety of molecular structures and weights, no individual species can be identified and analytically determined.
In summary, breakthrough curves of NH4+ in zeolite-filled, fixed-bed columns can be better predicted, and location-dependent estimations of kTh can be made by: (1) measuring K+ and DOC concentrations; (2) applying the linear equations of Figure 3; and (3) applying a two-factor variance analysis.

3. Materials and Methods

3.1. Zeolite Characteristics

CLP85+, the natural zeolite (clinoptilolite) under investigation, was supplied by Zeolith Umwelttechnik Berlin GmbH, Berlin, Germany. In Table 2, the chemical composition and general characteristics of the zeolite are shown. In order to remove particulate matter, salts, and excess adsorbed cations, the zeolites were washed with ultrapure water until the electrical conductivity was less than 10 µS/cm (and the water appeared clear by visual inspection). The zeolites were subsequently dried at 80 °C for 24 h before beginning the experiment.

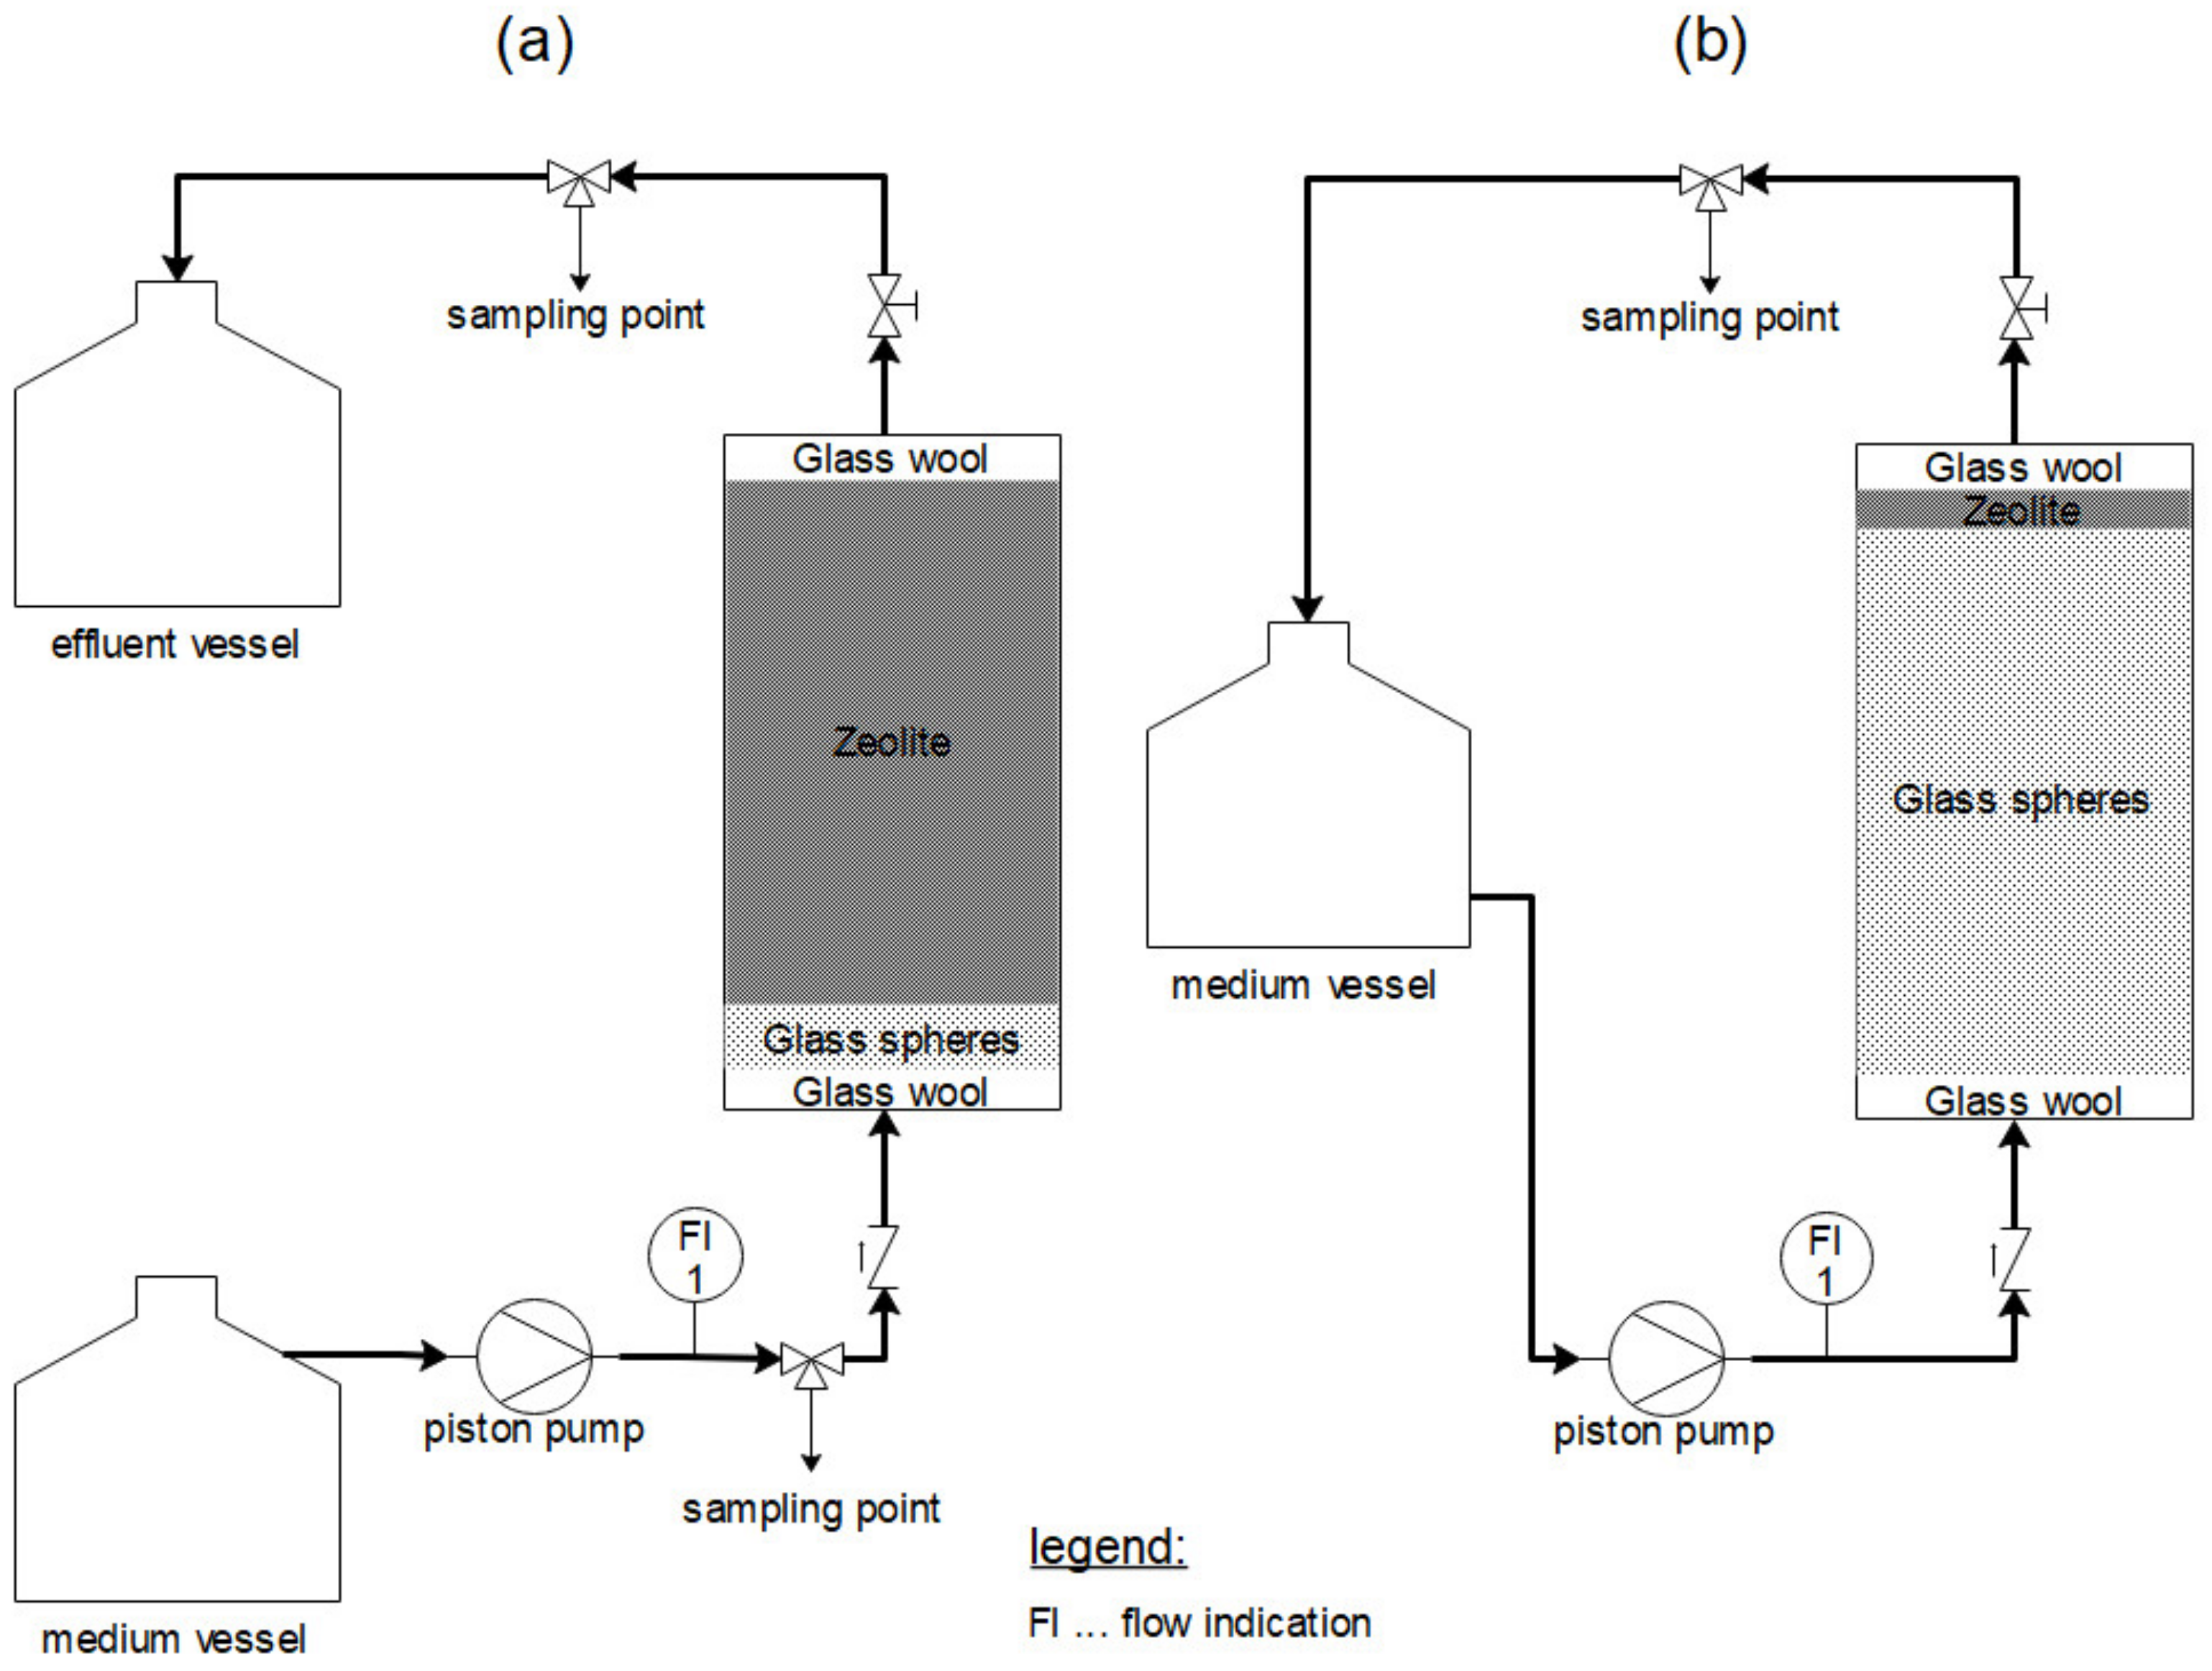
3.2. Column and Batch Set-Up

The experimental determination of breakthrough curves was carried out in continuous flow mode through fixed-bed columns (inner diameter di: 0.9 cm; bed height HB: 6.2 cm; zeolite mass mZ: 3.6 g—Figure 5a). Before each experiment, the zeolites were contained, using a plastic mesh and glass wool, in the adsorber compartment. A bed of glass spheres (d: 0.2 mm; HB: 1.3 cm) was placed under the plastic mesh to achieve a uniform incoming flow to the zeolite bed. The feed was pumped (Piston pump: REGLO-CPF Digital; Cole-Parmer GmbH, Wertheim, Germany) in an upwards direction (flow rate V ˙ : 1.84 mL/min; filter velocity vF: 1.75 m/h; empty bed contact time EBCT: 2.16 min). To analyze breakthrough of the sorbate in the effluent, samples were taken from 10 min to 4800 min (3.3 days).
A differential circuit batch reactor (Figure 5b) was used to investigate intraparticle diffusion (di: 1.8 cm; HB: 3 mm; mZ: 0.7 g; vF: 29 m/h; solution volume: 1 L). A comparatively high filter velocity (29 m/h) was used to negate the impact of film diffusion. Glass spheres (d: 0.2 mm; HB: 9.5 cm) were placed under the plastic mesh, and glass wool was used to fix the zeolite bed in place. As for the fixed-bed column, the feed here was also pumped in an upward direction. Zeolite loading was investigated by time-dependent sampling from 30 min to 2880 min (2 days).
Batch experiments were performed using the bottle point method and were carried out in borosilicate flasks (Borosilicate 3.3 glass; VWR International GmbH; Dresden, Germany) with 100 g of zeolites per liter of water [28]. Flasks were stirred at 100 rpm (SM-30 orbital shaker; Edmund Bühler GmbH; Bodelshausen, Germany), and sampling was performed until equilibrium was reached.
The initial NH4+ and K+ concentrations of 0.7 mmol/L were obtained by diluting 0.3 mol/L NH4Cl and 0.7 mol/L KCl (analytical grade) stock solutions, respectively. To avoid microbial contamination, the water matrices used, as well as the column and batch set-ups, were autoclaved prior to experiments. Collected samples were filtered through a 0.45 µm PET filter (CHROMAFIL® Xtra PET-45/25; Macherey-Nagel GmbH and Co. KG; Düren, Germany) before determining the amounts of NH4+, cations and DOC. By using an ultrapure water control, a mostly non-competitive water matrix was provided. All experiments were carried out in duplicate and at room temperature (22 °C). Before an experiment, the pH, electrical conductivity, and water temperature were recorded.

3.3. Breakthrough Curve Modeling

In order to reduce the mathematical effort involved in mass transfer models, the linear driving force (LDF) model was used for breakthrough curve modeling. The LDF model represents a simplified mathematical structure of intraparticle diffusion; it is widely used for the modeling of sorption processes in fixed-bed columns. Instead of Fick’s law, a mass transfer equation with LDF is used. Under the assumptions of negligible dispersion (because of high filter velocities vF) and validity of the Freundlich isotherm, the differential mass balance can be formulated as in Equation (1):
v F c z + ε B c t + ρ B q ¯ t = 0
Equation (1) consists of three terms: (1) describes the advection with the linear vF (m/h), the sorptive concentration c (mg/L), and the way z (m); (2) includes the bed porosity εB (−) and time t (h); and (3) describes the sorption for a given bed density ρB (g/cm3) and the average loading of the sorbent q ¯ (mg/g).
Sorption processes can be described as consisting of four sub processes: (1) advection of the sorbate within the solution near the sorbent particle; (2) film diffusion; (3) surface diffusion; and (4) pore diffusion into the sorbent particle and further sorption of the sorbate. It is generally known that the rate-limiting steps during sorption are the film and intraparticle diffusion processes.
Firstly, the film diffusion, with a linear decrease in concentration (c) to the sorbent surface, is supposedly due to a steady increase in the equilibrium concentration ceq (Equation (2)). Equations (3)–(11) describe the coefficients necessary to calculate the time-dependent q ¯ in Equation (2).
q ¯ t = k F a v ρ B   *   ( c   -   c eq )
a v = 3 r P   *   ( 1     ε B )
ε B = 1     ρ B ρ P
k F = S h   *   D L d P
S h = [ 2 + ( S h L 2 + S h T 2 ) 0.5 ]   *   [ 1 + 1.5   *   ( 1     ε B ) ]
S h L = 0.644   *   R e 0.5   *   S c 0.3
S h T = 0.037   *   R e 0.8   *   S c 1 + 2.443   *   R e 0.1   *   ( S c 2 3   1 )
R e = v F   *   d P ε p   *   ν
R e = ν D L
D L = 3.595   *   10 14   *   T η   *   M 0.53
Under the simplified assumption of spherical particles with a radius rP (m), the specific particle surface av of the fixed bed can be calculated. εB is a function of ρB and the apparent particle density ρP (density of water-filled particles) (g/cm3). The mass transport coefficient kF (m/s) can be calculated by the Sherwood number Sh (−), the diffusion coefficient of the sorbate in water DL (m2/s) [28], and the particle diameter dP (m). There are several correlations to calculate Sh. In this study, the approach by Gnielinski [45] was used because the validity range of the Schmidt number Sc (Sc < 12,000) (−) was given. The Reynolds number Re (−) is calculated by vF, dP, εB, and the kinematic viscosity ν (m2/s). DL is a function of the temperature T (K), the dynamic viscosity η (Pa*s), and the molecular weight of the sorbent (g/mol).
Secondly, the particle diffusion is composed of surface and pore diffusion. Under the assumption of LDF in the direction of the sorbent particle, the mass transport Equation (12) is used. Equations (13) and (14) describe the needed coefficients for the time-dependent loading q of the sorbent.
q ¯ t = k s   *   ( q eq     q ¯ )
k s = k s ( 0 )   *   e ( w   *   q ¯ )
q eq , F = K F   *   c eq 1 / n F
ks′ (1/s) describes the effective volumetric mass transport coefficient of the surface diffusion and is often dependent on q ¯ , and the empirical parameter w (g/mg) describes the strength of the influence of q ¯ on the intra-particle mass transfer. ks′(0) (1/s) is the intrinsic mass transfer coefficient. The equilibrium loading qeq (mg/g) can be calculated by the Freundlich sorption model. KF ( L n F * mg 1 n F /g) characterizes the sorption strength, and nF (−) determines the curve of the sorption isotherm. ks′(0) and w can be experimentally determined with the previously described differential circuit batch reactor. Furthermore, Equation (15) is used to calculate the experimental qeq,exp (mg/g) of the described batch set-ups:
q eq , exp = c 0 c e q m Z   *   V
c0 and ceq are the initial and equilibrium concentrations (mg/L) of the sorbent in a defined volume of water V (L). mZ is the sorbent mass of natural zeolites (g).
The following experimental steps and programs were used for breakthrough modeling:
(a)
Experimental determination of three different isotherms in ultrapure water with 10 pairs of values (ceq and qeq). Isotherm 1 contains a single-sorbate system of NH4+ (c0(NH4+) = 0.06–2.22 mmol/L), isotherm 2 contains a single-sorbate system of K+ (c0(K+) = 0.03–1.02 mmol/L), and isotherm 3 contains a multi-sorbate system of NH4+ and K+ (c0(NH4+) = 0.06–2.22 mmol/L; c0(K+) = 0.7 mmol/L). The Freundlich isotherm parameters KF and nF were calculated with the program ISO 3.2© (Eckhard Worch 2009).
(b)
The pair of values (ceq/c0 and t in h) from the differential circuit batch reactor experiments and its boundary conditions (mZ, V, c0) as well as the Freundlich isotherm parameter were used to calculate the theoretical equilibrium concentration. The empirical kinetic parameters (ksav, w) were adjusted manually to the course of concentration decrease by sorption. Three different kinetic experiments were conducted with the following initial concentrations in ultrapure water: (1) c0(NH4+) = 0.7 mmol/L; (2) c0(K+) = 0.7 mmol/L; and (3) c0(NH4+, K+) = 0.7 mmol/L. The program KIN 3.1© (Eckhard Worch 2009) determined the empirical kinetic parameters.
(c)
Breakthrough curves can be calculated by the program LDF 2.6© (Eckhard Worch 2009). The following boundary parameters were needed for the calculation: c0, KF, nF, kFav, ksav, mZ, vF and ρB. Furthermore, experimental data of breakthrough curves can be loaded into LDF 3.0b and compared with modeled curves. Three different experimental breakthrough curves with the same initial concentrations of step (2) in ultrapure water were recorded.
The experimental breakthrough data and the LDF model were compared to the Thomas model (Equation (16)). The Thomas model is used to describe the ion exchange of zeolites in fixed-bed columns and to estimate the maximum sorbate sorption capacity and sorption rate in the column [46].
c t c 0 = 1 1 + exp k T h   *   q e q   *   m Z V ˙     k T h   *   c 0   *   t
ct (mg/L) is the sorbate concentration in the effluent at time t. The flow time t (h) is calculated as a ratio of effluent volume (L) at time t and flow rate V ˙ (L/h). kTh is the Thomas model rate constant (L/(h∗mg)).
The nonlinear Thomas model fitting was performed using the program OriginPro 2023© and by simplifying Equation (16) to Equation (17) with Equations (18)–(20):
y = 1 1 + exp k T h   *   ( a     b   *   x )
y = c t c 0
a = q eq   *   m Z V ˙
b = c 0

3.4. Investigation of Natural Water Matrices

Alkali metals and alkaline earth metals are ubiquitous cations in natural water matrices. For the investigation of natural water matrices, tap water, Elbe river water, a 1:10 mix of Elbe river and tap water, and groundwater were analyzed. The NH4+ concentrations of the autoclaved water samples were measured prior to each experiment, and equal NH4+ levels were achieved by spiking with a 0.03 mol/L NH4Cl stock solution. To estimate the effect of cations and the DOC content on the breakthrough curves, the levels of both were measured before each experiment.

3.5. Analytical Methods

The standard parameters of pH, electrical conductivity, and temperature were recorded using a multimeter and sensors (Sentix®41 pH electrode, TetraCon®325 conductivity cell, Multi 340i multimeter; Xylem Analytics Germany Sales GmbH and Co. KG; Weilheim, Germany). NH4+ and cations were measured by a chromatography device (930 Compact IC; Methrom AG; Herisau, Switzerland). DOC was determined by an analyzer (TOC-VCPN Analyzer; Shimadzu Corporation, Kyoto, Japan).

4. Conclusions

This study is the first to apply the LDF model to the modeling of NH4+ breakthrough curves in zeolite-filled, fixed-bed columns. Investigating the influence of natural water matrices further strengthened our understanding of NH4+ breakthrough for field applications. The conclusions of our study can be summarized as follows:
  • The sorption of NH4+ onto natural zeolites was more favorable than the sorption of K+. For this reason, natural zeolites are highly promising sorbents with which to remove NH4+ in drinking water applications.
  • Intraparticle diffusion is the rate limiting step during NH4+ breakthrough—as determined by comparison of kFav and ksav values. The presence of K+ decreased the intraparticle diffusion rate of NH4+.
  • The LDF and Thomas models were successfully validated by experimental NH4+ breakthrough data and can reduce time-consuming field investigations. The Thomas model can further reduce the complexity of experimental investigations because only breakthrough data are necessary (this is in contrast to the LDF model that is based on isothermal and kinetic data).
  • Natural water matrices strongly decreased the treated bed volumes during NH4+ breakthrough. In particular, K+ and DOC concentrations have to be considered when applying natural zeolites to the treatment of drinking water.
In summary, the time-consuming and cost-intensive investigations of field experiments can be reduced by using predictions of NH4+ breakthrough when applying the LDF and Thomas models. The Thomas model is a promising tool to reduce planning and investigation costs for decentralized applications, especially in threshold and developing countries.
In future studies, we will further validate the results reported here while also studying the influence of additional parameters (e.g., competing cations, pH, organic compounds, and zeolite regeneration using brine solutions) on the breakthrough of NH4+ in zeolite-filled, fixed-bed columns.
The main findings of this study are that the LDF and Thomas models sufficiently predict the breakthrough of NH4+ in fixed-bed columns and that natural zeolites are highly promising sorbents for the removal of NH4+ in drinking water applications.

Supplementary Materials

The following supporting information can be downloaded at: https://www.mdpi.com/article/10.3390/molecules28041614/s1, Figure S1. Experimental and Freundlich model isotherms (matrix: ultrapure water; teq: 21 d; pH0: 5.5–6.2; (a): c0(NH4+) = 0.06–2.22 mmol/L; (b): c0(K+) = 0.03–1.02 mmol/L; (c) c0(NH4+) = 0.06–2.22 mmol/L, c0(K+) = 0.7 mmol/L; w/v = 100 gZ/L, T = 22 °C; grain size: 0.5–0.8 mm; n = 2); Figure S2. Experimental and modeled kinetic data (matrix: ultrapure water; teq: 48 h; pH0: 5.5–6.2; (c0(NH4+) = 0.7 mmol/L, c0(K+) = 0.7 mmol/L, c0 (NH4+, K+) = 0.7 mmol/L; w/v = 0.7 gZ/L, T = 22 °C; grain size: 0.5–0.8 mm; n = 2); Figure S3: Experimental NH4+ breakthrough curves and modeling using the Thomas model; Table S1. Determined Thomas model constants (matrix: ultrapure water); Table S2. General information on the investigated natural water matrices; Table S3. Determined Thomas model constants (matrix: natural water).

Author Contributions

Conceptualization, S.E.; formal analysis, S.E.; visualization, S.E.; writing—original draft preparation, S.E.; interpretation of results, S.E., V.S., H.B. and S.S.; writing—review and editing, S.E., V.S., H.B. and S.S.; support of experimental design, V.S., H.B. and S.S.; supervision, V.S., H.B. and S.S.; project administration, H.B. All authors have read and agreed to the published version of the manuscript.

Funding

This research was funded by the German Federal Ministry of Education and Research (No. 02WCL1472A-I).

Institutional Review Board Statement

Not applicable.

Informed Consent Statement

Not applicable.

Data Availability Statement

Data are available upon request.

Acknowledgments

We would like to thank HeGo Biotec GmbH for providing the zeolites used in this research. We also would like to thank Eckhard Worch for providing the LDF programs to model breakthrough curves.

Conflicts of Interest

The authors declare no conflict of interest.

Sample Availability

Not applicable.

References

  1. Food and Agricultural Organization of the United States. Fertilizer by Nutrient. Available online: https://www.fao.org/faostat/en/#data/RFN (accessed on 22 September 2022).
  2. Chen, W.; Hou, Z.; Wu, L.; Liang, Y.; Wei, C. Effects of salinity and nitrogen on cotton growth in arid environment. Plant Soil 2010, 326, 61–73. [Google Scholar] [CrossRef]
  3. Chen, J.; Liu, L.; Wang, Z.; Sun, H.; Zhang, Y.; Bai, Z.; Song, S.; Lu, Z.; Li, C. Nitrogen Fertilization Effects on Physiology of the Cotton Boll–Leaf System. Agronomy 2019, 9, 271. [Google Scholar] [CrossRef]
  4. Coskun, D.; Britto, D.T.; Shi, W.; Kronzucker, H.J. Nitrogen transformations in modern agriculture and the role of biological nitrification inhibition. Nat. Plants 2017, 3, 17074. [Google Scholar] [CrossRef]
  5. Liu, J.; You, L.; Amini, M.; Obersteiner, M.; Herrero, M.; Zehnder, A.J.B.; Yang, H. A high-resolution assessment on global nitrogen flows in cropland. Proc. Natl. Acad. Sci. USA 2010, 107, 8035–8040. [Google Scholar] [CrossRef]
  6. Jiao, J.J.; Wang, Y.; Cherry, J.A.; Wang, X.; Zhi, B.; Du, H.; Wen, D. Abnormally High Ammonium of Natural Origin in a Coastal Aquifer-Aquitard System in the Pearl River Delta, China. Environ. Sci. Technol. 2010, 44, 7470–7475. [Google Scholar] [CrossRef] [PubMed]
  7. WHO. Guidelines for Drinking-Water Quality: Fourth Edition Incorporating the First Addendum; World Health Organisation: Geneva, Switzerland, 2017. [Google Scholar]
  8. Ward, M.H.; Jones, R.R.; Brender, J.D.; De Kok, T.M.; Weyer, P.J.; Nolan, B.T.; Villanueva, C.M.; Van Breda, S.G. Drinking Water Nitrate and Human Health: An Updated Review. Int. J. Environ. Res. Public Health 2018, 15, 1557. [Google Scholar] [CrossRef] [PubMed]
  9. Uhlmann, W.; Kreuziger, Y.; Kruspe, R.; Neumann, J.; Berg, T. Untersuchungen zu Ammonium in ostsächsischen Bergbaufolgeseen. Available online: https://www.wasser.sachsen.de/download/Abschlussbericht_TP_05_online.pdf (accessed on 4 August 2021).
  10. Gupta, V.K.; Sadegh, H.; Yari, M.; Shahryari Ghoshekandi, R.; Maazinejad, B.; Chahardori, M. Removal of ammonium ions from wastewater: A short review in development of efficient methods. Glob. J. Environ. Sci. Manag. 2015, 1, 149–158. [Google Scholar] [CrossRef]
  11. U.S. Geological Survey. Mineral Commodity Summaries. 2021. Available online: https://pubs.usgs.gov/periodicals/mcs2021/mcs2021.pdf (accessed on 2 October 2021).
  12. Virta, R. Minerals Yearbook 2011. Available online: https://s3-us-west-2.amazonaws.com/prd-wret/assets/palladium/production/mineral-pubs/zeolites/myb1-2011-zeoli.pdf (accessed on 12 December 2021).
  13. Zeolite Products. Home–Zeolite Products. Available online: https://www.zeolite-products.com/ (accessed on 15 March 2022).
  14. Taddeo, R.; Prajapati, S.; Lepistö, R. Optimizing ammonium adsorption on natural zeolite for wastewaters with high loads of ammonium and solids. J. Porous Mater. 2017, 24, 1545–1554. [Google Scholar] [CrossRef]
  15. Guaya, D.; Valderrama, C.; Farran, A.; Armijos, C.; Cortina, J.L. Simultaneous phosphate and ammonium removal from aqueous solution by a hydrated aluminum oxide modified natural zeolite. Chem. Eng. J. 2015, 271, 204–213. [Google Scholar] [CrossRef]
  16. Karadag, D.; Tok, S.; Akgul, E.; Turan, M.; Ozturk, M.; Demir, A. Ammonium removal from sanitary landfill leachate using natural Gördes clinoptilolite. J. Hazard. Mater. 2008, 153, 60–66. [Google Scholar] [CrossRef]
  17. Du, Q.; Liu, S.; Cao, Z.; Wang, Y. Ammonia removal from aqueous solution using natural Chinese clinoptilolite. Sep. Purif. Technol. 2005, 44, 229–234. [Google Scholar] [CrossRef]
  18. Eberle, S.; Börnick, H.; Stolte, S. Granular Natural Zeolites: Cost-Effective Adsorbents for the Removal of Ammonium from Drinking Water. Water 2022, 14, 939. [Google Scholar] [CrossRef]
  19. Weatherley, L.; Miladinovic, N. Comparison of the ion exchange uptake of ammonium ion onto New Zealand clinoptilolite and mordenite. Water Res. 2004, 38, 4305–4312. [Google Scholar] [CrossRef] [PubMed]
  20. Kwakye-Awuah, B.; Sefa-Ntiri, B.; Von-Kiti, E.; Nkrumah, I.; Williams, C. Adsorptive Removal of Iron and Manganese from Groundwater Samples in Ghana by Zeolite Y Synthesized from Bauxite and Kaolin. Water 2019, 11, 1912. [Google Scholar] [CrossRef]
  21. Erdem, E.; Karapinar, N.; Donat, R. The removal of heavy metal cations by natural zeolites. J. Colloid Interface Sci. 2004, 280, 309–314. [Google Scholar] [CrossRef] [PubMed]
  22. Belviso, C. Zeolite for Potential Toxic Metal Uptake from Contaminated Soil: A Brief Review. Processes 2020, 8, 820. [Google Scholar] [CrossRef]
  23. Kotoulas, A.; Agathou, D.; Triantaphyllidou, I.E.; Tatoulis, T.I.; Akratos, C.S.; Tekerlekopoulou, A.G.; Vayenas, D.V. Zeolite as a Potential Medium for Ammonium Recovery and Second Cheese Whey Treatment. Water 2019, 11, 136. [Google Scholar] [CrossRef]
  24. Hedström, A.; Rastas Amofah, L. Adsorption and desorption of ammonium by clinoptilolite adsorbent in municipal wastewater treatment systems. J. Environ. Eng. Sci. 2008, 7, 53–61. [Google Scholar] [CrossRef]
  25. Eberle, S.; Börnick, H.; Stolte, S. A Sequential Anammox Zeolite-Biofilter for the Removal of Nitrogen Compounds from Drinking Water. Water 2022, 14, 3512. [Google Scholar] [CrossRef]
  26. Kannan, A.D.; Parameswaran, P. Ammonia adsorption and recovery from swine wastewater permeate using naturally occurring clinoptilolite. J. Water Process. Eng. 2021, 43, 102234. [Google Scholar] [CrossRef]
  27. Gagliano, E.; Sgroi, M.; Falciglia, P.P.; Belviso, C.; Cavalcante, F.; Lettino, A.; Vagliasindi, F.G.; Roccaro, P. Removal of ammonium from wastewater by zeolite synthetized from volcanic ash: Batch and column tests. J. Environ. Chem. Eng. 2022, 10, 107539. [Google Scholar] [CrossRef]
  28. Worch, E. Adsorption Technology in Water Treatment: Fundamentals, Processes, and Modeling, 2nd ed.; De Gruyter: Berlin, Germany, 2021; ISBN 9783110715507. [Google Scholar]
  29. Lin, L.; Lei, Z.; Wang, L.; Liu, X.; Zhang, Y.; Wan, C.; Lee, D.-J.; Tay, J.H. Adsorption mechanisms of high-levels of ammonium onto natural and NaCl-modified zeolites. Sep. Purif. Technol. 2013, 103, 15–20. [Google Scholar] [CrossRef]
  30. Ivanova, E.; Karsheva, M.; Koumanova, B. Adsorption of ammonium ions onto natural zeolite. J. Univ. Chem. Technol. Metall. 2010, 45, 295–302. [Google Scholar]
  31. Huo, H.; Lin, H.; Dong, Y.; Cheng, H.; Wang, H.; Cao, L. Ammonia-nitrogen and phosphates sorption from simulated reclaimed waters by modified clinoptilolite. J. Hazard. Mater. 2012, 229–230, 292–297. [Google Scholar] [CrossRef]
  32. Cheng, Z.; Ding, W. Ammonium removal from water by natural and modified zeolite: Kinetic, equilibrium, and thermodynamic studies. Desalin. Water Treat. 2014, 55, 978–985. [Google Scholar] [CrossRef]
  33. Moussavi, G.; Talebi, S.; Farrokhi, M.; Sabouti, R.M. The investigation of mechanism, kinetic and isotherm of ammonia and humic acid co-adsorption onto natural zeolite. Chem. Eng. J. 2011, 171, 1159–1169. [Google Scholar] [CrossRef]
  34. Chen, H.-F.; Lin, Y.-J.; Chen, B.-H.; Yoshiyuki, I.; Liou, S.Y.-H.; Huang, R.-T. A Further Investigation of NH4+ Removal Mechanisms by Using Natural and Synthetic Zeolites in Different Concentrations and Temperatures. Minerals 2018, 8, 499. [Google Scholar] [CrossRef]
  35. Jaskūnas, A.; Subačius, B.; Šlinkšiene, R. adsorption of potassium ions on natural zeolite: Kinetic and equilibrium studies. Chemija 2015, 26, 69–78. [Google Scholar]
  36. Kodewitz, P. Datasheet CLP85+ Natural Zeolite. Available online: https://www.zeolith-gmbh.com/produkte/klinoptilolith-zeolith (accessed on 16 February 2022).
  37. Mazloomi, F.; Jalali, M. Ammonium removal from aqueous solutions by natural Iranian zeolite in the presence of organic acids, cations and anions. J. Environ. Chem. Eng. 2016, 4, 1664–1673. [Google Scholar] [CrossRef]
  38. Akcay, M.U.; Avdan, Z.Y.; Inan, H. Effect of biofiltration process on the control of THMs and HAAs in drinking water. Desalin. Water Treat. 2016, 57, 2546–2554. [Google Scholar] [CrossRef]
  39. Inglezakis, V.J.; Zorpus, A.A. Handbook of Natural Zeolites, 1st ed.; Bentham Science Publishers: Sharjah, United Arab Emirates, 2012; ISBN 9781608052615. [Google Scholar]
  40. Margeta, K.; Zabukovec, N.; Siljeg, M.; Farkas, A. Natural Zeolites in Water Treatment—How Effective is Their Use. In Water Treatment; Elshorbagy, W., Ed.; InTech: London, UK, 2013; ISBN 978-953-51-0928-0. [Google Scholar]
  41. HEU: Framework Type. Available online: https://america.iza-structure.org/IZA-SC/framework.php?STC=HEU (accessed on 30 January 2023).
  42. Sidey, V. On the effective ionic radii for ammonium. Acta Crystallogr. Sect. B Struct. Sci. 2016, 72, 626–633. [Google Scholar] [CrossRef]
  43. Shannon, R.D. Revised effective ionic radii and systematic studies of interatomic distances in halides and chalcogenides. Acta Cryst. 1976, A32, 751–767. [Google Scholar] [CrossRef]
  44. Nightingale, E.R., Jr. Phenomenological Theory of Ion Solvation. Effective Radii of Hydrated Ions. J. Phys. Chem. 1959, 63, 1381–1387. [Google Scholar] [CrossRef]
  45. Gnielinski, V. Equations for the calculation of heat and mass transfer during flow through stationary spherical packings at moderate and high Peclet numbers. Int. Chem. Eng. 1981, 21, 3. [Google Scholar]
  46. Thomas, H.C. Heterogeneous Ion Exchange in a Flowing System. J. Am. Chem. Soc. 1944, 66, 1664–1666. [Google Scholar] [CrossRef]
Figure 1. Experimental NH4+ and K+ breakthrough curves and their modeling using the LDF model (a) and the Thomas model (b) (matrix: ultrapure water; c0(NH4+) = 0.7 mmol/L, c0(NH4+, K+) = 0.7 mmol/L, c0(K+) = 0.7 mmol/L; vF = 1.74 m/h; EBCT: 2.16 min; pH0: 5.9; T = 22 °C; n = 2).
Molecules 28 01614 g001aMolecules 28 01614 g001b
Figure 2. Influence of natural water matrices on the breakthrough curves of NH4+ in a natural zeolite-filled, fixed-bed column (matrix: natural; c0(NH4+) = 0.7 mmol/L; vF = 1.74 m/h; EBCT: 2.16 min; pHcontrol: 5.9; pH0: 7.8; T = 22 °C; n = 2).
Molecules 28 01614 g002
Figure 3. Correlation of Thomas model rate constant kTh with DOC (a) and K+ (b) concentrations (matrix: natural; c0(DOC) = 1.76–7.88 mg/L; c0(K+) = 1.63–5.44 mg/L; vF = 1.74 m/h; EBCT: 2.16 min; pH0: 7.8; T = 22 °C; n = 2).
Molecules 28 01614 g003
Figure 4. Two-factor variance analysis of kTh as a function of K+ and DOC concentrations (matrix: natural; c0(DOC) = 1.76–7.88 mg/L; c0(K+) = 1.63–5.44 mg/L vF = 1.74 m/h; EBCT: 2.16 min; pH0: 7.8; T = 22 °C; n = 2).
Molecules 28 01614 g004
Figure 5. Flowcharts of the continuous flow through fixed-bed column (a) and differential circuit batch reactor (b) used in this study.
Molecules 28 01614 g005
Table 1. Modeling parameters determined for each water matrix investigated x—Parameter abbreviations can be found in the table footer xx.
Investigation
Steps
ModelingWater Matrix
ParameterUnit0.7 mmol/L
NH4+
0.7 mmol/L
K+
0.7 mmol/L
NH4+ (+K+)
Freundlich
parameters
KF( L n F * mg 1 - n F /g)1.028.39 × 10−31.21
nF(−)0.932.190.63
R2(−)0.990.850.98
Diffusion
parameters
kFav(1/s)5.2 × 10−13.7 × 10−15.2 × 10⁻¹
ksav(1/s)1.1 × 10−43.6 × 10−59.8 × 10⁻⁵
w(g/mg)−0.11−0.02−0.05
Breakthrough curve
modeling
V ˙ (m3/h)1.1 × 10−4
vF(m/h)1.75
EBCT(min)2.16
DL(m2/s)2.39 × 10−9 (NH4+)
1.59 × 10⁻⁹ (K+)
ρB(kg/m3)0.91
εB(−)0.2
av(1/m)7.61 × 103
ν(m2/s)9.55 × 10−7
Re(−)1.64
Sc(−)3.98 × 10³
x Mean values were used for modeling because of <5% standard deviations in all experiments. xx Abbreviations: KF, nF: Freundlich isotherm parameters; kFav: mass rate constant of the film diffusion; ksav: mass rate constant of the intraparticle diffusion; w: describes strength of the average loading of the sorbent on the intraparticle mass transfer; V ˙ : volume rate; vF: filter velocity; EBCT: empty bed contact time; DL: diffusion coefficient in the aqueous phase; ρB: bed density; εB: bed porosity; av: specific particle surface; ν: kinematic viscosity; Re: Reynolds number; Sc: Schmidt number.
Table 2. Chemical composition and zeolite characteristics, data provided by supplier.
CompositionValue (%)Characteristics
SiO265.00–71.30Exchange capacity1.2–1.5 mol/kg
Al2O311.50–13.10SelectivityNH4+ > K+ > Na+ > Ca2+ > Mg2+
CaO2.70–5.20Mean pore diameter0.4 nm
K2O2.20–3.40Specific surface30–60 m2/g
Fe2O30.70–1.90Si/Al4.80–5.40 (−)
MgO0.60–1.20Grain sizes0.5–0.8 mm
Na2O0.20–1.30
TiO20.10–0.30
Table 3. Initial cation and DOC concentrations of the natural water matrices investigated.
Water MatricesCations (mmol/L)DOC (mg/L)
K+Na+Mg2+Ca2+
Ultrapure water (control)<CR x<CR x<CR x<CR x0.09
Tap water0.040.360.120.831.76
Elbe-/tap water (1:10)0.050.430.130.842.52
Groundwater0.110.910.661.234.56
Elbe river water0.141.160.310.927.88
X below calibration range: 0.2–40 mg/L.
Table 4. Channel dimensions and ring types of natural zeolites (clinoptilolite x).
Channel Dimension (nm)Ring Type
Inglezakis and Zorpas [39]Margeta et al.
[40]
NumberPore Structure
0.75 × 0.310.72 × 0.44102-dimensional
0.47 × 0.280.55 × 0.408
0.46 × 0.360.47 × 0.418
x Framework type HEU—cell parameters: a = 1.75 nm, b = 1.76 nm, c = 0.74 nm [41].
Table 5. Physical characteristics of the investigated cations.
CationCharge Density
(C/mm3)
Ionic Radius
(nm)
Hydrated Radius
(nm)
NH4+120.148 (a)0.331 (c)
K+140.138 (b)0.331 (c)
Na+370.102 (b)0.358 (c)
Ca2+760.100 (b)0.412 (c)
Mg2+2050.072 (b)0.428 (c)
(a) [42],(b) [43],(c) [44].
Disclaimer/Publisher’s Note: The statements, opinions and data contained in all publications are solely those of the individual author(s) and contributor(s) and not of MDPI and/or the editor(s). MDPI and/or the editor(s) disclaim responsibility for any injury to people or property resulting from any ideas, methods, instructions or products referred to in the content.

