

Analysis of Co-Crystallization Mechanism of Theophylline and Citric Acid from Raman Investigations in Pseudo Polymorphic Forms Obtained by Different Synthesis Methods

Abstract
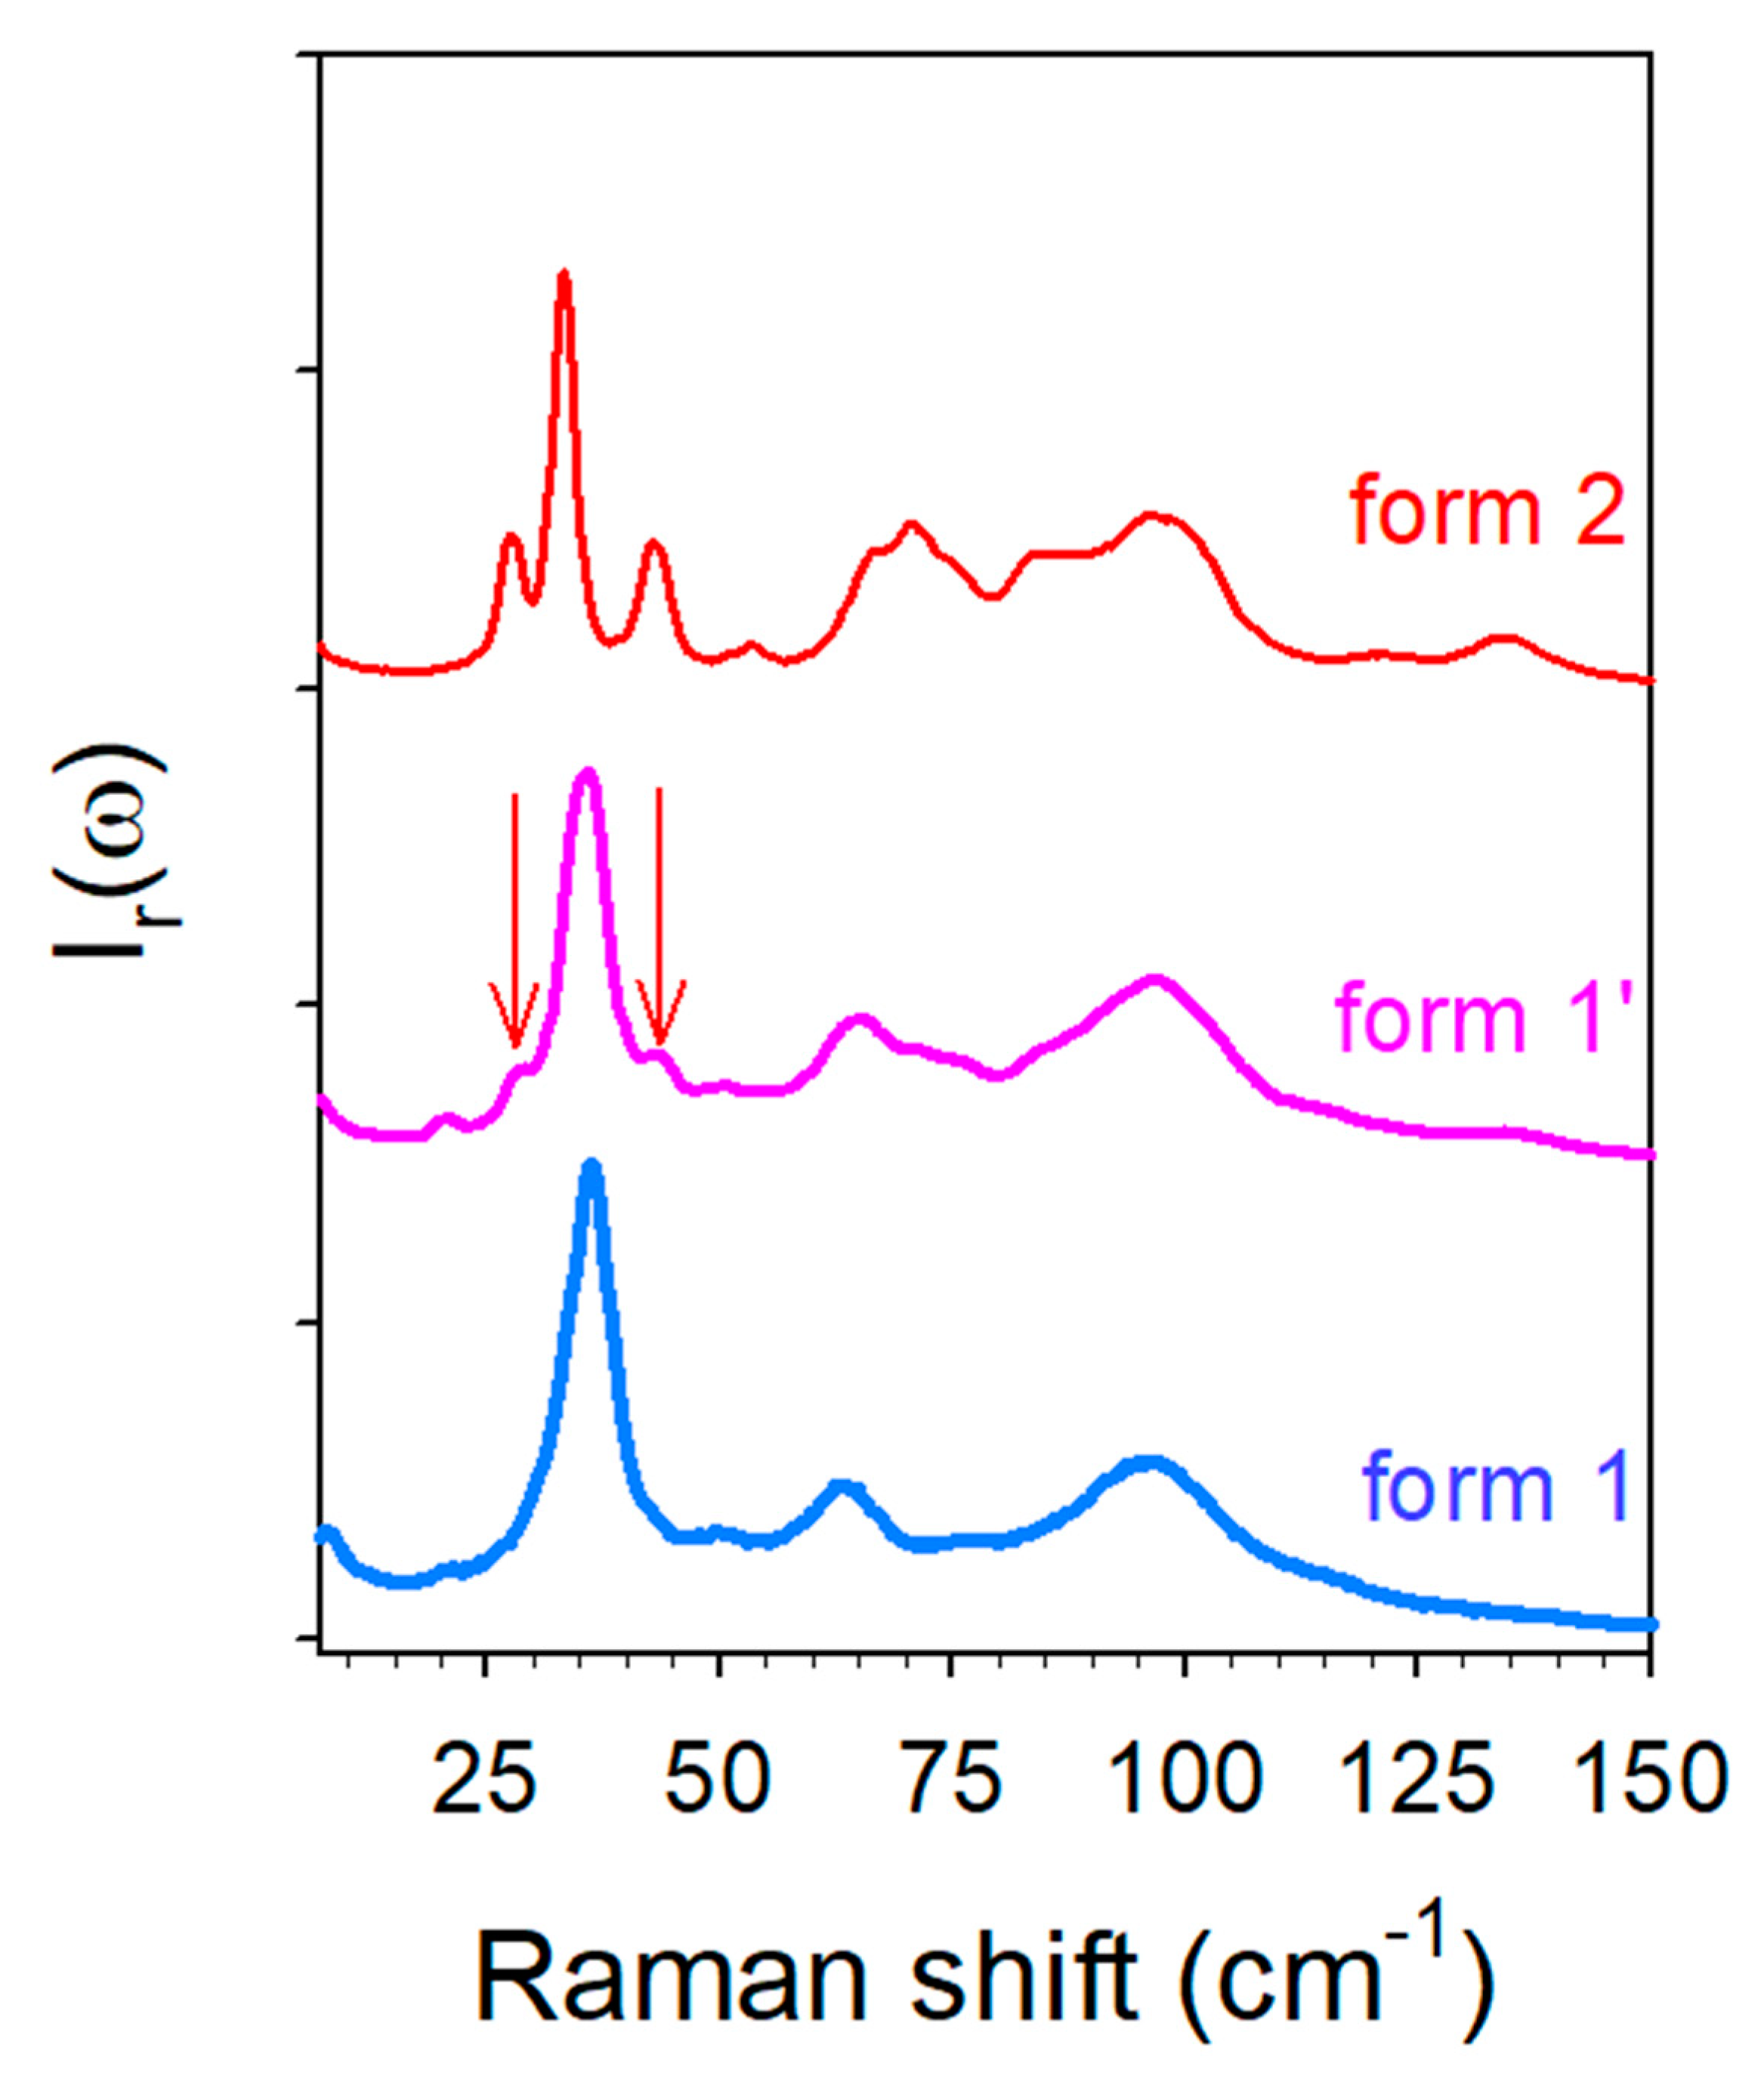
:
1. Introduction
2. Results
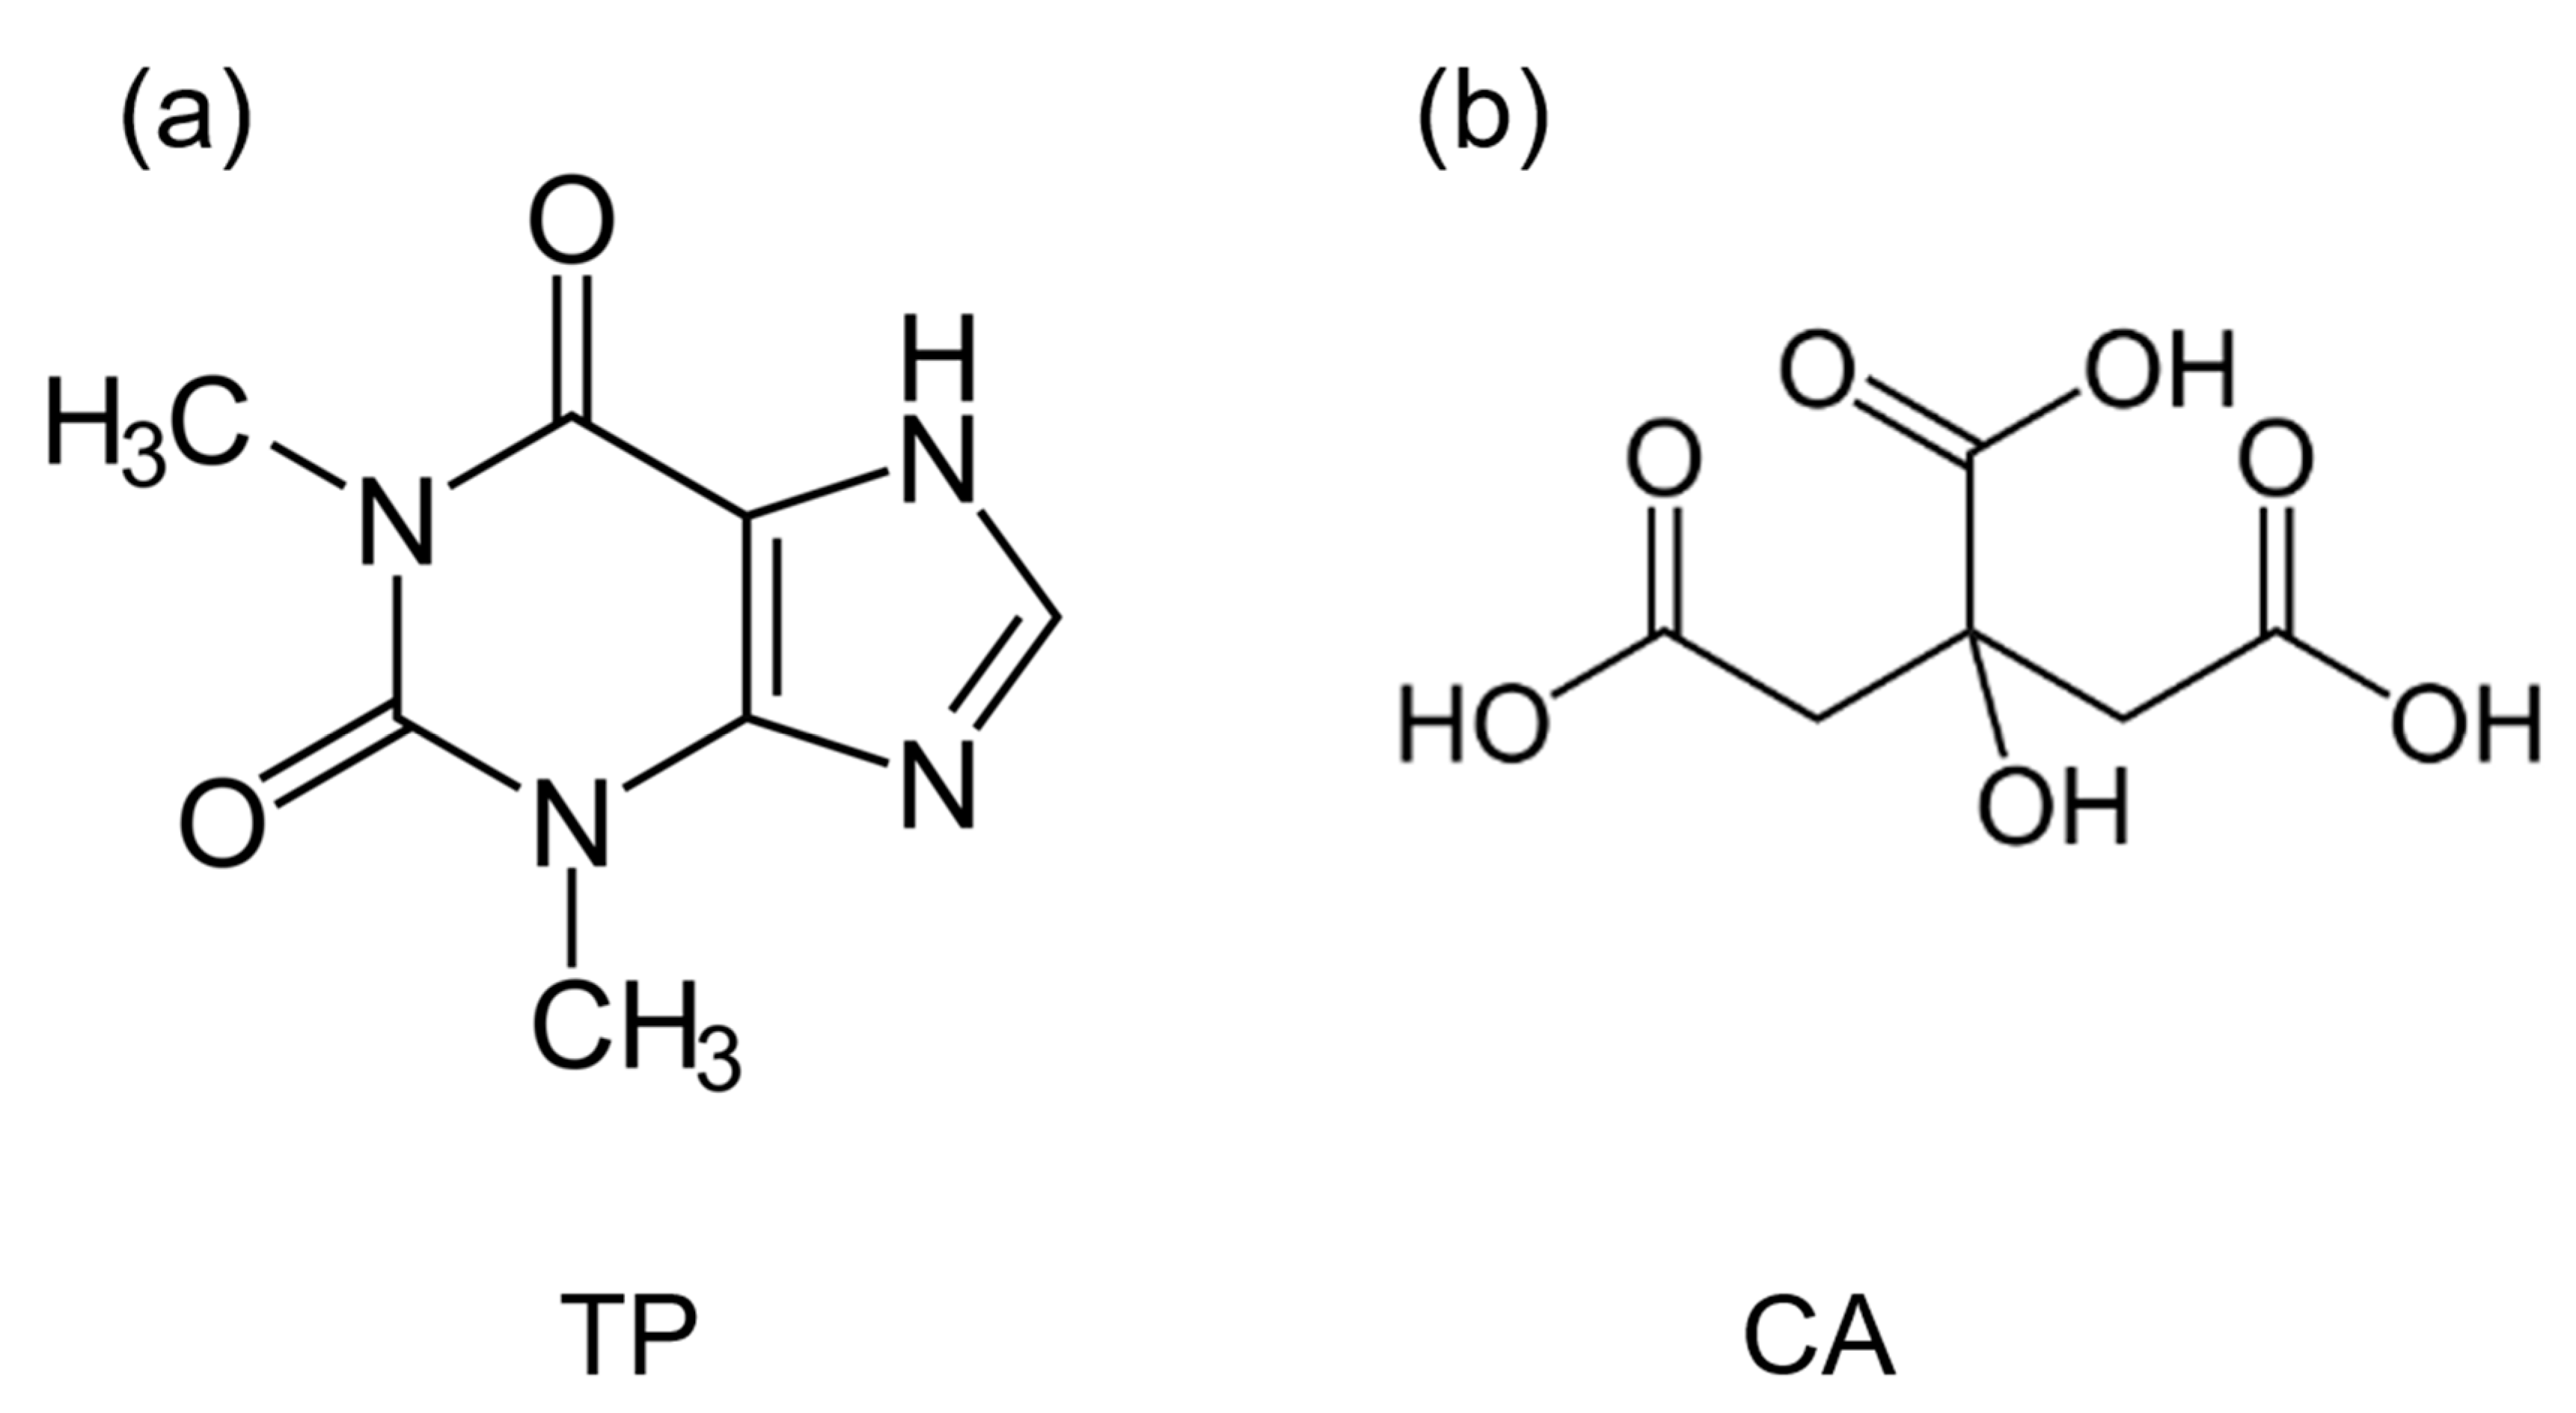
2.1. Identification of Co-Crystals after Preparation
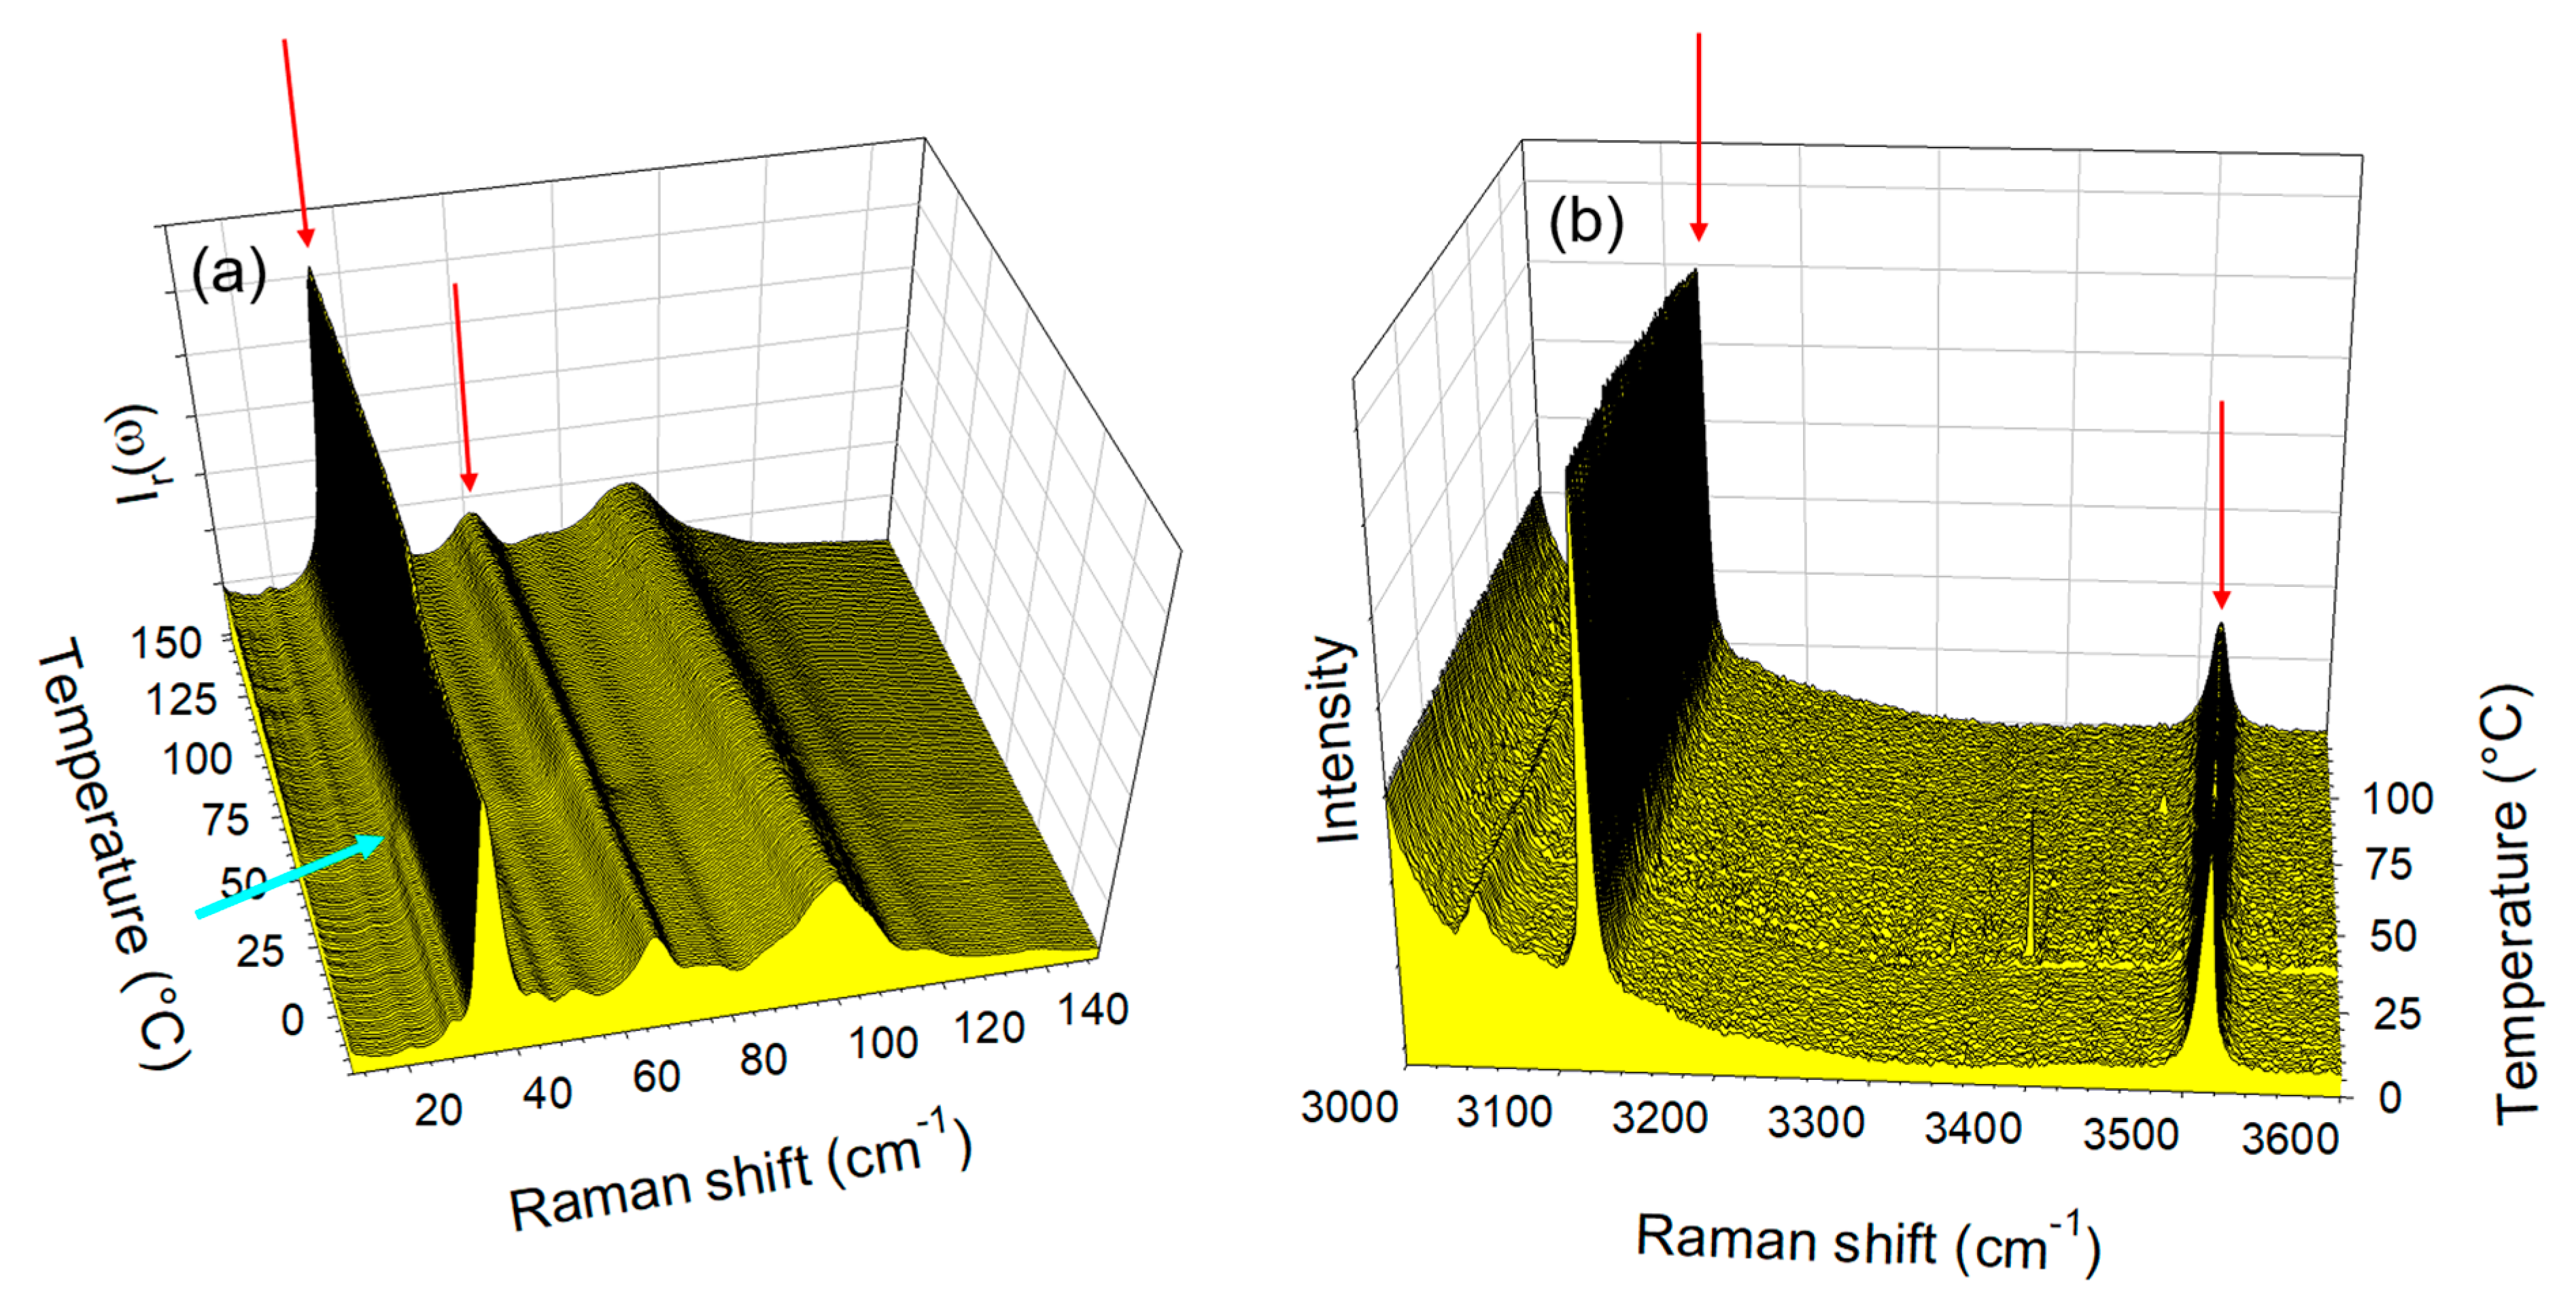
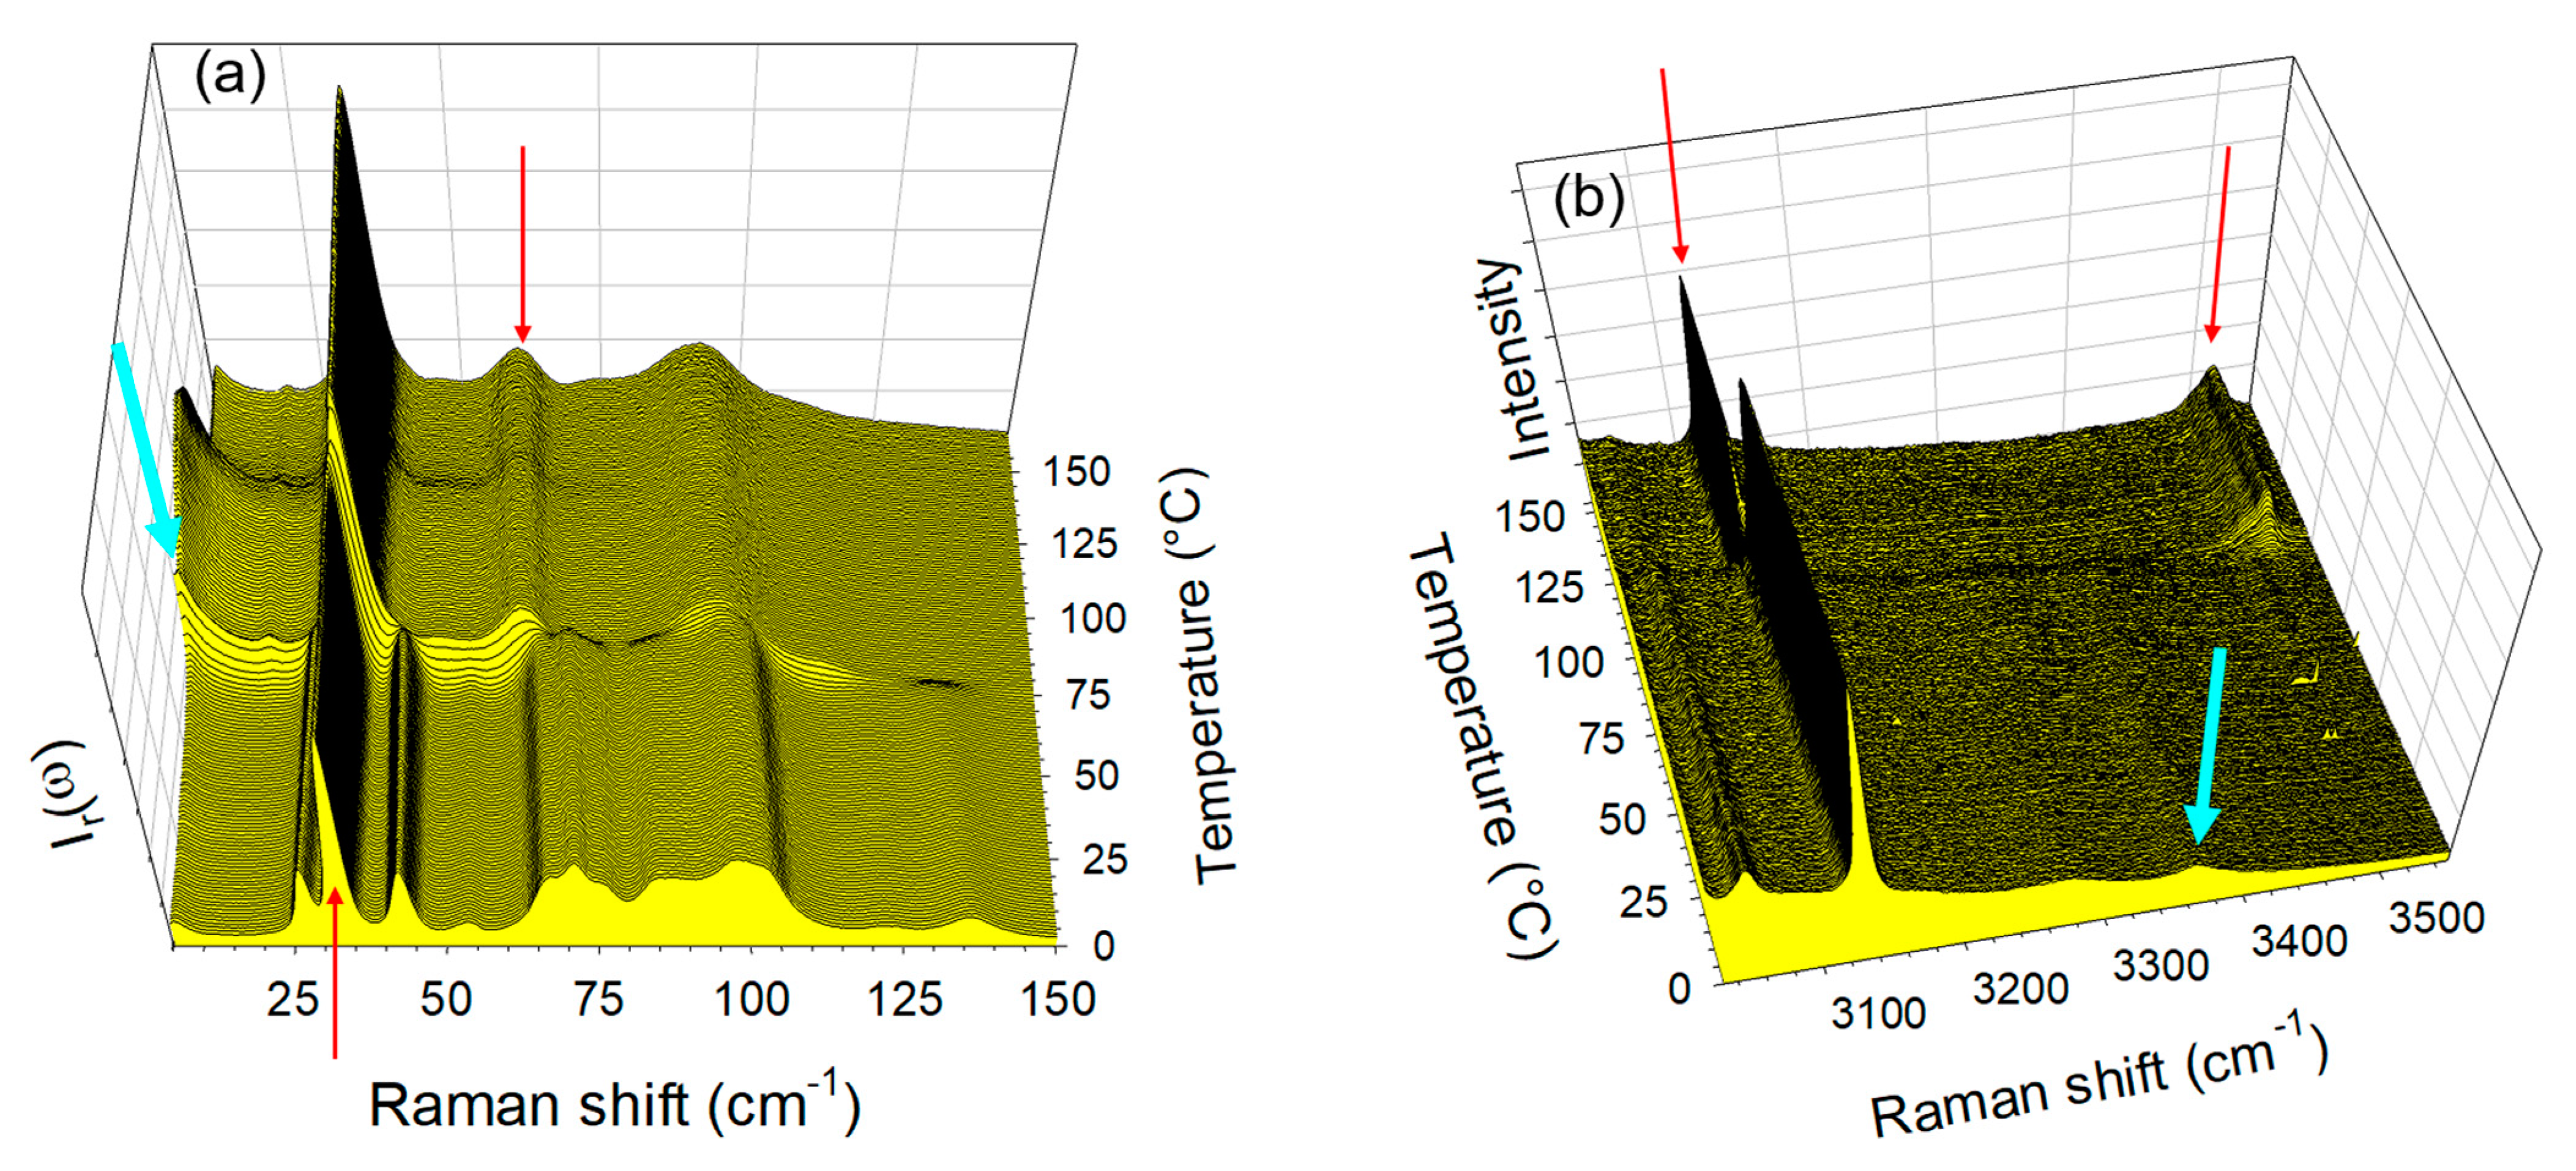
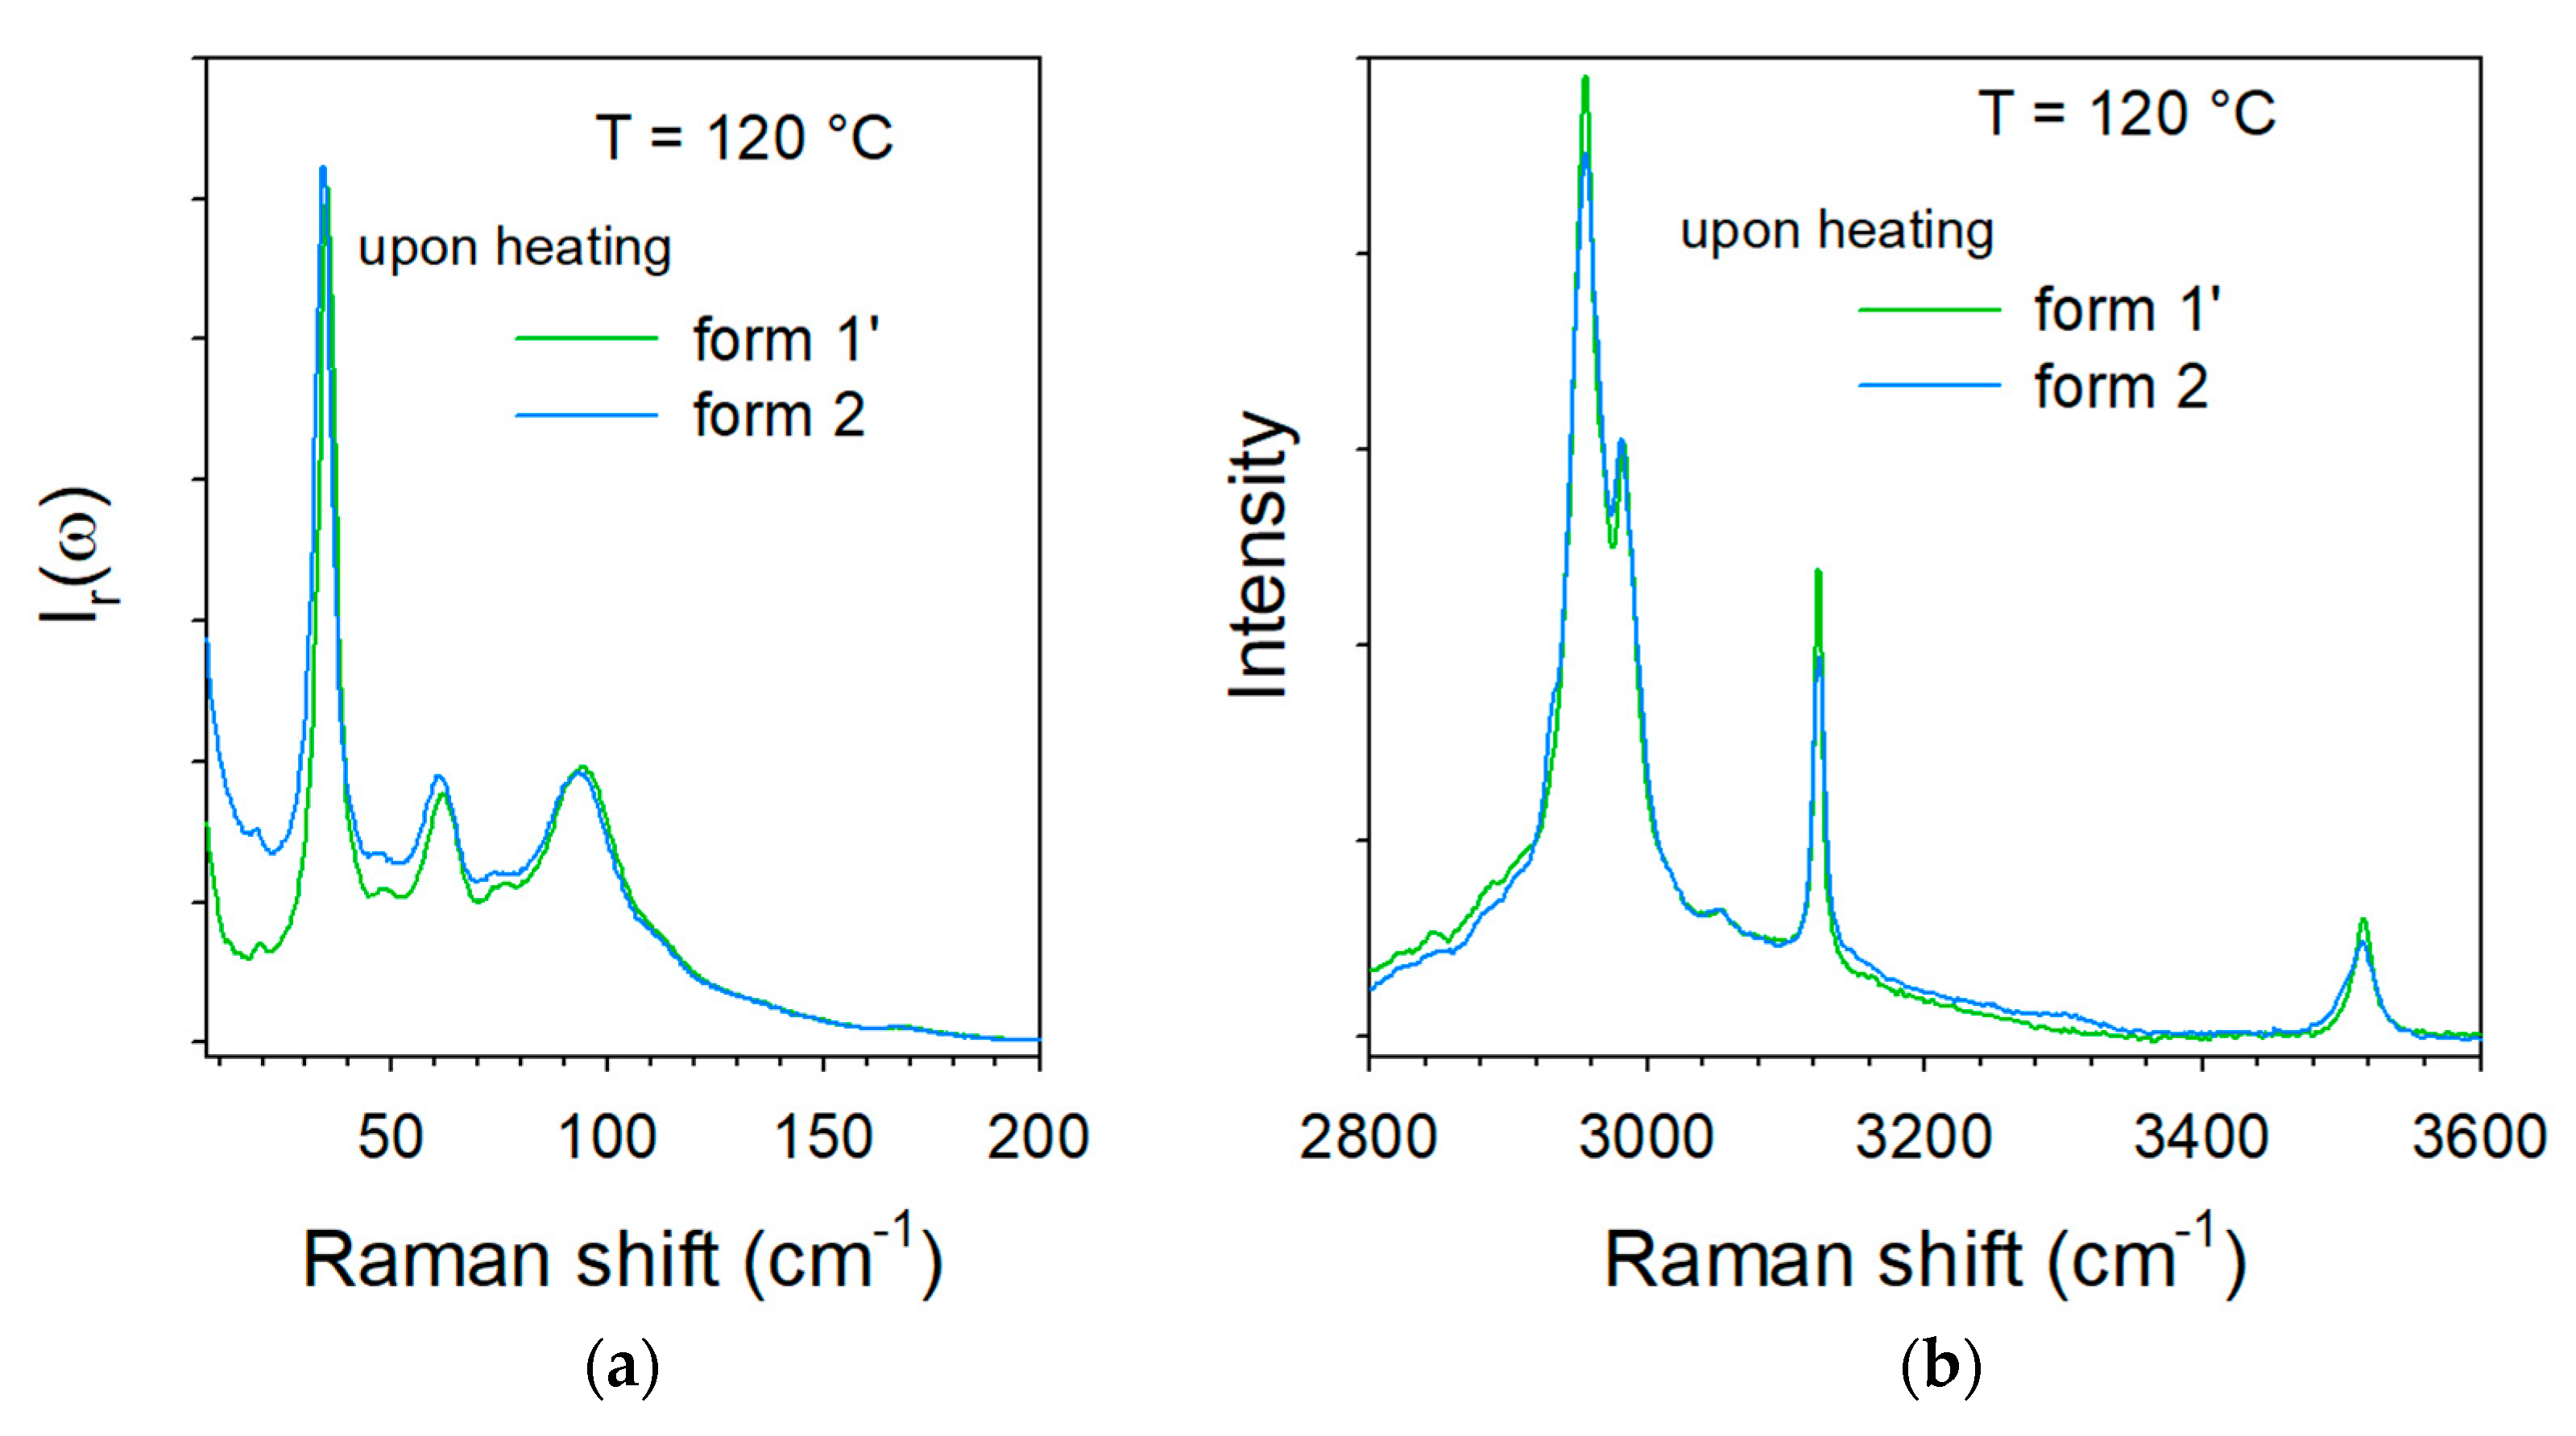
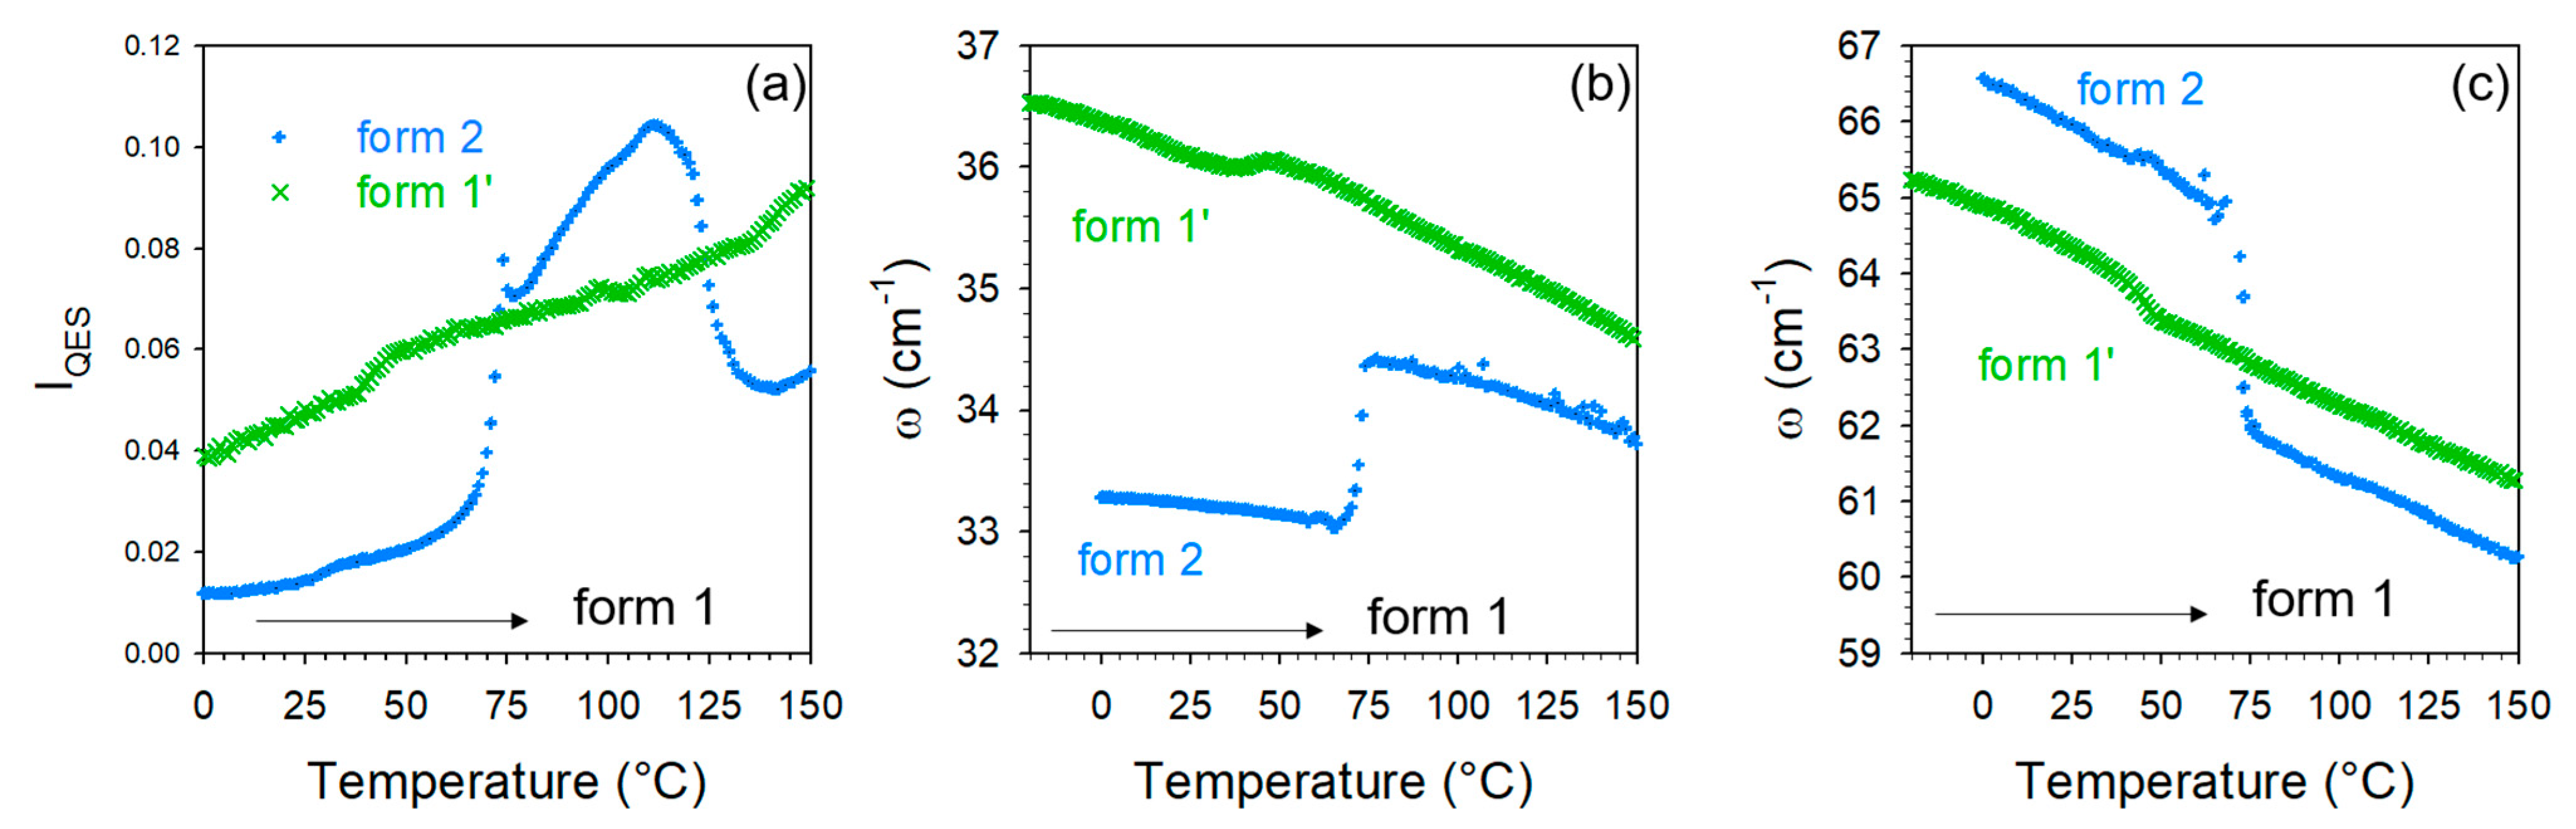
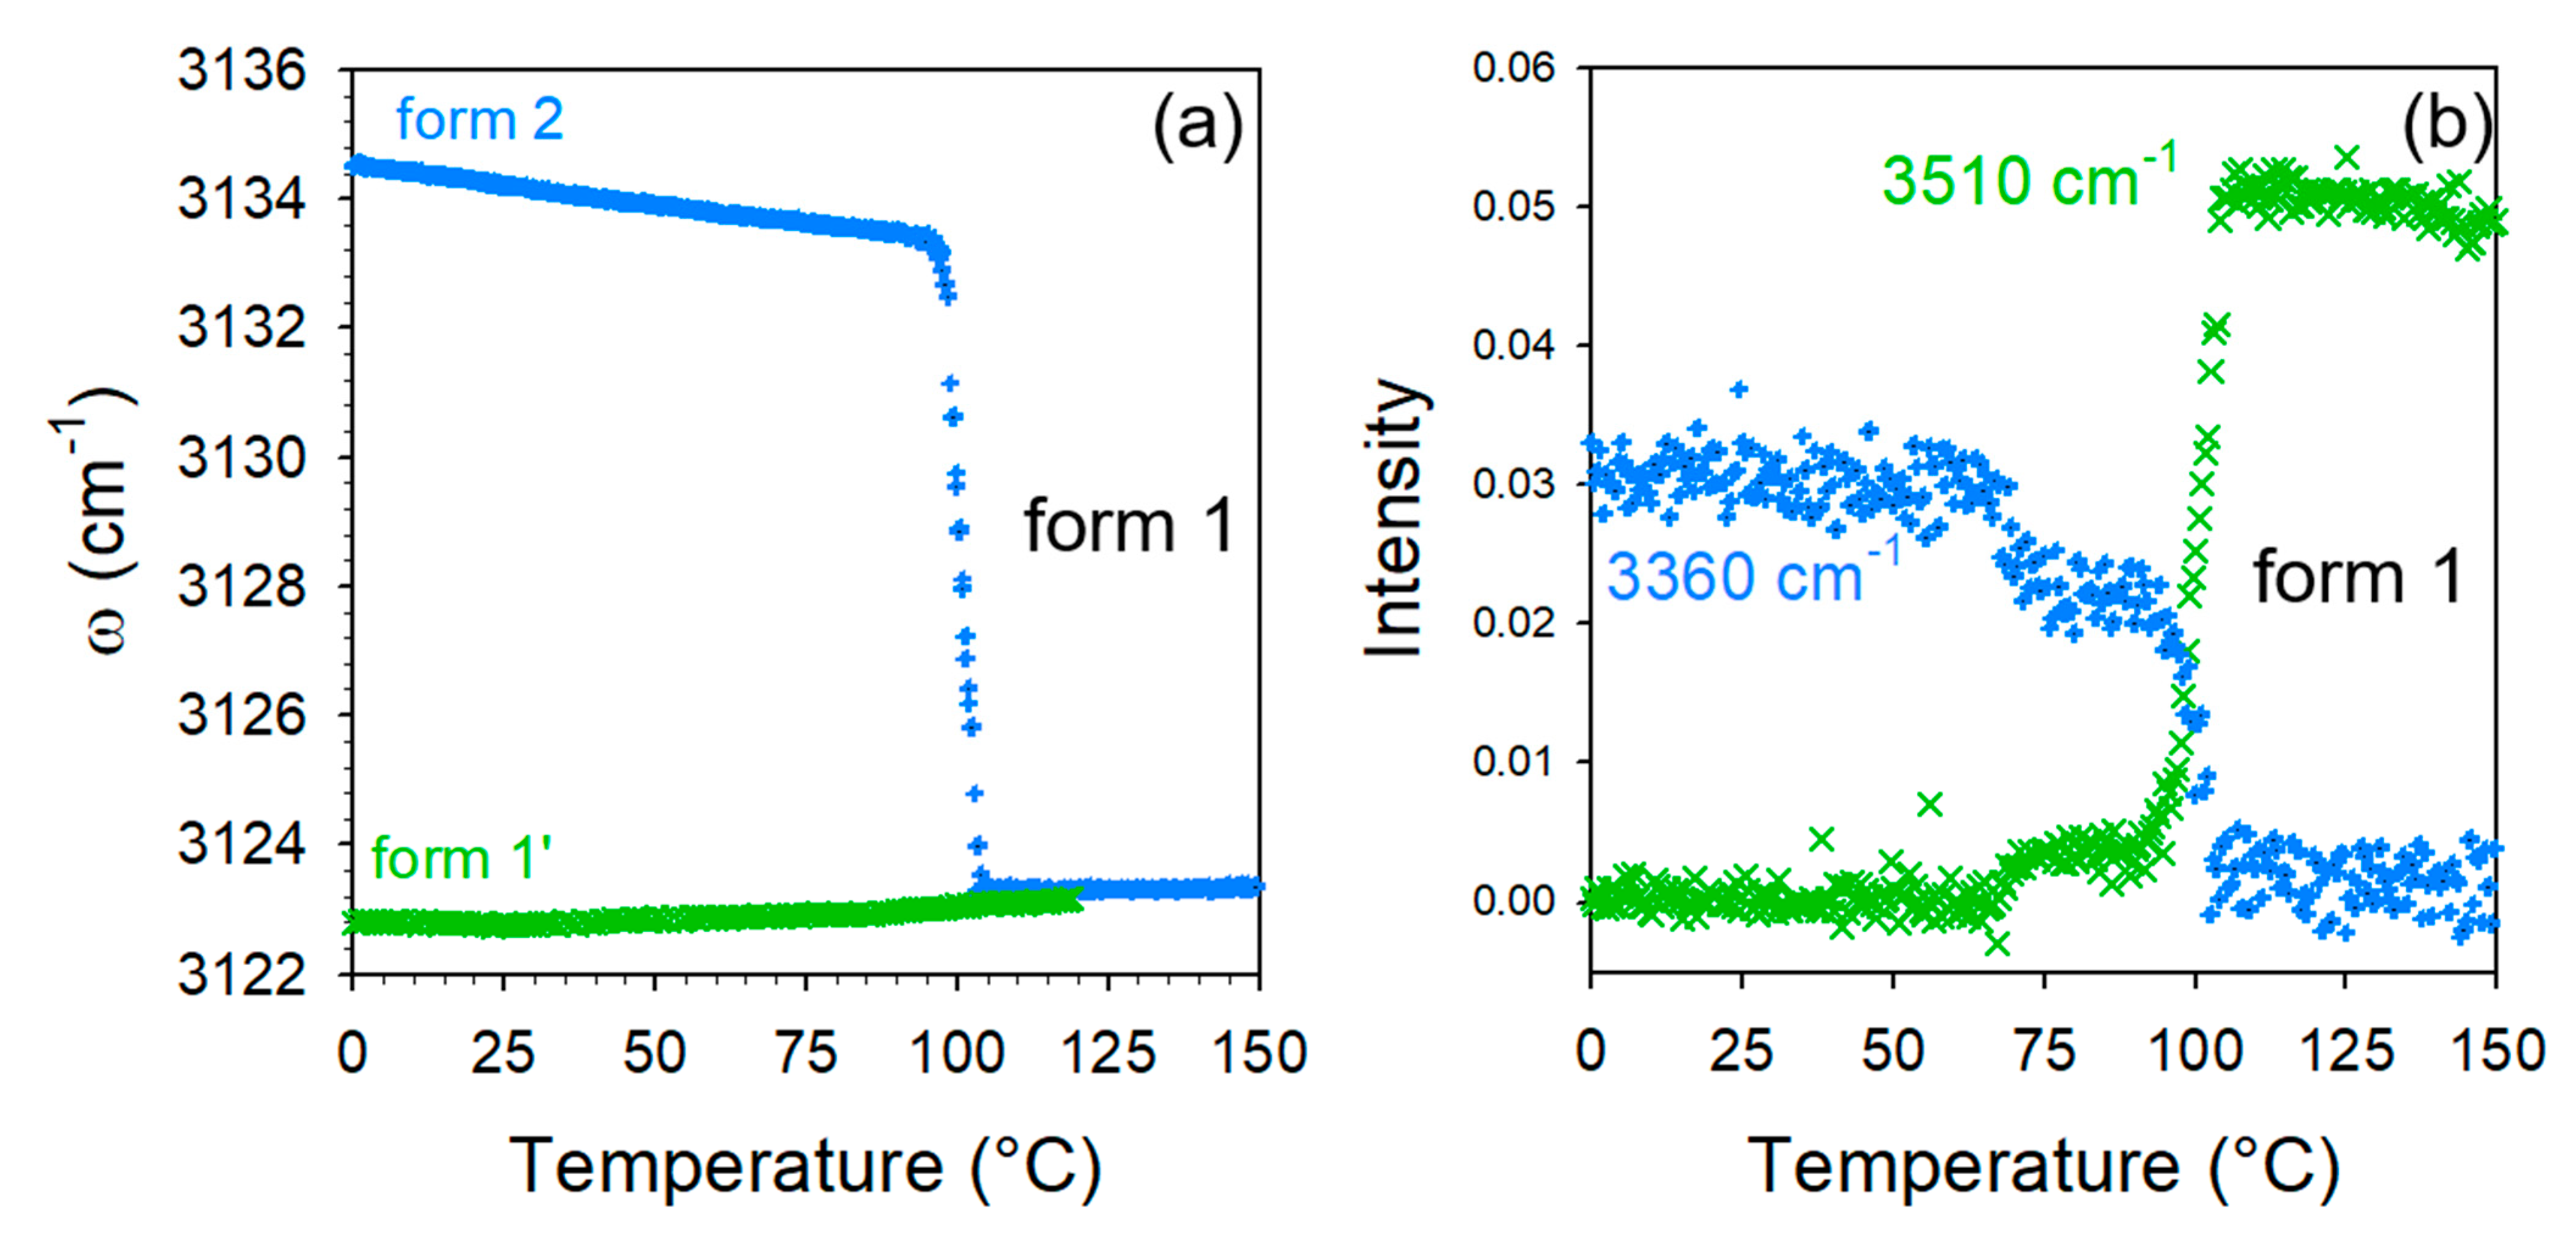
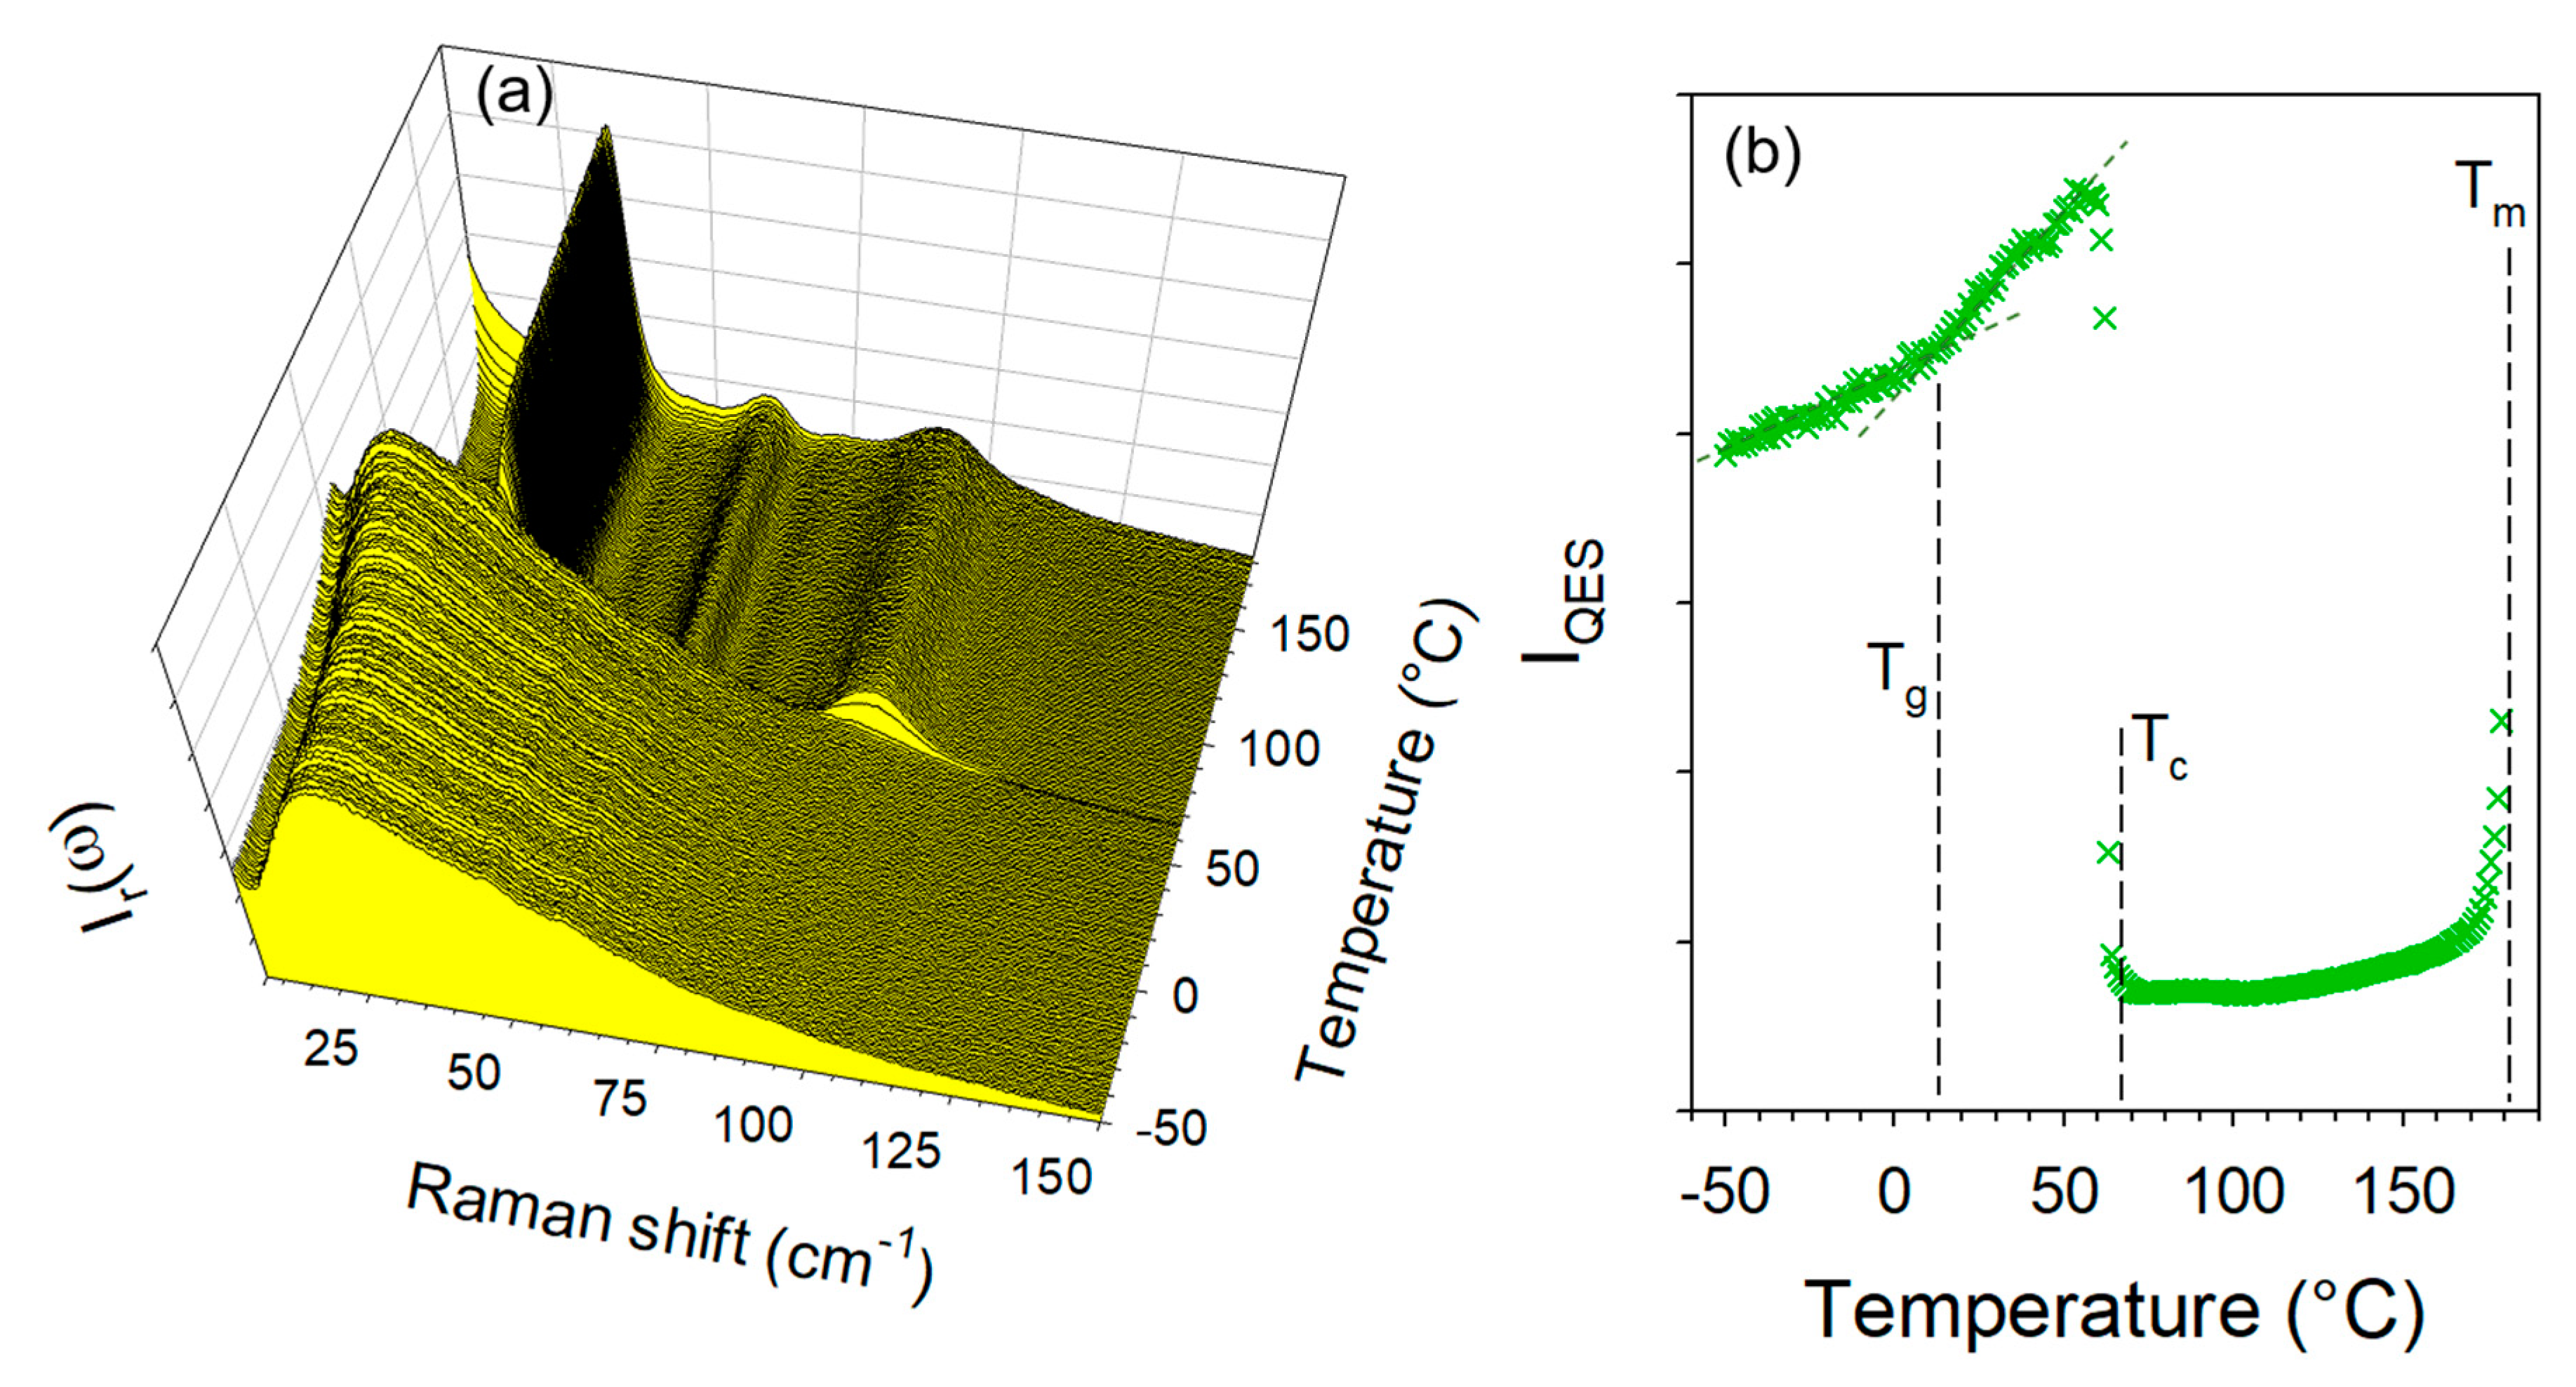
2.2. Thermal Stability of Co-Crystals
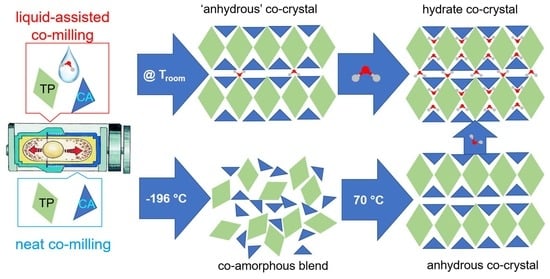
2.3. Co-Milling Anydrous Reactants
2.3.1. Cryogenic Co-Milling
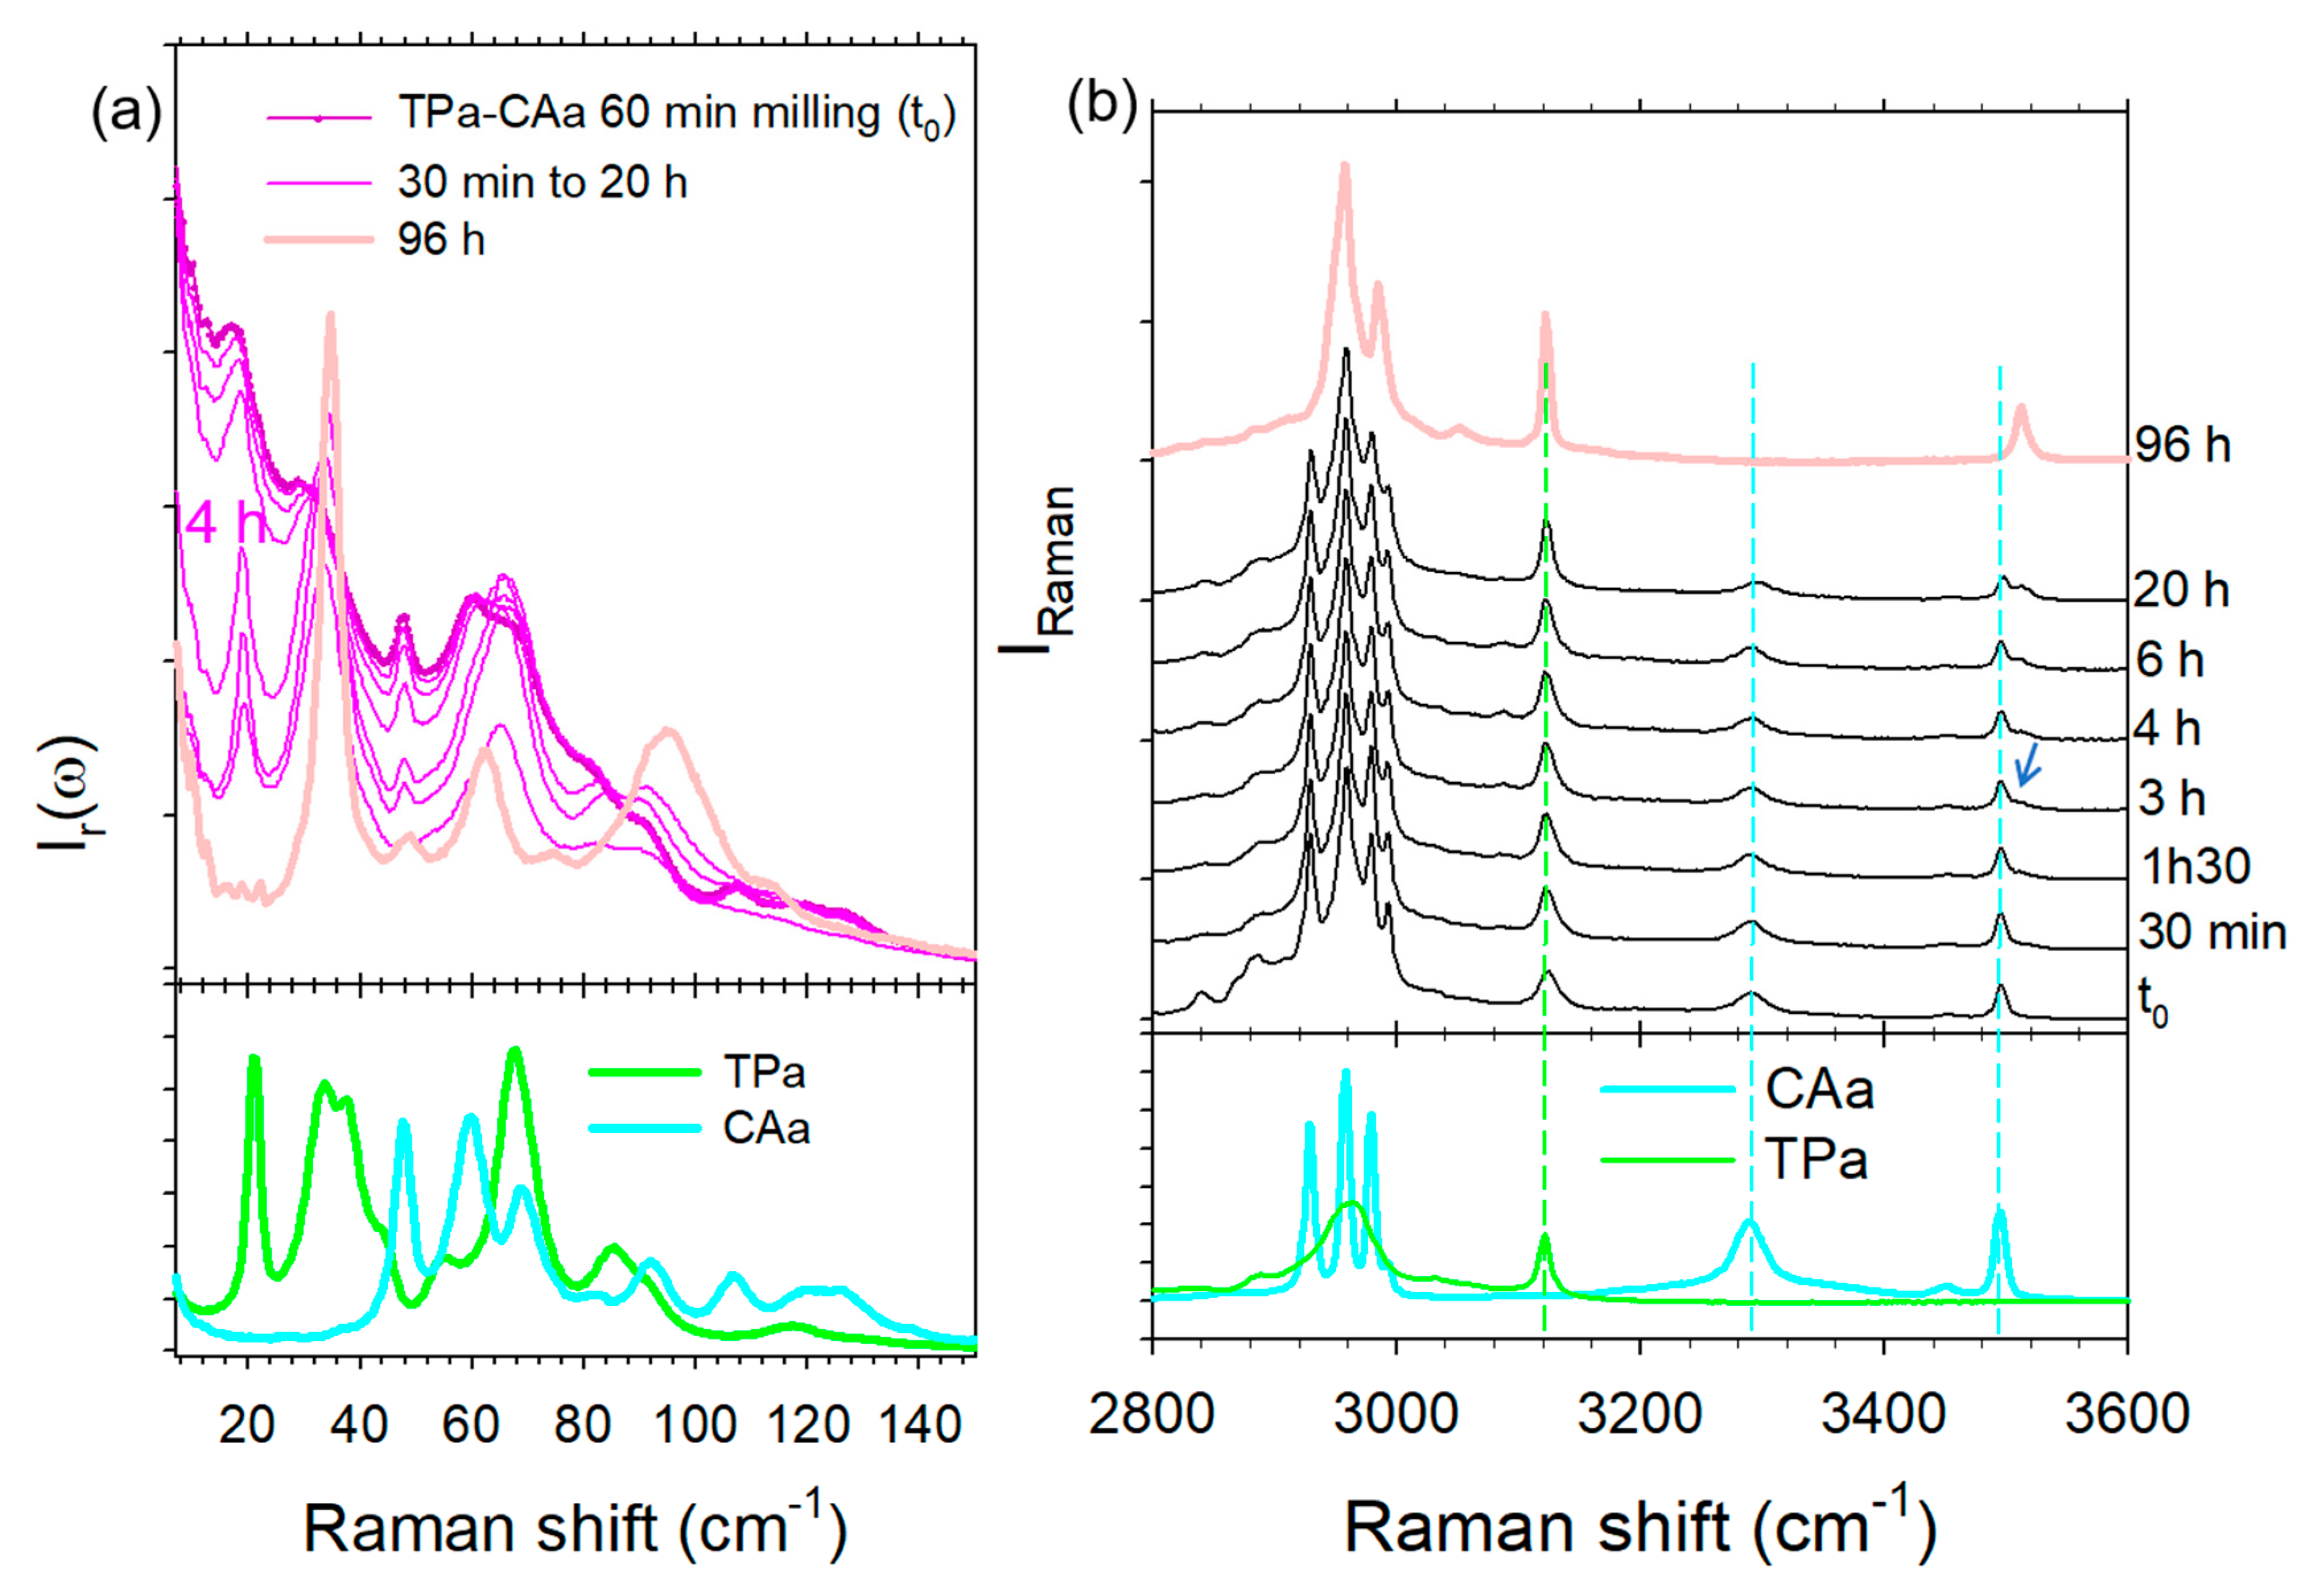
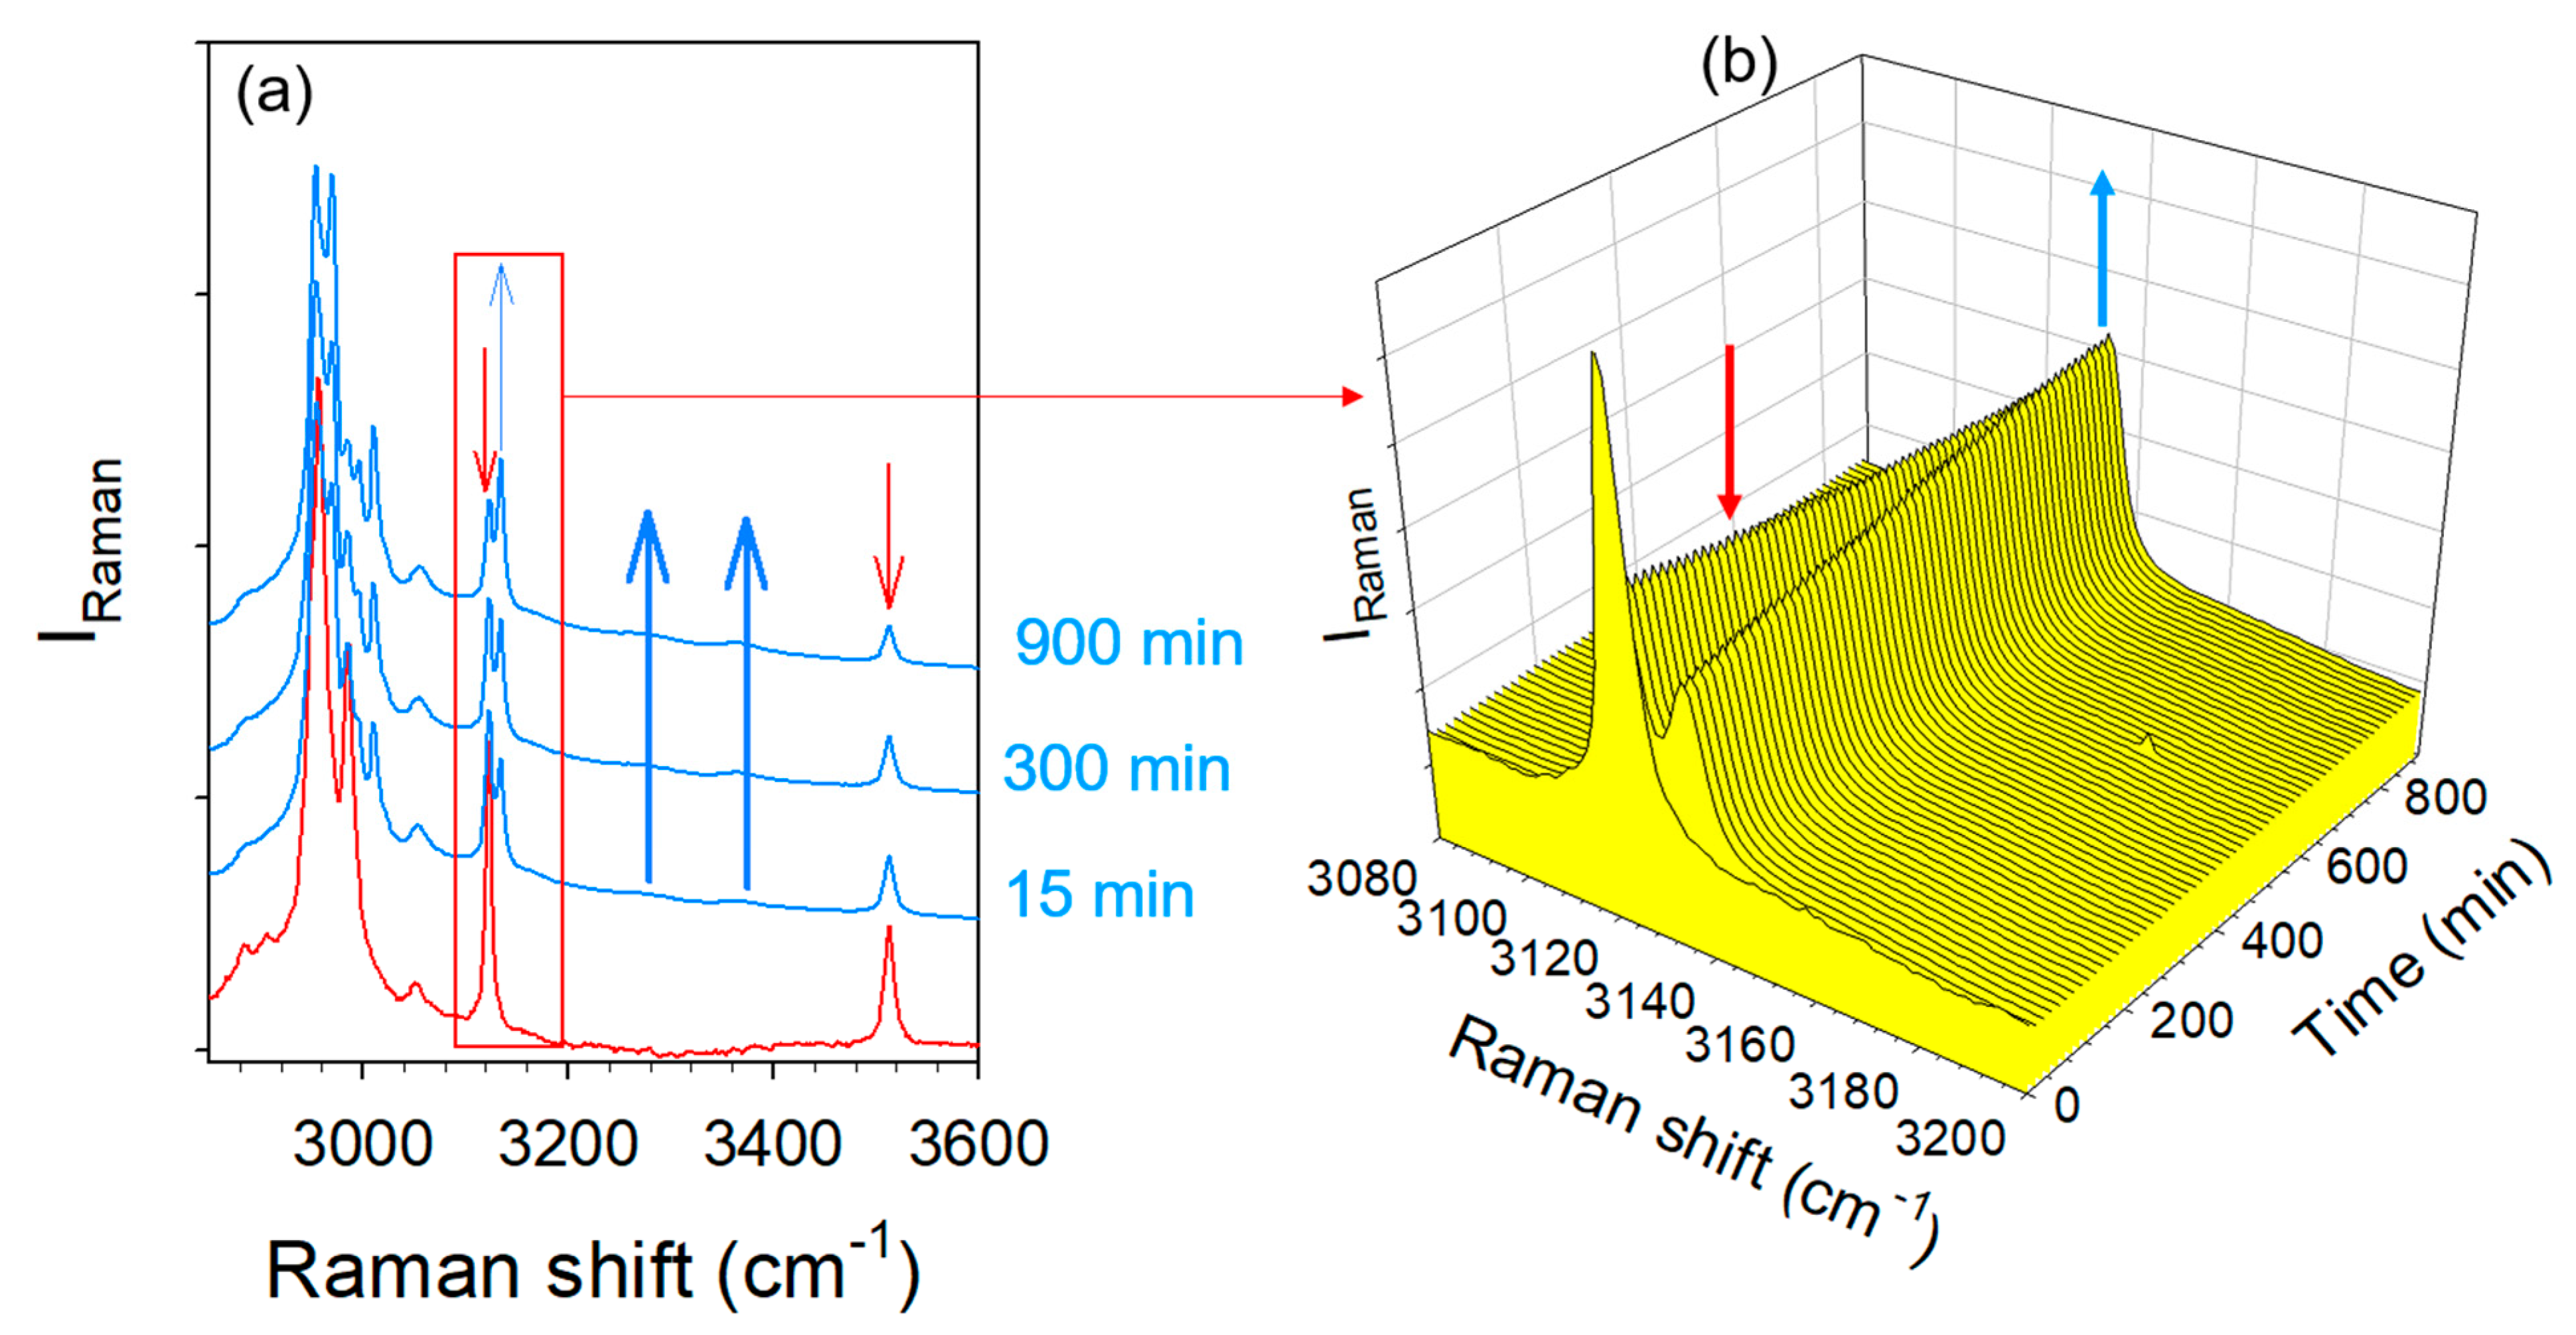
2.3.2. Co-Milling at Room Temperature for 60 min
2.4. Hydration Stability
3. Discussion
4. Material and Methods
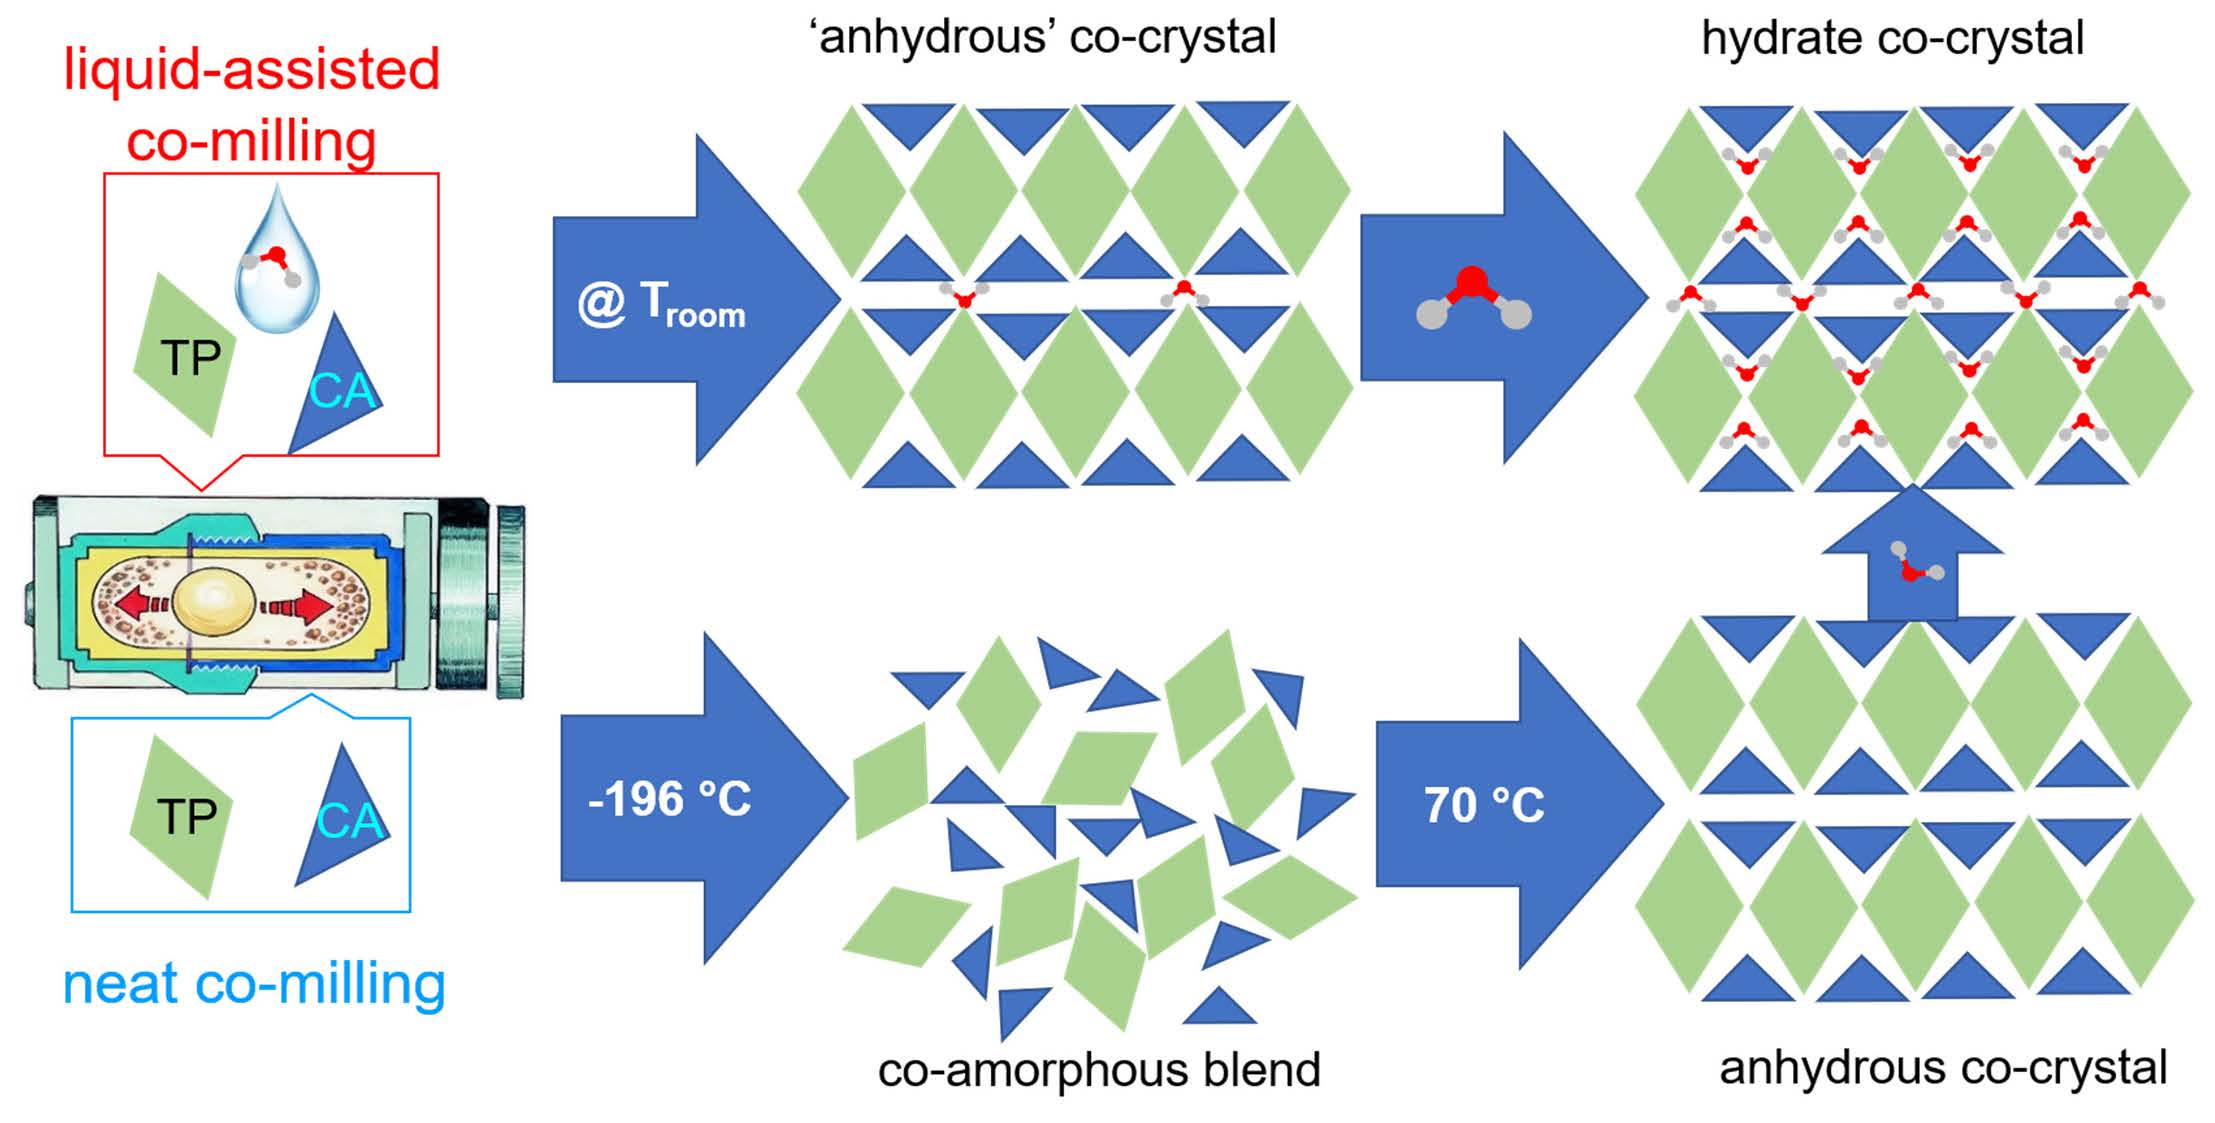
4.1. Materials
4.2. Methods
4.2.1. Co-Milling
4.2.2. Raman Spectroscopy
5. Conclusions
Supplementary Materials
Author Contributions
Funding
Institutional Review Board Statement
Informed Consent Statement
Data Availability Statement
Conflicts of Interest
Sample Availability
References
- Byrn, S.R.; Pfeiffer, R.; Stephenson, G.; Grant, D.J.R.; Gleason, W.B. Solid-State Pharmaceutical Chemistry. Chem. Mater. 1994, 6, 1148–1158. [Google Scholar] [CrossRef]
- Brittain, H.G.; Grant, D.J.R.; Myrdal, P.B. Effects of polymorphism and solid-state solvation on solubility and dissolution rate. In Polymorphism in Pharmaceutical Solids: Second Edition; Press, C., Ed.; Routledge: Boca Raton, FL, USA, 2016. [Google Scholar]
- Kalepu, S.; Nekanti, V. Insoluble drug delivery strategies: Review of recent advances and buisness prospects. Acta Pharm. Sin. B 2015, 5, 442–453. [Google Scholar] [CrossRef] [PubMed]
- Friscic, T.; Jones, W. Benefits of cocrystallisation in pharmaceuticals. J. Pharm. Pharmacol. 2010, 62, 1547–1559. [Google Scholar] [PubMed]
- Vishweshwar, P.; McMahon, J.; Bis, J.; Zaworotko, M. Pharmaceutical Co-Crystals. J. Pharm. Sci. 2005, 95, 499–516. [Google Scholar] [CrossRef]
- Desiraju, G. Supramolecular synthons in crystal engineering-A new organic synthesis Angew. Chem. Int. Ed. Engl. 1995, 34, 2311–2327. [Google Scholar] [CrossRef]
- Corey, E.J. General Methods For The Construction Of Complex Molecules. Pure Appl. Chem. 1967, 14, 19–38. [Google Scholar] [CrossRef]
- Smit, J.P.; Hagen, E.J. Polymorphism in Caffeine Citric Acid Cocrystals. J. Chem. Crystallogr. 2015, 45, 128–133. [Google Scholar] [CrossRef]
- Karki, S.; Friscic, T.; Jones, W.; Motherwell, W.D.S. Screening for pharmaceutical cocrystal hydrates via neat and liquid-assisted grinding. Mol. Pharm. 2007, 4, 347–354. [Google Scholar] [CrossRef]
- Bernstein, J. Polymorphism of Pharmaceuticals. In Polymorphism in Molecular Crystals; Crystallography, O., Ed.; Oxford University Press: New York, NY, USA, 2002. [Google Scholar]
- Karimi-Jafari, M.; Padrela, L.; Walker, G.M.; Croker, D.M. Creating Cocrystals: A Review of Pharmaceutical Cocrystal Preparation Routes and Applications. Cryst. Growth Des. 2018, 18, 6370–6387. [Google Scholar] [CrossRef]
- Sreekanth, B.R.; Vishweshwar, P.; Vyas, K. Supramolecular synthon polymorphism in 2: 1 co-crystal of 4-hydroxybenzoic acid and 2,3,5,6-tetramethylpyrazine. Chem. Commun. 2007, 23, 2375–2377. [Google Scholar] [CrossRef]
- Shan, N.; Toda, F.; Jones, W. Mechanochemistry and co-crystal formation: Effect of solvent on reaction kinetics. Chem. Commun. 2002, 20, 2372–2373. [Google Scholar] [CrossRef]
- Trask, A.V.; Shan, N.; Motherwell, W.D.S.; Jones, W.; Feng, S.; Tan, R.B.H.; Carpenter, K.J. Selective polymorph transformation via solvent-drop grinding. Chem. Commun. 2005, 7, 880–882. [Google Scholar] [CrossRef] [PubMed]
- Guerain, M.; Guinet, Y.; Correia, N.; Paccou, L.; Danede, F.; Hédoux, A. Polymorphism and stability of ibuprofen/nicotinamide cocrystal: The effect of the crystalline synthesis method. Int. J. Pharm. 2020, 584, 119454–119463. [Google Scholar] [CrossRef] [PubMed]
- Atipamula, S.; Chow, P.S.; Tan, R.B.H. Polymorphism in cocrystals: A review and assessment of its significance. Cryst. Eng. Comm. 2014, 16, 3451–3465. [Google Scholar] [CrossRef]
- Hasa, D.; Marosa, M.; Bucar, D.-K.; Corpinot, M.K.; Amin, D.; Patel, B.; Jones, W. Mechanochemical formation and “disappearance” of caffeine-citri-acid cocrystal polymorphs. Cryst. Eng. Comm. 2020, 20, 1119–1129. [Google Scholar]
- Airaksinen, S.; Karjalainen, M.; Rasanen, E.; Rantanen, J.; Yliruusi, J. Comparisonof the effects of two drying methods on polymorphism of theophylline. Int. J. Pharm. 2004, 276, 129–141. [Google Scholar] [CrossRef]
- Phadnis, N.V.; Suryanarayanan, R. Polymorphism in anhydroustheophylline–Implications on the dissolution rate of theophylline tablets. J. Pharm. Sci. 1997, 86, 1256–1263. [Google Scholar] [CrossRef]
- Trask, A.; Motherwell, W.D.S.; Jones, W. Physical stability enhancement of theophylline via cocrystallization. Int. J. Pharm. 2006, 320, 114–123. [Google Scholar] [CrossRef]
- Wang, Y.; Xue, J.; Wang, Q.; Jin, S.; Zhang, Z.; Hong, Z.; Du, Y. Structural investigation of a 2:1 co-crystal between diflunisal and isonicotinamide based on terahertz and Raman spectroscopy. Spectrochim. Acta Part A 2019, 216, 98–104. [Google Scholar] [CrossRef]
- Amado, A.; Nolasco, M.; Ribeiro-Claro, P. Probing Pseudopolymorphic Transitions in Pharmaceutical Solids using Raman Spectroscopy: Hydration and Dehydration of Theophylline. J. Pharm. Sci. 2007, 96, 1366–1379. [Google Scholar] [CrossRef]
- Bichara, L.C.; Lanus, H.E.; Ferrer, E.G.; Gramajo, M.B.; Brandan, S.A. Vibrational study and force field of citric acid dimer based on the SQM Methodology. Adv. Phys. Chem. 2011, 2011, 347072. [Google Scholar] [CrossRef]
- Pimentel, G.; McClellan, A. The Hydrogen Bond; W.H. Freeman and Company: San Francisco, CA, USA, 1960. [Google Scholar]
- Nekoei, A.R.; Vatanprast, M. π-Hydrogen bonding and armacity: A systematic interplay study. Phys. Chem. Chem. Phys. 2019, 21, 623–630. [Google Scholar] [CrossRef] [PubMed]
- Fujii, A.; Ebata, T.; Mikami, N. An infrared study of π-Hydrogen bonds in micro-solvated phenol: OH stretching vibrationsof phenol-X (X=C6H6, C2H4, and C2H2) clusters in the neutral and cationic ground states. J. Phys. Chem. A 2002, 106, 8554–8560. [Google Scholar] [CrossRef]
- Nolasco, M.M.; Amado, A.M.; Ribeiro-Claro, P.J.A. Comptationally-assisted approach to the vibrational spectra of molecular crystals: Study of hydrogen-bonding and pseudo-polymorphism. Chem. Phys. Chem. 2006, 7, 2150–2161. [Google Scholar] [CrossRef]
- Malfait, B.; Paccou, L.; Derollez, P.; Guinet, Y.; Hedoux, A. Capabilities of low-wavenumber Raman spectroscopy for analyzing the mechanism of devitrification of molecular glasses. J. Raman Spectr. 2019, 50, 1027–1033. [Google Scholar] [CrossRef]
- Latreche, M.; Willart, J.F.; Paccou, L.; Guinet, Y.; Hédoux, A. Polymorphism versus devitrification mechanism: Low-wavenumber Raman investigations in sulindac. Int. J. Pharm. 2019, 567, 118476. [Google Scholar] [CrossRef]
- Larkin, P.J.; Dabros, M.; Sarsfield, B.; Chan, E.; Carriere, J.; Smith, B.C. Polymorph characterization of active pharmaceutical ingredients (APIs) using low-frequency Raman spectroscopy. Appl. Spectr. 2014, 68, 758–776. [Google Scholar] [CrossRef]
- Hédoux, A. Recent developments in the Raman and infrared investigations of amorphous pharmaceuticals and protein formulations: A review. Adv. Drug Deliv. Rev. 2016, 100, 133–146. [Google Scholar] [CrossRef]
- Berzins, K.; Fraser-Miller, S.J.; Gordon, K.C. Recent advances in low-frequency Raman spectroscopy for pharmaceutical applications. Int. J. Pharm. 2021, 592, 120034. [Google Scholar] [CrossRef]
- Hédoux, A.; Guinet, Y.; Descamps, M. The contribution of Raman spectroscopy to the analysis of phase transformations in pharmaceutical compounds. Int. J. Pharm. 2011, 417, 17–31. [Google Scholar] [CrossRef]
- Hedoux, A.; Derollez, P.; Guinet, Y.; Dianoux, A.J.; Descamps, M. Low-frequency vibrational excitations in the amorphous and crystalline states of triphenyl phosphite: A neutron and Raman scattering investigation. Phys. Rev. B 2001, 63, 144202. [Google Scholar] [CrossRef]


Disclaimer/Publisher’s Note: The statements, opinions and data contained in all publications are solely those of the individual author(s) and contributor(s) and not of MDPI and/or the editor(s). MDPI and/or the editor(s) disclaim responsibility for any injury to people or property resulting from any ideas, methods, instructions or products referred to in the content. |
© 2023 by the authors. Licensee MDPI, Basel, Switzerland. This article is an open access article distributed under the terms and conditions of the Creative Commons Attribution (CC BY) license (https://creativecommons.org/licenses/by/4.0/).
Share and Cite
Guinet, Y.; Paccou, L.; Hédoux, A. Analysis of Co-Crystallization Mechanism of Theophylline and Citric Acid from Raman Investigations in Pseudo Polymorphic Forms Obtained by Different Synthesis Methods. Molecules 2023, 28, 1605. https://doi.org/10.3390/molecules28041605
Guinet Y, Paccou L, Hédoux A. Analysis of Co-Crystallization Mechanism of Theophylline and Citric Acid from Raman Investigations in Pseudo Polymorphic Forms Obtained by Different Synthesis Methods. Molecules. 2023; 28(4):1605. https://doi.org/10.3390/molecules28041605
Chicago/Turabian StyleGuinet, Yannick, Laurent Paccou, and Alain Hédoux. 2023. "Analysis of Co-Crystallization Mechanism of Theophylline and Citric Acid from Raman Investigations in Pseudo Polymorphic Forms Obtained by Different Synthesis Methods" Molecules 28, no. 4: 1605. https://doi.org/10.3390/molecules28041605