


Study on the Comprehensive Phytochemicals and the Anti-Ulcerative Colitis Effect of Saussurea pulchella
 ,
,
Abstract
:
1. Introduction
2. Results
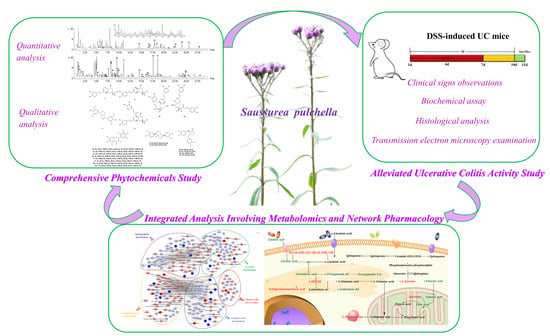
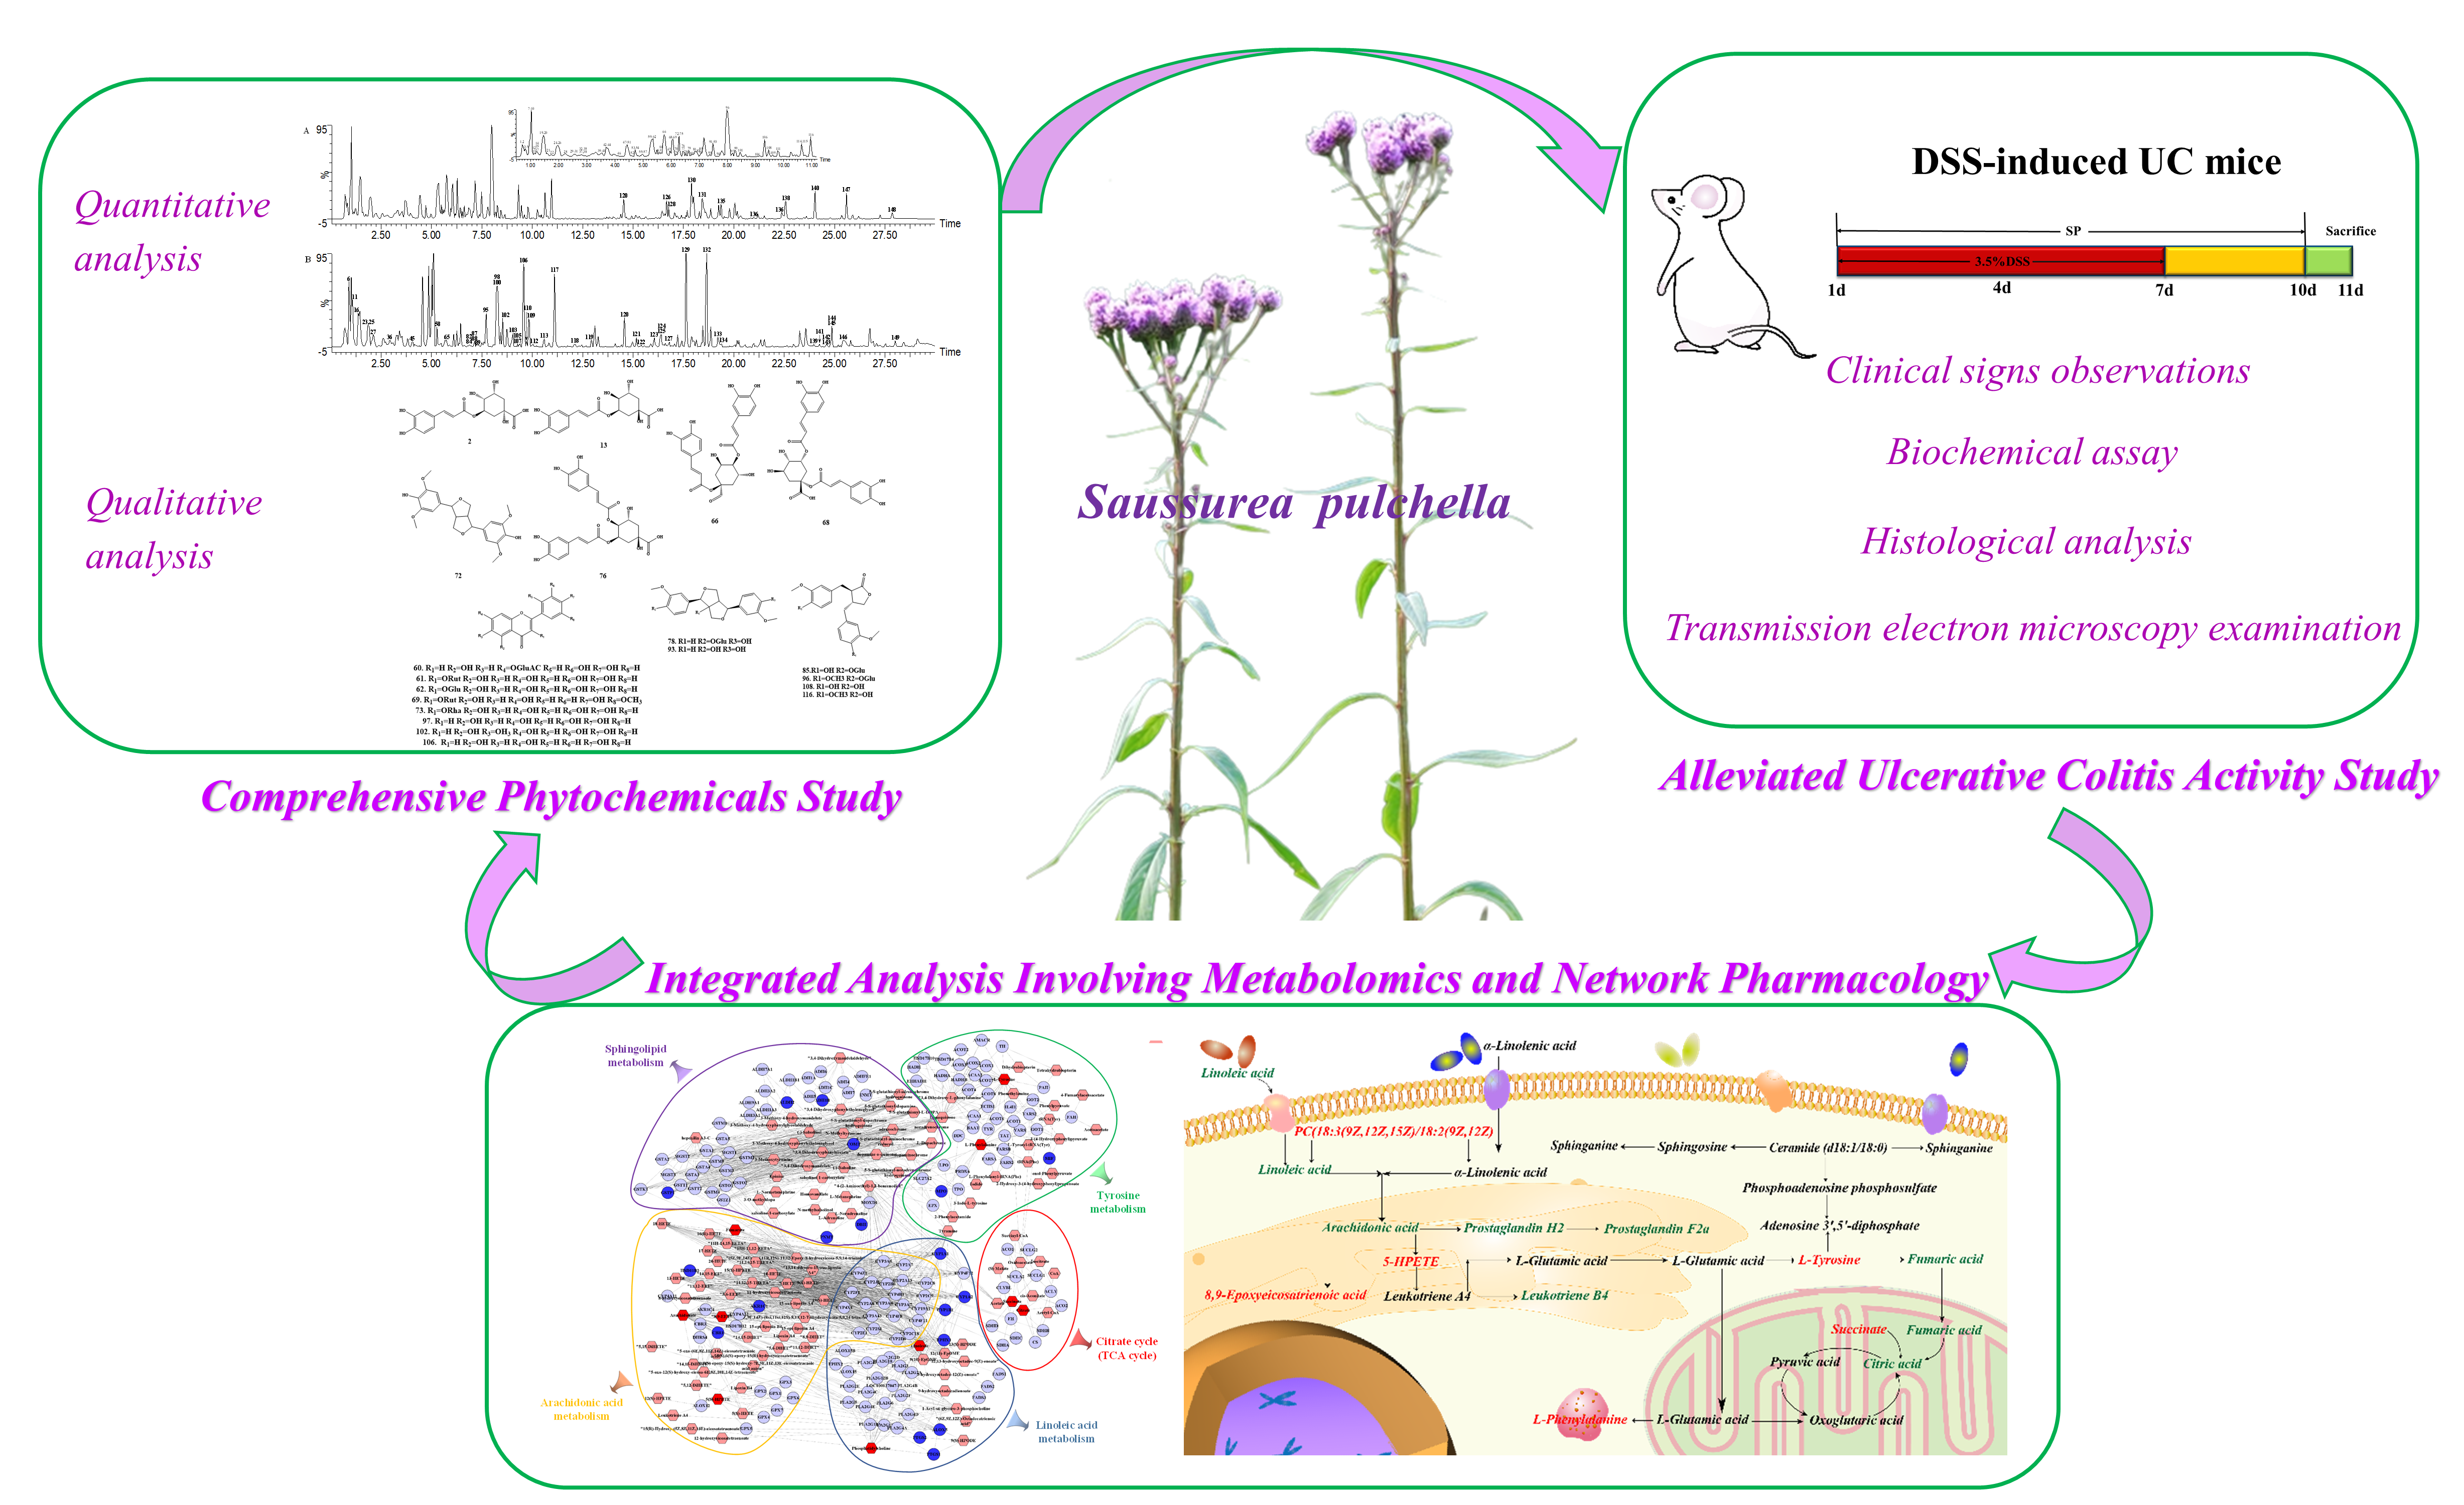
2.1. Comprehensive Phytochemical Analysis
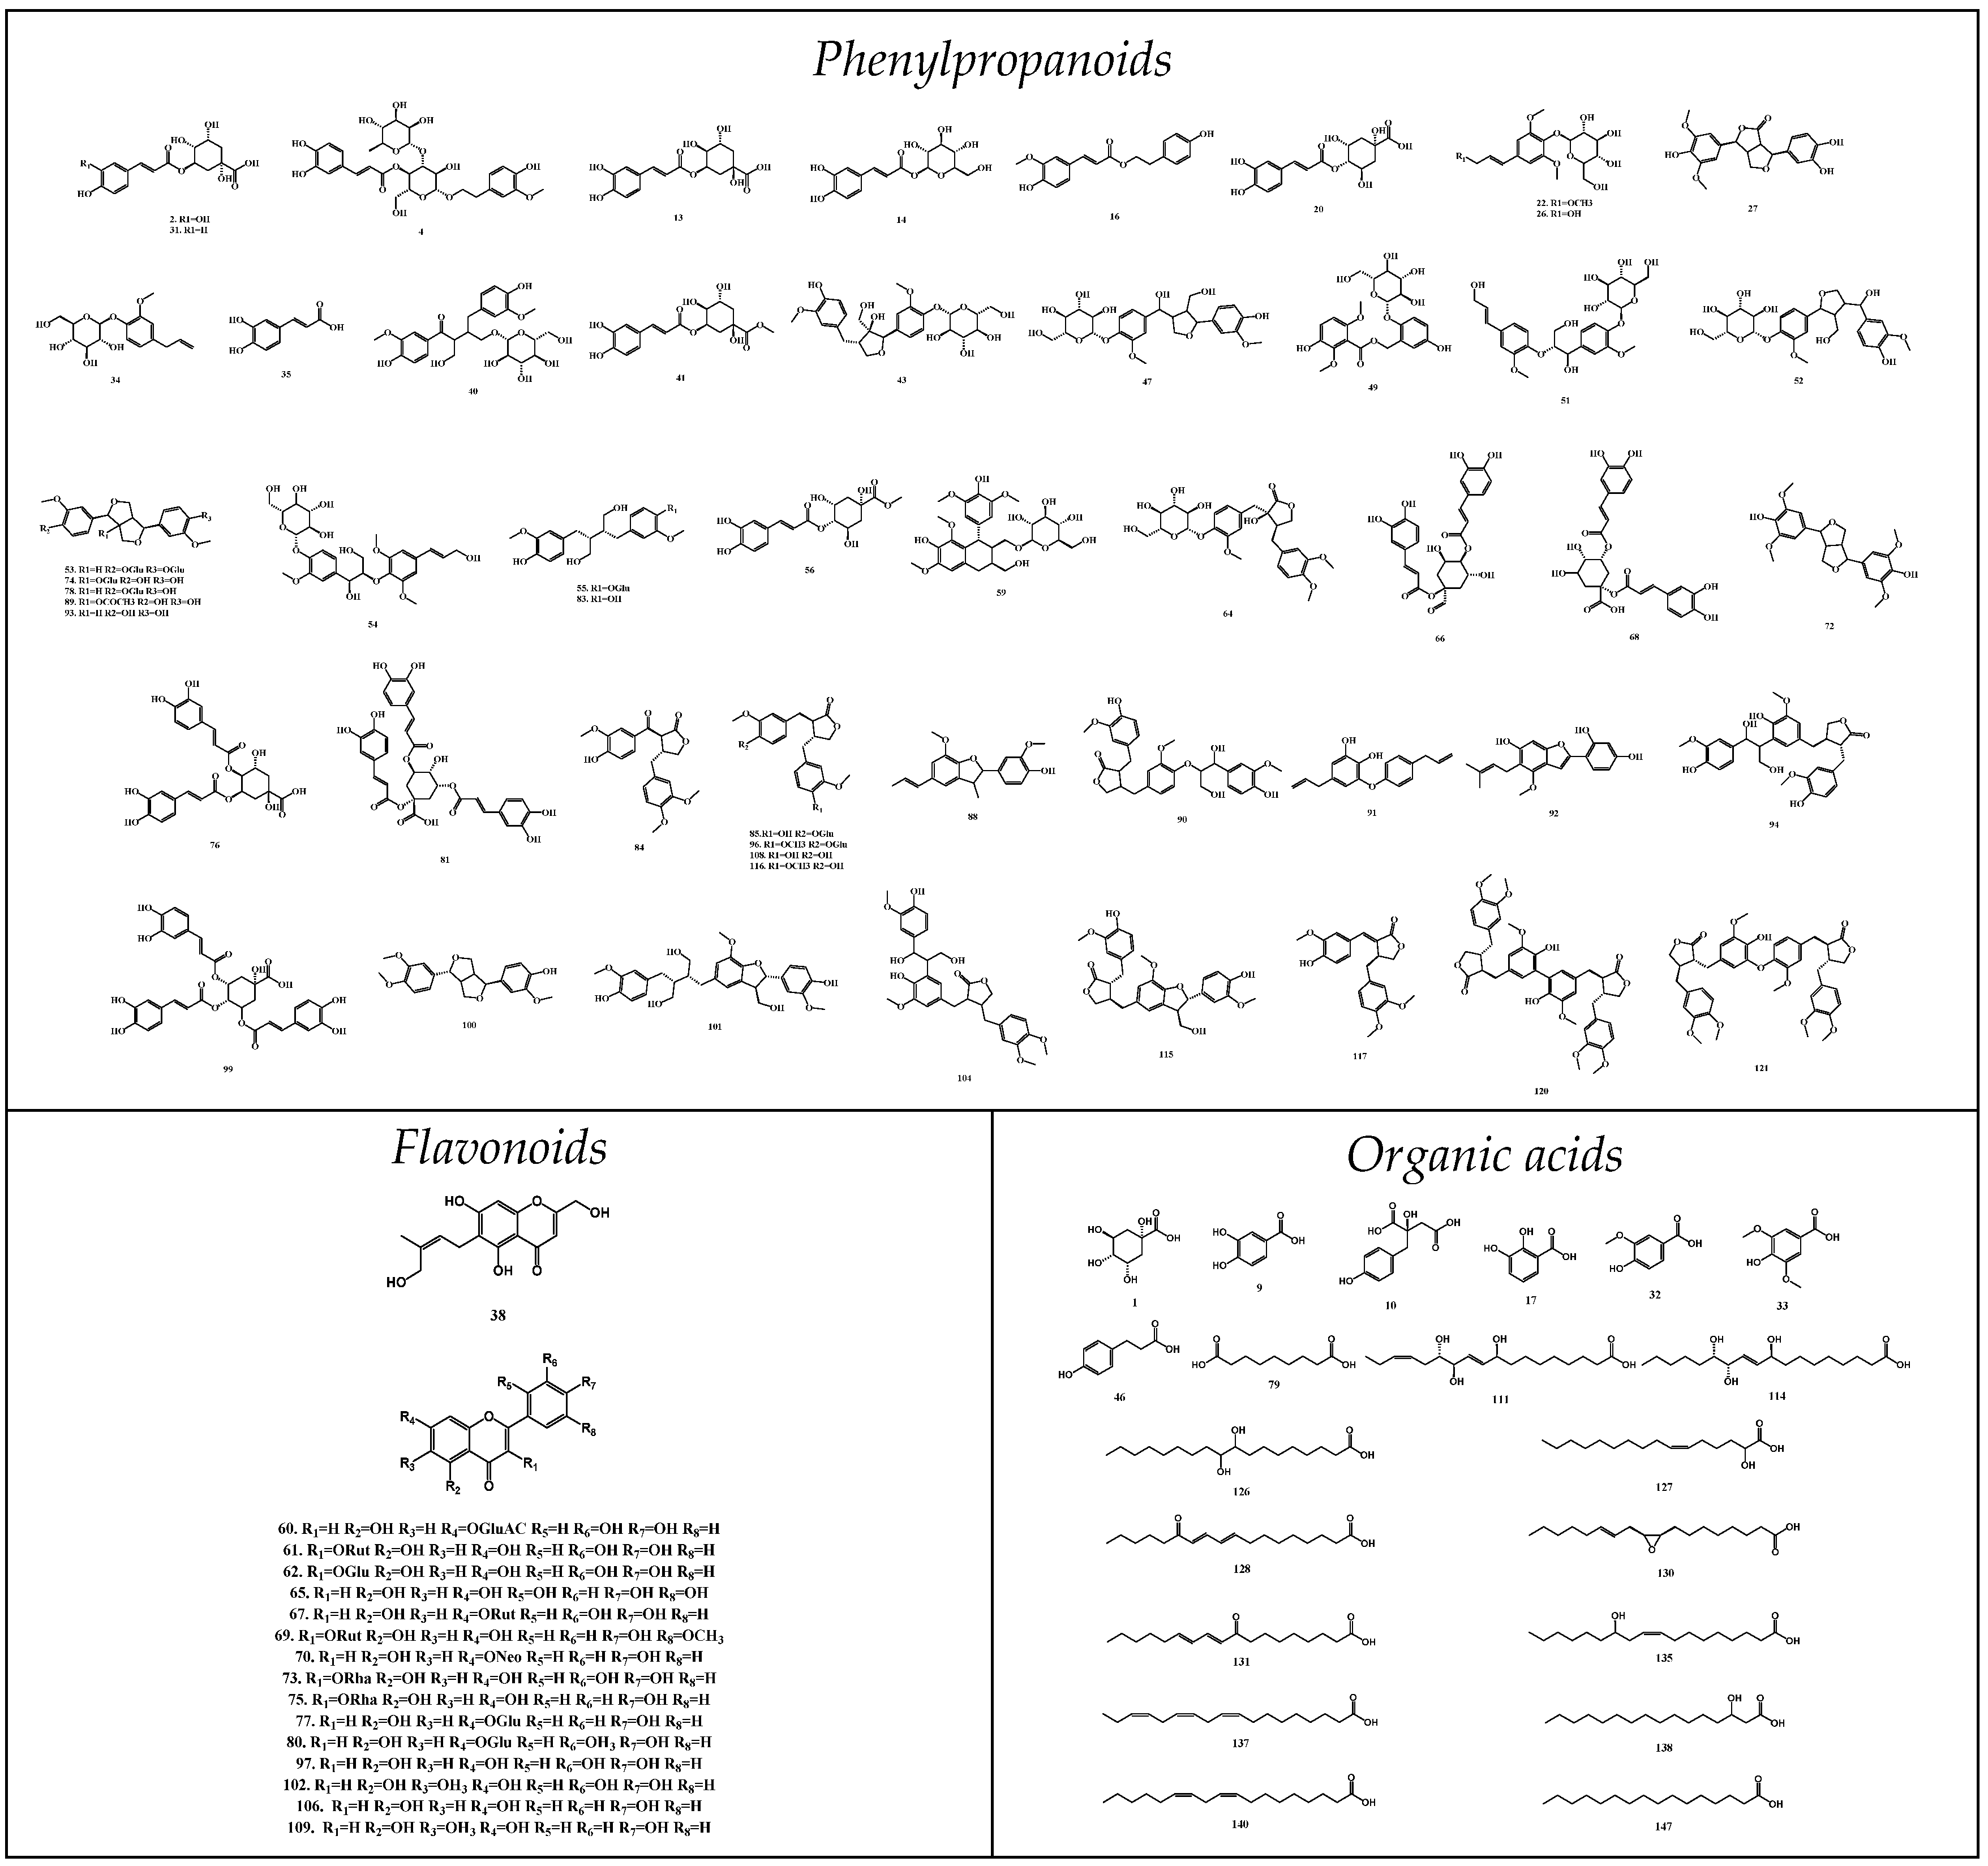
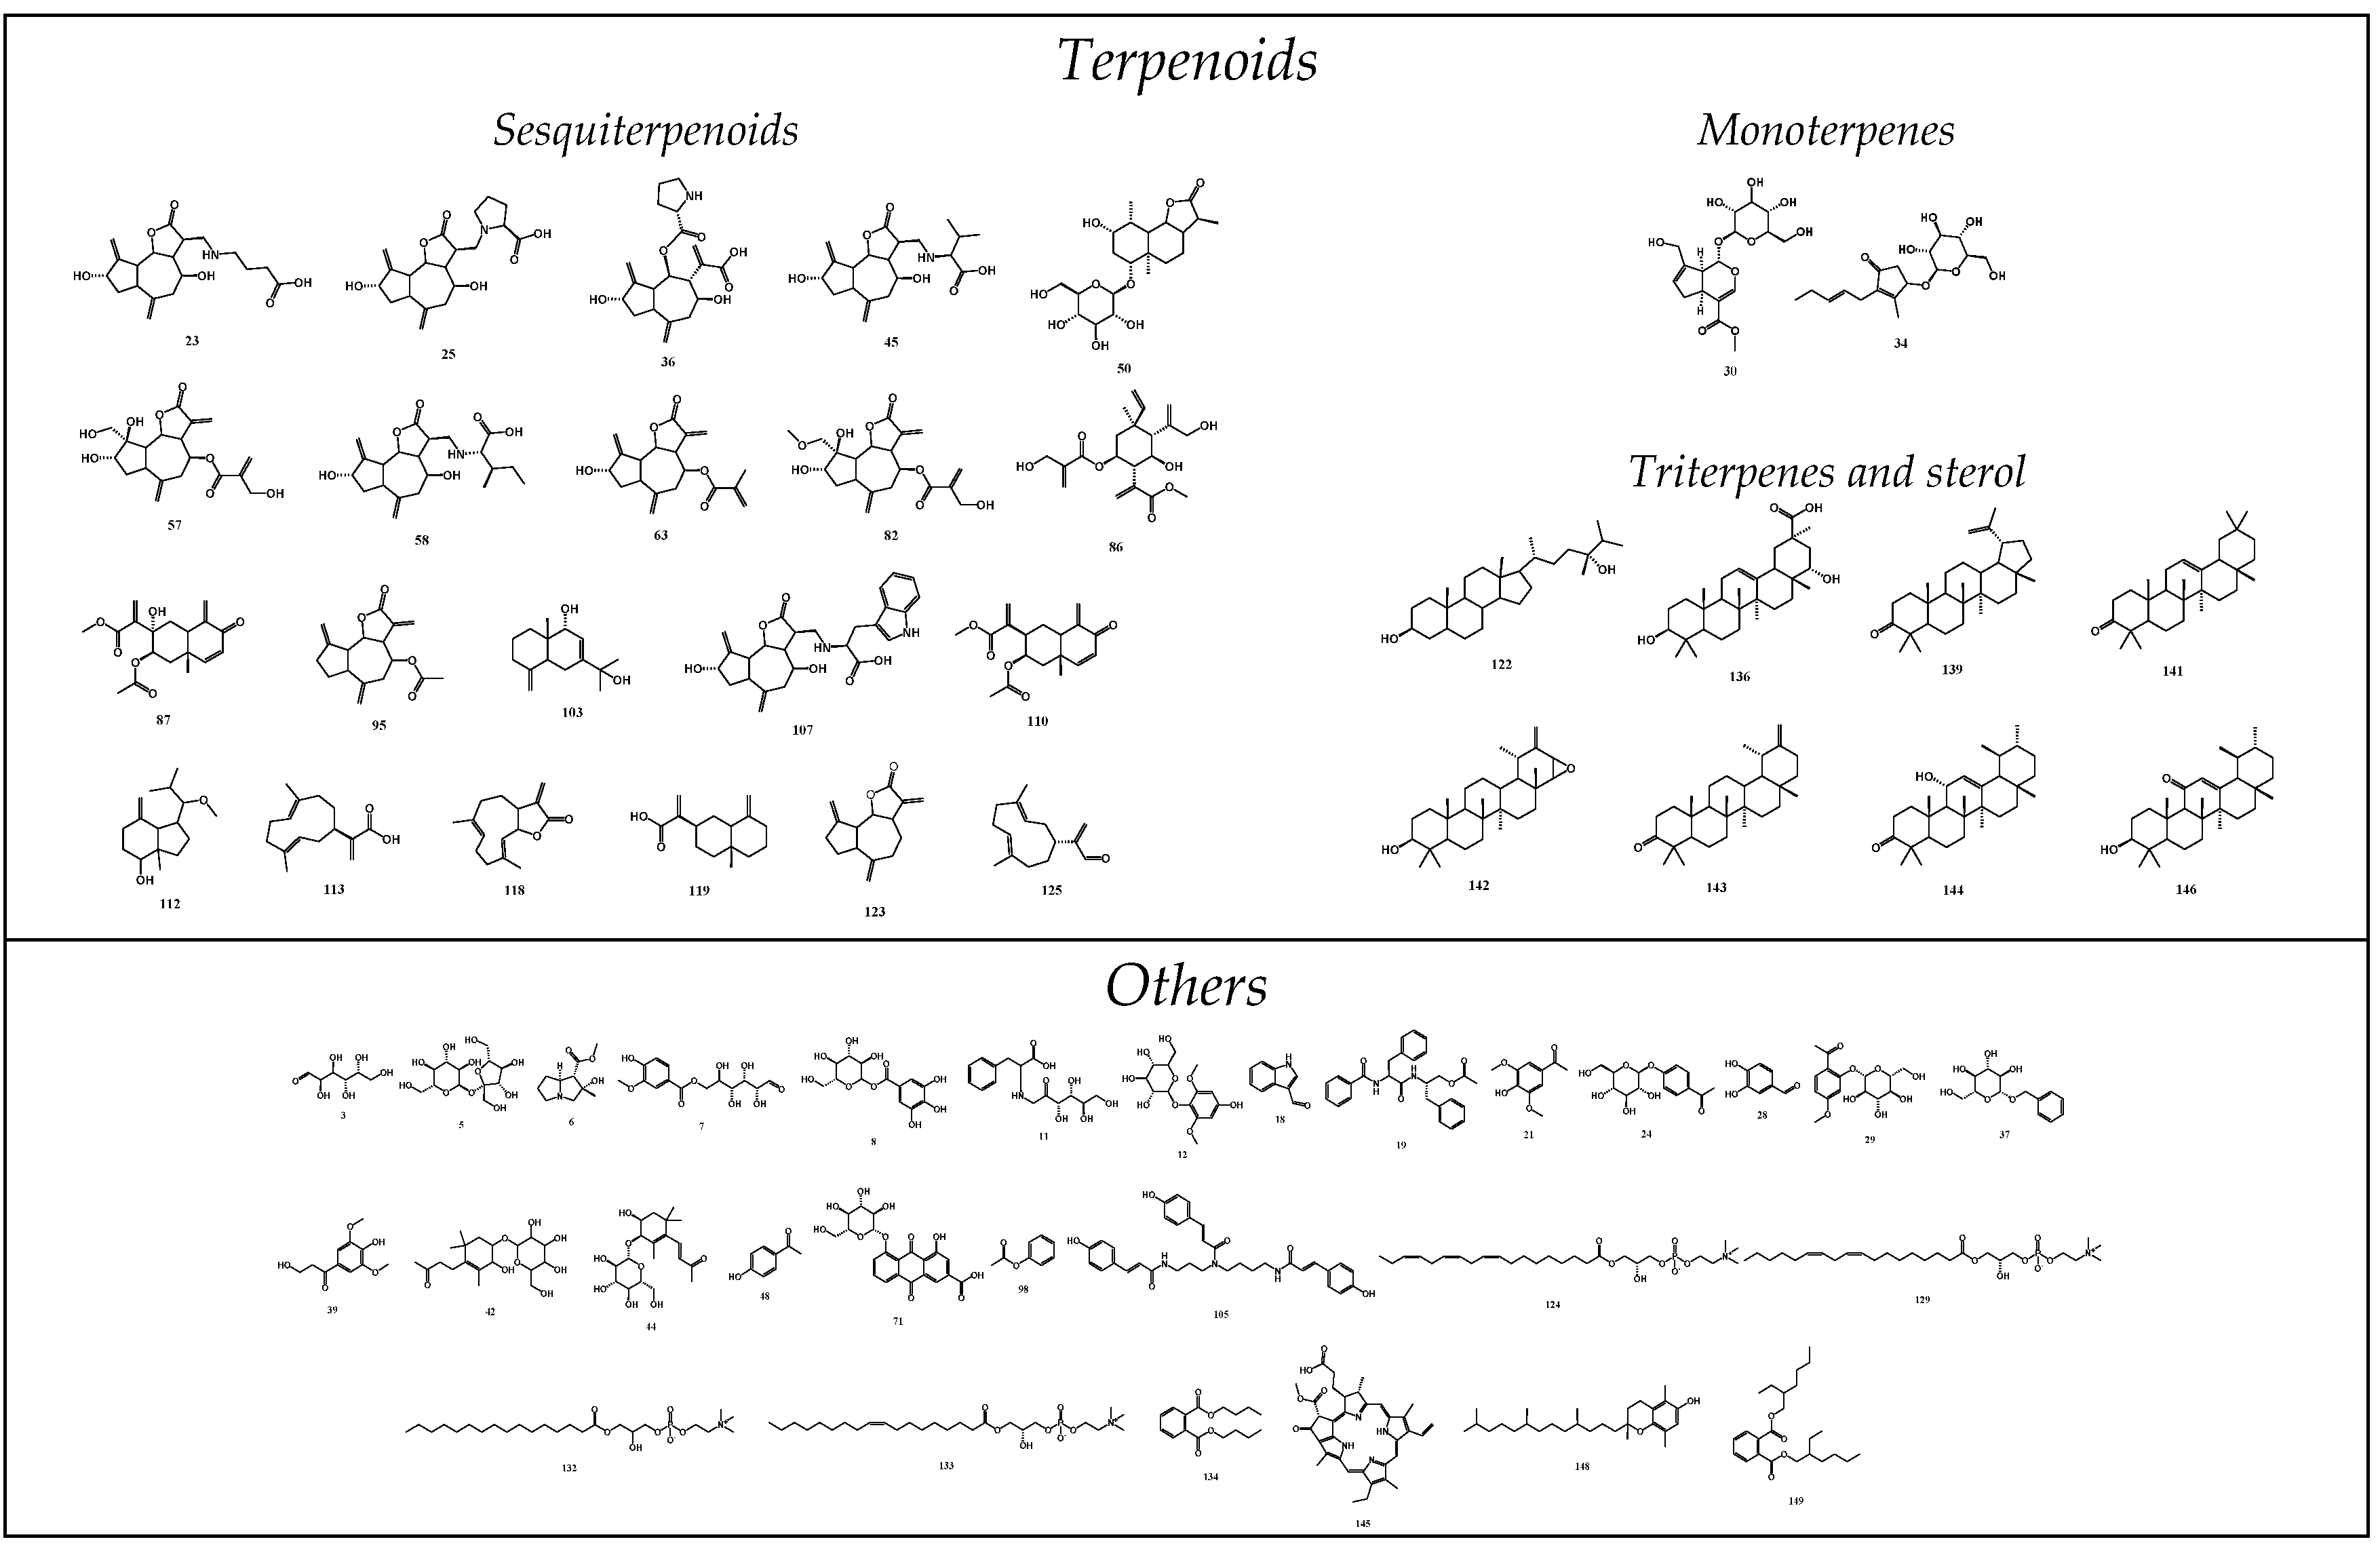
2.1.1. Qualitative Analysis
2.1.2. Quantitative Analysis
2.2. Alleviated Ulcerative Colitis Activity
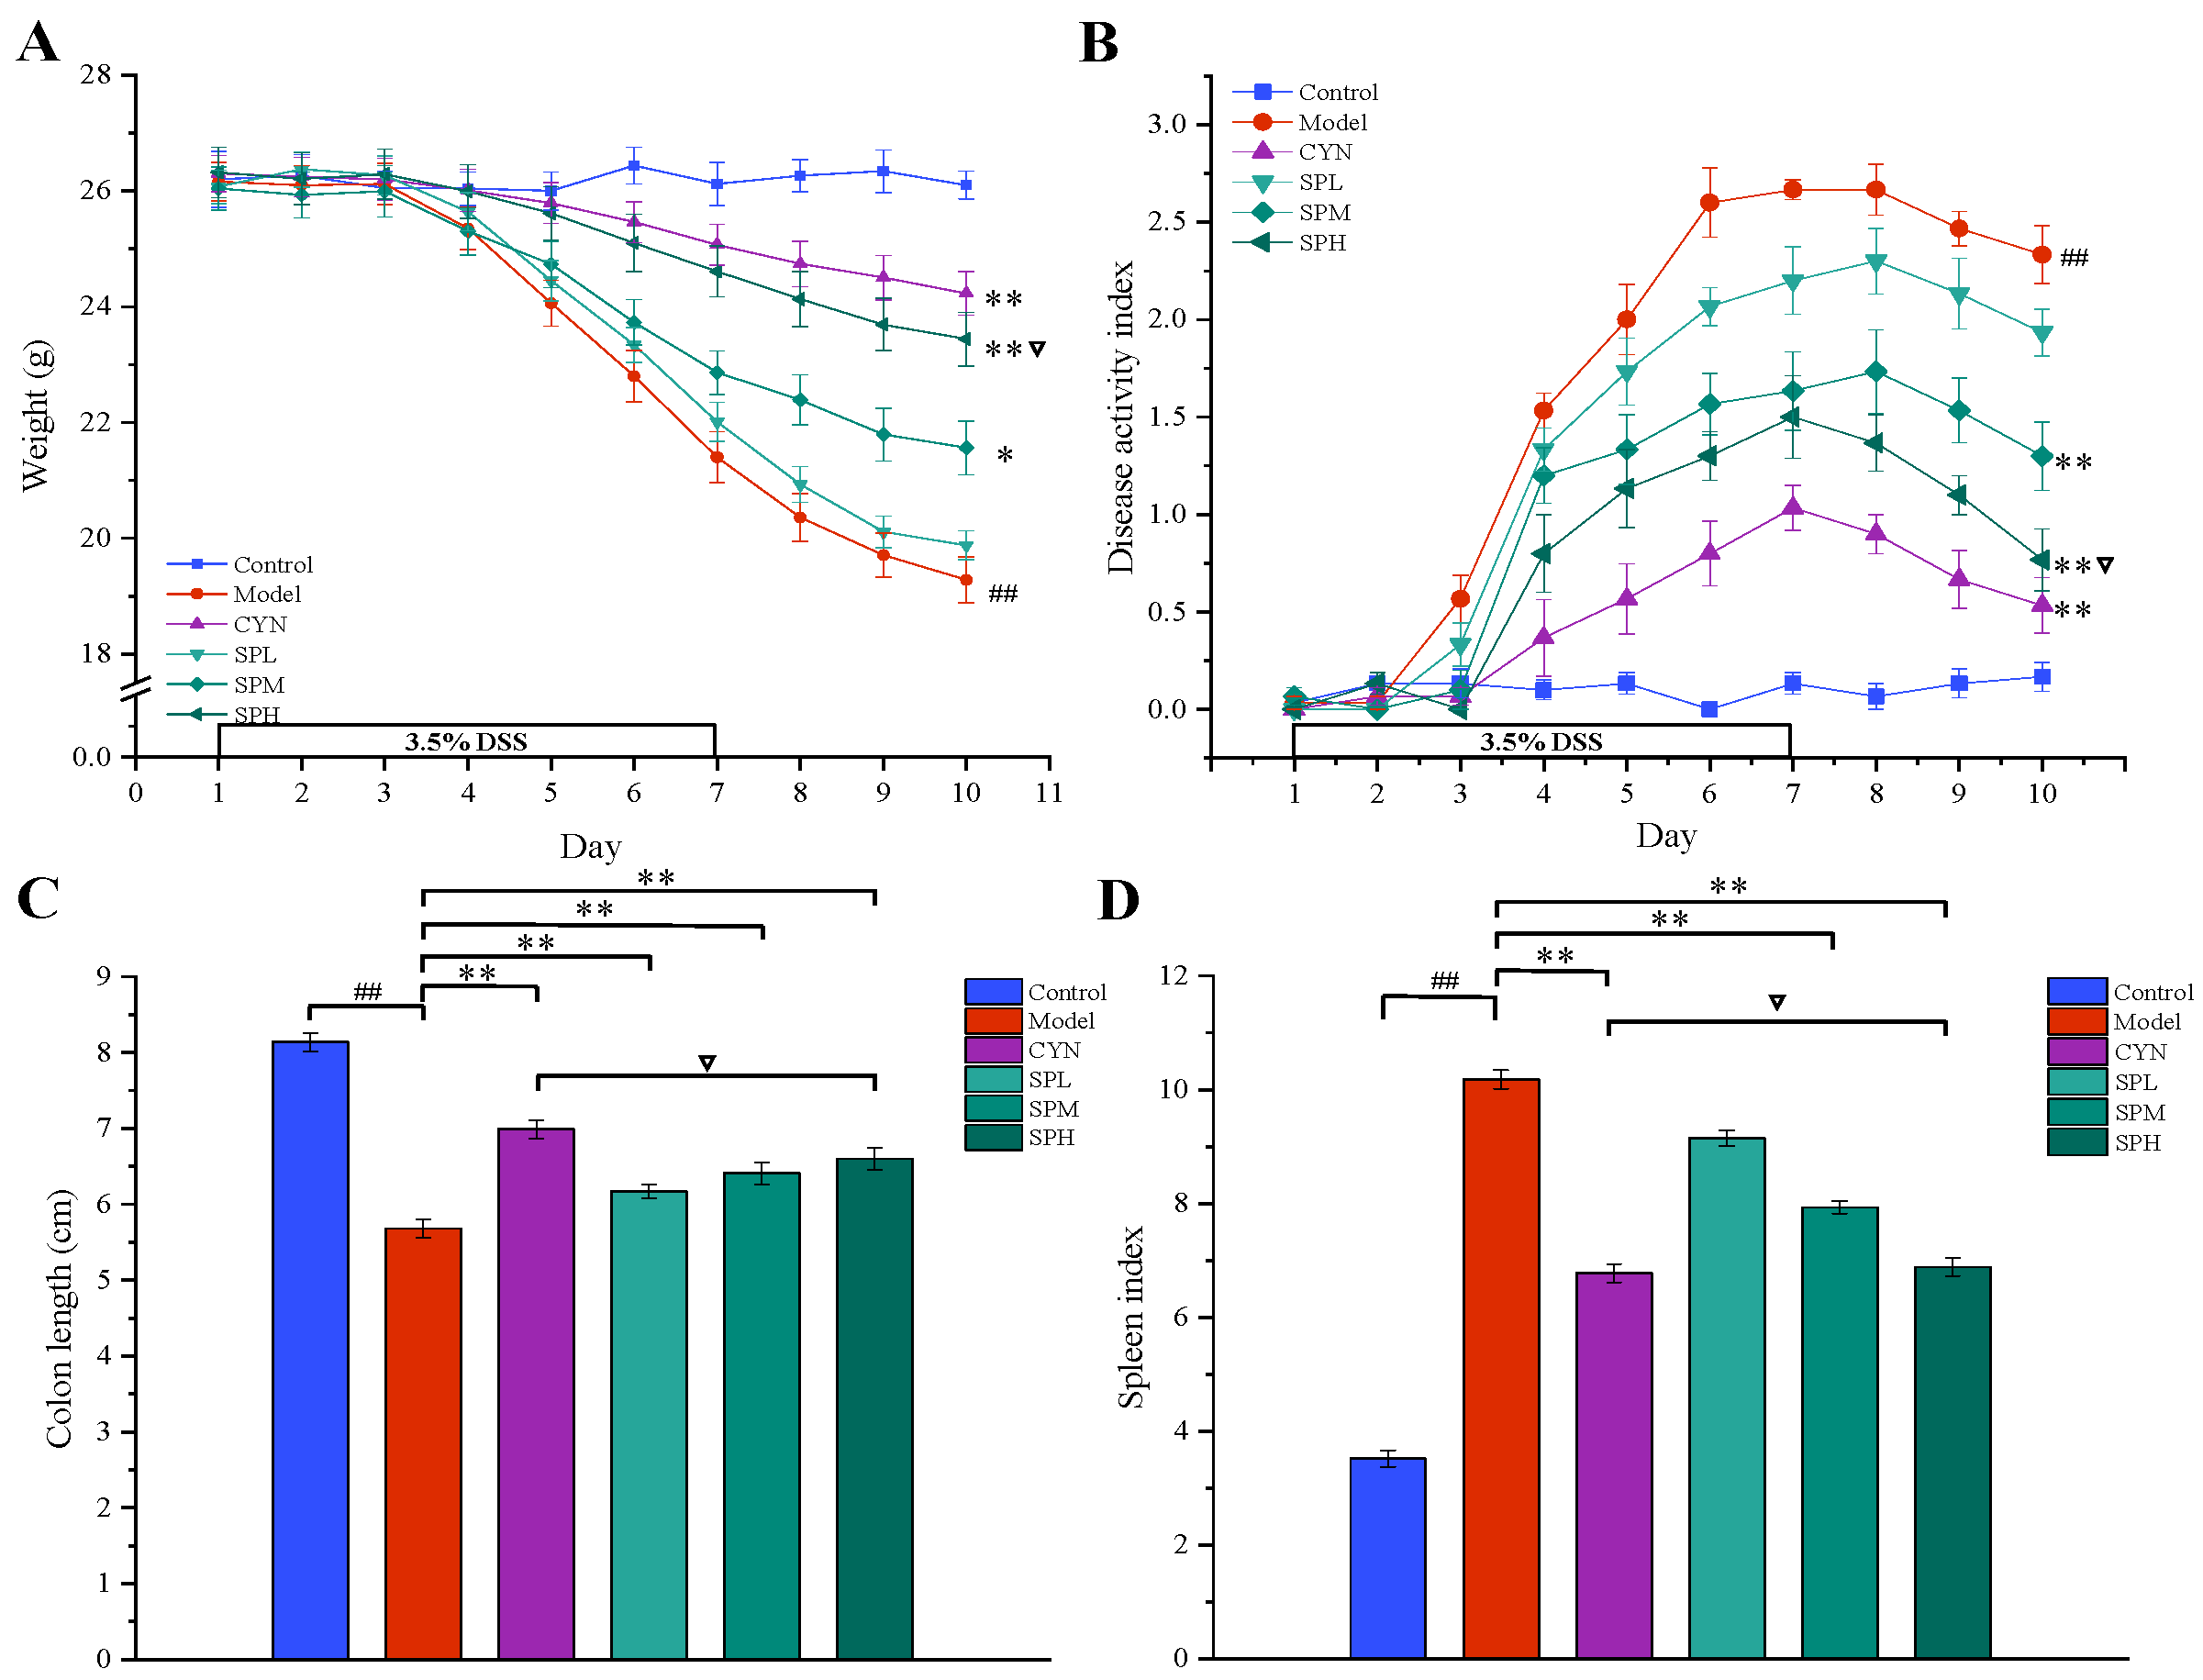
2.2.1. Body Weights, Clinical Signs Observations and DAI
2.2.2. Colon Length and Spleen Coefficient
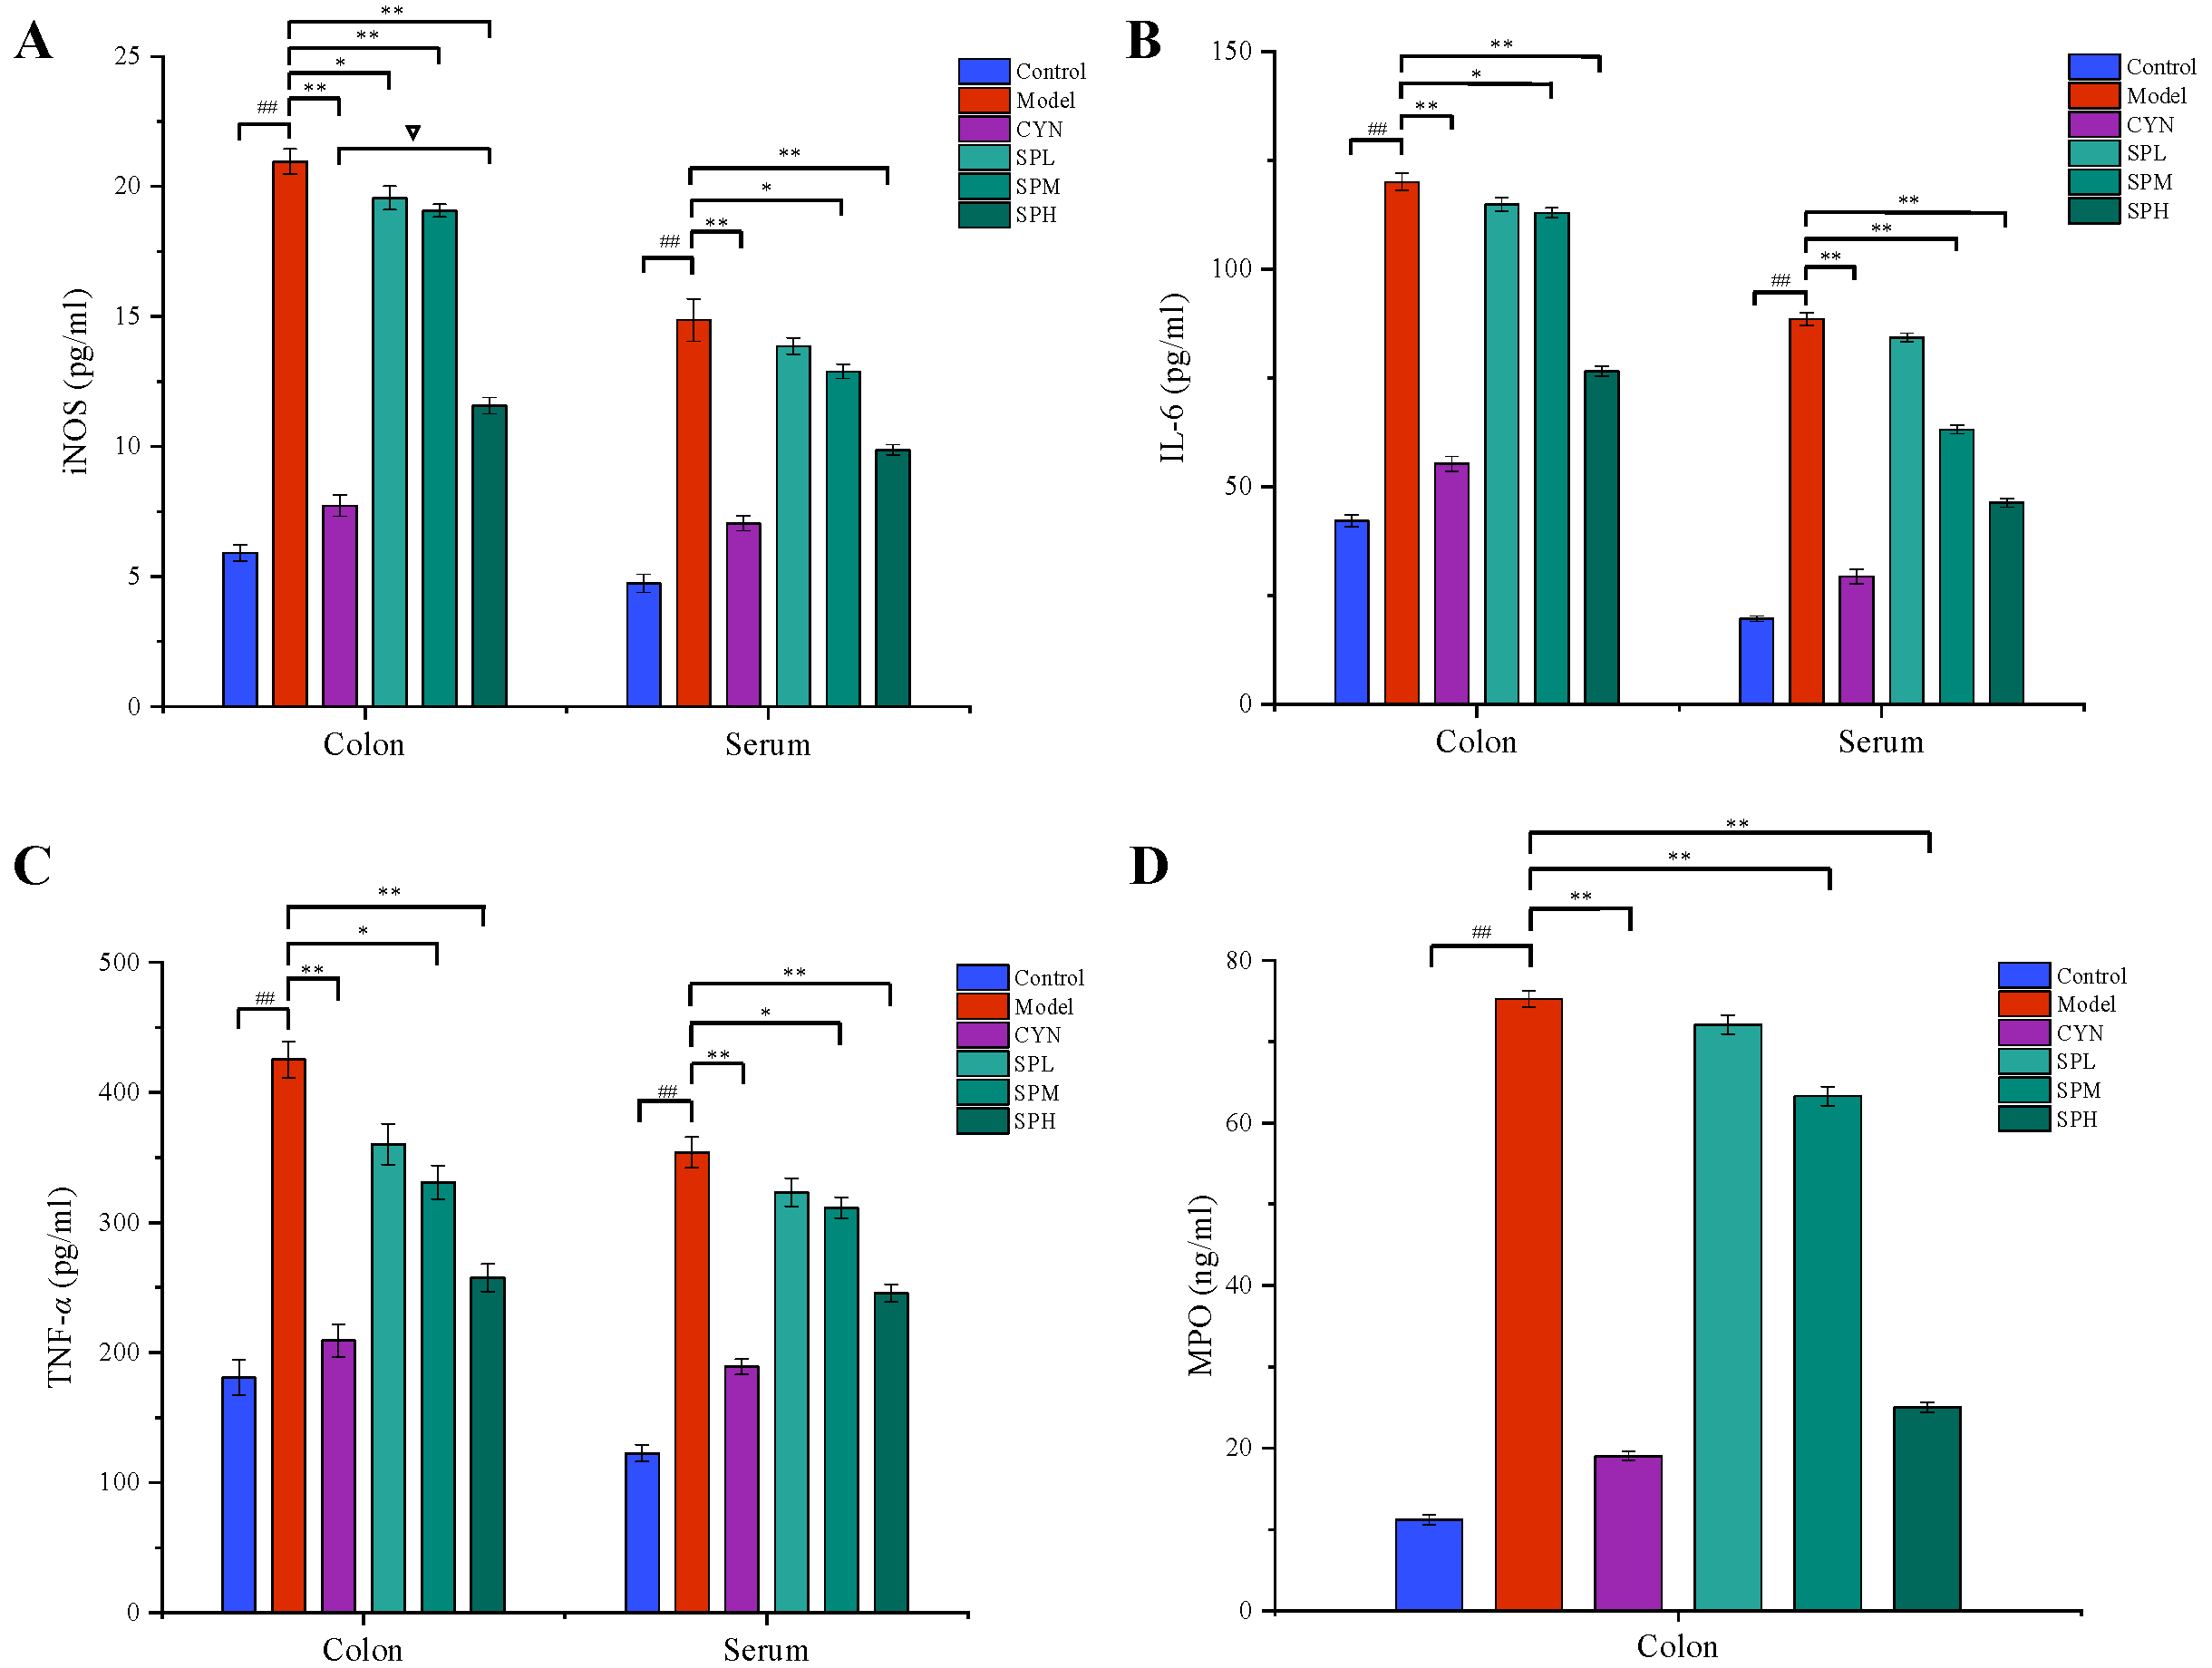
2.2.3. Measurement of Cytokines and MPO Contents
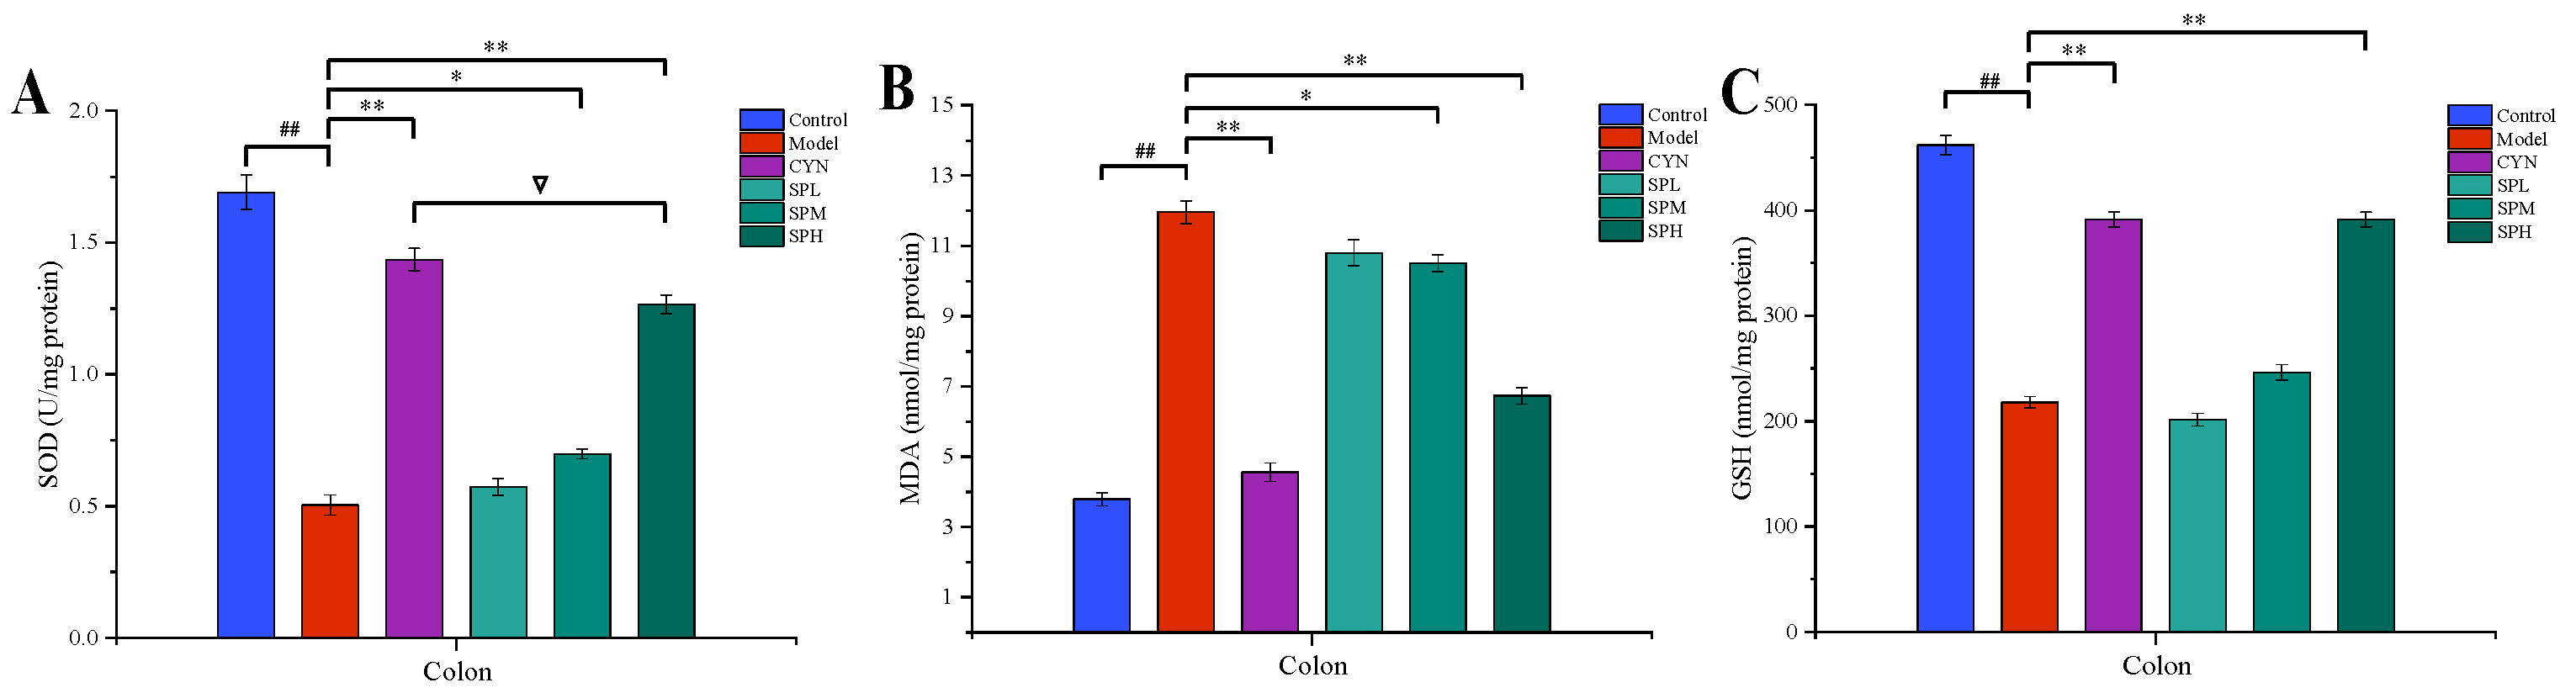
2.2.4. Measurement of Oxidative Stress Indexes Levels
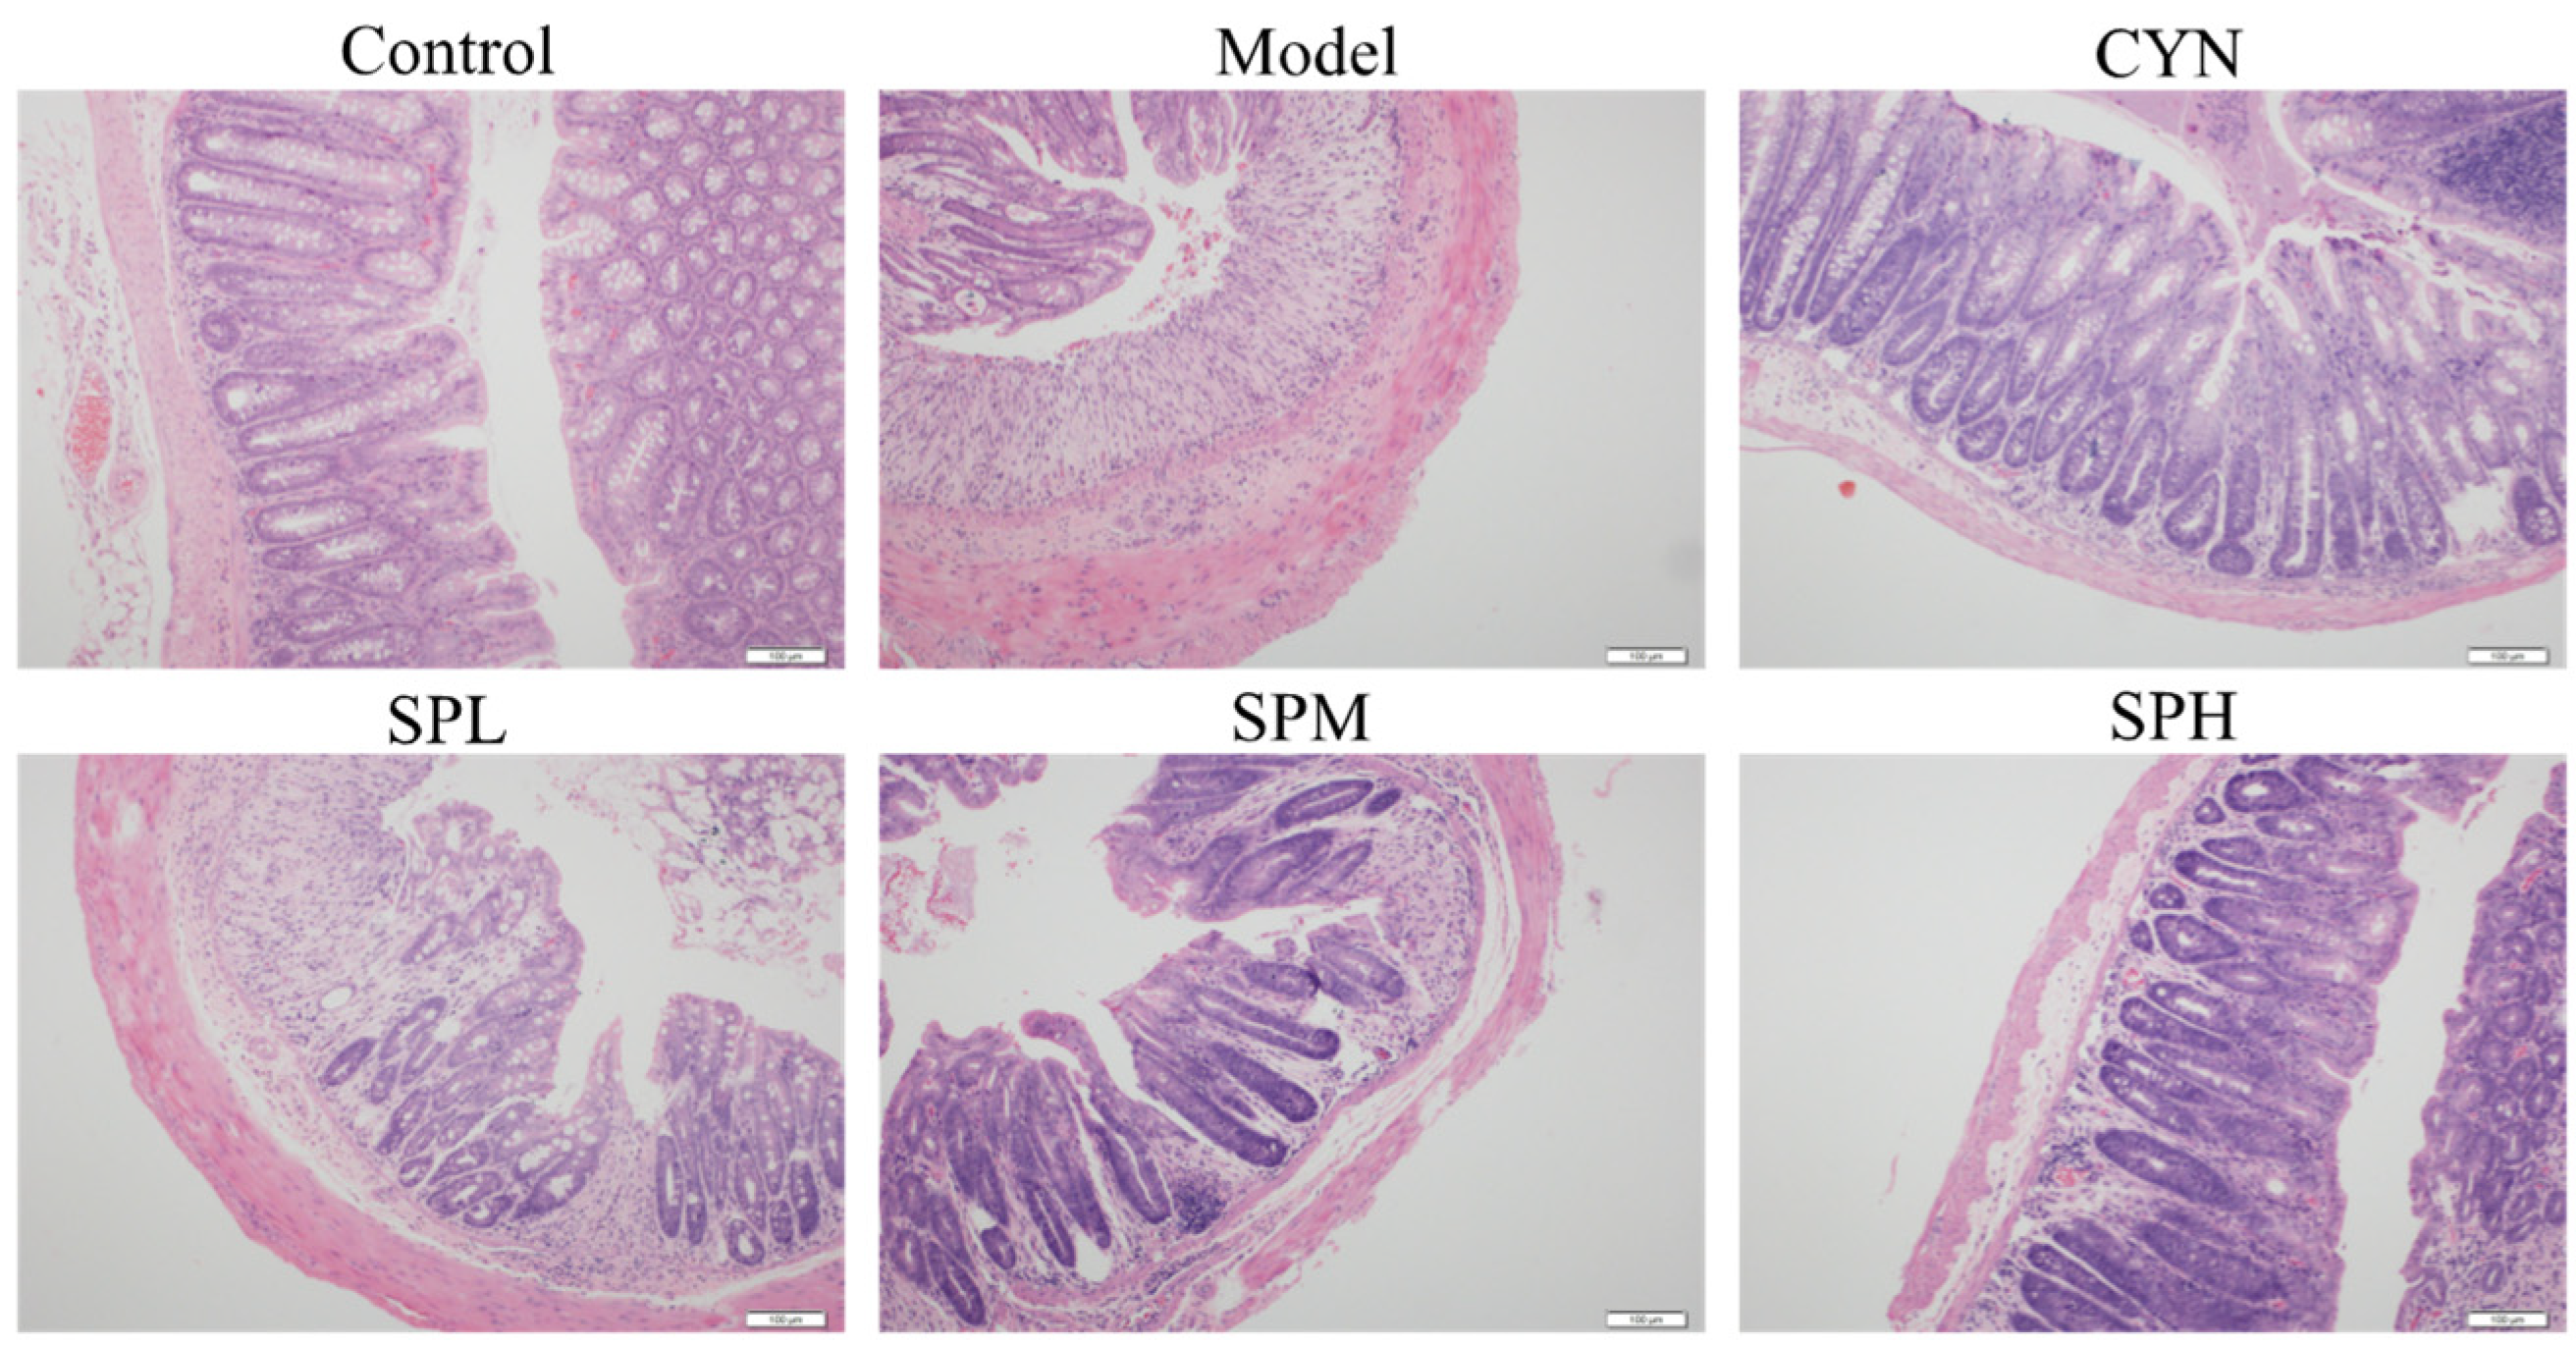
2.2.5. Histopathology
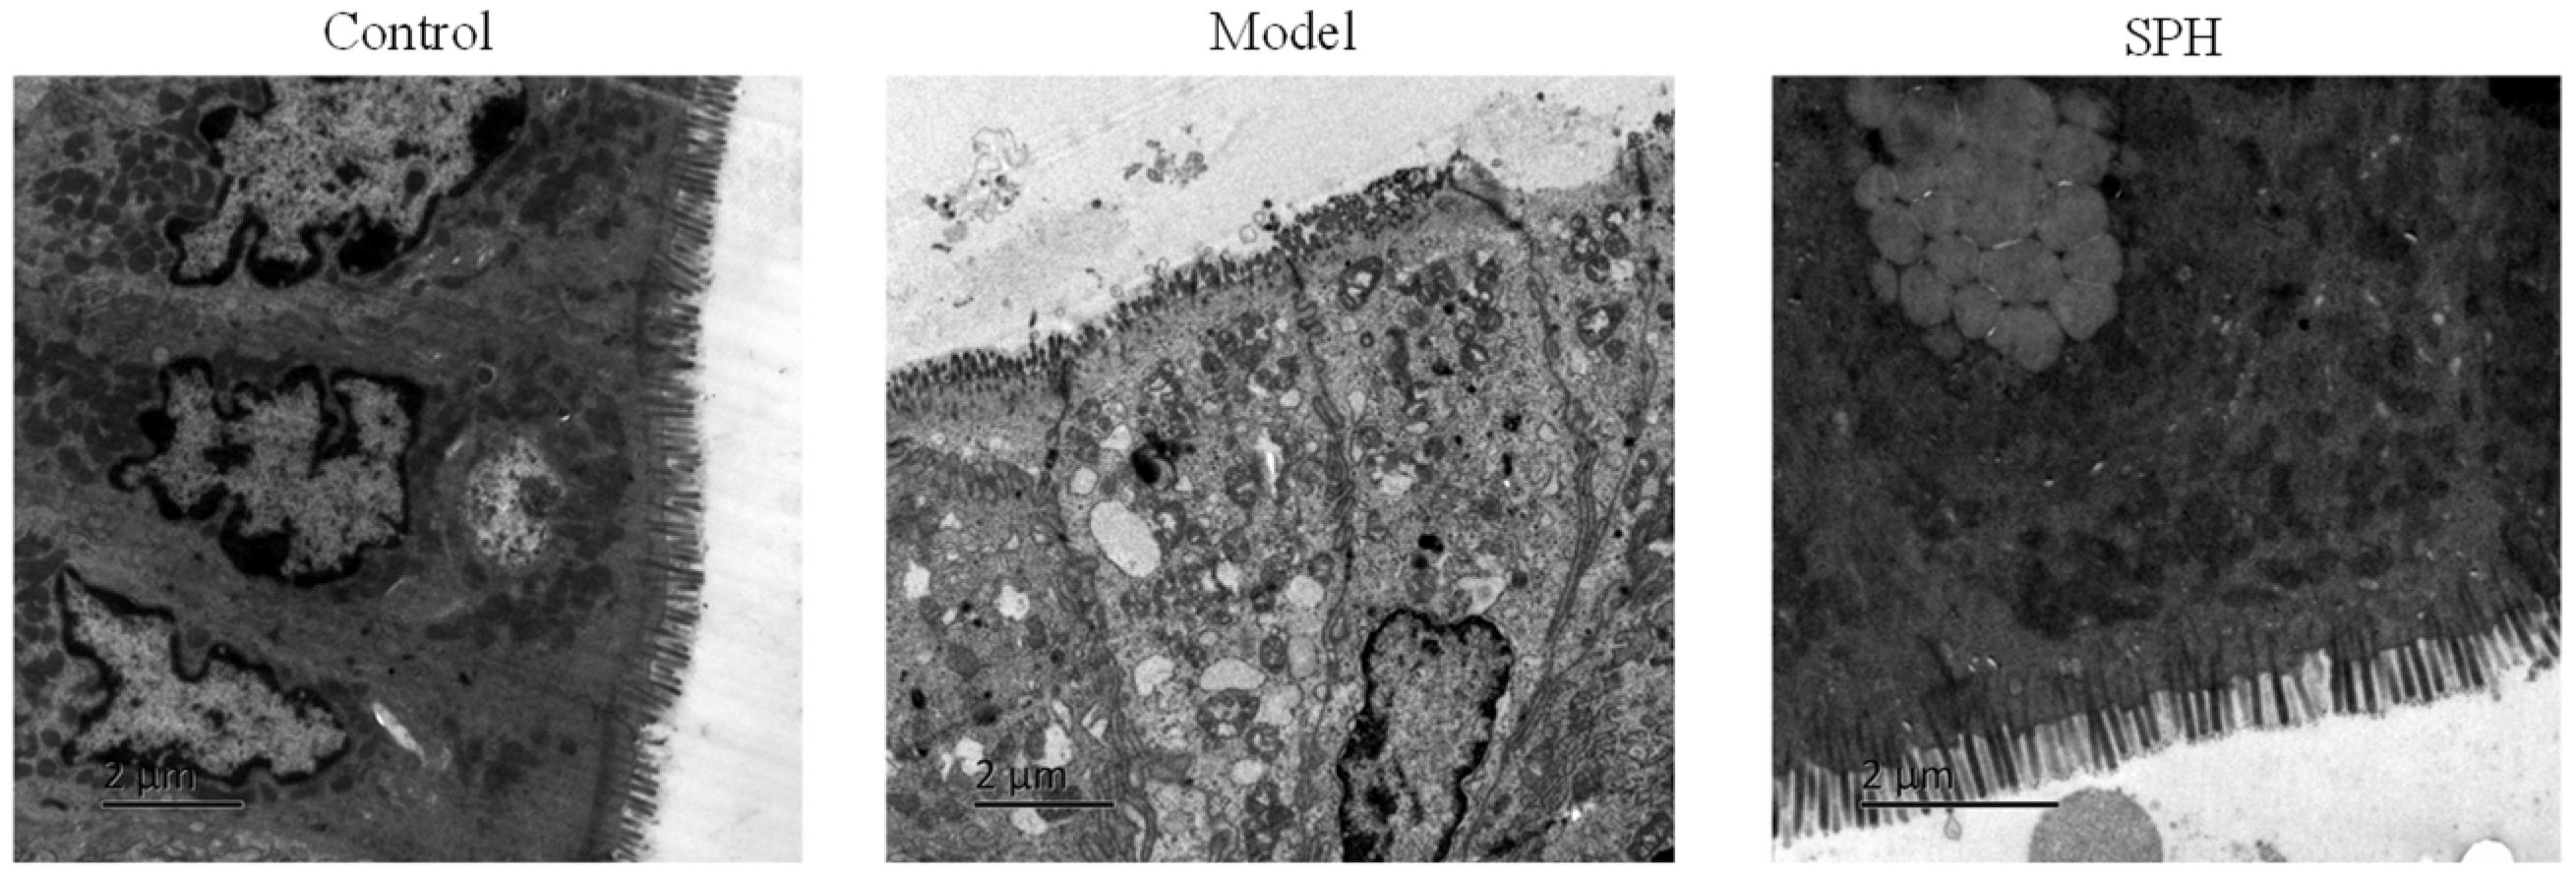
2.2.6. Transmission Electron Microscopy Analysis
2.3. Metabolomics
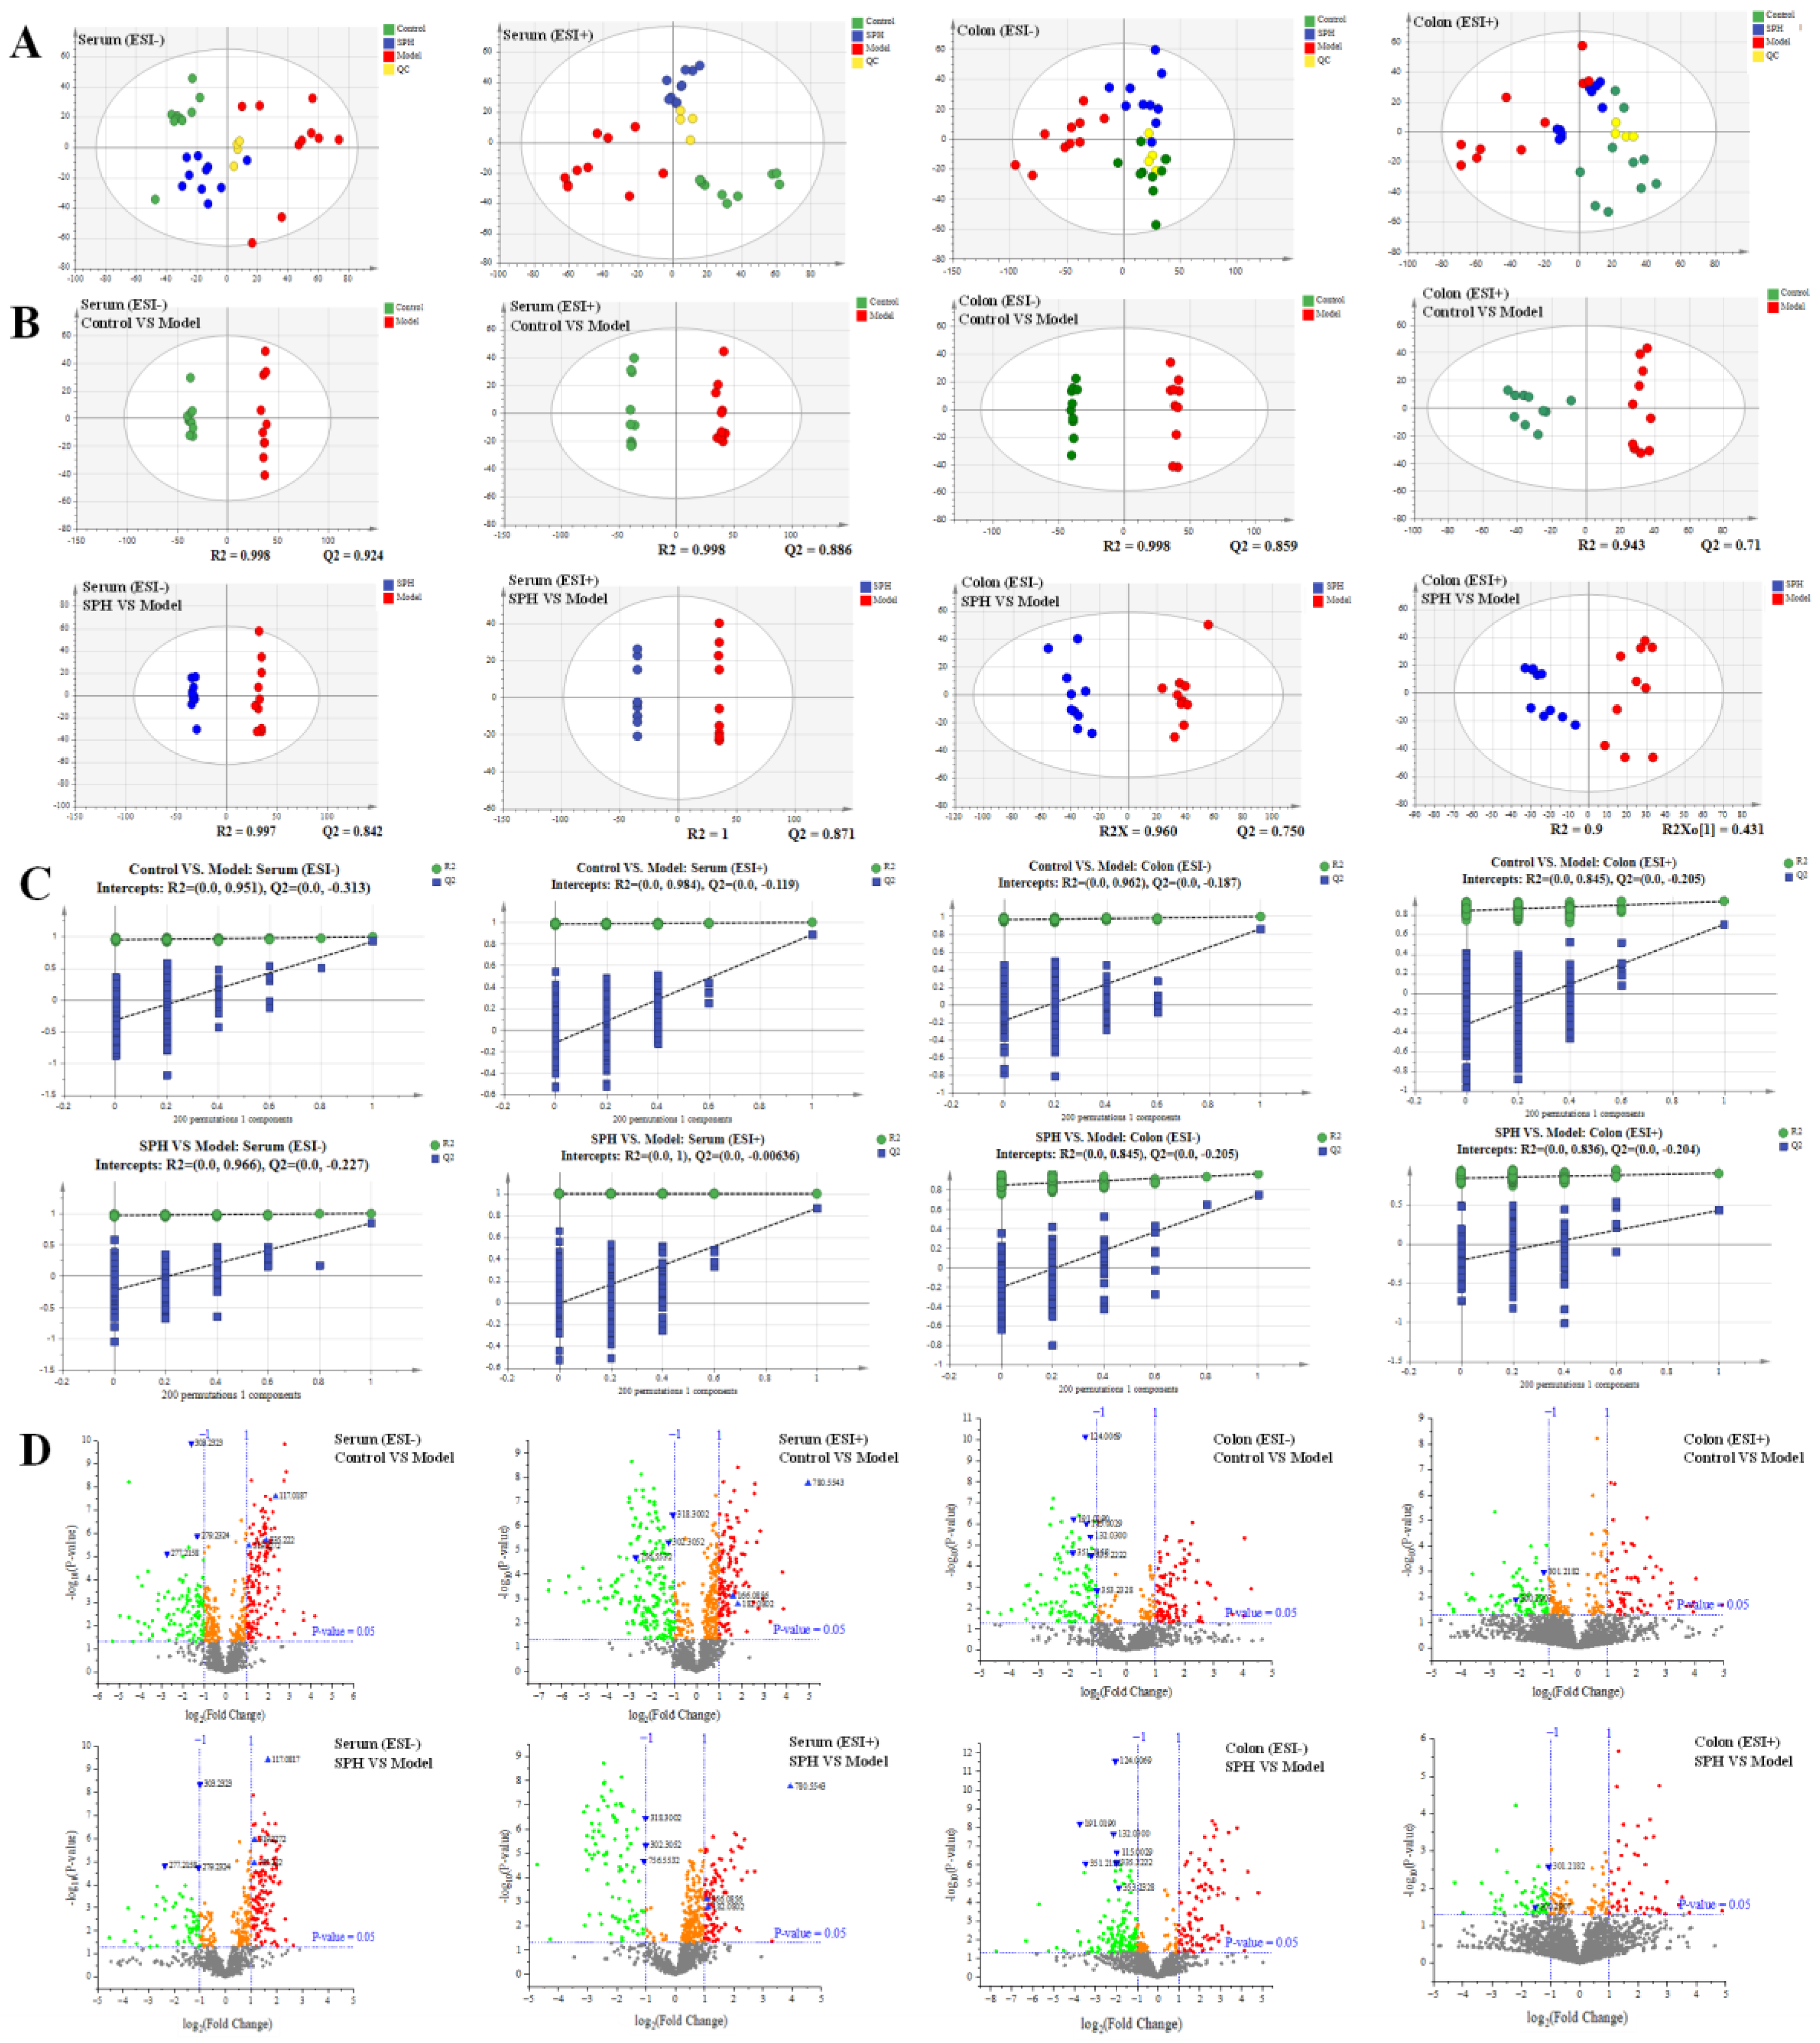
2.3.1. Validation and Determination
2.3.2. Multivariate Statistical Analyses of Serum and Colon Metabolomics
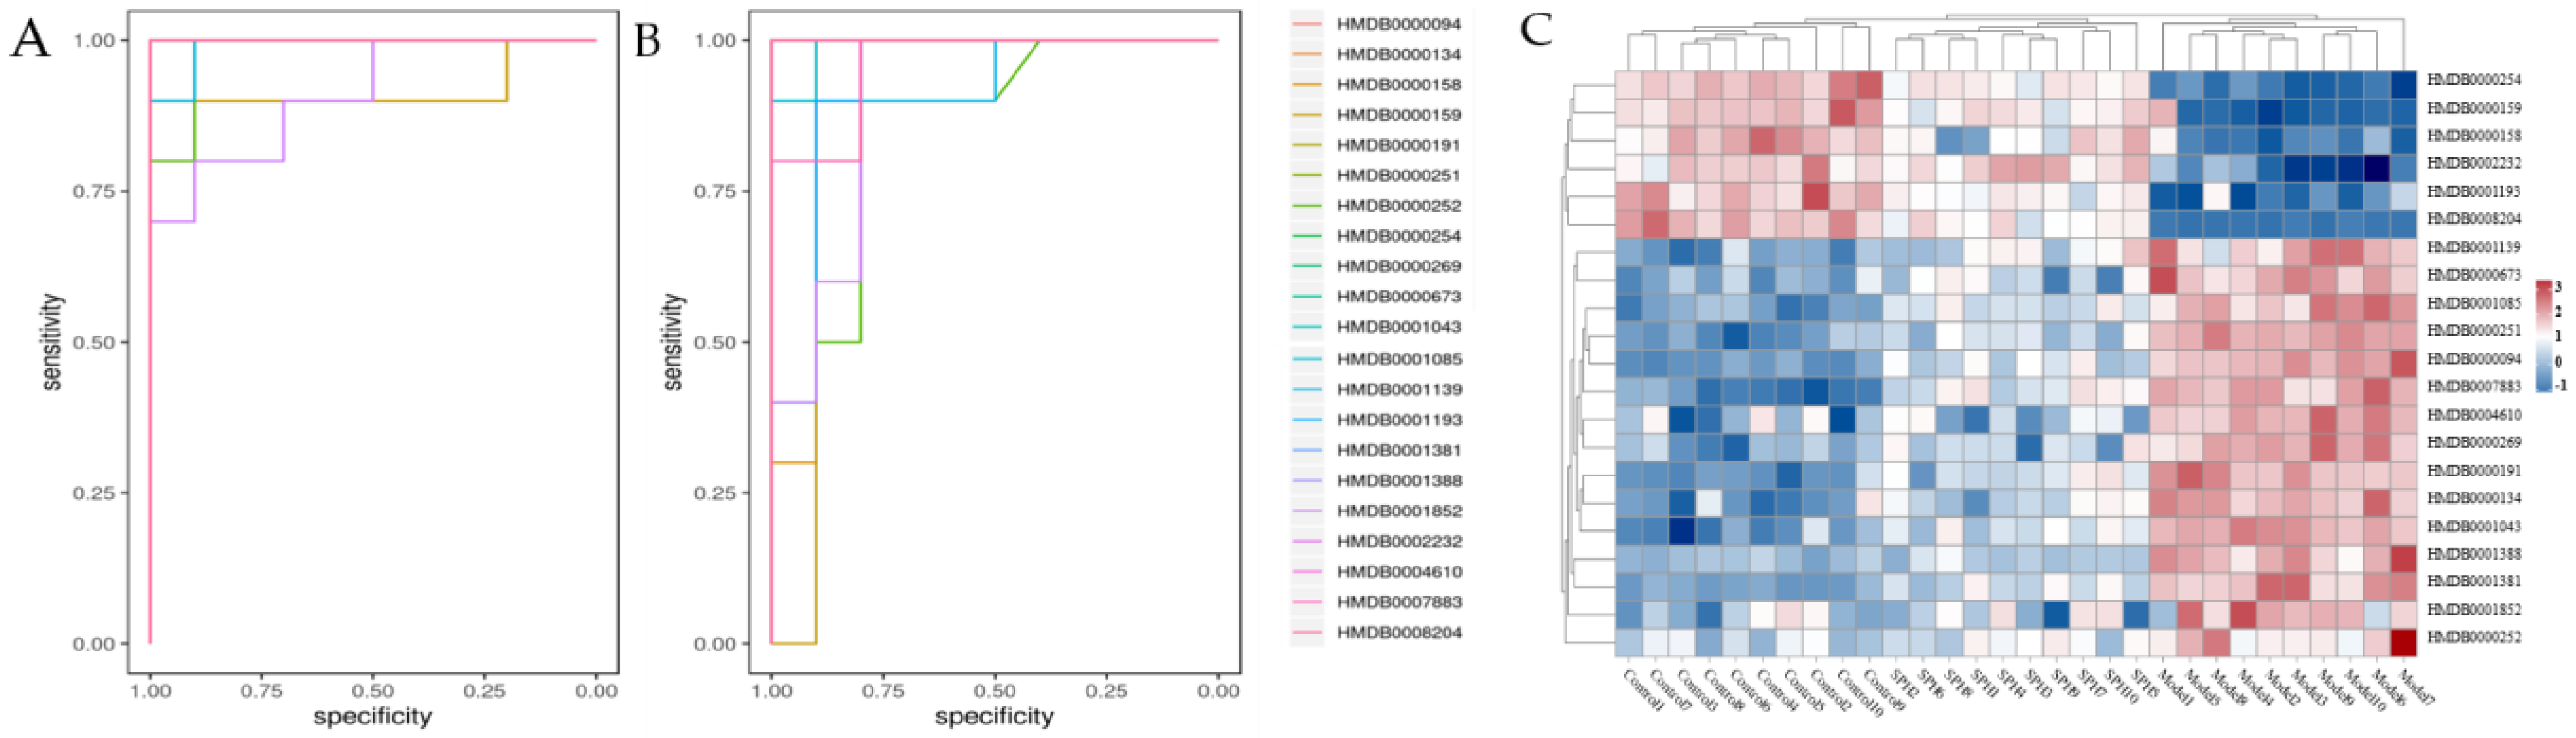
2.3.3. Biomarkers Screening and Pathway Enrichment
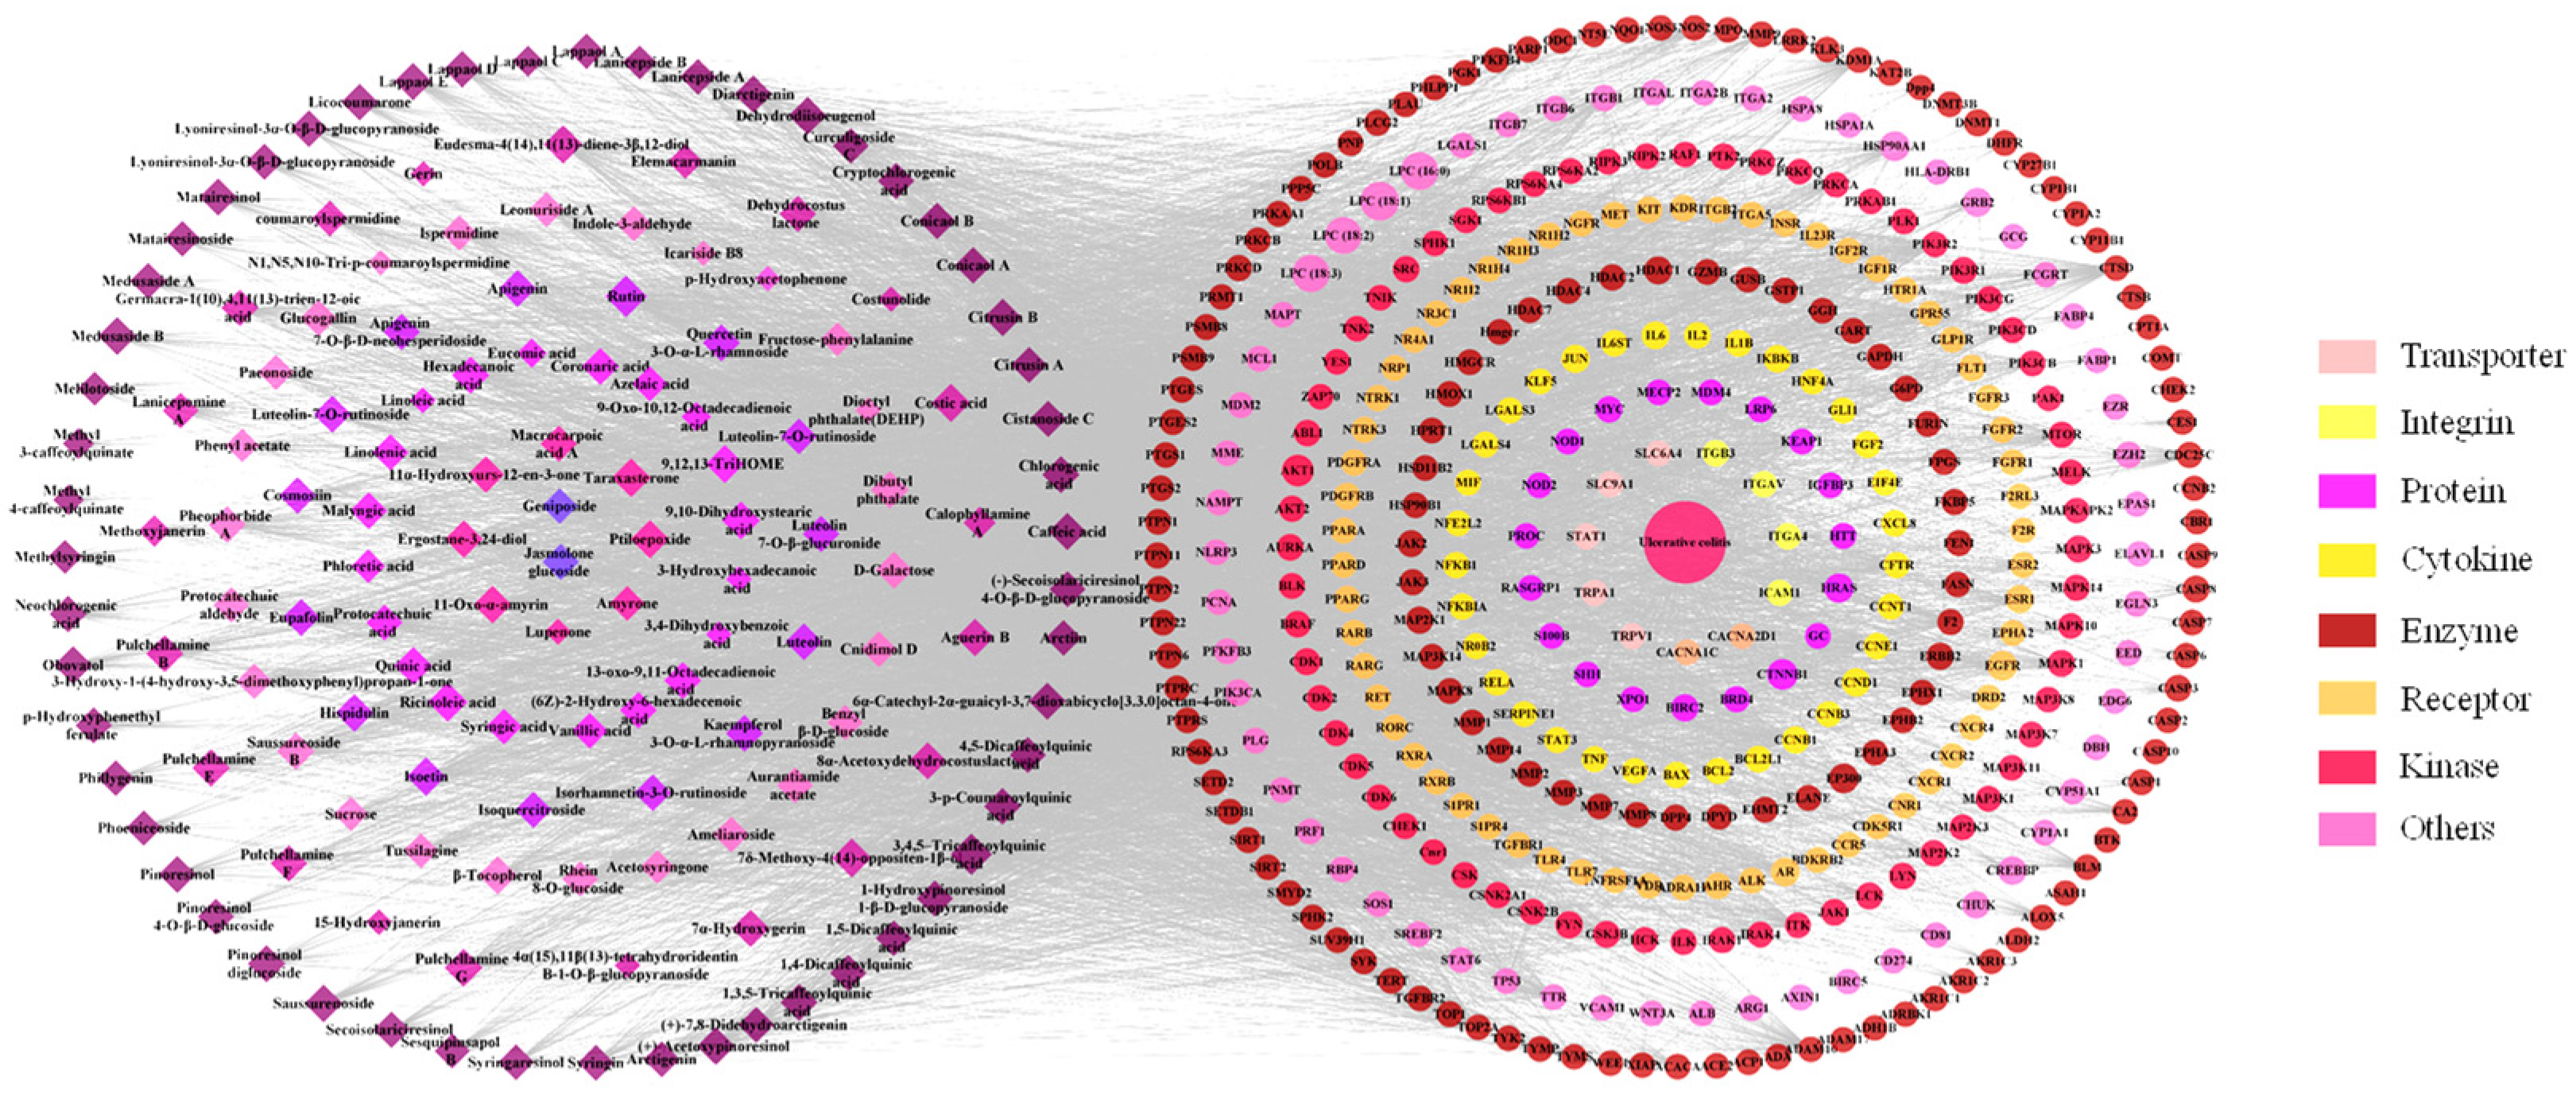
2.4. Network Pharmacology
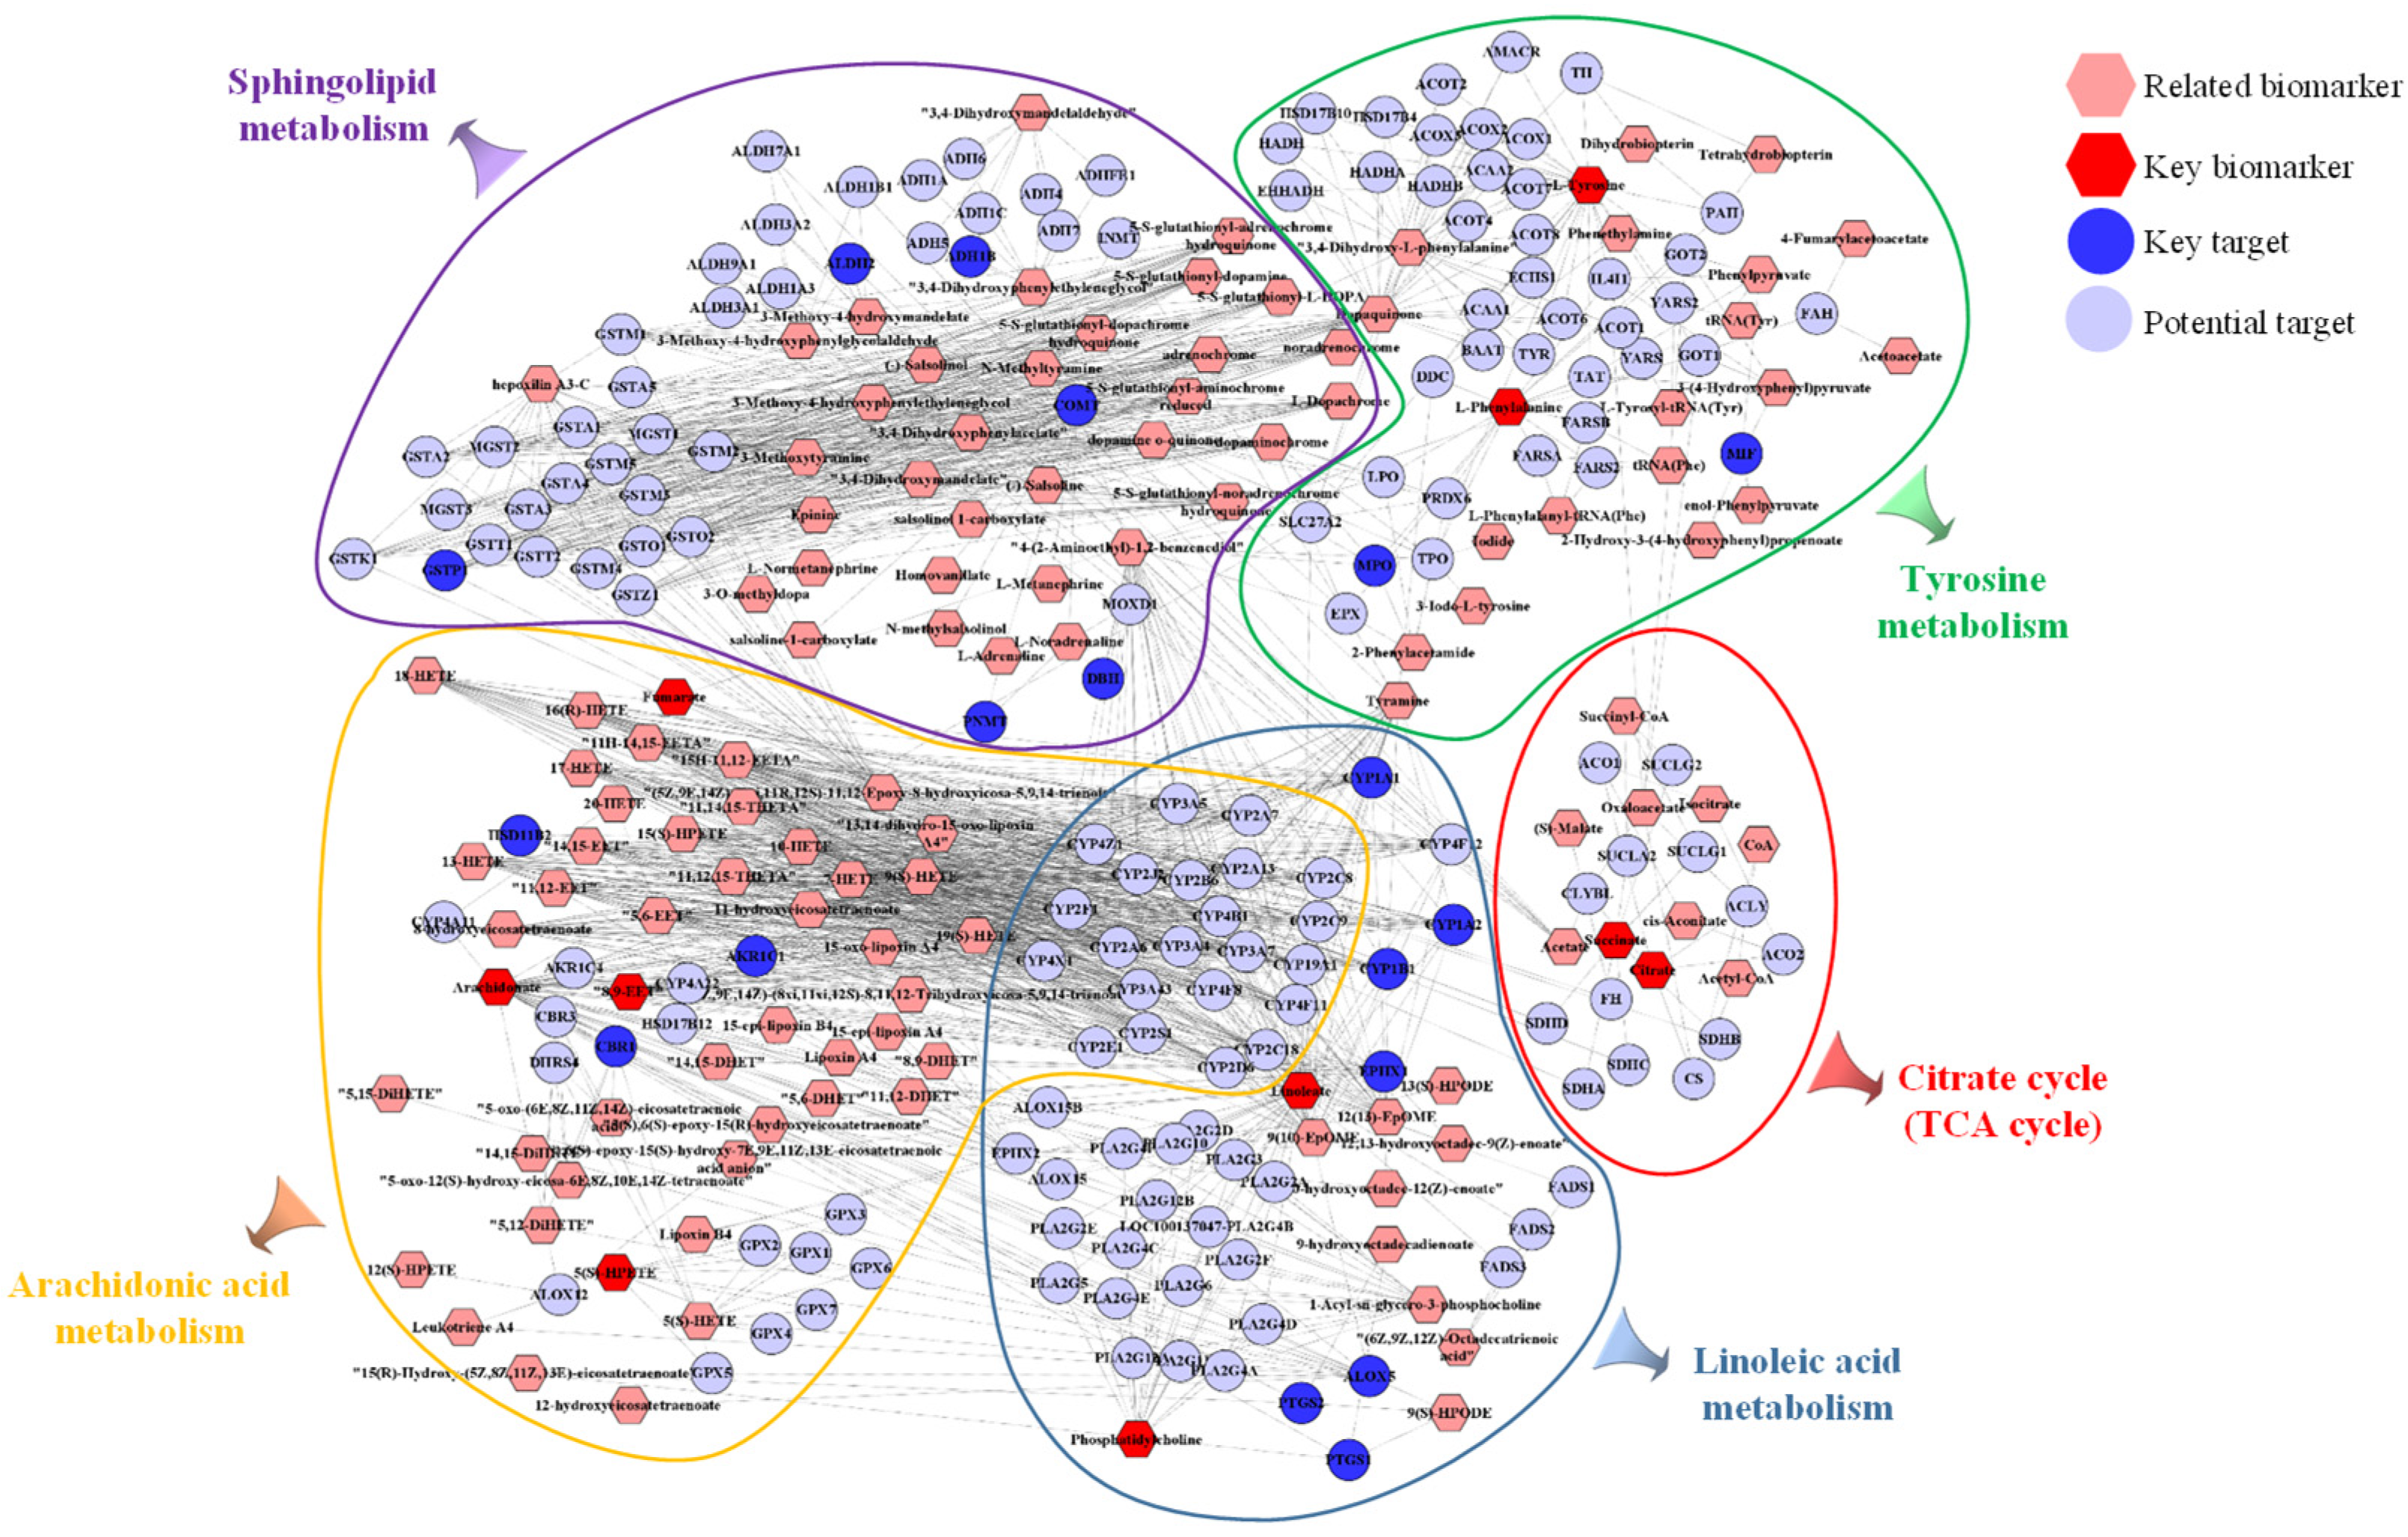
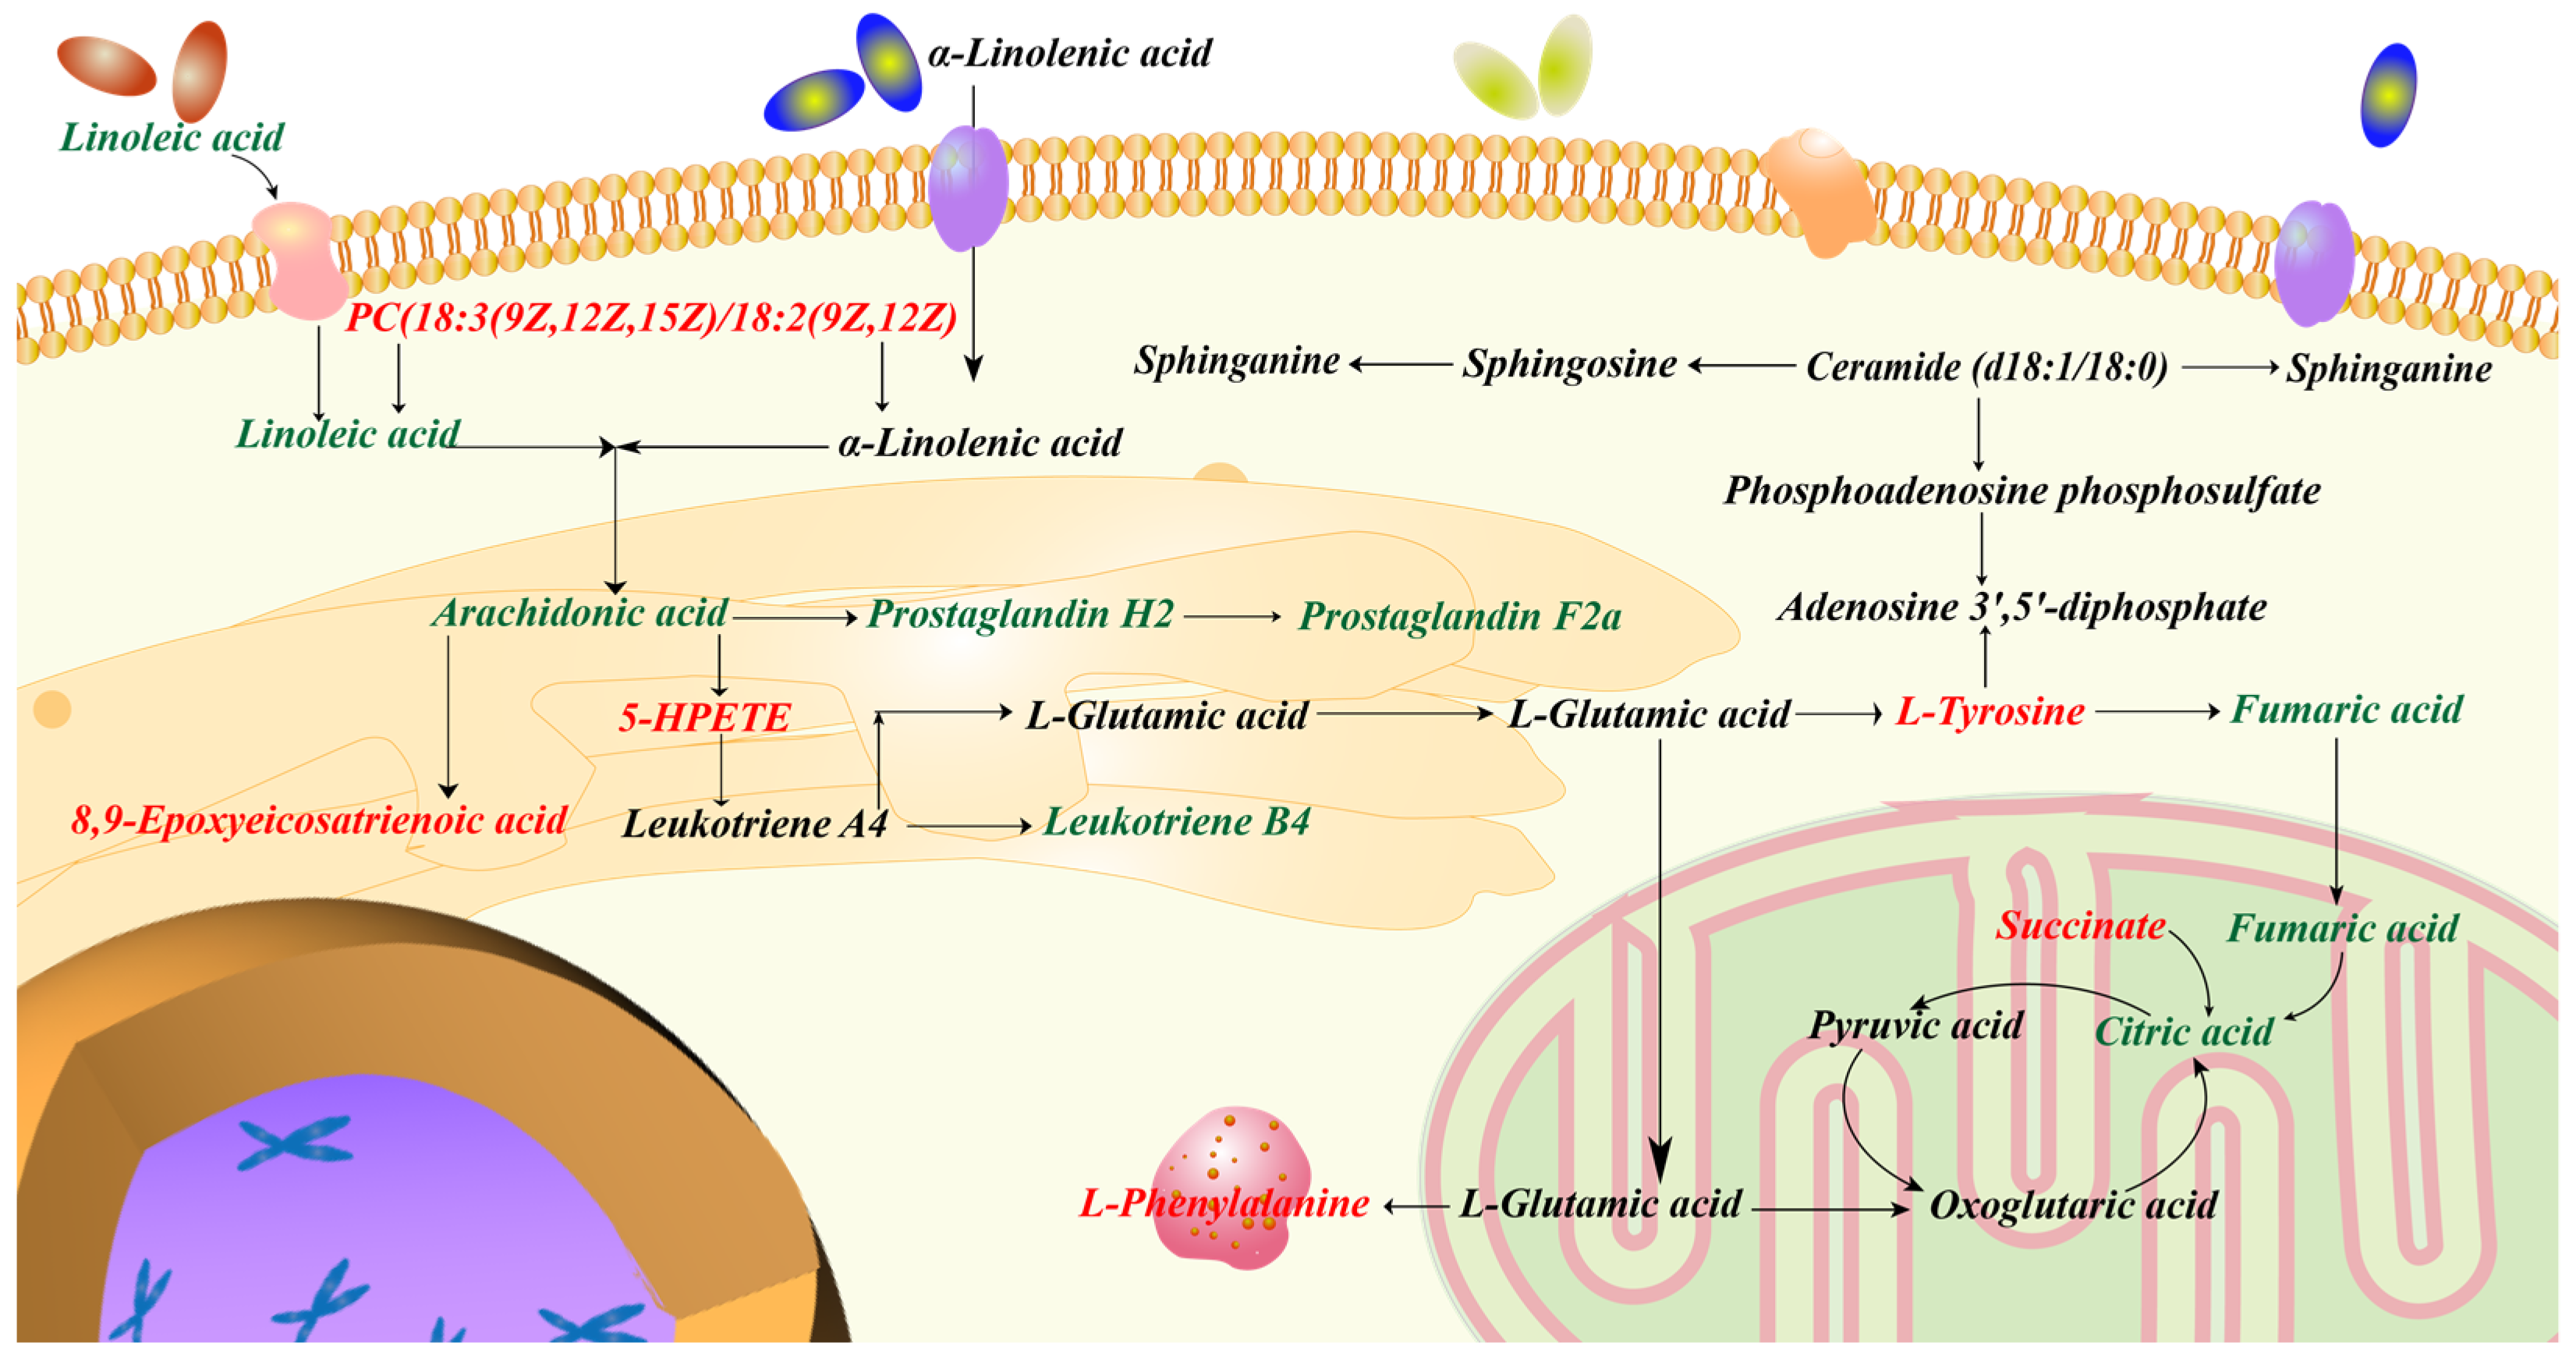
2.5. Integrated Analysis Involving Metabolomics and Network Pharmacology
3. Discussion
4. Materials and Methods
4.1. Materials and Reagents
4.2. Animals
4.3. Sample Preparation
4.4. UPLC-Q/TOF-MS
4.5. Comprehensive Phytochemical Analysis
4.5.1. Qualitative Analysis
4.5.2. Quantitative Analysis
4.6. Alleviated Ulcerative Colitis Activity
4.6.1. Experimental Design
4.6.2. Body Weights, Clinical Signs Observations and Disease Activity Index (DAI)
4.6.3. Sample Collection and Preparation
4.6.4. Measurement of Cytokines and Myeloperoxidase (MPO) Contents
4.6.5. Measurement of Oxidative Stress Indexes Levels
4.6.6. Histological Analysis
4.6.7. Transmission Electron Microscopy Examination
4.6.8. Statistical Analysis
4.7. Metabolomics
4.8. Network Pharmacology
4.9. Integrated Analysis Involving Metabolomics and Network Pharmacology
5. Conclusions
Supplementary Materials
Author Contributions
Funding
Institutional Review Board Statement
Informed Consent Statement
Data Availability Statement
Conflicts of Interest
Sample Availability
Abbreviations
| BPI | base peak intensity |
| CMC-Na | sodium carboxymethylcellulose |
| CYN | changyanning tablet |
| DAI | disease active index |
| DSS | dextran sodium sulfate |
| ESI | electron spray ionization |
| GSH | glutathione |
| H&E | hematoxylin-eosin staining |
| IL-6 | lnterleukin-6 |
| iNOS | inducible nitric oxide synthase |
| LOD | limits of detection |
| LOQ | limits of quantification |
| LPC | lysophosphatidylcholine |
| MDA | malondialdehyde |
| MPO | myeloperoxidase |
| OPLS-DA | orthogonal projections to latent structures discriminant analysis |
| PBS | phosphate buffered saline |
| PCA | principal component analysis |
| QC | quality control |
| QTOF-MS | quadrupole time of flight-mass spectrometry |
| ROC | receiver operating characteristic |
| RSD | relative standard deviation |
| RT | retention time |
| S.E.M. | standard error of the mean |
| SOD | superoxide dismutase |
| SP | Saussurea pulchella |
| TEM | transmission electron microscopy |
| TNF-α | tumor necrosis factor-α |
| UC | ulcerative colitis |
| VIP | variable importance for the projection |
References
- Ungaro, R.; Mehandru, S.; Allen, P.B.; Peyrin-Biroulet, L.; Colombel, J.F. Ulcerative colitis. Lancet 2017, 389, 1756–1770. [Google Scholar] [CrossRef] [PubMed]
- Gajendran, M.; Loganathan, P.; Jimenez, G.; Catinella, A.P.; Ng, N.; Umapathy, C.; Ziade, N.; Hashash, J.G. A comprehensive review and update on ulcerative colitis. Dis. Mon. 2019, 65, 100851. [Google Scholar] [CrossRef] [PubMed]
- Niu, W.; Chen, X.; Xu, R.; Dong, H.; Yang, F.; Wang, Y.; Zhang, Z.; Ju, J. Polysaccharides from natural resources exhibit great potential in the treatment of ulcerative colitis: A review. Carbohydr. Polym. 2021, 254, 117189. [Google Scholar] [CrossRef] [PubMed]
- Xiao, H.; Du, M. Clinical Research Progress of Traditional Chinese Medicine in Ulcerative Colitis. Pop. Sci. Technol. 2020, 22, 84–87. [Google Scholar] [CrossRef]
- Guo, L.; Jiang, X.; Li, J.; Zhang, C.; Li, J.; Chen, J.; Huang, B. Research progress of traditional Chinese medicine for ulcerative colitis. China Mod. Med. 2020, 34, 26–30. [Google Scholar] [CrossRef]
- Jiang, S.; Shen, X.; Xuan, S.; Yang, B.; Ruan, Q.; Cui, H.; Zhao, Z.; Jin, J. Serum and colon metabolomics study reveals the anti-ulcerative colitis effect of Croton crassifolius Geisel. Phytomedicine 2021, 87, 153570. [Google Scholar] [CrossRef]
- Wei, Y.-Y.; Fan, Y.-M.; Ga, Y.; Zhang, Y.-N.; Han, J.-C.; Hao, Z.-H. Shaoyao decoction attenuates DSS-induced ulcerative colitis, macrophage and NLRP3 inflammasome activation through the MKP1/NF-κB pathway. Phytomedicine 2021, 92, 153743. [Google Scholar] [CrossRef]
- Bai, Y.; Hong, S.; Yue, L.; Wang, Y.-Q. Clinical observations on 100 cases of ulcerative colitis treated with the method of clearing away heat, expelling dampness, promoting blood circulation and healing ulcer. J. Tradit. Chin. Med. 2010, 30, 98–102. [Google Scholar]
- Zhong Hua Ben Cao Commission. Chinese Materia Medica (Zhong Hua Ben Cao); Shanghai Science and Technology Press: Shanghai, China, 1999. [Google Scholar]
- Nishiuchi, T.; Yamasaki, N. Saussurea Pulchella as a New Cut Flower. In Proceedings of the IV International Symposium on New Floricultural Crops, Chania, Greece, 22–27 May 1999; Volume 541, pp. 247–252. [Google Scholar]
- Вoрoбьева, А.Н.; Басаргин, Д.Д. Осoбеннoсти стрoения эпидермы листа Saussurea pulchella (Fisch.) Fisch. и S. Neopulchella Lipsch. 2013, 3, 38–45. [Google Scholar]
- Lee, D.-S.; Choi, H.-G.; Woo, K.W.; Kang, D.-G.; Lee, H.-S.; Oh, H.; Lee, K.R.; Kim, Y.-C. Pulchellamin G, an amino acid-sesquiterpene lactone, from Saussurea pulchella suppresses lipopolysaccharide-induced inflammatory responses via heme oxygenase-1 expression in murine peritoneal macrophages. Eur. J. Pharmacol. 2013, 715, 123–132. [Google Scholar] [CrossRef]
- Basargin, D.D.; Tsiklauri, G.C. The phenolic compounds of Saussurea pulchella (Fisch.) Fisch. Rastit. Resur. 1990, 26, 68–71. [Google Scholar]
- Wu, Z. Compendium of New China Herbal; Xinhua: Beijing, China, 1990. [Google Scholar]
- Ye, Z.; LI, L.; Fu, S.; Liu, J.; Li, P.; Liu, Y. Study on the Anti-hepatocellular Activity of Saussurea pulchella. Spec. Wild Econ. Anim. Plant Res. 2021, 43, 10–14. [Google Scholar] [CrossRef]
- Diao, E.; Wang, G.; Gao, M. Clinical Observation on Rheumatoid Arthritis Treated by Saussurea pulchella. Chin. J. Tradit. Med. Sci. Technol. 2000, 1, 42–43. [Google Scholar]
- Wang, G.; Nie, J.; Diao, E. Study on the anti-inflammatory effect of chrysanthemum. Chin. J. Tradit. Med. Sci. Technol. 2000, 1, 39–40. [Google Scholar]
- Matsuda, H.; Kageura, T.; Inoue, Y.; Morikawa, T.; Yoshikawa, M. Absolute stereostructures and syntheses of saussureamines A, B, C, D and E, amino acid–sesquiterpene conjugates with gastroprotective effect, from the roots of Saussurea lappa. Tetrahedron 2000, 56, 7763–7777. [Google Scholar] [CrossRef]
- Sutar, N.; Garai, R.; Sharma, U.S.; Singh, N.; Roy, S.D. Antiulcerogenic activity of Saussurea lappa root. Int. J. Pharm. Life Sci. 2011, 2, 516–520. [Google Scholar]
- Zhao, T.; Li, S.-J.; Zhang, Z.-X.; Zhang, M.-L.; Shi, Q.-W.; Gu, Y.-C.; Dong, M.; Kiyota, H. Chemical constituents from the genus Saussurea and their biological activities. Heterocycl. Commun. 2017, 23, 331–358. [Google Scholar] [CrossRef]
- Korul’Kina, L.; Shul’ts, E.; Zhusupova, G.; Abilov, Z.A.; Erzhanov, K.; Chaudri, M. Biologically active compounds from Limonium gmelinii and L. popovii I. Chem. Nat. Compd. 2004, 40, 465–471. [Google Scholar] [CrossRef]
- Lin, H.; Zhu, H.; Tan, J.; Wang, H.; Wang, Z.; Li, P.; Zhao, C.; Liu, J. Comparative analysis of chemical constituents of Moringa oleifera leaves from China and India by ultra-performance liquid chromatography coupled with quadrupole-time-of-flight mass spectrometry. Molecules 2019, 24, 942. [Google Scholar] [CrossRef]
- Yang, Z.-Y.; Lu, D.-Y.; Yao, S.; Zhang, R.-R.; Jiang, Z.-J.; Ma, Z.-G. Chemical fingerprint and quantitative analysis of Cistanchedeserticola by HPLC-DAD-ESI-MS. J. Food Drug Anal. 2013, 21, 50–57. [Google Scholar]
- Smyrska-Wieleba, N.; Wojtanowski, K.K.; Mroczek, T. Comparative HILIC/ESI-QTOF-MS and HPTLC studies of pyrrolizidine alkaloids in flowers of Tussilago farfara and roots of Arnebia euchroma. Phytochem. Lett. 2017, 20, 339–349. [Google Scholar] [CrossRef]
- He, J.; Dong, Y.; Liu, X.; Wan, Y.; Gu, T.; Zhou, X.; Liu, M. Comparison of chemical compositions, antioxidant, and anti-photoaging activities of Paeonia suffruticosa flowers at different flowering stages. Antioxidants 2019, 8, 345. [Google Scholar] [CrossRef]
- Kumar, S.; Chandra, P.; Bajpai, V.; Singh, A.; Srivastava, M.; Mishra, D.; Kumar, B. Rapid qualitative and quantitative analysis of bioactive compounds from Phyllanthus amarus using LC/MS/MS techniques. Ind. Crops Prod. 2015, 69, 143–152. [Google Scholar] [CrossRef]
- Llorach, R.; Favari, C.; Alonso, D.; Garcia-Aloy, M.; Andres-Lacueva, C.; Urpi-Sarda, M. Comparative metabolite fingerprinting of legumes using LC-MS-based untargeted metabolomics. Food Res. Int. 2019, 126, 108666. [Google Scholar] [CrossRef]
- Hau, J.; Devaud, S.; Blank, I. Detection of Amadori compounds by capillary electrophoresis coupled to tandem mass spectrometry. Electrophoresis 2004, 25, 2077–2083. [Google Scholar] [CrossRef]
- Otsuka, H.; Takeuchi, M.; Inoshiri, S.; Sato, T.; Yamasaki, K. Phenolic compounds from Coix lachryma-jobi var. ma-yuen. Phytochemistry 1989, 28, 883–886. [Google Scholar] [CrossRef]
- Lin, L.-Z.; Sun, J.; Chen, P.; Harnly, J. UHPLC-PDA-ESI/HRMS/MS n analysis of anthocyanins, flavonol glycosides, and hydroxycinnamic acid derivatives in red mustard greens (Brassica juncea Coss variety). J. Agric. Food Chem. 2011, 59, 12059–12072. [Google Scholar] [CrossRef] [Green Version]
- Yang, Y.-L.; Al-Mahdy, D.A.; Wu, M.-L.; Zheng, X.-T.; Piao, X.-H.; Chen, A.-L.; Wang, S.-M.; Yang, Q.; Ge, Y.-W. LC-MS-based identification and antioxidant evaluation of small molecules from the cinnamon oil extraction waste. Food Chem. 2022, 366, 130576. [Google Scholar] [CrossRef]
- Bartsch, M.; Bednarek, P.; Vivancos, P.D.; Schneider, B.; von Roepenack-Lahaye, E.; Foyer, C.H.; Kombrink, E.; Scheel, D.; Parker, J.E. Accumulation of isochorismate-derived 2, 3-dihydroxybenzoic 3-O-β-D-xyloside in Arabidopsis resistance to pathogens and ageing of leaves. J. Biol. Chem. 2010, 285, 25654–25665. [Google Scholar] [CrossRef]
- Mujahid, M.; Sasikala, C.; Ramana, C.V. Aniline-induced tryptophan production and identification of indole derivatives from three purple bacteria. Curr. Microbiol. 2010, 61, 285–290. [Google Scholar] [CrossRef]
- Shakya, R.; Navarre, D.A. Rapid screening of ascorbic acid, glycoalkaloids, and phenolics in potato using high-performance liquid chromatography. J. Agric. Food Chem. 2006, 54, 5253–5260. [Google Scholar] [CrossRef]
- Liu, L.; Cui, Z.-X.; Zhang, Y.-B.; Xu, W.; Yang, X.-W.; Zhong, L.-J.; Zhang, P.; Gong, Y. Identification and quantification analysis of the chemical constituents from Mahonia fortune using Q-Exactive HF Mass Spectrometer and UPLC–ESI-MS/MS. J. Pharm. Biomed. Anal. 2021, 196, 113903. [Google Scholar] [CrossRef]
- Antunes, A.C.; Acunha, T.d.S.; Perin, E.C.; Rombaldi, C.V.; Galli, V.; Chaves, F.C. Untargeted metabolomics of strawberry (Fragaria x ananassa ‘Camarosa’) fruit from plants grown under osmotic stress conditions. J. Sci. Food Agric. 2019, 99, 6973–6980. [Google Scholar] [CrossRef]
- Yang, M.C.; Choi, S.U.; Choi, W.S.; Kim, S.Y.; Lee, K.R. Guaiane sesquiterpene lactones and amino acid-sesquiterpene lactone conjugates from the aerial parts of Saussurea pulchella. J. Nat. Prod. 2008, 71, 678–683. [Google Scholar] [CrossRef]
- Kammerer, B.; Kahlich, R.; Biegert, C.; Gleiter, C.H.; Heide, L. HPLC-MS/MS analysis of willow bark extracts contained in pharmaceutical preparations. Phytochem. Anal. 2005, 16, 470–478. [Google Scholar] [CrossRef]
- Milutinović, V.; Niketić, M.; Krunić, A.; Nikolić, D.; Petković, M.; Ušjak, L.; Petrović, S. Sesquiterpene lactones from the methanol extracts of twenty-eight Hieracium species from the Balkan Peninsula and their chemosystematic significance. Phytochemistry 2018, 154, 19–30. [Google Scholar] [CrossRef]
- Duan, H.; Takaishi, Y.; Momota, H.; Ohmoto, Y.; Taki, T. Immunosuppressive constituents from Saussurea medusa. Phytochemistry 2002, 59, 85–90. [Google Scholar] [CrossRef]
- Xu, S.j.; Yang, L.; Zeng, X.; Zhang, M.; Wang, Z.t. Characterization of compounds in the Chinese herbal drug Mu-Dan-Pi by liquid chromatography coupled to electrospray ionization mass spectrometry. Rapid Commun. Mass Spectrom. 2006, 20, 3275–3288. [Google Scholar] [CrossRef]
- Saravanakumar, K.; Park, S.; Sathiyaseelan, A.; Kim, K.-N.; Cho, S.-H.; Mariadoss, A.V.A.; Wang, M.-H. Metabolite profiling of methanolic extract of Gardenia jaminoides by LC-MS/MS and GC-MS and its anti-diabetic, and anti-oxidant activities. Pharmaceuticals 2021, 14, 102. [Google Scholar] [CrossRef]
- Anttonen, M.J.; Karjalainen, R.O. High-performance liquid chromatography analysis of black currant (Ribes nigrum L.) fruit phenolics grown either conventionally or organically. J. Agric. Food Chem. 2006, 54, 7530–7538. [Google Scholar] [CrossRef]
- Fang, N.; Yu, S.; Prior, R.L. LC/MS/MS characterization of phenolic constituents in dried plums. J. Agric. Food Chem. 2002, 50, 3579–3585. [Google Scholar] [CrossRef]
- Owen, R.; Haubner, R.; Hull, W.; Erben, G.; Spiegelhalder, B.; Bartsch, H.; Haber, B. Isolation and structure elucidation of the major individual polyphenols in carob fibre. Food Chem. Toxicol. 2003, 41, 1727–1738. [Google Scholar] [CrossRef]
- Tolonen, A.; Hohtola, A.; Jalonen, J. Comparison of electrospray ionization and atmospheric pressure chemical ionization techniques in the analysis of the main constituents from Rhodiola rosea extracts by liquid chromatography/mass spectrometry. J. Mass Spectrom. 2003, 38, 845–853. [Google Scholar] [CrossRef]
- Hu, H.; Yau, L.-F.; Peng, J.; Hu, B.; Li, J.; Li, Y.; Huang, H. Comparative Research of Chemical Profiling in Different Parts of Fissistigma oldhamii by Ultra-High-Performance Liquid Chromatography Coupled with Hybrid Quadrupole-Orbitrap Mass Spectrometry. Molecules 2021, 26, 960. [Google Scholar] [CrossRef]
- Duan, L.; Xiong, H.; Du, Y.; Wang, Z.; Li, Y.; Zhao, S.; Chen, J.; Si, D.; Pan, H. High-throughput LC–MS method for the rapid characterisation and comparative analysis of multiple ingredients of four hawthorn leaf extracts. Phytochem. Anal. 2022, 33, 635–643. [Google Scholar] [CrossRef]
- Fan, C.-Q.; Yue, J.-M. Biologically active phenols from Saussurea medusa. Bioorganic Med. Chem. 2003, 11, 703–708. [Google Scholar] [CrossRef]
- Jaiswal, R.; Kuhnert, N. How to identify and discriminate between the methyl quinates of chlorogenic acids by liquid chromatography–tandem mass spectrometry. J. Mass Spectrom. 2011, 46, 269–281. [Google Scholar] [CrossRef]
- Xie, H.; Wang, T.; Matsuda, H.; Morikawa, T.; Yoshikawa, M.; Tani, T. Bioactive constituents from Chinese natural medicines. XV. Inhibitory effect on aldose reductase and structures of saussureosides A and B from Saussurea medusa. Chem. Pharm. Bull. 2005, 53, 1416–1422. [Google Scholar] [CrossRef]
- Knust, U.; Erben, G.; Spiegelhalder, B.; Bartsch, H.; Owen, R.W. Identification and quantitation of phenolic compounds in faecal matrix by capillary gas chromatography and nano-electrospray mass spectrometry. Rapid Commun. Mass Spectrom. 2006, 20, 3119–3129. [Google Scholar] [CrossRef]
- Zhou, Z.W.; Yin, S.; Wang, X.N.; Fan, C.Q.; Li, H.; Yue, J.M. Two new lignan glycosides from Saussurea laniceps. Helv. Chim. Acta 2007, 90, 951–956. [Google Scholar] [CrossRef]
- Mellegård, H.; Stalheim, T.; Hormazabal, V.; Granum, P.; Hardy, S. Antibacterial activity of sphagnum acid and other phenolic compounds found in Sphagnum papillosum against food-borne bacteria. Lett. Appl. Microbiol. 2009, 49, 85–90. [Google Scholar] [CrossRef]
- Wu, D.; Wang, H.; Tan, J.; Wang, C.; Lin, H.; Zhu, H.; Liu, J.; Li, P.; Yin, J. Pharmacokinetic and metabolism studies of curculigoside C by UPLC-MS/MS and UPLC-QTOF-MS. Molecules 2018, 24, 21. [Google Scholar] [CrossRef]
- Yang, D.S.; Whang, W.K.; Kim, I.H. The constituents of Taraxacum hallaisanensis roots. Arch. Pharmacal Res. 1996, 19, 507–513. [Google Scholar] [CrossRef]
- Rodríguez-Pérez, C.; Quirantes-Piné, R.; Fernández-Gutiérrez, A.; Segura-Carretero, A. Comparative characterization of phenolic and other polar compounds in Spanish melon cultivars by using high-performance liquid chromatography coupled to electrospray ionization quadrupole-time of flight mass spectrometry. Food Res. Int. 2013, 54, 1519–1527. [Google Scholar] [CrossRef]
- Liang, Y.-H. Lignans and flavonoids from rhizome of Drynaria fortunei. Chin. Tradit. Herb. Drugs 2011, 24, 25–30. [Google Scholar]
- Michalska, A.; Wojdyło, A.; Bogucka, B. The influence of nitrogen and potassium fertilisation on the content of polyphenolic compounds and antioxidant capacity of coloured potato. J. Food Compost. Anal. 2016, 47, 69–75. [Google Scholar] [CrossRef]
- Cao, Y.; Gu, C.; Zhao, F.; Tang, Y.; Cui, X.; Shi, L.; Xu, L.; Yin, L. Therapeutic effects of Cyathula officinalis Kuan and its active fraction on acute blood stasis rat model and identification constituents by HPLC-QTOF/MS/MS. Pharmacogn. Mag. 2017, 13, 693. [Google Scholar] [PubMed]
- Ha, T.J.; Jang, D.S.; Lee, J.R.; Lee, K.D.; Lee, J.; Hwang, S.W.; Jung, H.J.; Nam, S.H.; Park, K.H.; Yang, M.S. Cytotoxic effects of sesquiterpene lactones from the flowers ofHemisteptia lyrata B. Arch. Pharmacal Res. 2003, 26, 925–928. [Google Scholar] [CrossRef]
- Kuo, Y.-H.; Way, S.-T.; Wu, C.-H. A new triterpene and a new lignan from Saussurea japonica. J. Nat. Prod. 1996, 59, 622–624. [Google Scholar] [CrossRef]
- Yang, N.; Wang, H.; Lin, H.; Liu, J.; Zhou, B.; Chen, X.; Wang, C.; Liu, J.; Li, P. Comprehensive metabolomics analysis based on UPLC-Q/TOF-MS E and the anti-COPD effect of different parts of Celastrus orbiculatus Thunb. RSC Adv. 2020, 10, 8396–8420. [Google Scholar] [CrossRef]
- Han, Y.; Zhou, M.; Wang, L.; Ying, X.; Peng, J.; Jiang, M.; Bai, G.; Luo, G. Comparative evaluation of different cultivars of Flos Chrysanthemi by an anti-inflammatory-based NF-κB reporter gene assay coupled to UPLC-Q/TOF MS with PCA and ANN. J. Ethnopharmacol. 2015, 174, 387–395. [Google Scholar] [CrossRef] [PubMed]
- Gattuso, G.; Caristi, C.; Gargiulli, C.; Bellocco, E.; Toscano, G.; Leuzzi, U. Flavonoid glycosides in bergamot juice (Citrus bergamia Risso). J. Agric. Food Chem. 2006, 54, 3929–3935. [Google Scholar] [CrossRef]
- Ye, M.; Han, J.; Chen, H.; Zheng, J.; Guo, D. Analysis of phenolic compounds in rhubarbs using liquid chromatography coupled with electrospray ionization mass spectrometry. J. Am. Soc. Mass Spectrom. 2007, 18, 82–91. [Google Scholar] [CrossRef] [PubMed]
- Wei, L.; Mei, Y.; Zou, L.; Chen, J.; Tan, M.; Wang, C.; Cai, Z.; Lin, L.; Chai, C.; Yin, S. Distribution patterns for bioactive constituents in pericarp, stalk and seed of Forsythiae fructus. Molecules 2020, 25, 340. [Google Scholar] [CrossRef] [PubMed]
- Dai, X.; Zhuang, J.; Wu, Y.; Wang, P.; Zhao, G.; Liu, Y.; Jiang, X.; Gao, L.; Xia, T. Identification of a flavonoid glucosyltransferase involved in 7-OH site glycosylation in tea plants (Camellia sinensis). Sci. Rep. 2017, 7, 5926. [Google Scholar] [CrossRef] [PubMed]
- Flores, R.M.; Doskey, P.V. Evaluation of multistep derivatization methods for identification and quantification of oxygenated species in organic aerosol. J. Chromatogr. 2015, 1418, 1–11. [Google Scholar] [CrossRef]
- Fu, S.; Arráez-Roman, D.; Segura-Carretero, A.; Menéndez, J.A.; Menéndez-Gutiérrez, M.P.; Micol, V.; Fernández-Gutiérrez, A. Qualitative screening of phenolic compounds in olive leaf extracts by hyphenated liquid chromatography and preliminary evaluation of cytotoxic activity against human breast cancer cells. Anal. Bioanal. Chem. 2010, 397, 643–654. [Google Scholar] [CrossRef]
- Lin, L.-Z.; Harnly, J.M. Identification of hydroxycinnamoylquinic acids of arnica flowers and burdock roots using a standardized LC-DAD-ESI/MS profiling method. J. Agric. Food Chem. 2008, 56, 10105–10114. [Google Scholar] [CrossRef]
- Singh, P.; Bhala, M. Guaianolides from Saussurea candicans. Phytochemistry 1988, 27, 1203–1205. [Google Scholar] [CrossRef]
- Fan, C.-Q.; Zhu, X.-Z.; Zhan, Z.-J.; Ji, X.-Q.; Li, H.; Yue, J.-M. Lignans from Saussurea conica and their NO production suppressing activity. Planta Med. 2006, 72, 590–595. [Google Scholar] [CrossRef]
- Wang, X.R.; Wu, Q.X.; Shi, Y.P. Terpenoids and sterols from Saussurea cauloptera. Chem. Biodivers. 2008, 5, 279–289. [Google Scholar] [CrossRef] [PubMed]
- Zhang, Y.-B.; Yang, X.-B.; Yang, X.-W.; Xu, W.; Li, F.; Gonzezal, F.J. Liquid chromatography with tandem mass spectrometry: A sensitive method for the determination of dehydrodiisoeugenol in rat cerebral nuclei. Molecules 2016, 21, 321. [Google Scholar] [CrossRef]
- Ichihara, A.; Numata, Y.; Kanai, S.; Sakamura, S. New sesquilignans from Arctium lappa L. The structure of lappaol C, D and E. Agric. Biol. Chem. 1977, 41, 1813–1814. [Google Scholar] [CrossRef]
- Joo, J.; Lee, D.; Wu, Z.; Shin, J.H.; Lee, H.S.; Kwon, B.M.; Huh, T.L.; Kim, Y.W.; Lee, S.J.; Kim, T.W. In vitro metabolism of obovatol and its effect on cytochrome P450 enzyme activities in human liver microsomes. Biopharm. Drug Dispos. 2013, 34, 195–202. [Google Scholar] [CrossRef] [PubMed]
- Freund, D.M.; Martin, A.C.; Cohen, J.D.; Hegeman, A.D. Direct detection of surface localized specialized metabolites from Glycyrrhiza lepidota (American licorice) by leaf spray mass spectrometry. Planta 2018, 247, 267–275. [Google Scholar] [CrossRef]
- Aabideen, Z.U.; Mumtaz, M.W.; Akhtar, M.T.; Mukhtar, H.; Raza, S.A.; Touqeer, T.; Saari, N. Anti-obesity attributes; UHPLC-QTOF-MS/MS-based metabolite profiling and molecular docking insights of Taraxacum officinale. Molecules 2020, 25, 4935. [Google Scholar] [CrossRef]
- Bohlmann, F.; Singh, P.; Jakupovic, J.; Huneck, S. Further guaianolides from Saussurea species. Planta Med. 1985, 51, 74–75. [Google Scholar] [CrossRef]
- Ratnam, K.J.; Reddy, R.S.; Sekhar, N.; Kantam, M.L.; Figueras, F. Sulphated zirconia catalyzed acylation of phenols, alcohols and amines under solvent free conditions. J. Mol. Catal. A Chem. 2007, 276, 230–234. [Google Scholar] [CrossRef]
- Zheleva-Dimitrova, D.; Gevrenova, R.; Zaharieva, M.M.; Najdenski, H.; Ruseva, S.; Lozanov, V.; Balabanova, V.; Yagi, S.; Momekov, G.; Mitev, V. HPLC-UV and LC–MS analyses of acylquinic acids in Geigeria alata (DC) Oliv. & Hiern. and their contribution to antioxidant and antimicrobial capacity. Phytochem. Anal. 2017, 28, 176–184. [Google Scholar]
- Barrero, A.F.; Haidour, A.; Dorado, M.M. Sesquipinsapols A and B: Two sesquilignans from Abies pinsapo. Nat. Prod. Lett. 1993, 2, 255–262. [Google Scholar] [CrossRef]
- Fan, C.Q.; Zhan, Z.J.; Li, H.; Yue, J.M. Eudesmane-Type Sesquiterpene Derivatives from Saussurea conica. Helv. Chim. Acta 2004, 87, 1446–1451. [Google Scholar] [CrossRef]
- Lee, J.H.; Lee, S.J.; Park, S.; Kim, H.K.; Jeong, W.Y.; Choi, J.Y.; Sung, N.-J.; Lee, W.S.; Lim, C.-S.; Kim, G.-S. Characterisation of flavonoids in Orostachys japonicus A. Berger using HPLC–MS/MS: Contribution to the overall antioxidant effect. Food Chem. 2011, 124, 1627–1633. [Google Scholar] [CrossRef]
- Choi, S.U.; Yang, M.C.; Lee, K.H.; Kim, K.H.; Lee, K.R. Lignan and terpene constituents from the aerial parts of Saussurea pulchella. Arch. Pharmacal Res. 2007, 30, 1067–1074. [Google Scholar] [CrossRef]
- Liu, Q.; Majdi, M.; Cankar, K.; Goedbloed, M.; Charnikhova, T.; Verstappen, F.W.; De Vos, R.C.; Beekwilder, J.; Van der Krol, S.; Bouwmeester, H.J. Reconstitution of the costunolide biosynthetic pathway in yeast and Nicotiana benthamiana. PLoS ONE 2011, 6, e23255. [Google Scholar] [CrossRef] [PubMed]
- Aboutabl, E.A.; El Mahdy, M.E.; Sokkar, N.M.; Sleem, A.A.; Shams, M.M. Bioactive lignans and other phenolics from the roots, leaves and seeds of Arctium lappa L. grown in Egypt. Egypt. Pharm. J. 2012, 11, 59. [Google Scholar]
- Matsumoto, T.; Hosono-Nishiyama, K.; Yamada, H. Antiproliferative and apoptotic effects of butyrolactone lignans from Arctium lappa on leukemic cells. Planta Med. 2006, 72, 276–278. [Google Scholar] [CrossRef] [PubMed]
- Nguyen, D.T.; Göpfert, J.C.; Ikezawa, N.; MacNevin, G.; Kathiresan, M.; Conrad, J.; Spring, O.; Ro, D.-K. Biochemical conservation and evolution of germacrene A oxidase in Asteraceae. J. Biol. Chem. 2010, 285, 16588–16598. [Google Scholar] [CrossRef]
- Huh, J.; Lee, C.-M.; Lee, S.; Kim, S.; Cho, N.; Cho, Y.-C. Comprehensive Characterization of Lignans from Forsythia viridissima by UHPLC-ESI-QTOF-MS, and Their NO Inhibitory Effects on RAW 264.7 Cells. Molecules 2019, 24, 2649. [Google Scholar] [CrossRef]
- de Kraker, J.-W.; Franssen, M.C.; de Groot, A.; Shibata, T.; Bouwmeester, H.J. Germacrenes from fresh costus roots. Phytochemistry 2001, 58, 481–487. [Google Scholar] [CrossRef]
- Roy, R.N.; Laskar, S.; Sen, S. Dibutyl phthalate, the bioactive compound produced by Streptomyces albidoflavus 321.2. Microbiol. Res. 2006, 161, 121–126. [Google Scholar] [CrossRef]
- Piacente, S.; Santos, L.C.D.; Mahmood, N.; Pizza, C. Triterpenes from Maytenus macrocarpa and evaluation of their anti-HIV activity. Nat. Prod. Commun. 2006, 1, 1934578X0600101201. [Google Scholar] [CrossRef]
- Na, M.; Kim, B.Y.; Osada, H.; Ahn, J.S. Inhibition of protein tyrosine phosphatase 1B by lupeol and lupenone isolated from Sorbus commixta. J. Enzym. Inhib. Med. Chem. 2009, 24, 1056–1059. [Google Scholar] [CrossRef] [PubMed]
- Frankenberger, L.; Mora, T.D.; de Siqueira, C.D.; Filippin-Monteiro, F.B.; de Moraes, M.H.; Biavatti, M.W.; Steindel, M.; Sandjo, L.P. UPLC-ESI-QTOF-MS2 characterisation of Cola nitida resin fractions with inhibitory effects on NO and TNF-α released by LPS-activated J774 macrophage and on Trypanosoma cruzi and Leishmania amazonensis. Phytochem. Anal. 2018, 29, 577–589. [Google Scholar] [CrossRef] [PubMed]
- Menichini, F.; Di Benedetto, R.; Delle Monache, F. A triterpene epoxide and a guaianolide from Ptilostemmon gnaphaloides. Phytochemistry 1996, 41, 1377–1379. [Google Scholar] [CrossRef]
- Pütter, K.M.; van Deenen, N.; Müller, B.; Fuchs, L.; Vorwerk, K.; Unland, K.; Bröker, J.N.; Scherer, E.; Huber, C.; Eisenreich, W. The enzymes OSC1 and CYP716A263 produce a high variety of triterpenoids in the latex of Taraxacum koksaghyz. Sci. Rep. 2019, 9, 5942. [Google Scholar] [CrossRef]
- Luis, J.G.; Andrés, L.S. New ursane type triterpenes from Salvia mellifera greene. Nat. Prod. Lett. 1999, 13, 187–194. [Google Scholar] [CrossRef]
- Pop, R.M.; Weesepoel, Y.; Socaciu, C.; Pintea, A.; Vincken, J.-P.; Gruppen, H. Carotenoid composition of berries and leaves from six Romanian sea buckthorn (Hippophae rhamnoides L.) varieties. Food Chem. 2014, 147, 1–9. [Google Scholar] [CrossRef]
- Rontani, J.-F.; Charrière, B.; Menniti, C.; Aubert, D.; Aubert, C. EIMS Fragmentation and MRM quantification of autoxidation products of α-and β-amyrins in natural samples. Rapid Commun. Mass Spectrom. 2018, 18, 1599–1607. [Google Scholar] [CrossRef]
- Takatori, S.; Kitagawa, Y.; Kitagawa, M.; Nakazawa, H.; Hori, S. Determination of di (2-ethylhexyl) phthalate and mono (2-ethylhexyl) phthalate in human serum using liquid chromatography-tandem mass spectrometry. J. Chromatogr. B 2004, 804, 397–401. [Google Scholar] [CrossRef]
- Wang, F.; Dana, A.; Tian, S.; Eponine, O.; Vasuk, G.; Russell, G.; Thomaso, M.; Davids, W. CFM-ID 4.0—A web server for accurate MS-based metabolite identification. Nucleic Acids Res. 2022, 50, W165–W174. [Google Scholar] [CrossRef]
- Wu, X.; Yang, Y.; Dou, Y.; Ye, J.; Bian, D.; Wei, Z.; Tong, B.; Kong, L.; Xia, Y.; Dai, Y. Arctigenin but not arctiin acts as the major effective constituent of Arctium lappa L. fruit for attenuating colonic inflammatory response induced by dextran sulfate sodium in mice. Int. Immunopharmacol. 2014, 23, 505–515. [Google Scholar] [CrossRef] [PubMed]
- Zeng, J.; Zhang, D.; Wan, X.; Bai, Y.; Yuan, C.; Wang, T.; Yuan, D.; Zhang, C.; Liu, C. Chlorogenic Acid Suppresses miR-155 and Ameliorates Ulcerative Colitis through the NF-κB/NLRP3 Inflammasome Pathway. Mol. Nutr. Food Res. 2020, 64, 2000452. [Google Scholar] [CrossRef] [PubMed]
- Liu, Y.; Huang, W.; Ji, S.; Wang, J.; Luo, J.; Lu, B. Sophora japonica flowers and their main phytochemical, rutin, regulate chemically induced murine colitis in association with targeting the NF-κB signaling pathway and gut microbiota. Food Chem. 2022, 393, 133395. [Google Scholar] [CrossRef] [PubMed]
- Marquez-Flores, Y.K.; Villegas, I.; Cárdeno, A.; Rosillo, M.Á.; Alarcon-de-la-Lastra, C. Apigenin supplementation protects the development of dextran sulfate sodium-induced murine experimental colitis by inhibiting canonical and non-canonical inflammasome signaling pathways. J. Nutr. Biochem. 2016, 30, 143–152. [Google Scholar] [CrossRef] [PubMed]
- Bilsborough, J.; Fiorino, M.F.; Henkle, B.W. Select animal models of colitis and their value in predicting clinical efficacy of biological therapies in ulcerative colitis. Expert Opin. Drug Discov. 2021, 16, 567–577. [Google Scholar] [CrossRef]
- Randhawa, P.K.; Singh, K.; Singh, N.; Jaggi, A.S. A review on chemical-induced inflammatory bowel disease models in rodents. Korean J. Physiol. Pharmacol. 2014, 18, 279–288. [Google Scholar] [CrossRef]
- Vilcek, J.; Lee, T.H. Tumor necrosis factor.: New insights into the molecular mechanisms of its multiple actions. J. Biol. Chem. 1991, 266, 7313–7316. [Google Scholar] [CrossRef]
- Luo, J.; Cao, J.; Jiang, X.; Cui, H. Effect of low molecular weight heparin rectal suppository on experimental ulcerative colitis in mice. Biomed. Pharmacother. 2010, 64, 441–445. [Google Scholar] [CrossRef]
- Itzkowitz, S.H. Molecular biology of dysplasia and cancer in inflammatory bowel disease. Gastroenterol. Clin. 2006, 35, 553–571. [Google Scholar] [CrossRef]
- Diab, J.; Hansen, T.; Goll, R.; Stenlund, H.; Ahnlund, M.; Jensen, E.; Moritz, T.; Florholmen, J.; Forsdahl, G. Lipidomics in ulcerative colitis reveal alteration in mucosal lipid composition associated with the disease state. Inflamm. Bowel Dis. 2019, 25, 1780–1787. [Google Scholar] [CrossRef]
- Liu, Y.; Wang, Z.; Wang, C.; Si, H.; Yu, H.; Li, L.; Fu, S.; Tan, L.; Li, P.; Liu, J. Comprehensive phytochemical analysis and sedative-hypnotic activity of two Acanthopanax species leaves. Food Funct. 2021, 12, 2292–2311. [Google Scholar] [CrossRef]
- Liu, Z.; Peng, Y.; Ma, P.; Fan, L.; Zhao, L.; Wang, M.; Li, X. An integrated strategy for anti-inflammatory quality markers screening of traditional Chinese herbal medicine Mume Fructus based on phytochemical analysis and anti-colitis activity. Phytomedicine 2022, 99, 154002. [Google Scholar] [CrossRef] [PubMed]
- Zhou, B.; Liu, J.; Wang, Y.; Wu, F.; Wang, C.; Wang, C.; Liu, J.; Li, P. Protective Effect of Ethyl Rosmarinate against Ulcerative Colitis in Mice Based on Untargeted Metabolomics. Int. J. Mol. Sci. 2022, 23, 1256. [Google Scholar] [CrossRef] [PubMed]
- Lin, H.; Wang, C.; Yu, H.; Liu, Y.; Tan, L.; He, S.; Li, Z.; Wang, C.; Wang, F.; Li, P. Protective effect of total Saponins from American ginseng against cigarette smoke-induced COPD in mice based on integrated metabolomics and network pharmacology. Biomed. Pharmacother. 2022, 149, 112823. [Google Scholar] [CrossRef] [PubMed]


| NO. | tR (min) | Formula | Theoretical Mass (Da) | Calculated Mass (Da) | Mass Error (ppm) | MSE Fragmentation | Identification | Ref. |
|---|---|---|---|---|---|---|---|---|
| 1 * | 0.71 | C7H12O6 | 192.0634 | 192.0643 | 4.69 | 191.0570[M–H]−, 173.0443[M–H–H2O]− | Quinic acid | S |
| 2 * | 0.79 | C16H18O9 | 354.0951 | 354.0961 | 2.82 | 353.0988[M–H]−, 191.0569[M–H–C9H6O3]−, 179.0338[M–H–C7H10O5]−, 135.0451[M–H–C8H10O7]− | Chlorogenic acid | S |
| 3 * | 0.82 | C6H12O6 | 180.0634 | 180.0637 | 1.67 | 179.0564[M–H]−, 131.0358[M–H–H2O–CH2O]−, 103.0404[M–H–H2O–C2H5O2]− | D-Galactose | [21] |
| 4 * | 0.83 | C30H38O15 | 638.2211 | 638.2232 | 3.29 | 683.2214[M–H]−, 489.1377[M–H–Fuc]−, 458.1828[M–H–C9H7O4]−, 161.0201[M–H–Glu–Fuc–C8H11O2]− | Sucrose | [22] |
| 5 * | 0.83 | C12H22O11 | 342.1162 | 342.1179 | 4.97 | 341.1106[M–H]−, 179.0571[M–H–Glu]−, 161.0465[M–H–OFru]− | Cistanoside C | [23] |
| 6 * | 0.94 | C10H17NO3 | 199.1208 | 199.1213 | 2.51 | 200.1286[M+H]+, 168.1017[M+H–CH3O]+, 126.0930[M+H–C2H4–H2O–CH3O]+, 122.0978[M+H–H2O–C2H3O2]+, 94.0687[M+H–C2H4–H2O–C2H3O2]+ | Tussilagine | [24] |
| 7 * | 0.96 | C14H18O9 | 330.0951 | 330.0961 | 3.03 | 329.0889[M–H]−, 167.0356[M–H–Glu]− | Mudanoside A | [25] |
| 8 * | 0.98 | C13H16O10 | 332.0743 | 332.0754 | 3.31 | 331.0681[M–H]−, 168.0068[M–H–Glu]−, 124.0173[M–H–Glu–CO2]− | Glucogallin | [26] |
| 9 * | 1.01 | C7H6O4 | 154.0266 | 154.0264 | –1.30 | 153.0192[M–H]−, 109.0281[M–H–HCOOH]− | Protocatechuic acid | S |
| 10 * | 1.03 | C11H12O6 | 240.0634 | 240.0643 | 3.75 | 285.0625[M+HCOO]−, 239.0564[M–H]−, 149.0597[M–H–2HCOOH]−, 108.0518[M–H–C4H2O5]− | Eucomic acid | [27] |
| 11 * | 1.08 | C15H21NO7 | 327.1318 | 327.1323 | 1.53 | 328.1395[M+H]+, 310.1288[M+H–H2O]+, 292.1183[M+H–2H2O]+, 264.1229[M+H–H2O–HCOO]+, 166.0867[M+H–C6H10O5]+ | Fructose-phenylalanine | [28] |
| 12 * | 1.13 | C14H20O9 | 332.1107 | 332.1121 | 4.22 | 331.1049[M–H]−, 168.0431[M–H–Glu]−, 154.0237[M–H–Glu–CH3]−, 139.0028[M–H–Glu–2CH3]−, 137.0246[M–H–Glu–CH3O]− | Leonuriside A | [29] |
| 13 * | 1.16 | C16H18O9 | 354.0951 | 354.0964 | 3.75 | 353.0887[M–H]−, 191.0568[M–H–C9H6O3]−, 135.0456[M–H–C8H10O7]− | Neochlorogenic acid | S |
| 14 * | 1.20 | C15H18O9 | 342.0951 | 342.0965 | 4.09 | 341.0892[M–H]−, 179.0342[M–H–Glu]−, 135.0446[M–H–Glu–CO2]− | Phoeniceoside | [30] |
| 15 * | 1.24 | C15H18O8 | 326.1002 | 326.1011 | 2.76 | 325.0938[M–H]−, 163.0413[M–H–Glu]−, 119.0513[M–H–Glu–HCOOH]− | Melilotoside | [31] |
| 16 * | 1.30 | C18H18O5 | 314.1154 | 314.1162 | 3.18 | 315.1235[M+H]+, 193.0875[M+H–C7H6O2]+, 147.0451[M+H–CH3O–C8H9O2]+, 137.0622[M+H–C10H10O3]+ | p-Hydroxyphenethyl ferulate | CFM-ID |
| 17 * | 1.31 | C7H6O4 | 154.0266 | 154.0270 | 2.60 | 153.0197[M–H]−, 109.0293[M–H–HCOOH]− | 3,4-Dihydroxybenzoic acid | [32] |
| 18 * | 1.45 | C9H7NO | 145.0528 | 145.0523 | −3.45 | 146.0595[M+H]+, 118.0655[M+H–CHO]+ | Indole-3-aldehyde | [33] |
| 19 * | 1.47 | C27H28N2O4 | 444.2049 | 444.2035 | −3.16 | 443.1962[M–H]−, 252.1025[M–H–C11H13O2N]− | Cryptochlorogenic acid | S |
| 20 * | 1.47 | C16H18O9 | 354.0951 | 354.0962 | 3.11 | 353.0889[M–H]−, 307.0824[M–H–HCOOH]−, 191.0566[M–H–C9H6O3]−, 146.0587[M–H–C9H6O3–HCOOH]− | Aurantiamide acetate | [34] |
| 21 * | 1.67 | C10H12O4 | 196.0736 | 196.0742 | 3.06 | 241.0724[M+HCOO]−, 195.0661[M–H]−, 179.0721[M–H–H2O]−, 165.0563[M–H–CH3O]− | Acetosyringone | [35] |
| 22 * | 1.76 | C18H26O9 | 386.1577 | 386.1590 | 3.37 | 431.1572[M+HCOO]−, 385.1503[M–H]−, 223.0995[M–H–Glu]−, 135.0467[M–H–OGlu–C4H7O]− | Methylsyringin | [36] |
| 23 | 1.78 | C19H27NO6 | 365.1838 | 365.1844 | 1.62 | 366.1917[M+H]+, 330.1704[M+H–2H2O]+, 262.1437[M+H–H2O–C4H7O2]+ | Pulchellamine B | [37] |
| 24 * | 1.82 | C14H18O7 | 298.1053 | 298.1067 | 4.70 | 343.1039[M+HCOO]−, 164.0695[M–H–C8H7O2]−, 133.0303[M–H–Glu]−, 121.0300[M–H–Glu–CH3]− | Ameliaroside | [38] |
| 25 * | 1.88 | C20H27NO6 | 377.1838 | 377.1846 | 2.12 | 378.1919[M+H]+, 360.1802[M+H–H2O]+, 332.1862[M+H–HCOOH]+, 314.1749[M+H–HCOOH–H2O]+, 227.1060[M+H–2H2O–C5H9NO2]+ | Calophyllamine A | [39] |
| 26 | 1.97 | C17H24O9 | 372.1420 | 372.1433 | 3.49 | 417.1445[M+HCOO]−, 371.1351[M–H]−, 209.0821[M–H–Glu]−, 194.0586[M–H–CH3–Glu]−, 151.0409[M–H–Glu–C3H5O]− | Syringin | [26] |
| 27 * | 2.08 | C20H20O8 | 388.1158 | 388.1156 | −0.51 | 411.1048 [M+Na]+, 389.1232[M+H]+, 371.1133[M+H–H2O]+, 167.0720[M+H–C11H10O5]+ | 6α-Catechyl-2α-guaicyl-3,7-dioxabicyclo [3.3.0]octan-4-one | [40] |
| 28 * | 2.26 | C7H6O3 | 138.0317 | 138.0323 | 4.35 | 137.0251[M–H]−, 109.0302[M–H–CHO]− | Protocatechuic aldehyde | S |
| 29 * | 2.36 | C15H20O8 | 328.1158 | 328.1168 | 3.05 | 327.1095[M–H]−, 165.0562[M–H–Glu]−, 147.0453[M–H–H2O–Glu]− | Paeonoside | [41] |
| 30 * | 2.48 | C17H24O10 | 388.1369 | 388.1387 | 4.61 | 387.1305[M–H]−, 371.0989[M–H–CH3]−, 207.0664[M–H–OGlu]−, 192.0432[M–H–Glu–CH3O]− | Geniposide | [42] |
| 31 * | 2.57 | C16H18O8 | 338.1002 | 338.1010 | 2.37 | 337.0931[M–H]−, 191.0562[M–H–C9H7O2]−, 163.0402[M–H–C7H11O5]− | 3-p-Coumaroylquinic acid | [43] |
| 32 * | 2.61 | C8H8O4 | 168.0423 | 168.0426 | 1.79 | 167.0373[M–H]−, 123.0355[M–H–HCOOH]−, 108.0216[M–H–HCOOH–CH3]−, 93.0343[M–H–HCOOH–CH3O]− | Vanillic acid | [44] |
| 33 * | 2.77 | C9H10O5 | 198.0528 | 198.0551 | 1.51 | 197.0449[M–H]−, 179.0345[M–H–H2O]−, 135.0444[M–H–H2O–HCOOH]− | Syringic acid | [45] |
| 34 * | 2.80 | C17H26O7 | 342.1679 | 342.1692 | 3.80 | 387.1664[M+HCOO]−, 341.1608[M–H]−, 163.1127[M–H–OGlu]− | Jasmolone glucoside | CFM-ID |
| 35 * | 2.81 | C9H8O4 | 180.0423 | 180.0422 | −0.56 | 179.0340[M–H]−, 135.0438[M–H–HCOOH]− | Caffeic acid | S |
| 36 * | 2.82 | C20H27NO6 | 377.1838 | 377.1831 | −1.92 | 378.1904[M+H]+, 332.1854[M+H–HCOOH]+, 257.1408[M+H–2H2O–CH2–C3H3O2]+, 235.0971[M+H–C3H3O2–C4H8N]+, 206.0939[M+H–C3H3O2–C5H8NO]+ | Lanicepomine A | [37] |
| 37 * | 2.98 | C13H18O6 | 270.1103 | 270.1111 | 2.96 | 315.1113[M+HCOO]−, 269.1029[M–H]−, 161.0455[M–H–C7H8O]− | Benzyl β-D-glucoside | [46] |
| 38 * | 3.06 | C15H16O6 | 292.0947 | 292.0958 | 3.77 | 337.0930[M+HCOO]−, 291.0873[M–H]−, 163.0414[M–H–H2O–C2HO–C4H5O]− | Cnidimol D | [47] |
| 39 * | 3.50 | C11H14O5 | 226.0841 | 226.0844 | 1.34 | 225.0770[M–H]−, 195.0663[M–H–CH3O]−, 180.0427[M–H–C2H5O]−, 149.0240[M–H–CH3O–C2H5O]− | 3-Hydroxy-1-(4-hydroxy-3,5-dimethoxyphenyl)propan-1-one | [48] |
| 40 * | 3.52 | C26H34O12 | 538.2050 | 538.2058 | 1.49 | 583.2031[M+HCOO]−, 537.1982[M–H]−, 375.1454[M–H–Glu]−, 357.1342[M–H–Glu–H2O]−, 151.0407[M–H–Glu–C12H16O4]− | Medusaside A | [49] |
| 41 * | 3.58 | C17H20O9 | 368.1107 | 368.1110 | 0.81 | 367.1037[M–H]−, 191.0564[M–H–CH3–C9H5O3]−, 161.0241[M–H–C8H14O6]−, 135.0450[M–H–C9H12O7]− | Methyl 3-caffeoylquinate | [50] |
| 42 * | 3.70 | C19H32O8 | 388.2097 | 388.2116 | 4.89 | 433.2099[M+HCOO]−, 387.2030[M–H]−, 225.1501[M–H–Glu]−, 153.0920[M–H–C4H7O–Glu]− | Icariside B8 | CFM-ID |
| 43 * | 3.72 | C26H34O12 | 538.2050 | 538.2068 | 3.34 | 583.2039[M+HCOO]−, 537.1980[M–H]−, 375.1451[M–H–Glu]−, 153.0927[M–H–C17H20O10]− | Medusaside B | [49] |
| 44 * | 3.73 | C19H30O8 | 386.1941 | 386.1949 | 2.07 | 431.1961 [M+HCOO]−, 385.1970[M–H]−, 223.1344[M–H–Glu]−, 205.1231[M–H–Glu–H2O]− | Saussureoside B | [51] |
| 45 | 4.21 | C20H29NO6 | 379.1995 | 379.2002 | 1.85 | 380.2075[M+H]+, 334.2013[M+H–HCOOH]+, 316.1910[M+H–HCOOH–H2O]+, 215.1075[M+H–2H2O–C6H11NO2]+ | Pulchellamine E | [37] |
| 46 * | 4.29 | C9H10O3 | 166.0630 | 166.0635 | 3.01 | 165.0562[M–H]−, 147.0452[M–H–H2O]− | Phloretic acid | [52] |
| 47 * | 4.37 | C26H34O12 | 538.2050 | 538.2069 | 3.53 | 537.1986[M–H]−, 375.1451[M–H–Glu]−, 327.1240[M–H–Glu–H2O–CH3O]−, 297.1136[M–H–Glu–H2O-2CH3O]−, 225.1250[M–H–Glu–C8H7O3]– | Lanicepside A | [53] |
| 48 * | 4.44 | C8H8O2 | 136.0524 | 136.0527 | 2.21 | 135.0455[M–H]−, 120.0213[M–H–CH3]−, 92.0267[M–H–C2H3O]− | Curculigoside C | [54] |
| 49 * | 4.44 | C22H26O12 | 482.1424 | 482.1439 | 3.11 | 481.1346[M–H]−, 197.0455[M–H–Glu– C7H5O2]−, 121.0295[M–H–Glu–C9H9O5]− | p-Hydroxyacetophenone | [55] |
| 50 * | 4.49 | C21H34O9 | 430.2203 | 430.2220 | 3.95 | 429.2127[M–H]−,401.1817[M–H–C2H4]−, 267.1603[M–H–Glu]− | 4α(15),11β(13)-Tetrahydroridentin B-1 -glucoside | [56] |
| 51 * | 4.56 | C26H34O12 | 538.2050 | 538.2067 | 3.16 | 537.2064[M–H]−, 327.1240[M–H–Glu–H2O–CH3O]−, 195.0664[M–H–Glu–C10H11O3]−, 161.0464[M–H–C20H24O7]− | Citrusin A | [57] |
| 52 * | 4.64 | C26H34O12 | 538.2050 | 538.2070 | 3.72 | 583.2048[M+HCOO]−, 537.1982[M–H]−, 375.1442[M–H–Glu]−, 327.1245[M–H–Glu–H2O–CH3O]−, 179.0561[M–H–C20H22O6]− | Lanicepside B | [53] |
| 53 * | 4.66 | C32H42O16 | 682.2473 | 682.2499 | 3.81 | 727.2481[M+HCOO]−, 681.2411[M–H]−, 519.1877[M–H–Glu]−, 339.1242[M–H–2Glu–H2O]− | Pinoresinol diglucoside | S |
| 54 * | 4.73 | C27H36O13 | 568.2156 | 568.2166 | 1.76 | 613.2188[M+HCOO]−, 567.2092[M–H]−, 521.2040[M–H–H2O–CH3O]−, 405.1565[M–H–Glu]−, 195.0662[M–H–Glu–C11H13O4]− | Citrusin B | CFM-ID |
| 55 * | 5.01 | C26H36O11 | 524.2258 | 524.2240 | −3.43 | 523.2167[M–H]−, 507.1880[M–H–CH3]−, 361.1690[M–H–Glu]−, 346.1771[M–H–Glu–CH3]−, 315.1331[M–H–Glu–CH3–CH3O]− | (-)-Secoisolariciresinol-4-O-β-D-glucoside | [58] |
| 56 * | 5.01 | C17H20O9 | 368.1107 | 368.1116 | 2.44 | 367.1033[M–H]−, 179.0346[M–H–C8H12O5]−, 161.0247[M–H–C8H14O6]−, 135.0472[M–H–C9H12O7]− | Methyl 4-caffeoylquinate | [59] |
| 57 * | 5.08 | C19H24O8 | 380.1471 | 380.1484 | 3.42 | 425.1466[M+HCOO]−, 379.1404[M–H]−, 343.1188[M–H–2H2O]− | 15-Hydroxyjanerin | CFM-ID |
| 58 | 5.11 | C21H31NO6 | 393.2151 | 393.2163 | 3.05 | 416.2095[M+Na]+, 394.2241[M+H]+, 378.1929[M+H–CH3]+, 342.1711[M+H–CH3–2H2O]+, 262.1448[M+H–C6H12O2–H2O]+, 228.1161[M+H–C6H12NO2–2H2O]+ | Pulchellamine G | [37] |
| 59 * | 5.21 | C28H38O13 | 582.2312 | 582.2303 | −1.55 | 581.2230[M–H]−, 419.1720[M–H–Glu]−, 389.1603[M–H–Glu–CH3O]−, 373.1298[M–H–Glu–CH3–CH3O]− | Lyoniresinol-3α-glucoside | [60] |
| 60 * | 5.28 | C21H18O12 | 462.0798 | 462.0806 | 1.73 | 461.0734[M–H]−, 285.0404[M–H–Gluac]−, 151.0049[M–H–Gluac–C8H6O2]−, 132.0210[M–H–Gluac–C7H4O4]− | Luteolin 7-glucuronide | S |
| 61 | 5.32 | C27H30O16 | 610.1534 | 610.1530 | −0.66 | 609.1457[M–H]−, 461.0731[M–H–Rha]−, 300.0281[M–H–Glu–Rha]− | Rutin | S |
| 62 * | 5.57 | C21H20O12 | 464.0955 | 464.0978 | 4.96 | 463.0906[M–H]−, 300.0280[M–H–Glu]−, 151.0041[M–H–Glu–C8H5O3]−, 150.0328[M–H–Glu–C7H4O4]− | Isoquercitroside | S |
| 63 * | 5.62 | C19H22O5 | 330.1467 | 330.1475 | 2.42 | 375.1447[M+HCOO]−, 329.1395[M–H]−, 297.1131[M–H–CH3–H2O]−, 282.0899[M–H–CH3–CH2–H2O]−, 226.0641[M–H–H2O–CH2–C4H7O]− | Aguerin B | [61] |
| 64 * | 5.66 | C27H34O12 | 550.2050 | 550.2069 | 3.45 | 595.2042[M+HCOO]−, 549.1984[M–H]−, 519.1876[M–H–CH3O]−, 387.1454[M–H–Glu]− | Saussurenoside | [62] |
| 65 * | 5.72 | C15H10O7 | 302.0427 | 302.0435 | 2.65 | 303.0508[M+H]+, 178.0272[M+H– C6H5O3]+, 153.0195[M+H–C8H5O3]+, 108.0216[M+H–H2O–C9H5O4]+ | Isoetin | [63] |
| 66 * | 5.76 | C25H24O12 | 516.1268 | 516.1287 | 3.68 | 515.1204[M–H]−, 353.0885[M–H–C9H6O3]−, 335.0776[M–H–C9H9O4]−, 191.0570[M–H–2C9H6O3]−, 179.0353[M–H–C16H16O8]− | 1,4-Dicaffeoylquinic acid | S |
| 67 * | 5.96 | C27H30O15 | 594.1585 | 594.1598 | 2.19 | 593.1515[M–H]−, 285.0407[M–H–Rut]− | Luteolin-7-rutinoside | [64] |
| 68 * | 6.03 | C25H24O12 | 516.1268 | 516.1271 | 0.58 | 515.1198[M–H]−, 353.0878[M–H–C9H6O3]−, 191.0561[M–H–2C9H6O3]−, 179.0352[M–H–C16H16O8]− | 1,5-Dicaffeoylquinic acid | S |
| 69 * | 6.06 | C28H32O16 | 624.1690 | 624.1720 | 4.81 | 623.1647[M–H]−, 351.0735[M–H–ORha–C6H4O2]−, 315.0530[M–H–Rut]− | Narcisin | S |
| 70 * | 6.15 | C27H30O14 | 578.1636 | 578.1653 | 2.94 | 577.1580[M–H]−, 269.0474[M–H–Neo]− | Rhoifolin | [65] |
| 71 * | 6.18 | C21H18O11 | 446.0849 | 446.0868 | 4.26 | 445.0791[M–H]−, 284.0322[M–H–Glu]−, 269.0464[M–H– OGlu]− | Rhein-8-glucoside | [66] |
| 72 | 6.29 | C22H26O8 | 418.1628 | 418.1639 | 2.63 | 417.1567[M–H]−, 402.1271[M–H–CH3]−, 387.1080[M–H–2CH3]−, 181.0521[M–H–C13H11O4]− | Syringaresinol | S |
| 73 | 6.29 | C21H20O11 | 448.1006 | 448.1021 | 3.35 | 447.0938[M–H]−, 301.0375[M–H–Rha]−, 283.0255[M–H–Rha–H2O]−, 151.0043[M–H–Rha–C8H5O3]− | Quercitrin | S |
| 74 | 6.31 | C26H32O12 | 536.1894 | 536.1901 | 1.31 | 535.1823[M–H]−, 501.1768[M–H–2H2O]−, 355.1188[M–H–Glu–H2O]−, 151.0405[M–H–Glu–C12H13O4]− | 1-Hydroxypinoresinol-1 -glucoside | [67] |
| 75 * | 6.36 | C21H20O10 | 432.1056 | 432.1075 | 4.40 | 477.1057[M+HCOO]−, 431.0993[M–H]−, 285.0405[M–H–Rha]−, 161.0464[M–H–C15H10O5]− | Afzelin | [68] |
| 76 * | 6.45 | C25H24O12 | 516.1268 | 516.1292 | 4.65 | 515.1219[M–H]−, 353.0891[M–H–C9H6O3]−, 191.0579[M–H–2C9H6O3]−, 179.0359[M–H–C16H16O8]− | 4,5-Dicaffeoylquinic acid | S |
| 77 * | 6.47 | C21H20O10 | 432.1056 | 432.1071 | 3.47 | 431.0988[M–H]−, 269.0461[M–H–Glu]− | Cosmosiin | [68] |
| 78 * | 6.57 | C26H32O11 | 520.1945 | 520.1931 | −2.71 | 565.1913[M+HCOO]−, 519.1851[M–H]−, 357.1323[M–H–Glu]−, 151.0387[M–H–Glu–C12H13O3]− | Pinoresinol 4- glucoside | S |
| 79 * | 6.63 | C9H16O4 | 188.1049 | 188.1050 | 0.53 | 187.0977[M–H]−, 143.1081[M–H–HCOOH]−, 125.0968[M–H–H2O–HCOOH]− | Azelaic acid | [69] |
| 80 * | 6.67 | C22H22O11 | 462.1162 | 462.1151 | −2.38 | 461.1078[M–H]−, 446.0853[M–H–CH3]−, 298.0472[M–H–Glu]−, 283.0244[M–H–Glu–CH3]− | Thermopsoside | [70] |
| 81 * | 6.82 | C34H30O15 | 678.1585 | 678.1606 | 3.10 | 677.1513[M–H]−, 515.1194[M–H–C9H6O3]−, 497.1098[M–H–C9H8O4]−, 353.0881[M–H–2C9H6O3]−, 179.0346[M–H–C25H22O11]− | 1,3,5-Tricaffeoylquinic acid | [71] |
| 82 * | 6.89 | C20H26O8 | 394.1628 | 394.1641 | 3.30 | 417.1533[M+Na]+, 395.1713[M+H]+, 359.1508[M+H–2H2O]+, 350.1378[M+H–C2H5O]+, 327.1243[M+H–2H2O–CH3O]+, 229.0776[M+H–C2H5O–H2O–C4H7O3]+ | Methoxyjanerin | [72] |
| 83 * | 6.93 | C20H26O6 | 362.1729 | 362.1737 | 2.21 | 361.1664[M–H]−, 346.1428[M–H–CH3]−, 327.1231[M–H–H2O–CH3]−, 315.1247[M–H–CH3–CH3O]−, 165.0563[M–H–C10H13O3–CH3]− | Secoisolariciresinol | S |
| 84 * | 7.00 | C21H22O7 | 386.1366 | 386.1361 | −1.29 | 387.1434[M+H]+, 163.0400[M+H–C10H10O4–2CH3]+, 135.0453[M+H–C13H16O5]+ | Conicaol B | [73] |
| 85 * | 7.06 | C26H32O11 | 520.1945 | 520.1959 | 2.69 | 519.1876[M–H]−, 357.1345[M–H–Glu]−, 342.1116[M–H–Glu–CH3]−, 121.0305[M–H–Glu–C13H15O4]− | Matairesinoside | S |
| 86 * | 7.09 | C20H28O7 | 380.1835 | 380.1852 | 4.47 | 425.1827[M+HCOO]−, 379.1772[M–H]−, 221.0840[M–H–C8H14O3]−, 209.0834[M–H–C9H14O3]− | Elemacarmanin | CFM-ID |
| 87 * | 7.10 | C18H22O6 | 334.1416 | 334.1421 | 1.50 | 357.1353[M+Na]+, 335.1502[M+H]+, 317.1404[M+H–H2O]+, 137.0614[M+H–H2O–C8H9O–C2H3O2]+ | 7α-Hydroxygerin | [74] |
| 88 * | 7.14 | C20H22O4 | 326.1518 | 326.1524 | 1.84 | 327.1597[M+H]+, 203.1089[M+H–C7H8O2]+, 189.0924[M+H–C7H7O2–CH3]+, 137.0614[M+H–C12H14O2]+ | Dehydrodiisoeugenol | [75] |
| 89 * | 7.28 | C22H24O8 | 416.1471 | 416.1469 | −0.48 | 417.1542[M+H]+, 399.1435[M+H–H2O]+, 358.1362[M+H–C2H2O2]+, 137.0613[M+H–H2O–C14H14O5]+ | Acetoxypinoresinol | CFM-ID |
| 90 * | 7.35 | C30H34O10 | 554.2152 | 554.2171 | 3.43 | 553.2089[M–H]−, 535.1990[M–H–H2O]−, 357.1352[M–H–H2O–C10H10O3]−, 181.0877[M–H–C20H20O7]− | Lappaol E | [76] |
| 91 * | 7.49 | C18H18O3 | 282.1256 | 282.1267 | 3.90 | 327.1249[M+HCOO]−, 239.0726[M–H–C3H6]−, 197.0626[M–H–C3H5–C2H3–H2O]−, 163.0405[M–H–C9H10]− | Obovatol | [77] |
| 92 * | 7.50 | C20H20O5 | 340.1311 | 340.1321 | 2.94 | 339.1248[M–H]−, 324.1008[M–H–CH3]−, 293.0825[M–H–CH3–CH3O]−, 265.0519[M–H–H2O–C4H8]− | Licocoumarone | [78] |
| 93 * | 7.51 | C20H22O6 | 358.1416 | 358.1425 | 2.51 | 357.1342[M–H]−, 342.1117[M–H–CH3]−, 151.0405[M–H–C12H16O3]−, 136.0538[M–H–C12H11O3–H2O]− | Pinoresinol | S |
| 94 * | 7.68 | C30H34O10 | 554.2152 | 554.2168 | 2.89 | 553.2095[M–H]−,535.1954[M–H–H2O]−, 517.1888[M–H–2H2O]− | Lappaol C | [79] |
| 95 * | 7.72 | C17H20O4 | 288.1362 | 288.1376 | 4.86 | 311.1268[M+Na]+, 289.1457[M+H]+, 230.1312[M+H–C2H3O2]+, 202.1370[M+H–C2H3O2–CO]+ | 8α-Acetoxydehydrocostuslactone | [80] |
| 96 * | 8.00 | C27H34O11 | 534.2101 | 534.2118 | 3.18 | 579.2090[M+HCOO]−, 533.2035[M–H]−, 371.1512[M–H–Glu]−, 356.1280[M–H–Glu–CH3]−, 136.0535[M–H–Glu–C13H14O4]−, 121.0306[M–H–Glu–CH3–C13H14O4]− | Arctiin | S |
| 97 * | 8.18 | C15H10O6 | 286.0477 | 286.0488 | 3.85 | 285.0415[M–H]−, 151.0044[M–H–C8H6O2]−, 133.0308[M–H–C7H4O4]−, 107.0144[M–H–C9H6O4]− | Luteolin | S |
| 98 * | 8.23 | C8H8O2 | 136.0524 | 136.0521 | −2.21 | 137.0613[M+H]+, 122.0364[M+H–CH3]+, 94.0407[M+H–C2H3O]+ | Phenyl acetate | [81] |
| 99 * | 8.24 | C34H30O15 | 678.1585 | 678.1614 | 4.28 | 677.1521[M–H]−, 515.1210[M–H–C9H6O3]−, 353.0895[M–H–2C9H6O3]−, 335.0788[M–H–C9H7O3–C9H7O4]−, 179.0352[M–H–C25H22O11]− | 3,4,5–Tricaffeoylquinic acid | [82] |
| 100 * | 8.26 | C21H24O6 | 372.1573 | 372.1583 | 2.69 | 373.1656[M+H]+, 355.1549[M+H–H2O]+, 137.0617[M+H–C13H16O4]+, 122.0386[M+H–C14H19O4]+ | Phillygenin | S |
| 101 * | 8.46 | C30H36O9 | 540.2359 | 540.2381 | 4.07 | 585.2352[M+HCOO]−, 539.2308[M–H]−, 521.2194[M–H–H2O]−, 509.2192[M–H–CH3O]−, 371.1505[M–H–CH3O–C8H9O2]−, 297.1145[M–H–H2O–C12H16O4]− | Sesquipinsapol B | [83] |
| 102 * | 8.54 | C16H12O7 | 316.0583 | 316.0596 | 4.11 | 317.0668[M+H]+, 302.0429 [M+H–CH3]+, 168.0062[M+H–CH3–C8H6O2]+, 140.0506[M+H–C9H5O4]+ | Eupafolin | S |
| 103 * | 9.04 | C15H24O2 | 236.1776 | 236.1786 | 4.23 | 237.1858[M+H]+, 219.1771[M+H–H2O]+, 108.0945[M+H–C7H13O2]+, 92.0631[M+H–C3H7O–H2O–C5H8]+ | Eudesma-4(14),11(13)-diene-3β,12-diol | [84] |
| 104 * | 9.08 | C31H36O10 | 568.2308 | 568.2328 | 3.52 | 567.2256[M–H]−, 535.1982[M–H–CH3O]−, 517.1888[M–H–H2O–CH3O]−, 191.0714[M–H–C20H24O7]− | Lappaol D | [79] |
| 105 * | 9.28 | C34H37N3O6 | 583.2682 | 583.2684 | 0.34 | 584.2757[M+H]+, 438.2385[M+H–C9H6O2]+, 292.2026[M+H–2C9H6O2]+, 275.1765[M+H–C9H6O2–C9H9NO2]+, 147.0453[M+H–C25H31N3O4]+ | N1,N5,N10-Tri-p-coumaroylspermidine | [85] |
| 106 * | 9.33 | C15H10O5 | 270.0528 | 270.0539 | 4.07 | 269.0456[M–H]−, 151.0039[M–H–C8H6O]−, 117.0356[M–H–C7H8O4]−, 107.0145[M–H–C9H6O3]− | Apigenin | S |
| 107 | 9.38 | C26H30N2O6 | 466.2104 | 466.2087 | −3.65 | 489.1989[M+Na]+, 467.2160[M+H]+, 321.1205[M+H–CH3–C9H9N]+, 303.1119[M+H–H2O–CH3–C9H9N]+, 265.1430[M+H–C11H10N2O2]+, 202.0747[M+H–C15H21O4]+ | Pulchellamine F | [37] |
| 108 * | 9.47 | C20H22O6 | 358.1416 | 358.1431 | 4.19 | 357.1348[M–H]−, 342.1113[M–H–CH3]−, 179.0718[M–H–C10H10O3]−, 165.0563[M–H–C10H9O3–CH3]−, 122.0370[M–H–C13H15O4]− | Matairesinol | S |
| 109 * | 9.61 | C16H12O6 | 300.0634 | 300.0640 | 2.00 | 299.0568[M–H]−, 284.0330[M–H–CH3]−, 256.0384[M–H–C2H3O]−, 161.0246[M–H–C7H6O3]− | Hispidulin | S |
| 110 * | 9.71 | C18H22O5 | 318.1467 | 318.1476 | 2.83 | 341.1378[M+Na]+, 319.1556[M+H]+, 287.1297[M+H–CH3O]+, 189.0917[M+H–C2H4O–C4H6O2]+ | Gerin | [74] |
| 111 * | 9.81 | C18H32O5 | 328.2250 | 328.2260 | 3.05 | 327.2228[M–H]−, 291.1969[M–H–2H2O]−, 229.1455[M–H–C6H10O]−, 183.1392[M–H–H2O–C7H10O2]−, 171.1040[M–H–C9H16O2]− | Malyngic acid | CFM-ID |
| 112 | 10.05 | C16H28O2 | 252.2089 | 252.2099 | 3.96 | 275.2001[M+Na]+, 253.2178[M+H]+, 219.1756[M+H–H2O–CH3]+, 149.0969[M+H–CH3–C5H11O]+ | 7δ-Methoxy-4(14)-oppositen-1β-ol | [86] |
| 113 * | 10.61 | C15H22O2 | 234.1620 | 234.1623 | 1.28 | 235.1705[M+H]+, 177.1273[M+H–H2O–C3H4]+, 163.1480[M+H–C3H2O2]+, 121.0663[M+H–H2O–C7H12]+ | Germacra-1(10),4,11(13)-trien-12-oic acid | [87] |
| 114 * | 10.65 | C18H34O5 | 330.2406 | 330.2417 | 3.33 | 329.2335[M–H]−, 229.1447[M–H–C6H12O]−, 211.1343[M–H–C6H12O–H2O]−, 99.0814[M–H–C12H22O4]− | 9,12,13-TriHOME | CFM-ID |
| 115 * | 10.69 | C30H32O9 | 536.2046 | 536.2063 | 3.17 | 535.2021[M–H]−, 505.1877[M–H–CH3O]−, 490.1633[M–H–CH3–CH3O]− | Lappaol A | [88] |
| 116 * | 10.96 | C21H24O6 | 372.1573 | 372.1587 | 3.76 | 371.1501[M–H]−, 356.1264[M–H–CH3]−, 136.0528[M–H–C13H15O4]−, 121.0094[M–H–C13H15O4–CH3]−, 83.0144[M–H–C9H11O2–C8H9O2]− | Arctigenin | S |
| 117 * | 11.14 | C21H22O6 | 370.1416 | 370.1421 | 1.35 | 371.1493[M+H]+, 219.0652[M+H–C9H12O2]+, 151.0766[M+H–C12H12O4]+, 137.0606[M+H–C13H14O4]+, 107.0500[M+H–C13H14O4–CH3O]+ | (+)-7,8-Didehydroarctigenin | [89] |
| 118 * | 12.10 | C15H20O2 | 232.1463 | 232.1472 | 3.88 | 233.1545[M+H]+, 203.1084[M+H–2CH3]+, 189.1630[M+H–CO2]+, 149.1335[M+H–C4H4O2]+ | Costunolide | [87] |
| 119 * | 12.94 | C15H22O2 | 234.1620 | 234.1625 | 2.14 | 235.1699[M+H]+, 161.1320[M+H–C3H6O2]+, 133.1022[M+H–C5H10O2]+, 121.1026[M+H–C6H10O2]+, 81.0712[M+H–C9H14O2]+ | Costic acid | [90] |
| 120 * | 14.58 | C42H46O12 | 742.2989 | 742.2978 | −1.48 | 765.2856[M+Na]+, 743.3051[M+H]+, 725.2928[M+H–H2O]+, 707.2841[M+H–2H2O]+, 151.0763[M+H–C33H36O10]+, 137.0601[M+H–C13H15O4–C21H23O6]+ | Diarctigenin | [91] |
| 121 * | 15.17 | C42H46O12 | 742.2989 | 742.2991 | 0.27 | 765.2867[M+Na]+, 743.3063[M+H]+, 725.2951[M+H–H2O]+, 707.2834[M+H–2H2O]+, 151.0465[M+H–C33H36O10]+, 137.0612[M+H–C34H38O10]+ | Conicaol A | [91] |
| 122 * | 15.41 | C28H50O2 | 418.3811 | 418.3830 | 4.54 | 441.3725[M+Na]+, 419.3898[M+H]+, 259.2380[M+H–H2O–C9H18O]+, 151.1500[M+H–H2O–C17H30O]+, 95.0880[M+H–H2O–C21H38O]+ | Ergostane-3,24-diol | CFM-ID |
| 123 * | 16.06 | C15H18O2 | 230.1307 | 230.1315 | 3.48 | 231.1388[M+H]+, 203.1441[M+H–CO]+, 121.1028[M+H–C6H6O2]+, 105.0718[M+H–C7H10O2]+ | Dehydrocostus lactone | S |
| 124 * | 16.35 | C26H48NO7P | 517.3168 | 517.3181 | 2.51 | 518.3254[M+H]+, 184.0744[M+H– C21H34O3]+, 104.1100[M+H–C21H35O6P]+, 86.0986[M+H– C21H37O7P]+ | LPC (18:3) | CFM-ID |
| 125 * | 16.40 | C15H22O | 218.1671 | 218.1680 | 4.13 | 219.1757[M+H]+, 203.1444[M+H–CH3]+, 162.1419[M+H–C3H5O]+ | Germacra-1(10),4,11(13)-trien-12-al | [92] |
| 126 * | 16.68 | C18H36O4 | 316.2614 | 316.2628 | 4.43 | 315.2545[M–H]−, 297.2453[M–H–H2O]−, 171.1031[M–H–C9H18–H2O]−, 141.1291[M–H–C9H16O2–H2O]− | 9,10-Dihydroxystearic acid | CFM-ID |
| 127 * | 16.72 | C16H30O3 | 270.2195 | 270.222 | 2.59 | 293.2116[M+Na]+, 269.2124[M+H]+, 165.1651[M+H–C4H8O3]+, 121.1025[M+H–C7H16O3]+, 95.0869[M+H–C9H18O3]+ | (6Z)-2-Hydroxy-6-hexadecenoic acid | CFM-ID |
| 128 * | 16.78 | C18H30O3 | 294.2195 | 294.2207 | 4.08 | 293.2134[M−H]−, 275.2035[M−H−H2O]−, 249.2230[M−H−HCOOH]−, 195.1401[M− H–C6H10O]− | 13-oxo-9,11-Octadecadienoic acid | CFM-ID |
| 129 * | 17.64 | C26H50NO7P | 519.3325 | 519.3336 | 2.12 | 520.3408[M+H]+, 184.0744[M+H– C21H36O3]+, 104.1101[M+H–C21H37O6P]+, 86.1006[M+H– C21H39O7P]+ | LPC (18:2) | CFM-ID |
| 130 * | 17.92 | C18H32O3 | 296.2351 | 296.2361 | 3.38 | 295.2288[M–H]−, 277.2180[M–H2O]−, 250.2309[M–HCOOH]− | Coronaric acid | CFM-ID |
| 131 * | 18.46 | C18H30O3 | 294.2195 | 294.2203 | 2.72 | 293.2131[M–H]−, 275.2042[M−H−H2O]−, 249.2230[M−H −HCOOH]−, 113.0973[M−H–C11H16O2]− | 9-Oxo-10,12-Octadecadienoic acid | S |
| 132 * | 18.65 | C24H50NO7P | 495.3325 | 495.3337 | 2.42 | 496.3409[M+H]+, 184.0742[M+H– C19H36O3]+, 104.1100[M+H– C19H37O6P]+, 86.1006[M+H– C19H39O7P]+ | LPC (16:0) | S |
| 133 * | 19.26 | C26H52NO7P | 521.3481 | 521.3486 | 0.96 | 522.3559[M+H]+, 184.0745[M+H– C21H38O3]+, 104.1101[M+H– C21H39O6P]+, 86.1005[M+H– C21H41O7P]+ | LPC (18:1) | S |
| 134 * | 19.30 | C16H22O4 | 278.1518 | 278.1526 | 2.88 | 301.1419[M+Na]+, 279.1571[M+H]+, 149.0245[M+H–C4H9–C4H9O]+, 121.0305[M+H–C4H9–C5H9O2]+ | Dibutyl phthalate | [93] |
| 135 * | 19.38 | C18H34O3 | 298.2508 | 298.2519 | 3.69 | 297.2446[M–H]−,279.2335[M–H–H2O]−, 253.2542[M−H−HCOOH]− | Ricinoleic acid | CFM-ID |
| 136 * | 21.00 | C30H48O4 | 472.3553 | 472.3575 | 4.66 | 471.3492[M–H]−, 427.3588[M–H–HCOOH]−, 411.3273[M–H–HCOOH–CH3]− | Macrocarpoic acid A | [94] |
| 137 * | 22.39 | C18H30O2 | 278.2246 | 278.2259 | 4.67 | 277.2176[M–H]−, 259.2076[M–H–H2O]−, 109.0661[M–H–C11H18–H2O]− | Linolenic acid | S |
| 138 * | 22.58 | C16H32O3 | 272.2351 | 272.2386 | 2.21 | 271.2314[M–H]−, 225.2255[M–H–HCOOH]−, 223.2086[M–H–2H2O–CH3]−, 197.1904[M–H–2H2O–C3H7]− | 3-Hydroxyhexadecanoic acid | CFM-ID |
| 139 * | 23.98 | C30H48O | 424.3705 | 424.3700 | −1.18 | 425.3773[M+H]+, 205.1942[M+H–C15H24O]+, 189.1644[M+H–C16H28O]+, 161.1335[M+H–C18H32O]+ | Lupenone | [95] |
| 140 * | 24.04 | C18H32O2 | 280.2402 | 280.2412 | 3.57 | 279.2329[M–H]−, 261.2229 [M –H–H2O]− | Linoleic acid | S |
| 141 * | 24.25 | C30H48O | 424.3705 | 424.3695 | −2.36 | 425.3767[M+H]+, 409.3454[M+H–CH3]+, 217.1953[M+H–C14H24O]+, 137.1337[M+H–C20H32O]+ | Amyrone | [96] |
| 142 * | 24.62 | C30H48O2 | 440.3654 | 440.3651 | −0.68 | 441.3724[M+H]+, 231.2112[M+H– C13H21O]+, 187.1493[M+H–C16H28O–H2O]+ | Ptiloepoxide | [97] |
| 143 * | 24.63 | C30H48O | 424.3705 | 424.3693 | −2.83 | 425.3765[M+H]+, 205.1954[M+H– C15H24O]+, 189.1640[M+H– C16H28O]+ | Taraxasterone | [98] |
| 144 * | 24.82 | C30H48O2 | 440.3654 | 440.3658 | 0.91 | 441.3731[M+H]+, 423.3611[M+H–H2O]+, 191.1803[M+H–C16H26O2]+, 123.1191[M+H–C21H34O2]+ | 11α-Hydroxyurs-12-en-3-one | [99] |
| 145 * | 24.87 | C35H36N4O5 | 592.2686 | 592.2696 | 1.69 | 593.2769[M+H]+, 533.2556[M+H–C2H4O2]+ | Pheophorbide A | [100] |
| 146 * | 25.44 | C30H48O2 | 440.3654 | 440.3644 | −2.27 | 441.3717[M+H]+, 189.1638[M+H–C16H28O2]+, 135.1184 [M+H–C20H34O2]+ | 11-Oxo-amyrin | [101] |
| 147 * | 25.60 | C16H32O2 | 256.2402 | 256.2409 | 2.73 | 255.2326[M–H]−, 237.2208[M–H−H2O]− | Hexadecanoic acid | CFM-ID |
| 148 * | 27.87 | C28H48O2 | 416.3654 | 416.3669 | 3.60 | 461.3661[M+HCOO]−, 415.3591[M–H]−, 281.2849[M–H–C9H10O]− | β-Tocopherol | CFM-ID |
| 149 * | 28.02 | C24H38O4 | 390.2770 | 390.2770 | 0.00 | 413.2662[M+Na]+, 391.2847[M+H]+, 149.0247[M+H–C8H17–C8H17O]+ | Dioctyl phthalate | [102] |
| No. | Compound | Regression Equations | R2 | linearity Range (μg·mL−1) | LOD (μg·mL−1) | LOQ (μg·mL−1) | Content (%) |
|---|---|---|---|---|---|---|---|
| 2 | Chlorogenic acid | y = 35.49x + 468.5 | 0.9991 | 1~100 | 0.20 | 1.0 | 4.60 |
| 13 | Neochlorogenic acid | y = 47.005x + 5.7739 | 0.9993 | 0.1~10 | 0.04 | 0.1 | 0.13 |
| 60 | Luteolin 7-glucuronide | y = 155.56x − 19.818 | 0.9992 | 0.1~10 | 0.05 | 0.1 | 0.07 |
| 61 | Rutin | y = 27.813x + 1119 | 0.9993 | 1~100 | 0.33 | 1.0 | 6.86 |
| 62 | Isoquercitroside | y = 895.09x − 133.08 | 0.9995 | 0.1~10 | 0.02 | 0.1 | 0.20 |
| 66 | 1,4-Dicaffeoylquinic acid | y = 174.39x + 1766.7 | 0.9997 | 1~100 | 0.33 | 1.0 | 2.04 |
| 68 | 1,5-Dicaffeoylquinic acid | y = 471.27x + 438.81 | 0.9991 | 0.1~10 | 0.03 | 0.1 | 0.14 |
| 69 | Narcisin | y = 56.783x + 1673.6 | 0.9991 | 1~100 | 0.20 | 1.0 | 6.94 |
| 72 | Syringaresinol | y = 879.44x − 136.7 | 0.9992 | 0.05~5 | 0.02 | 0.05 | 0.006 |
| 73 | Quercitrin | y = 3142.4x + 151.2 | 0.9993 | 0.05~5 | 0.03 | 0.05 | 0.026 |
| 76 | 4.5-Dicaffeoylquinic acid | y = 522.11x + 15.755 | 0.9994 | 0.1~10 | 0.02 | 0.1 | 0.52 |
| 78 | Pinoresinol 4-glucoside | y = 61.543x + 55.902 | 0.9998 | 0.1~10 | 0.05 | 0.1 | 0.16 |
| 85 | Matairesinoside | y = 702.5x − 75.75 | 0.9993 | 0.1~10 | 0.02 | 0.1 | 0.08 |
| 93 | Pinoresinol | y = 24.76x + 1.1 | 0.9998 | 1~100 | 0.20 | 1.0 | 1.12 |
| 96 | Arctiin | y = 1631x + 4406.1 | 0.9994 | 0.5~50 | 0.10 | 0.5 | 5.42 |
| 97 | Luteolin | y = 3162x + 331 | 0.9996 | 0.05~5 | 0.02 | 0.05 | 0.01 |
| 102 | Eupafolin | y = 17011x + 24.231 | 0.9990 | 0.05~5 | 0.02 | 0.05 | 0.03 |
| 106 | Apigenin | y = 226.54x + 5077.6 | 0.9996 | 0.5~50 | 0.20 | 0.5 | 4.10 |
| 108 | Matairesinol | y = 1519.7x + 132.26 | 0.9997 | 0.05~5 | 0.01 | 0.05 | 0.01 |
| 116 | Arctigenin | y = 39.1x − 32.2 | 0.9995 | 0.1~10 | 0.03 | 0.1 | 0.76 |
| No. | RT/min | Measured Mass (Da) | Mass Error (ppm) | Adducts | Biomarkers | Sources | Pathway | HMDB ID | Change Trend | |
|---|---|---|---|---|---|---|---|---|---|---|
| M/C | D/M | |||||||||
| 1 * | 0.60 | 132.0300 | 0.23 | M-H | L-Aspartic acid | Colon | ASGM, HD | HMDB0000191 | ↑ | ↓ |
| 2 # | 0.64 | 124.0069 | 0.08 | M-H | Taurine | Colon | THM | HMDB0000251 | ↑ | ↓ |
| 3 * | 0.68 | 115.0029 | −0.17 | M-H | Fumarate | Colon | ASGM, TM, CC | HMDB0000134 | ↑ | ↓ |
| 4 # | 0.79 | 191.0190 | −0.10 | M-H | Citrate | Colon | ASGM, CC | HMDB0000094 | ↑ | ↓ |
| 5 # | 0.8 | 117.0187 | −0.09 | M-H | Succinate | Serum | CC | HMDB0000254 | ↓ | ↑ |
| 6 * | 0.8 | 182.0802 | −0.82 | M+H | L-Tyrosine | Serum | PTTB, TM, PM | HMDB0000158 | ↓ | ↑ |
| 7 * | 0.98 | 166.0856 | −0.72 | M+H | L-Phenylalanine | Serum | PTTB, PM | HMDB0000159 | ↓ | ↑ |
| 8 # | 10.51 | 353.2328 | 0.00 | M-H | Prostaglandin F2a | Colon | AM | HMDB0001139 | ↑ | ↓ |
| 9 * | 10.53 | 301.2182 | 0.46 | M+H | all-trans-Retinoic acid | Colon | RM | HMDB0001852 | ↑ | ↓ |
| 10 # | 12.81 | 318.3002 | −0.19 | M+H | Phytosphingosine | Serum | SM | HMDB0004610 | ↑ | ↓ |
| 11 # | 12.97 | 300.2907 | 0.13 | M+H | Sphingosine | Colon | SM | HMDB0000252 | ↑ | ↓ |
| 12 * | 13.68 | 351.2158 | −0.37 | M-H | Prostaglandin H2 | Colon | AM | HMDB0001381 | ↑ | ↓ |
| 13 * | 14.36 | 335.2222 | 0.00 | M-H | Leukotriene B4 | Colon | AM | HMDB0001085 | ↑ | ↓ |
| 14 # | 15.06 | 302.3052 | −0.23 | M+H | Sphinganine | Serum | SM | HMDB0000269 | ↑ | ↓ |
| 15 # | 16.33 | 335.2220 | 0.00 | M-H | 5(S)-HpETE | Serum | AM | HMDB0001193 | ↓ | ↑ |
| 16 * | 18.16 | 319.2272 | −0.03 | M-H | 8,9-EET | Serum | AM | HMDB0002232 | ↓ | ↑ |
| 17 * | 21.69 | 277.2158 | −0.36 | M-H | α-Linolenic acid | Serum | ALM | HMDB0001388 | ↑ | ↓ |
| 18 * | 22.81 | 303.2323 | −0.03 | M-H | Arachidonate | Serum | AM | HMDB0001043 | ↑ | ↓ |
| 19 * | 23.11 | 279.2324 | 0.00 | M-H | Linoleic acid | Serum | LM | HMDB0000673 | ↑ | ↓ |
| 20 # | 26.60 | 780.5543 | 0.00 | M+H | PC(18:3/18:2) | Serum | LM, ALM | HMDB0008204 | ↓ | ↑ |
| 21 # | 27.54 | 756.5532 | 0.17 | M+H | PC(14:0/20:4) | Serum | AM | HMDB0007883 | ↑ | ↓ |
| Pathway Name | Match Status | p | −log (p) | Holm p | FDR | Impact |
|---|---|---|---|---|---|---|
| Phenylalanine, tyrosine and tryptophan biosynthesis (PTTB) | 2/4 | 1.09 × 10⁻³ | 2.9613 | 0.0885 | 0.0230 | 1.0000 |
| Linoleic acid metabolism (LM) | 2/5 | 1.81 × 10⁻³ | 2.7431 | 0.1445 | 0.0304 | 1.0000 |
| Arachidonic acid metabolism (AM) | 7/36 | 2.22 × 10⁻⁷ | 6.6532 | 1.87 × 10⁻⁵ | 1.87 × 10⁻⁵ | 0.5861 |
| Taurine and hypotaurine metabolism (THM) | 1/8 | 0.1065 | 0.9727 | 1.0000 | 0.7141 | 0.4286 |
| Phenylalanine metabolism (PM) | 3/12 | 4.75 × 10⁻⁴ | 3.3234 | 0.0389 | 0.0133 | 0.3571 |
| alpha-Linolenic acid metabolism (ALM) | 2/13 | 0.0132 | 1.8803 | 1.0000 | 0.1230 | 0.3333 |
| Retinol metabolism (RM) | 1/16 | 0.2021 | 0.6944 | 1.0000 | 0.9433 | 0.2275 |
| Alanine, aspartate and glutamate metabolism (ASGM) | 4/28 | 4.61 × 10⁻⁴ | 3.3361 | 0.0383 | 0.0133 | 0.2260 |
| Sphingolipid metabolism (SM) | 3/21 | 0.0026 | 2.5772 | 0.2065 | 0.0318 | 0.2028 |
| Tyrosine metabolism (TM) | 2/42 | 0.1142 | 0.9423 | 1.0000 | 0.7141 | 0.1644 |
| Citrate cycle (TCA cycle) (CC) | 3/20 | 0.0023 | 2.6403 | 0.1809 | 0.0318 | 0.1529 |
Disclaimer/Publisher’s Note: The statements, opinions and data contained in all publications are solely those of the individual author(s) and contributor(s) and not of MDPI and/or the editor(s). MDPI and/or the editor(s) disclaim responsibility for any injury to people or property resulting from any ideas, methods, instructions or products referred to in the content. |
© 2023 by the authors. Licensee MDPI, Basel, Switzerland. This article is an open access article distributed under the terms and conditions of the Creative Commons Attribution (CC BY) license (https://creativecommons.org/licenses/by/4.0/).
Share and Cite
Liu, Y.; Wang, C.; Wu, J.; Tan, L.; Gao, P.; Wu, S.; Tang, D.; Wang, Q.; Wang, C.; Li, P.; et al. Study on the Comprehensive Phytochemicals and the Anti-Ulcerative Colitis Effect of Saussurea pulchella. Molecules 2023, 28, 1526. https://doi.org/10.3390/molecules28041526
Liu Y, Wang C, Wu J, Tan L, Gao P, Wu S, Tang D, Wang Q, Wang C, Li P, et al. Study on the Comprehensive Phytochemicals and the Anti-Ulcerative Colitis Effect of Saussurea pulchella. Molecules. 2023; 28(4):1526. https://doi.org/10.3390/molecules28041526
Chicago/Turabian StyleLiu, Yunhe, Caixia Wang, Junzhe Wu, Luying Tan, Peng Gao, Sinuo Wu, Daohao Tang, Qianyun Wang, Cuizhu Wang, Pingya Li, and et al. 2023. "Study on the Comprehensive Phytochemicals and the Anti-Ulcerative Colitis Effect of Saussurea pulchella" Molecules 28, no. 4: 1526. https://doi.org/10.3390/molecules28041526