
Phenolic Acids and Amaryllidaceae Alkaloids Profiles in Leucojum aestivum L. In Vitro Plants Grown under Different Light Conditions
 , ,
, ,  , , and
Abstract
: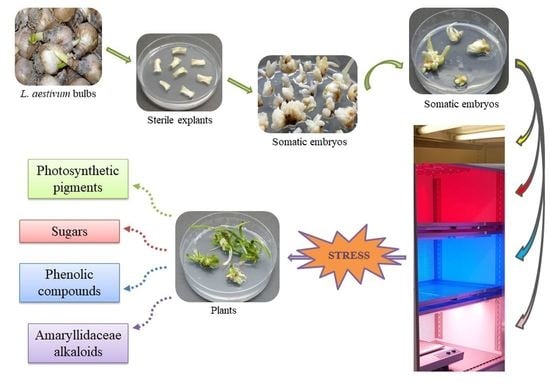
1. Introduction
2. Results and Discussion
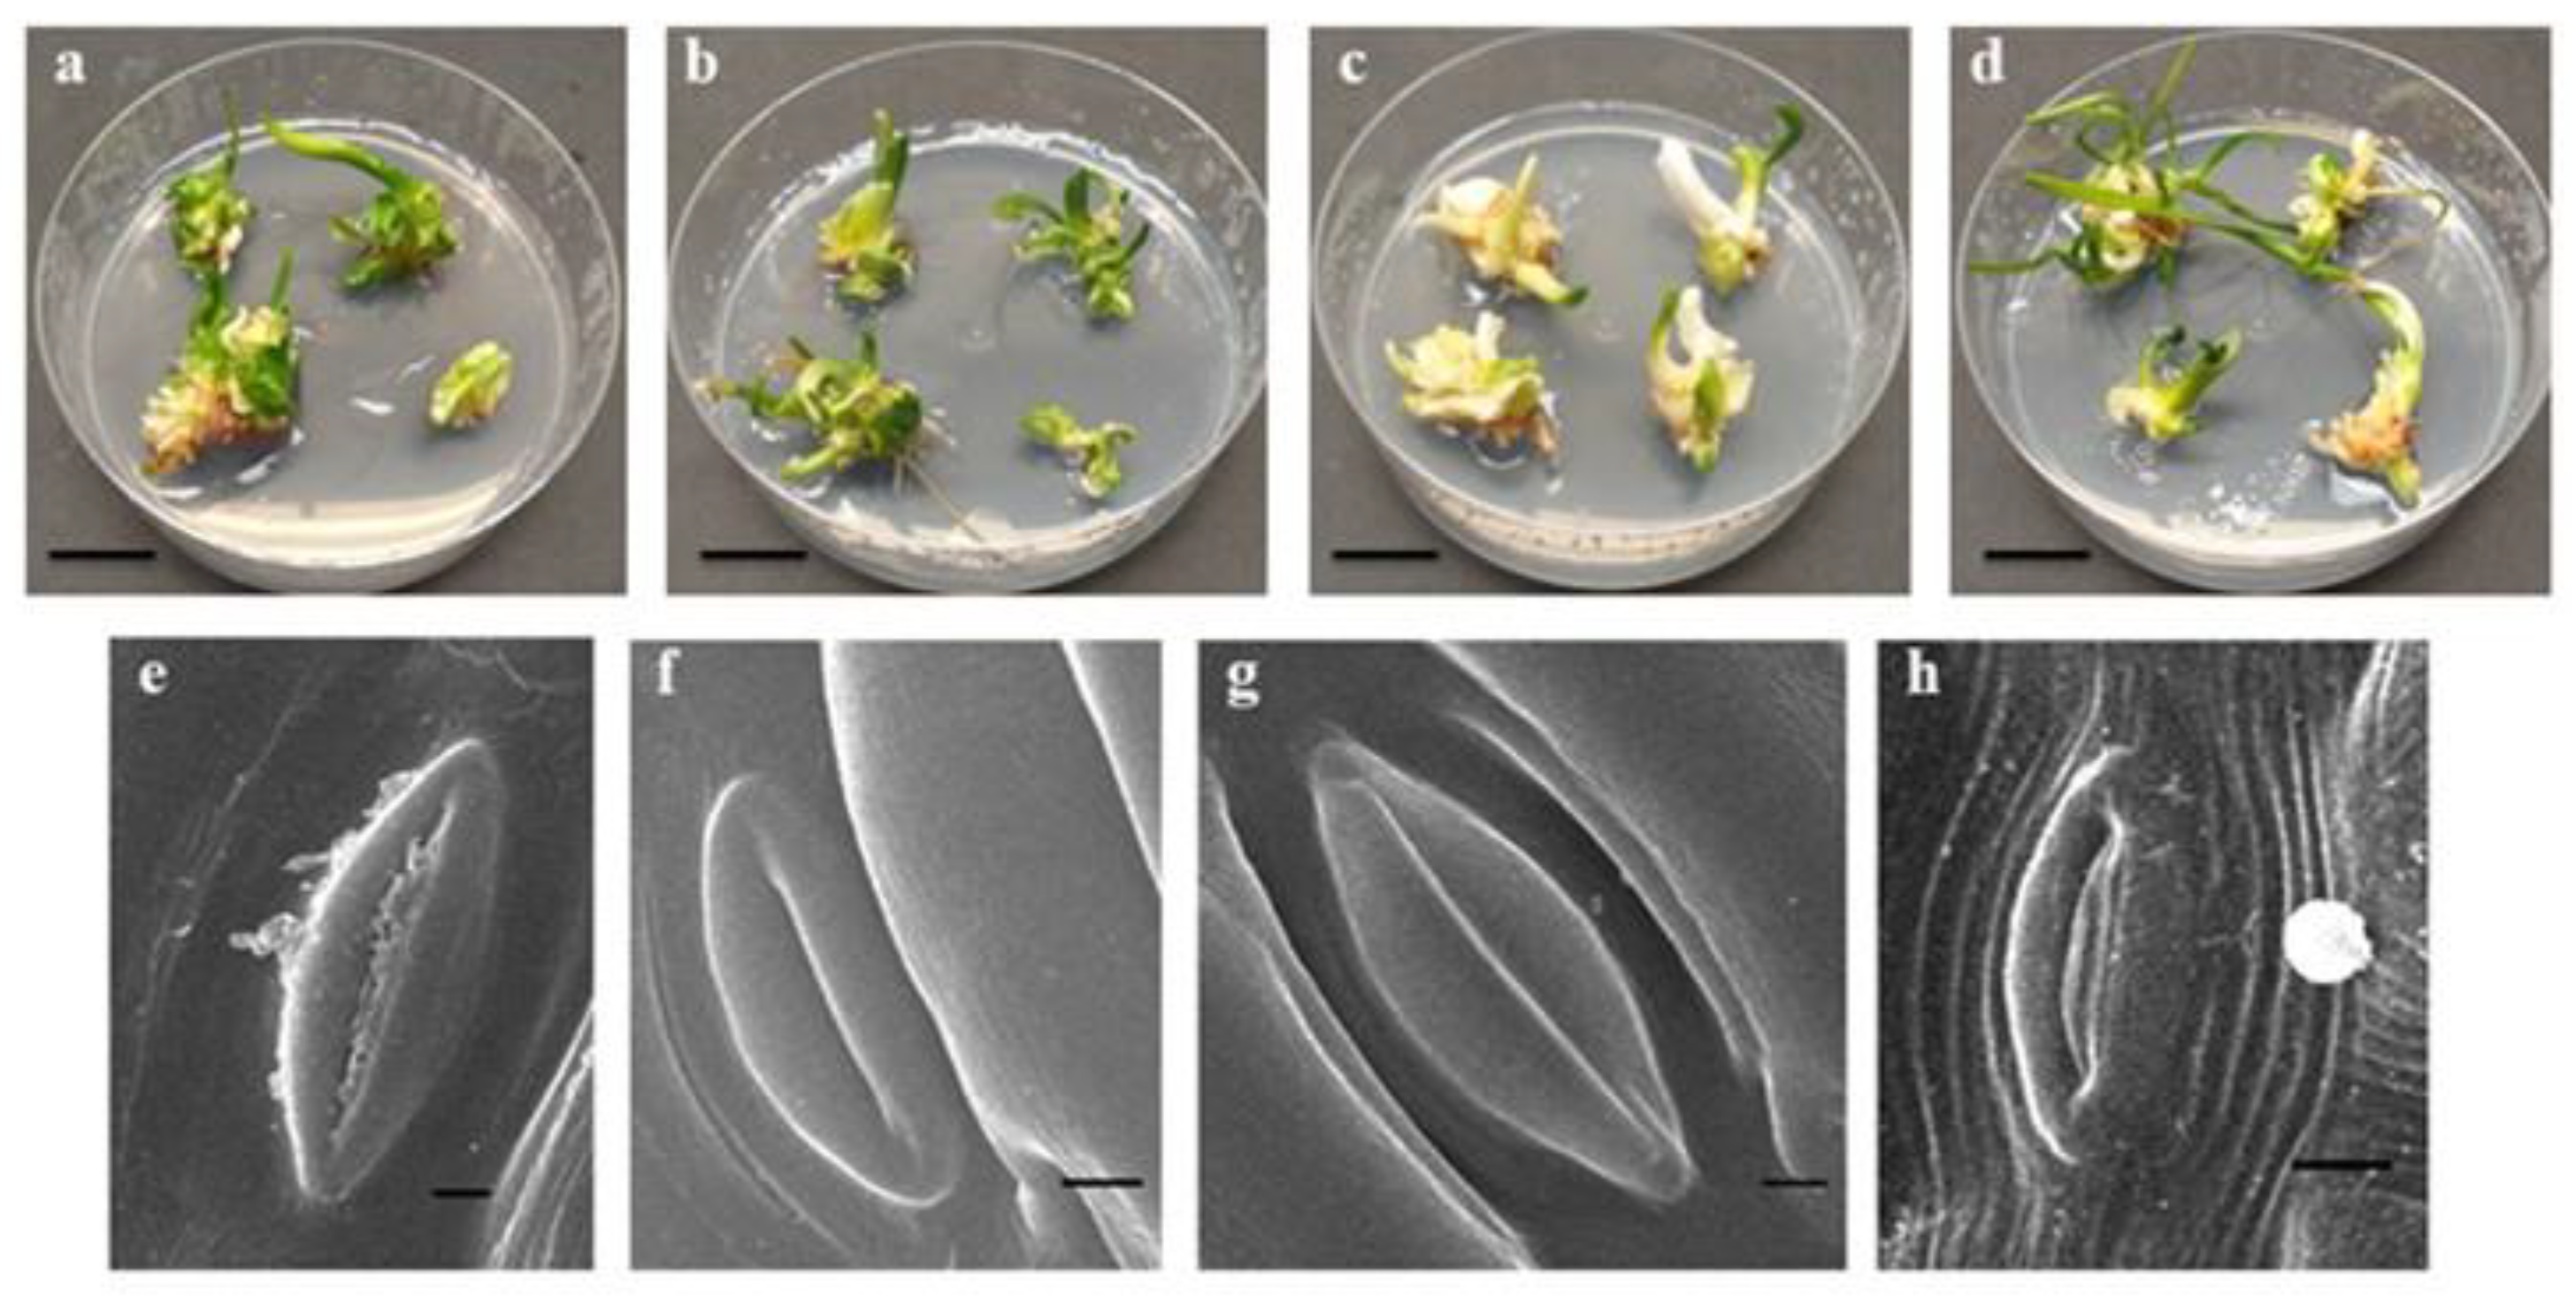
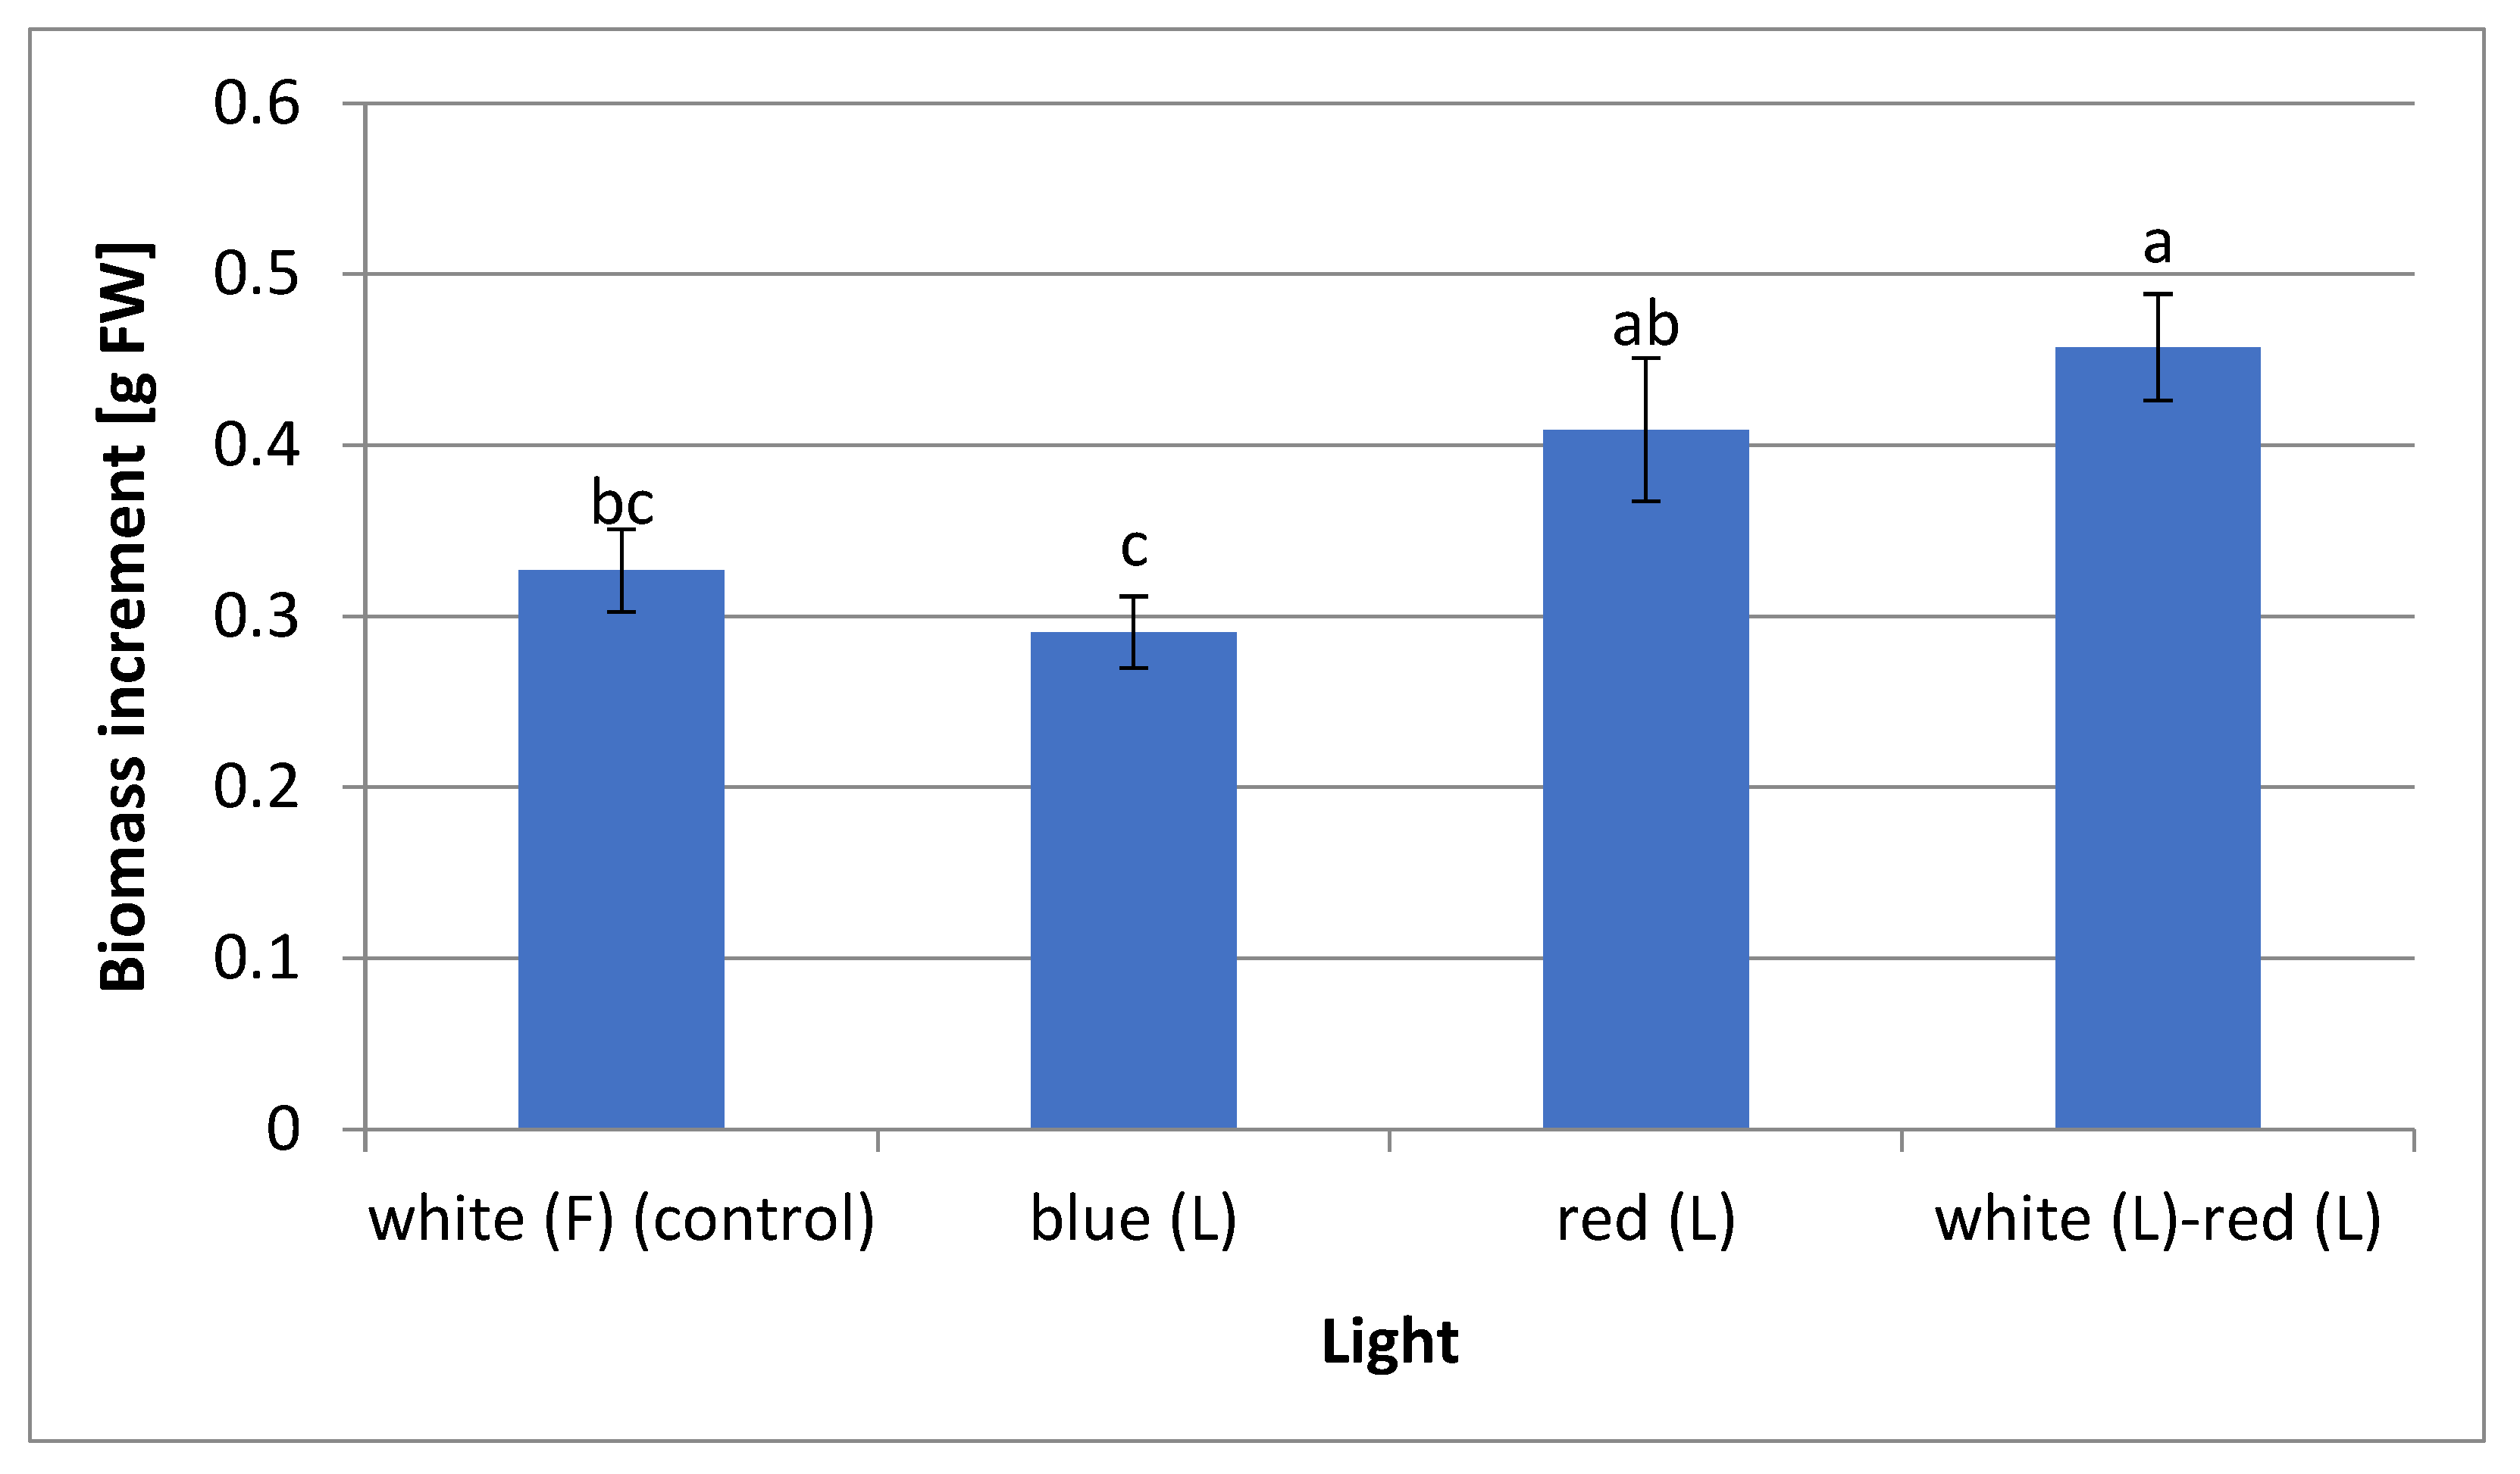
2.1. Effect of Light Quality on In Vitro Plant Growth
2.2. Effects of Light Quality on Photosynthetic Pigment Content and Stomata Appearance
2.3. Effects of Light Quality on Sugar, Phenolic Compounds Content, and Antioxidant Enzyme Activities
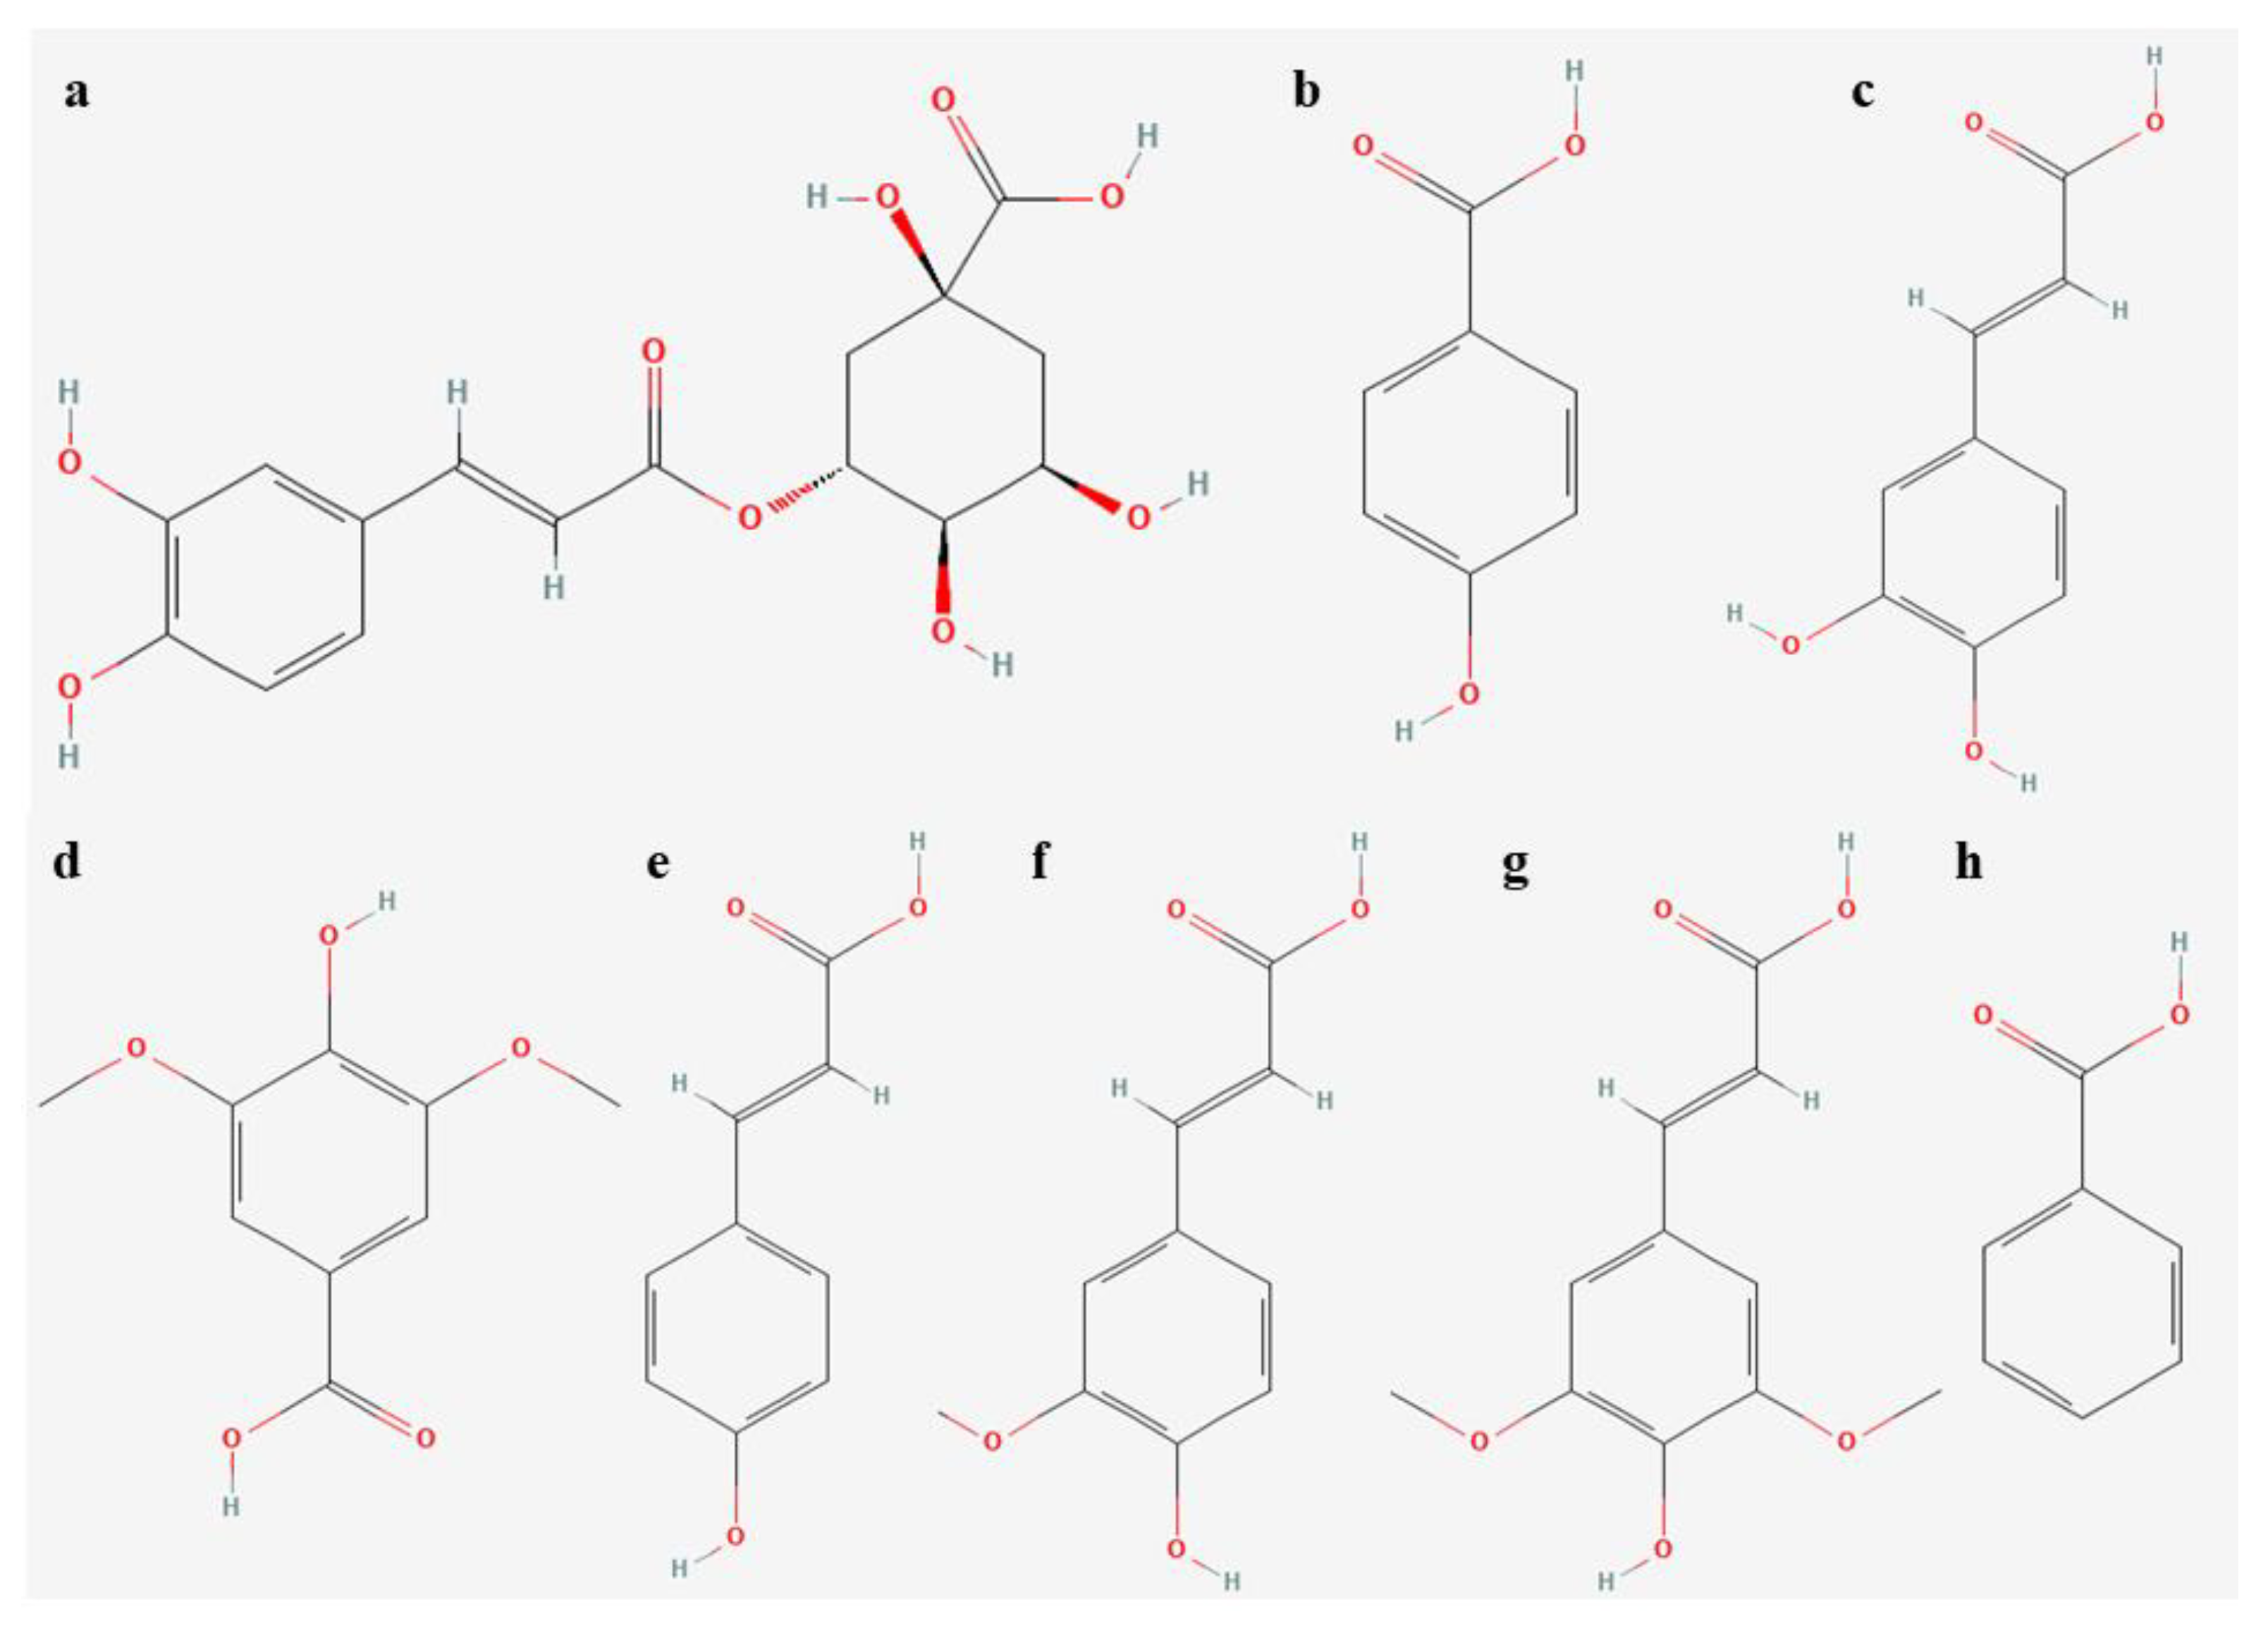
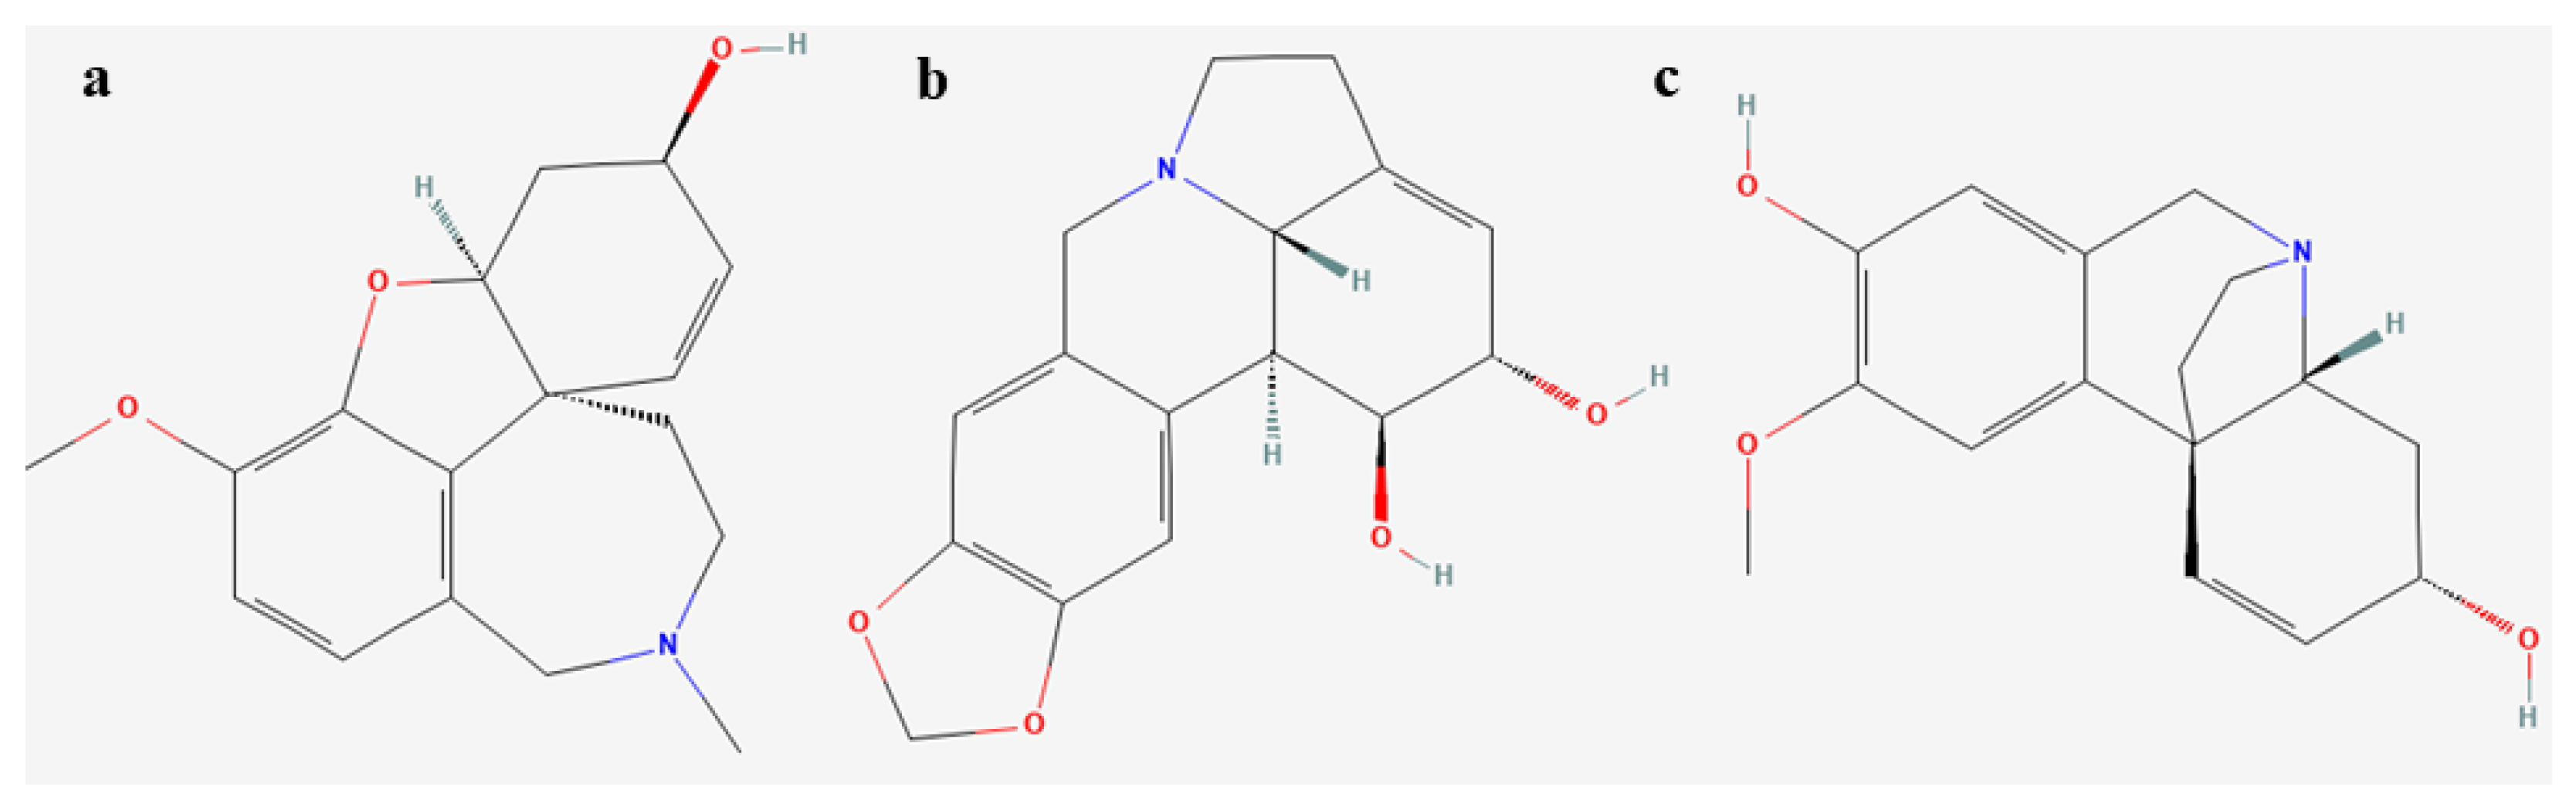
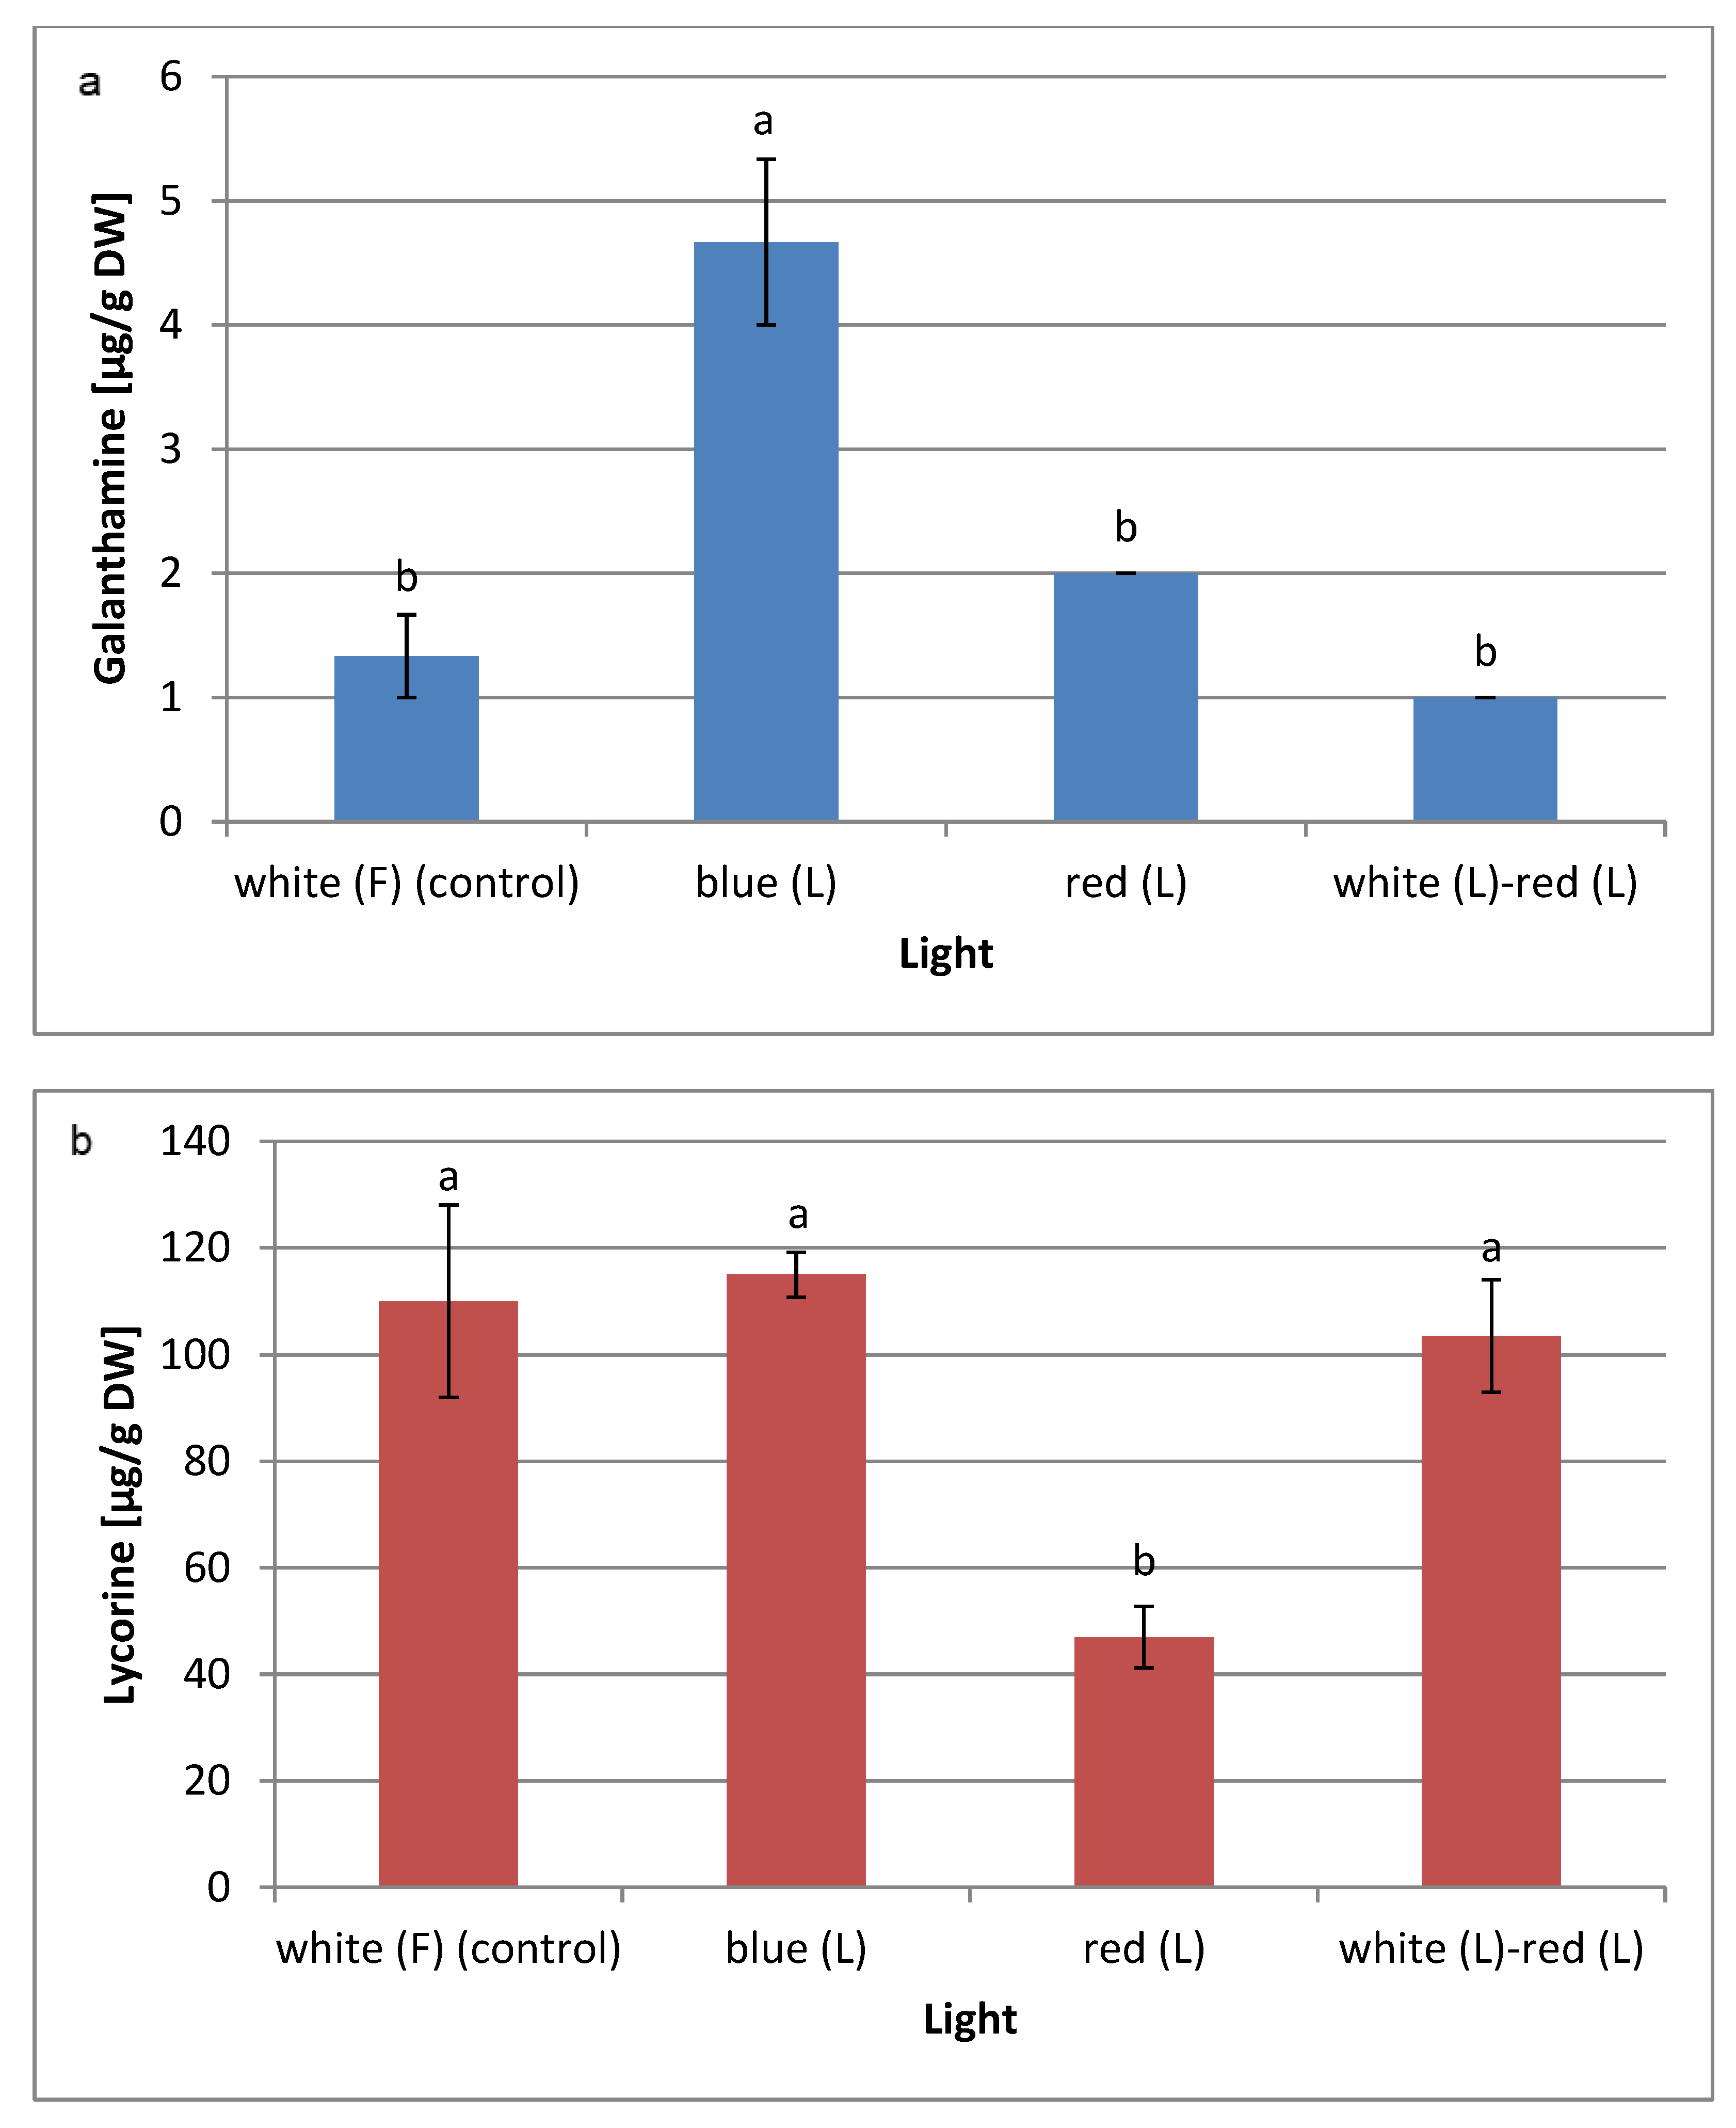
2.4. Effect of Light Quality on Amaryllidaceae Alkaloid Biosynthesis
3. Materials and Methods
3.1. In Vitro Experimental Cultures
3.2. Scanning Electron Microscopy
3.3. Determination of Photosynthetic Pigments
3.4. Determination of Soluble Sugars
3.5. Determination of Total Phenolic Compounds
3.6. Determination of Flavonoids and Phenolic Acids
3.6.1. Extraction
3.6.2. Total Flavonoids Assay
3.6.3. Analyses of Phenolic Acids
3.7. Antioxidant Enzyme Activity Analysis
3.8. Amaryllidaceae Alkaloids Analyses
3.9. Data Analysis
4. Conclusions
Author Contributions
Funding
Institutional Review Board Statement
Informed Consent Statement
Data Availability Statement
Acknowledgments
Conflicts of Interest
Sample Availability
References
- Laurain-Mattar, D.; Ptak, A. Amaryllidaceae alkaloid accumulation by plant in vitro systems. In Bioprocessing of Plant In Vitro Systems; Pavlov, A., Bley, T., Eds.; Springer International Publishing AG: Cham, Switzerland, 2018; pp. 203–220. [Google Scholar] [CrossRef]
- Seltzer, B. Cholinesterase inhibitors in the clinical management of Alzheimer’s disease: Importance of early and persistent treatment. J. Int. Med. Res. 2006, 34, 339–347. [Google Scholar] [CrossRef] [PubMed]
- Ying, X.; Huang, A.; Xing, Y.; Lan, L.; Yi, Z.; He, P. Lycorine inhibits breast cancer growth and metastasis via inducing apoptosis and blocking Src/FAK-involved pathway. Sci. China Life Sci. 2017, 60, 417–428. [Google Scholar] [CrossRef] [PubMed]
- Jin, Y.H.; Min, J.S.; Jeon, S.; Lee, J.; Kim, S.; Park, T.; Park, D.; Jang, M.S.; Park, C.M.; Song, J.H.; et al. Lycorine, a non-nucleoside RNA dependent RNA polymerase inhibitor, as potential treatment for emerging coronavirus infections. Phytomedicine 2021, 86, 153440. [Google Scholar] [CrossRef]
- Georgiev, V.; Ivanov, I.; Pavlov, A. Recent progress in Amaryllidaceae biotechnology. Molecules 2020, 25, 4670. [Google Scholar] [CrossRef] [PubMed]
- Koirala, M.; Karimzadegan, V.; Liyanage, N.S.; Mérindol, N.; Desgagné-Penix, I. Biotechnological approaches to optimize the production of Amaryllidaceae alkaloids. Biomolecules 2022, 12, 893. [Google Scholar] [CrossRef] [PubMed]
- Ptak, A.; Morańska, E.; Saliba, S.; Zieliński, A.; Simlat, M.; Laurain-Mattar, D. Elicitation of galanthamine and lycorine biosynthesis by Leucojum aestivum L. and L. aestivum ‘Gravety Giant’ plants cultured in bioreactor RITA®. Plant Cell Tissue Organ Cult. 2017, 128, 335–345. [Google Scholar] [CrossRef]
- Ptak, A.; Simlat, M.; Morańska, E.; Skrzypek, E.; Warchoł, M.; Tarakemeh, A.; Laurain-Mattar, D. Exogenous melatonin stimulated Amaryllidaceae alkaloid biosynthesis in in vitro cultures of Leucojum aestivum L. Ind. Crops Prod. 2019, 138, 111458. [Google Scholar] [CrossRef]
- Naik, P.M.; Al-Khayri, J.M. Abiotic and biotic elicitors–role in secondary metabolites production through in vitro culture of medicinal plants. In Abiotic and Biotic Stress in Plants—Recent Advances and Future Perspectives; Shanker, A.K., Shanker, C., Eds.; InTech: London, UK, 2016; pp. 247–278. [Google Scholar] [CrossRef]
- Dutta Gupta, S.; Jatothu, B. Fundamentals and applications of light-emitting diodes (LEDs) in in vitro plant growth and morphogenesis. Plant Biotechnol. Rep. 2013, 7, 211–220. [Google Scholar] [CrossRef]
- Berkov, S.; Georgieva, L.; Kondakova, V.; Atanassov, A.; Viladomat, F.; Bastida, J.; Codina, C. Plant sources of galanthamine: Phytochemical and biotechnological aspects. Biotechnol. Biotechnol. Equip. 2009, 23, 1170–1176. [Google Scholar] [CrossRef]
- Li, Q.; Xu, J.; Yang, L.; Sun, Y.; Zhou, X.; Zheng, Y.; Zhang, Y.; Cai, Y. LED light quality affect growth, alkaloids contents, and expressions of Amaryllidaceae alkaloids biosynthetic pathway genes in Lycoris longituba. J. Plant Growth Regul. 2022, 41, 257–270. [Google Scholar] [CrossRef]
- Cioć, M.; Szewczyk, A.; Żupnik, M.; Kalisz, A.; Pawłowska, B. LED lighting affects plant growth, morphogenesis and phytochemical contents of Myrtus communis L. in vitro. Plant Cell Tissue Organ Cult. 2018, 132, 433–447. [Google Scholar] [CrossRef]
- Younas, M.; Drouet, S.; Nadeem, M.; Giglioli-Guivarc’h, N.; Hano, C.; Abbasi, B.H. Differential accumulation of silymarin induced by exposure of Silybum marianum L. callus cultures to several spectres of monochromatic lights. J. Photochem. Photobiol. B Biol. 2018, 184, 61–70. [Google Scholar] [CrossRef]
- Chen, C.C.; Lee, M.R.; Wu, C.R.; Ke, H.J.; Xie, H.M.; Tsay, H.S.; Agrawal, D.C.; Chang, H.C. LED lights affecting morphogenesis and isosteroidal alkaloid contents in Fritillaria cirrhosa D. Don-An important chinese medicinal herb. Plants 2020, 9, 1351. [Google Scholar] [CrossRef]
- Sobhani Najafabadi, A.; Khanahmadi, M.; Ebrahimi, M.; Moradi, K.; Behroozi, P.; Noormohammadi, N. Effect of different quality of light on growth and production of secondary metabolites in adventitious root cultivation of Hypericum perforatum. Plant Signal. Behav. 2019, 14, 1640561. [Google Scholar] [CrossRef]
- Silva, T.D.; Batista, D.S.; Fortini, E.A.; Castro, K.M.; Felipe, S.H.; Fernandes, A.M.; Sousa, R.M.; Chagas, K.; Silva, J.V.; Correia, L.N.; et al. Blue and red light affects morphogenesis and 20-hydroxyecdisone content of in vitro Pfaffia glomerata accessions. J. Photochem. Photobiol. B Biol. 2019, 203, 111761. [Google Scholar] [CrossRef] [PubMed]
- Hassanpour, H. Potential impact of red-blue LED light on callus growth, cell viability, and secondary metabolism of Hyoscyamus reticulatus. Vitr. Cell Dev. Biol. Plant 2022, 58, 256–265. [Google Scholar] [CrossRef]
- Klimek-Szczykutowicz, M.; Prokopiuk, B.; Dziurka, K.; Pawłowska, B.; Ekiert, H.; Szopa, A. The influence of different wavelengths of LED light on the production of glucosinolates and phenolic compounds and the antioxidant potential in in vitro cultures of Nasturtium officinale (watercress). Plant Cell Tissue Organ Cult. 2022, 149, 113–122. [Google Scholar] [CrossRef]
- Nadeem, M.; Abbasi, B.H.; Younas, M.; Ahmad, W.; Zahir, A.; Hano, C. LED-enhanced biosynthesis of biologically active ingredients in callus cultures of Ocimum basilicum. J. Photochem. Photobiol. B Biol. 2019, 190, 172–178. [Google Scholar] [CrossRef] [PubMed]
- Miyagi, A.; Uchimiya, H.; Kawai-Yamada, M. Synergistic effects of light quality, carbon dioxide and nutrients on metabolite compositions of head lettuce under artificial growth conditions mimicking a plant factory. Food Chem. 2017, 218, 56–568. [Google Scholar] [CrossRef] [PubMed]
- Kuo, T.C.; Chen, C.H.; Chen, S.H.; Lu, I.H.; Chu, M.J.; Huang, L.C.; Lin, C.Y.; Chen, C.Y.; Lo, H.F.; Jeng, S.T.; et al. The effect of red light and far-red light conditions on secondary metabolism in agarwood. BMC Plant Biol. 2015, 15, 139. [Google Scholar] [CrossRef]
- Batista, D.S.; de Castro, K.M.; da Silva, A.R.; Teixeira, M.L.; Sales, T.A.; Soares, L.I.; Cardoso, M.G.; Santos, M.O.; Viccini, L.F.; Otoni, W.C. Light quality affects in vitro growth and essential oil profile in Lippia alba (Verbenaceae). Vitr. Cell Dev. Biol. Plant 2016, 52, 276–282. [Google Scholar] [CrossRef]
- Li, H.; Lin, Y.; Chen, X.; Bai, Y.; Wang, C.; Xu, X.; Wang, Y.; Lai, Z. Effects of blue light on flavonoid accumulation linked to the expression of miR393, miR394 and miR395 in longan embryogenic calli. PLoS ONE 2018, 13, e0191444. [Google Scholar] [CrossRef] [PubMed]
- Narayani, M.; Srivastava, S. Elicitation: A stimulation of stress in in vitro plant cell/tissue cultures for enhancement of secondary metabolite production. Phytochem. Rev. 2017, 16, 1227–1252. [Google Scholar] [CrossRef]
- Ptak, A.; Morańska, E.; Skrzypek, E.; Warchoł, M.; Spina, R.; Laurain-Mattar, D.; Simlat, M. Carbohydrates stimulated Amaryllidaceae alkaloids biosynthesis in Leucojum aestivum L. plants cultured in RITA® bioreactor. PeerJ 2020, 16, e8688. [Google Scholar] [CrossRef]
- Castro, A.H.F.; Coimbra, M.C.; Crema, C.R.N.; de Oliveira Thomasi, R.M.; Cardoso, V.R. Elicitors as a biotechnological tool for in vitro production of bioactive phenolic compounds. In Exploring Plant Cells for the Production of Compounds of Interest. Malik, S., Ed.; Springer: Cham, Switzerland, 2021; pp. 195–226. [Google Scholar] [CrossRef]
- Parvin, K.; Nahar, K.; Mohsin, S.M.; Al Mahmud, J.; Fujita, M.; Hasanuzzaman, M. Plant phenolic compounds for abiotic stress tolerance. In Managing Plant Production under Changing Environment; Hasanuzzaman, M., Ahammed, G.J., Nahar, K., Eds.; Springer: Singapore, 2022; pp. 193–237. [Google Scholar] [CrossRef]
- Valluru, R.; Van den Ende, W. Plant fructans in stress environments: Emerging concepts and future prospects. J. Exp. Bot. 2008, 59, 2905–2916. [Google Scholar] [CrossRef]
- Kopczewski, T.; Kuźniak, E.; Ciereszko, I.; Kornaś, A. Alterations in primary carbon metabolism in cucumber infected with Pseudomonas syringae pv lachrymans: Local and systemic responses. Int. J. Mol. Sci. 2022, 23, 12418. [Google Scholar] [CrossRef]
- Shin, K.S.; Murthy, H.N.; Heo, J.W.; Hahn, E.J.; Paek, K.Y. The effect of light quality on the growth and development of in vitro cultured Doritaenopsis plants. Acta Physiol. Plant 2008, 30, 339–343. [Google Scholar] [CrossRef]
- Lai, C.C.; Pan, H.; Zhang, J.; Wang, Q.; Que, Q.X.; Pan, R.; Lai, Z.X.; Lai, G.T. Light quality modulates growth, triggers differential accumulation of phenolic compounds, and changes the total antioxidant capacity in the red callus of Vitis davidii. J. Agric. Food Chem. 2022, 70, 13264–13278. [Google Scholar] [CrossRef] [PubMed]
- Manivannan, A.; Soundararajan, P.; Halimah, N.; Ko, C.H.; Jeong, B.R. Blue LED light enhances growth, phytochemical contents, and antioxidant enzyme activities of Rehmannia glutinosa cultured in vitro. Hortic. Environ. Biotechnol. 2015, 56, 105–113. [Google Scholar] [CrossRef]
- Jang, E.B.; Ho, T.-T.; Park, S.-Y. Effect of light quality and tissue origin on phenolic compound accumulation and antioxidant activity in Camellia japonica calli. Vitr. Cell. Dev. Biol. Plant 2020, 56, 567–577. [Google Scholar] [CrossRef]
- Chowdhary, V.; Alooparampil, S.; Pandya, R.V.; Tank, J.G. Physiological function of phenolic compounds in plant defense system. In Phenolic Compounds—Chemistry, Synthesis, Diversity, Non-Conventional Industrial, Pharmaceutical and Therapeutic Applications; Badria, F.A., Ed.; IntechOpen: London, UK, 2021. [Google Scholar] [CrossRef]
- Zhang, Y.; Cai, P.; Cheng, G.; Zhang, Y. A brief review of phenolic compounds identified from plants: Their extraction, analysis, and biological activity. Nat. Prod. Commun. 2022, 17, 1–14. [Google Scholar] [CrossRef]
- Pratyusha, S. Phenolic compounds in the plant development and defense: An overview. In Plant Stress Physiology—Perspectives in Agriculture; Hasanuzzaman, M., Nahar, K., Eds.; IntechOpen: London, UK, 2022. [Google Scholar] [CrossRef]
- Chen, L.; Zhang, K.; Gong, X.; Wang, H.; Gao Wang, X.; Zeng, Z.; Hu, Y. Effects of different LEDs light spectrum on the growth, leaf anatomy, and chloroplast ultrastructure of potato plantlets in vitro and minituber production after transplanting in the greenhouse. J. Integr. Agric. 2020, 19, 108–119. [Google Scholar] [CrossRef]
- Hung, C.D.; Hong, C.H.; Kim, S.K.; Lee, K.H.; Park, J.Y.; Nam, M.W.; Choi, D.H.; Lee, H.I. LED light for in vitro and ex vitro efficient growth of economically important highbush blueberry (Vaccinium corymbosum L.). Acta Physiol. Plant 2016, 38, 152. [Google Scholar] [CrossRef]
- Simlat, M.; Ślęzak, P.; Moś, M.; Warchoł, M.; Skrzypek, E.; Ptak, A. The effect of light quality on seed germination, seedling growth and selected biochemical properties of Stevia rebaudiana Bertoni. Sci. Hortic. 2016, 211, 295–304. [Google Scholar] [CrossRef]
- Hashim, M.; Ahmad, B.; Drouet, S.; Hano, C.; Abbasi, B.H.; Anjum, S. Comparative effects of different light sources on the production of key secondary metabolites in plants in vitro cultures. Plants 2021, 10, 1521. [Google Scholar] [CrossRef] [PubMed]
- Zheng, L.; Van Labeke, M.-C. Long-term effects of red- and blue-light emitting diodes on leaf anatomy and photosynthetic efficiency of three ornamental pot plants. Front. Plant Sci. 2017, 8, 917. [Google Scholar] [CrossRef]
- Singh, P.; Patel, R.M. Factors influencing in vitro growth and shoot multiplication of pomegranate. Bioscan 2014, 9, 1031–1035. [Google Scholar]
- Silva, S.T.; Bertolucci, S.K.V.; Da Cunha, S.H.B.; Lazzarini, L.E.S.; Tavares, M.C.; Pinto, J.E.B.P. Effect of light and natural ventilation systems on the growth parameters and carvacrol content in the in vitro cultures of Plectranthus amboinicus (Lour.) Spreng. Plant Cell Tissue Organ Cult. 2017, 129, 501–510. [Google Scholar] [CrossRef]
- Zhang, L.; Ma, G.; Yamawaki, K.; Ikoma, Y.; Matsumoto, H.; Yoshioka, T.; Ohta, S.; Kato, M. Effect of blue LED light intensity on carotenoid accumulation in citrus juice sacs. J. Plant Physiol. 2015, 188, 58–63. [Google Scholar] [CrossRef]
- Habermann, H.M. Evidence for two photoreactions and possible involvement of phytochrome in light-dependent stomatal opening. Plant Physiol. 1973, 51, 543–548. [Google Scholar] [CrossRef]
- Tibbitts, T.W.; Morgan, D.C.; Warrington, J.J. Growth of lettuce, spinach, mustard and wheat plants under four combinations of high-pressure sodium, metal halide and tungsten halogen lamps at equal PPFD. J. Am. Hortic. Sci. 1983, 108, 622–630. [Google Scholar] [CrossRef]
- Roeber, V.M.; Bajaj, I.; Rohde, M.; Schmülling, T.; Cortleven, A. Light acts as a stressor and influences abiotic and biotic stress responses in plants. Plant Cell Environ. 2021, 44, 645–664. [Google Scholar] [CrossRef] [PubMed]
- Keunen, E.; Peshev, D.; Vangronsveld, J.; Van Den Ende, W.; Cuypers, A. Plant sugars are crucial players in the oxidative challenge during abiotic stress: Extending the traditional concept. Plant Cell Environ. 2013, 36, 1242–1255. [Google Scholar] [CrossRef]
- Bach, A.; Kapczyńska, A.; Dziurka, K.; Dziurka, M. The importance of applied light quality on the process of shoot organogenesis and production of phenolics and carbohydrates in Lachenalia sp. cultures in vitro. S. Afr. J. Bot. 2018, 114, 14–19. [Google Scholar] [CrossRef]
- Falcone Ferreyra, M.L.; Rius, S.P.; Casati, P. Flavonoids: Biosynthesis, biological functions, and biotechnological applications. Front. Plant Sci. 2012, 3, 278. [Google Scholar] [CrossRef] [PubMed] [Green Version]
- Ferreyra, M.L.F.; Serra, P.; Casati, P. Recent advances on the roles of flavonoids as plant protective molecules after UV and high light exposure. Physiol. Plant 2021, 173, 736–749. [Google Scholar] [CrossRef] [PubMed]
- Nikolova, M.; Gevrenova, R. Determination of phenolic acids in Amaryllidaceae species by high performance liquid chromatography. Pharm. Biol. 2005, 43, 289–291. [Google Scholar] [CrossRef]
- Li, D.; Rui, Y.; Guo, S.; Luan, F.; Liu, R.; Zeng, N. Ferulic acid: A review of its pharmacology, pharmacokinetics and derivatives. Life Sci. 2021, 284, 119921. [Google Scholar] [CrossRef]
- Arriaga, A.I.M.; Granados, C.E.E.; Tavera, V.M.; Díaz, G.M.; Ruiz, J.H.; Nieto, J.E.R. Antioxidant response of lettuce plants to four wavelengths of LED visible light. Acta Physiol. Plant 2020, 42, 172–177. [Google Scholar] [CrossRef]
- Weremczuk-Jeżyna, I.; Hnatuszko-Konka, K.; Lebelt, L.; Grzegorczyk-Karolak, I. The protective function and modification of secondary metabolite accumulation in response to light stress in Dracocephalum forrestii shoots. Int. J. Mol. Sci. 2021, 22, 7965. [Google Scholar] [CrossRef] [PubMed]
- Dewir, Y.H.; Chakrabarty, D.; Ali, M.B.; Hahn, E.J.; Paek, K.Y. Lipid peroxidation and antioxidant enzyme activities of Euphorbia millii hyperhydric shoots. Environ. Expt. Bot. 2006, 58, 93–99. [Google Scholar] [CrossRef]
- Borgstahl, G.E.O.; Oberley-Deegan, R.E. Superoxide dismutases (SODs) and SOD mimetics. Antioxidants 2018, 7, 156. [Google Scholar] [CrossRef] [PubMed]
- Ahmad, P.; Jamsheed, S.; Hameed, A.; Rasool, S.; Sharma, I.; Azooz, M.M.; Hasanuzzaman, M. Drought stress induced oxidative damage and antioxidants in plants. In Oxidative Damage to Plants; Ahmad, P., Ed.; Academic Press: San Diego, CA, USA, 2014; pp. 345–367. [Google Scholar] [CrossRef]
- Zhang, S.; Zhang, L.; Zou, H.; Qiu, L.; Zheng, Y.; Yang, D.; Wang, Y. Effects of light on secondary metabolite biosynthesis in medicinal plants. Front. Plant Sci. 2021, 12, 781236. [Google Scholar] [CrossRef]
- Ptak, A.; El Tahchy, A.; Dupire, F.; Boisbrun, M.; Henry, M.; Chapleur, Y.; Moś, M.; Laurain-Mattar, D. LCMS and GCMS for the screening of alkaloids in natural and in vitro extracts of Leucojum aestivum. J. Nat. Prod. 2009, 72, 142–147. [Google Scholar] [CrossRef]
- Murthy, H.N.; Lee, E.J.; Paek, K.Y. Production of secondary metabolites from cell and organ cultures: Strategies and approaches for biomass improvement and metabolite accumulation. Plant Cell Tissue Organ Cult. 2014, 118, 1–16. [Google Scholar] [CrossRef]
- Monforte-González, M.; Serrano-Gamboa, J.G.; Guízar-González, C.; Miranda-Ham, M.L.; Vázquez-Flota, F.A. Alkaloid synthesis is coupled to shoot morphogenesis in Argemone mexicana L. (Papaveraceae) in vitro cultures. Vitr. Cell Dev. Biol.-Plant 2019, 55, 695–701. [Google Scholar] [CrossRef]
- Park, S.-Y.; Lee, J.G.; Cho, H.S.; Seong, E.S.; Kim, H.Y.; Yu, C.Y.; Kim, J.K. Metabolite profiling approach for assessing the effects of colored light-emitting diode lighting on the adventitious roots of ginseng (Panax ginseng C. A. Mayer). Plant Omics J. 2013, 6, 224–230. [Google Scholar]
- Umar, O.B.; Ranti, L.A.; Abdulbaki, A.S.; Bola, A.L.; Abdulhamid, A.K.; Biola, M.R.; Victor, K.O. Stresses in Plants: Biotic and Abiotic. In Current Trends in Wheat Research; Ansari, M., Ed.; IntechOpen: London, UK, 2021. [Google Scholar] [CrossRef]
- Ardelean, M.; Ardelean, A.; Don, I.; Lobiuc, A.; Burducea, M. Effect of LED lighting on growth and phenolic content on in vitro seedlings of Ocimum basilicum L. cultivar Aromat de Buzeau. Food Environ. Saf. J. 2018, 17, 66–73. [Google Scholar] [CrossRef]
- Costa, É.L.G.; Farnese, F.S.; Oliveira, T.C.; Rosa, M.; Rodrigues, A.A.; Resende, E.C.; Januario, A.H.; Silva, F.G. Combinations of blue and red LEDs increase the morphophysiological performance and furanocoumarin production of Brosimum gaudichaudii Trécul in vitro. Front. Plant Sci. 2021, 12, 680545. [Google Scholar] [CrossRef] [PubMed]
- Murashige, T.; Skoog, F. A revised medium for rapid growth and bio assays with tobacco tissue cultures. Plant Physiol. 1962, 15, 473–497. [Google Scholar] [CrossRef]
- Ptak, A.; El Tahchy, A.; Skrzypek, E.; Wójtowicz, T.; Laurain-Mattar, D. Influence of auxins on somatic embryogenesis and alkaloid accumulation in Leucojum aestivum callus. Cent. Eur. J. Biol. 2013, 8, 591–599. [Google Scholar] [CrossRef]
- Lichtenthaler, H.K.; Wellburn, A.R. Determinations of total carotenoids and chlorophylls a and b of leaf extracts in different solvents. Biochem. Soc. Trans. 1983, 11, 591–592. [Google Scholar] [CrossRef]
- Dubois, M.; Gilles, K.A.; Hamilton, J.K.; Rebers, P.A.; Smith, F. Colorimetric method for determination of sugars and related substances. Anal. Chem. 1956, 28, 350–356. [Google Scholar] [CrossRef]
- Singleton, V.L.; Rossi, J.A. Colorimetry of total phenolics with phosphomolybdic-phosphotungstic acid reagents. Am. J. Enol. Vitic. 1965, 16, 144–158. [Google Scholar]
- Ramos, R.T.M.; Bezerra, I.C.F.; Ferreira, M.R.A.; Soares, L.A.L. Spectrophotometric quantification of flavonoids in herbal material, crude extract, and fractions from leaves of Eugenia uniflora Linn. Pharmacogn. Res. 2017, 9, 253–260. [Google Scholar]
- Aebi, H. Catalase in vitro. Methods Enzymol. 1984, 105, 121–125. [Google Scholar] [PubMed]
- Lűck, H. Peroxidase. In Methoden Der Enzymatischen Analyse; Bergmeyer, H.U., Ed.; Verlag Chemie: Weinheim, Germany, 1962; pp. 895–897. [Google Scholar]
- McCord, J.; Fiodovich, I. Superoxide dismutase an enzimic function for erytrocuperein (hemocuperein). J. Biol. Chem. 1969, 244, 6049–6055. [Google Scholar] [CrossRef] [PubMed]
- Bradford, M.M. A rapid and sensitive method for the quantitation of microgram quantities of protein utilizing the principle of protein-dye binding. Anal. Biochem. 1976, 72, 248–254. [Google Scholar] [CrossRef]
- Spina, R.; Saliba, S.; Dupire, F.; Ptak, A.; Hehn, A.; Piutti, S.; Poinsignon, S.; Leclerc, S.; Bouguet-Bonnet, S.; Laurain-Mattar, D. Molecular identification of endophytic bacteria in Leucojum aestivum in vitro culture, NMR-based metabolomics study and LC-MS analysis leading to potential Amaryllidaceae alkaloid production. Int. J. Mol. Sci. 2021, 22, 1773. [Google Scholar] [CrossRef]
- Ptak, A.; Morańska, E.; Warchoł, M.; Gurgul, A.; Skrzypek, E.; Dziurka, M.; Laurain-Mattar, D.; Spina, R.; Jaglarz, A.; Simlat, M. Endophytic bacteria from in vitro culture of Leucojum aestivum L. a new source of galanthamine and elicitor of alkaloid biosynthesis. Sci. Rep. 2022, 12, 13700. [Google Scholar] [CrossRef]


| Photosynthetic Pigment Concentrations (µg/g FW) | Light | |||
|---|---|---|---|---|
| White (F) (Control) | Blue (L) | Red (L) | White (L)-Red (L) | |
| Chlorophyll a | 14.13 ± 1.53 ab | 16.01 ± 0.98 a | 13.06 ± 0.72 b | 8.51 ± 1.13 c |
| Chlorophyll b | 12.85 ± 0.39 a | 11.64 ± 2.14 a | 11.11 ± 1.95 a | 11.12 ± 1.10 a |
| Carotenoids | 2.24 ± 0.52 a | 1.82 ± 0.13 ab | 1.27 ± 0.04 b | 0.37 ± 0.16 c |
| Total Content of Metabolites | Light | |||
|---|---|---|---|---|
| White (F) (Control) | Blue (L) | Red (L) | White (L)-Red (L) | |
| Sugars [mg/g DW] | 73.93 ± 2.54 a | 72.57 ± 1.23 a | 70.63 ± 1.14 a | 70.22 ± 4.75 a |
| Phenolic compounds [mg/g DW] | 51.52 ± 0.27 a | 49.92 ± 1.91 a | 48.58 ± 2.32 a | 51.07 ± 0.56 a |
| Flavonoids [µg/mg DW] | 0.40 ± 0.03 a | 0.32 ± 0.01 ab | 0.29 ± 0.01 b | 0.36 ± 0.05 ab |
| Phenolic Acid Concentrations [ng/mg DW] | Light | |||
|---|---|---|---|---|
| White (F) (Control) | Blue (L) | Red (L) | White (L)-Red (L) | |
| chlorogenic | 0.06 ± 0.003 a | 0.06 ± 0.006 a | 0.06 ± 0.004 a | 0.05 ± 0.001 a |
| p-hydroxybenzoic | 0.67 ± 0.044 c | 1.07 ± 0.039 a | 0.82 ± 0.034 bc | 0.95 ± 0.114 ab |
| caffeic | 1.88 ± 0.175 b | 1.80 ± 0.036 b | 2.04 ± 0.191 b | 3.16 ± 0.153 a |
| syringic | 0.36 ± 0.027 b | 0.37 ± 0.018 b | 0.28 ± 0.007 c | 0.48 ± 0.007 a |
| p-coumaric | 1.30 ± 0.004 a | 1.06 ± 0.015 b | 1.18 ± 0.087 ab | 1.18 ± 0.016 ab |
| ferulic | 3.07 ± 0.206 b | 2.98 ± 0.085 b | 2.70 ± 0.065 b | 3.54 ± 0.145 a |
| sinapic | 1.98 ± 0.082 c | 2.62 ± 0.064 a | 1.70 ± 0.055 d | 2.20 ± 0.057 b |
| benzoic | 1.66 ± 0.161 c | 2.83 ± 0.215 a | 2.24 ± 0.055 b | 2.08 ± 0.079 bc |
| Antioxidant Enzyme Activities (U/mg protein) | Light | |||
|---|---|---|---|---|
| White (F) (Control) | Blue (L) | Red (L) | White (L)-Red (L) | |
| CAT | 0.38 ± 0.15 b | 0.45 ± 0.07 ab | 0.69 ± 0.13 a | 0.51 ± 0.13 ab |
| POD | 4.33 ± 0.37 a | 4.03 ± 0.42a | 4.02 ± 0.32 a | 4.47 ± 0.10 a |
| SOD | 0.14 ± 0.01 b | 0.12 ± 0.01 b | 0.20 ± 0.05 a | 0.14 ± 0.01 b |
| Alkaloid | Formula | Retention Time [min] | Base Peak | Light | |||
|---|---|---|---|---|---|---|---|
| White (F) (Control) | Blue (L) | Red (L) | White (L)-Red (L) | ||||
| Galanthamine | C17H21NO3 | 9.30 | 287 | nd | nd | nd | nd |
| Demethylmaritidine | C16H19NO3 | 10.74 | 273 | 15.3% | 21.4% | - | 20.6% |
| Lycorine | C16H17NO4 | 14.03 | 226 | 15.6% | 15.65% | nd | nd |
Disclaimer/Publisher’s Note: The statements, opinions and data contained in all publications are solely those of the individual author(s) and contributor(s) and not of MDPI and/or the editor(s). MDPI and/or the editor(s) disclaim responsibility for any injury to people or property resulting from any ideas, methods, instructions or products referred to in the content. |
© 2023 by the authors. Licensee MDPI, Basel, Switzerland. This article is an open access article distributed under the terms and conditions of the Creative Commons Attribution (CC BY) license (https://creativecommons.org/licenses/by/4.0/).
Share and Cite
Morańska, E.; Simlat, M.; Warchoł, M.; Skrzypek, E.; Waligórski, P.; Laurain-Mattar, D.; Spina, R.; Ptak, A. Phenolic Acids and Amaryllidaceae Alkaloids Profiles in Leucojum aestivum L. In Vitro Plants Grown under Different Light Conditions. Molecules 2023, 28, 1525. https://doi.org/10.3390/molecules28041525
Morańska E, Simlat M, Warchoł M, Skrzypek E, Waligórski P, Laurain-Mattar D, Spina R, Ptak A. Phenolic Acids and Amaryllidaceae Alkaloids Profiles in Leucojum aestivum L. In Vitro Plants Grown under Different Light Conditions. Molecules. 2023; 28(4):1525. https://doi.org/10.3390/molecules28041525
Chicago/Turabian StyleMorańska, Emilia, Magdalena Simlat, Marzena Warchoł, Edyta Skrzypek, Piotr Waligórski, Dominique Laurain-Mattar, Rosella Spina, and Agata Ptak. 2023. "Phenolic Acids and Amaryllidaceae Alkaloids Profiles in Leucojum aestivum L. In Vitro Plants Grown under Different Light Conditions" Molecules 28, no. 4: 1525. https://doi.org/10.3390/molecules28041525