1. Introduction
Bovine hard cheeses are a widely consumed dairy product throughout much of the world and pre-grated products made from these cheeses are popular as a condiment for many foods. The majority of these products are composed of grated cheese with small amounts of antimycotic preservatives such as potassium sorbate, which was used in many samples in this study. Anti-caking agents such as cellulose powder are also used in most samples tested. Some grated cheeses with no additives are also encountered. Adulteration of these cheese products has previously been discovered involving the addition of cellulose powder as a filler at levels far beyond those sufficient to prevent caking [
1]. Food adulteration leads to a product that is cheaper and is sold as the original product. This results in consumers buying a product that is not what they expected and is often inferior to the unadulterated version. Due to the nature of this product’s manufacture and its typical use as a garnish on other foods, it would seem a prime candidate for adulteration with a low chance of discovery by the consumer.
NMR analysis of food products is a powerful tool for the detection of adulteration. It is ideal for analyses of this type due to high sample throughput, the ability to discriminate based on structural differences of metabolites with similar masses, and the ability to examine samples in either their native state or with little sample preparation. Despite these abilities, NMR does not appear to have previously been applied to detecting the adulteration of cheese with vegetable oils.
NMR simplifies the analysis of structural features in analytes, and this becomes a very powerful tool to detect food fraud. While structural information can be inferred from chromatography retention times or tandem mass spectrometry, it is inherent to NMR experiments. It is particularly valuable when identifying lipids in edible oils or cheese. For example, both α-linolenic acid and γ-linolenic acid are 18-carbon, triply unsaturated fatty acids found in edible oils with identical molecular weights of 278.436 Da. Via LC-MS these fatty acids would only vary by retention time assuming adequate separation in the chromatography step. Tandem mass spectrometry can also be used to differentiate these, but this involves a separate experiment. However, as α-linolenic acid is an ω-3 fatty acid with an unsaturated bond located three carbons from the terminal methyl group, its methyl group displays a distinct triplet proton resonance at approximately 0.97 ppm, where the ω-6 γ-linolenic’s methyl signal is closer to 0.85 ppm [
2]. This allows for much easier quantification of ω-3 fatty acids with NMR and speeds the determination of a sample’s lipid profile. Additionally, this structural information is invaluable when comparing levels of polyunsaturated fatty acids, total numbers of unsaturated bonds, and ω-3 fatty acid levels present in a sample. While not an exhaustive analysis of the sample’s composition, it is often sufficient to determine the authenticity of said sample.
The simplicity of NMR sample preparation is a natural complement to its inherent speed of analysis. Simple dilution or liquid extractions are much less labor intensive than some sample preparation regimens required for other methods. Significant improvements in laboratory throughput can be achieved by eliminating the need for steps such as derivatization for gas chromatography of non-volatile compounds, hydrolysis of triacylglycerols for analysis of lipids in mass spectrometry, and with the additional benefit of reducing the opportunity for sample contamination or errors. This also has the benefit of analyzing samples in their native or near-native state without chemical modification.
Analysis of cheese via NMR has been performed for quite some time. However, previous works were typically focused on aqueous extracts in order to determine point of origin [
3,
4], or a combination of origination and the process of cheese ripening [
5].
1H NMR-based lipid profiling of cheese has been performed before, however, this approach involved a lengthy soxhlet extraction step making it less appealing for routine screening of samples, and the study did not address adulteration [
5]. The spectral differences between the lipid profiles of genuine cheese and imitation cheese prepared from vegetable oil was demonstrated previously but this method was also not applied to the detection of adulterated products in a market survey [
6]. Mass spectrometry has also been used to profile the lipids in cheese but was similarly not used as an approach for detecting adulteration [
7].
The aim of this study was to create and test a method for the analysis of hard cheese products with the aim of detecting vegetable oil adulterants. The method was designed to be rapid in order to facilitate its use in high-throughput situations. The difference in lipid profiles between cheese and vegetable oils makes the detection of adulterated cheeses relatively straightforward with a simple ratiometric analysis.
2. Results and Discussion
A number of ungrated bovine hard cheeses were obtained. A description of the cheeses can be found in the
Section 3 and are designated as “baseline” samples due to being representative of genuine cheese.
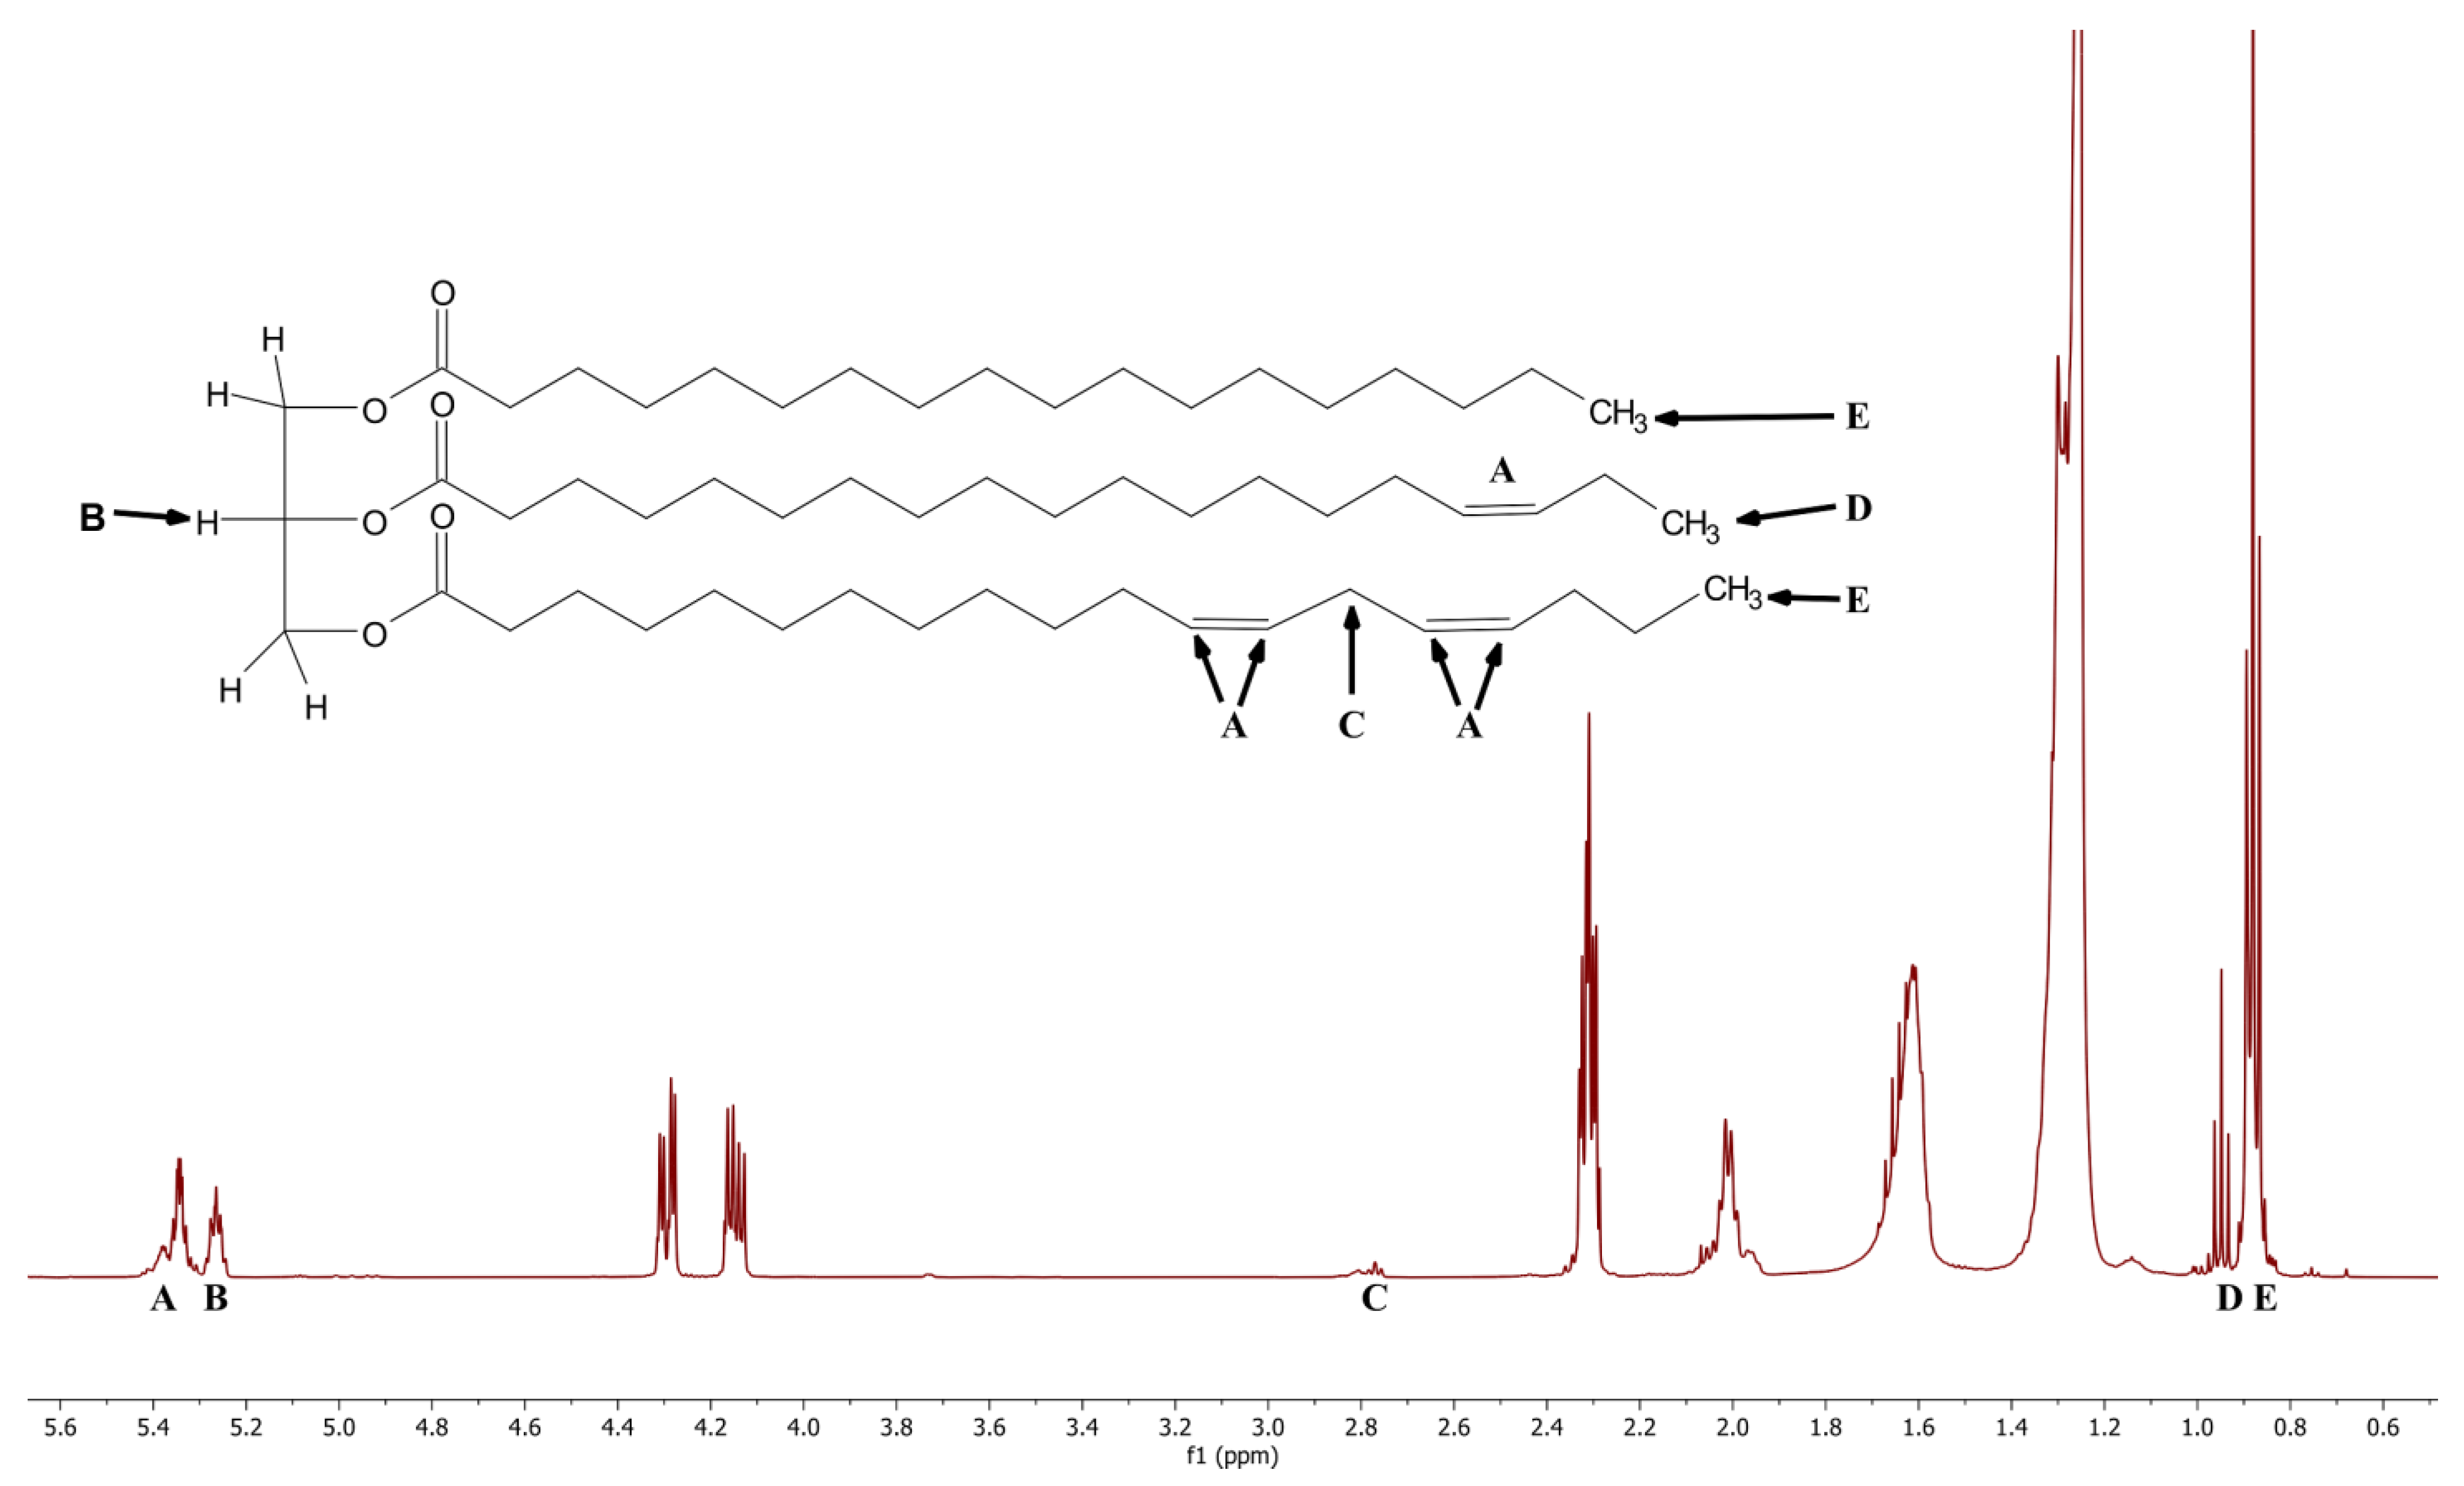
1H NMR spectra were obtained for each of these cheese samples. The samples were found to have a spectrum consistent with lipids in the form of triacylglycerols.
Figure 1 is the
1H NMR spectrum of one the parmesan baseline cheeses. The labels A through E below the spectrum indicate the region of interest for this study. The chemical structure in
Figure 1 is an idealized triacylglycerol. The five labels, A through E, on the structure indicate the protons that give rise to the resonances obtained in the spectrum.
The five regions of interest were examined using the raw integral values from the associated peaks. (
Table 1 and
Figure 1). Several different integral ratios were determined for the baseline cheeses. The results of this ratio comparison are presented in
Table 2. The baseline cheeses showed acceptable consistency in all four ratios despite the variety of cheeses.
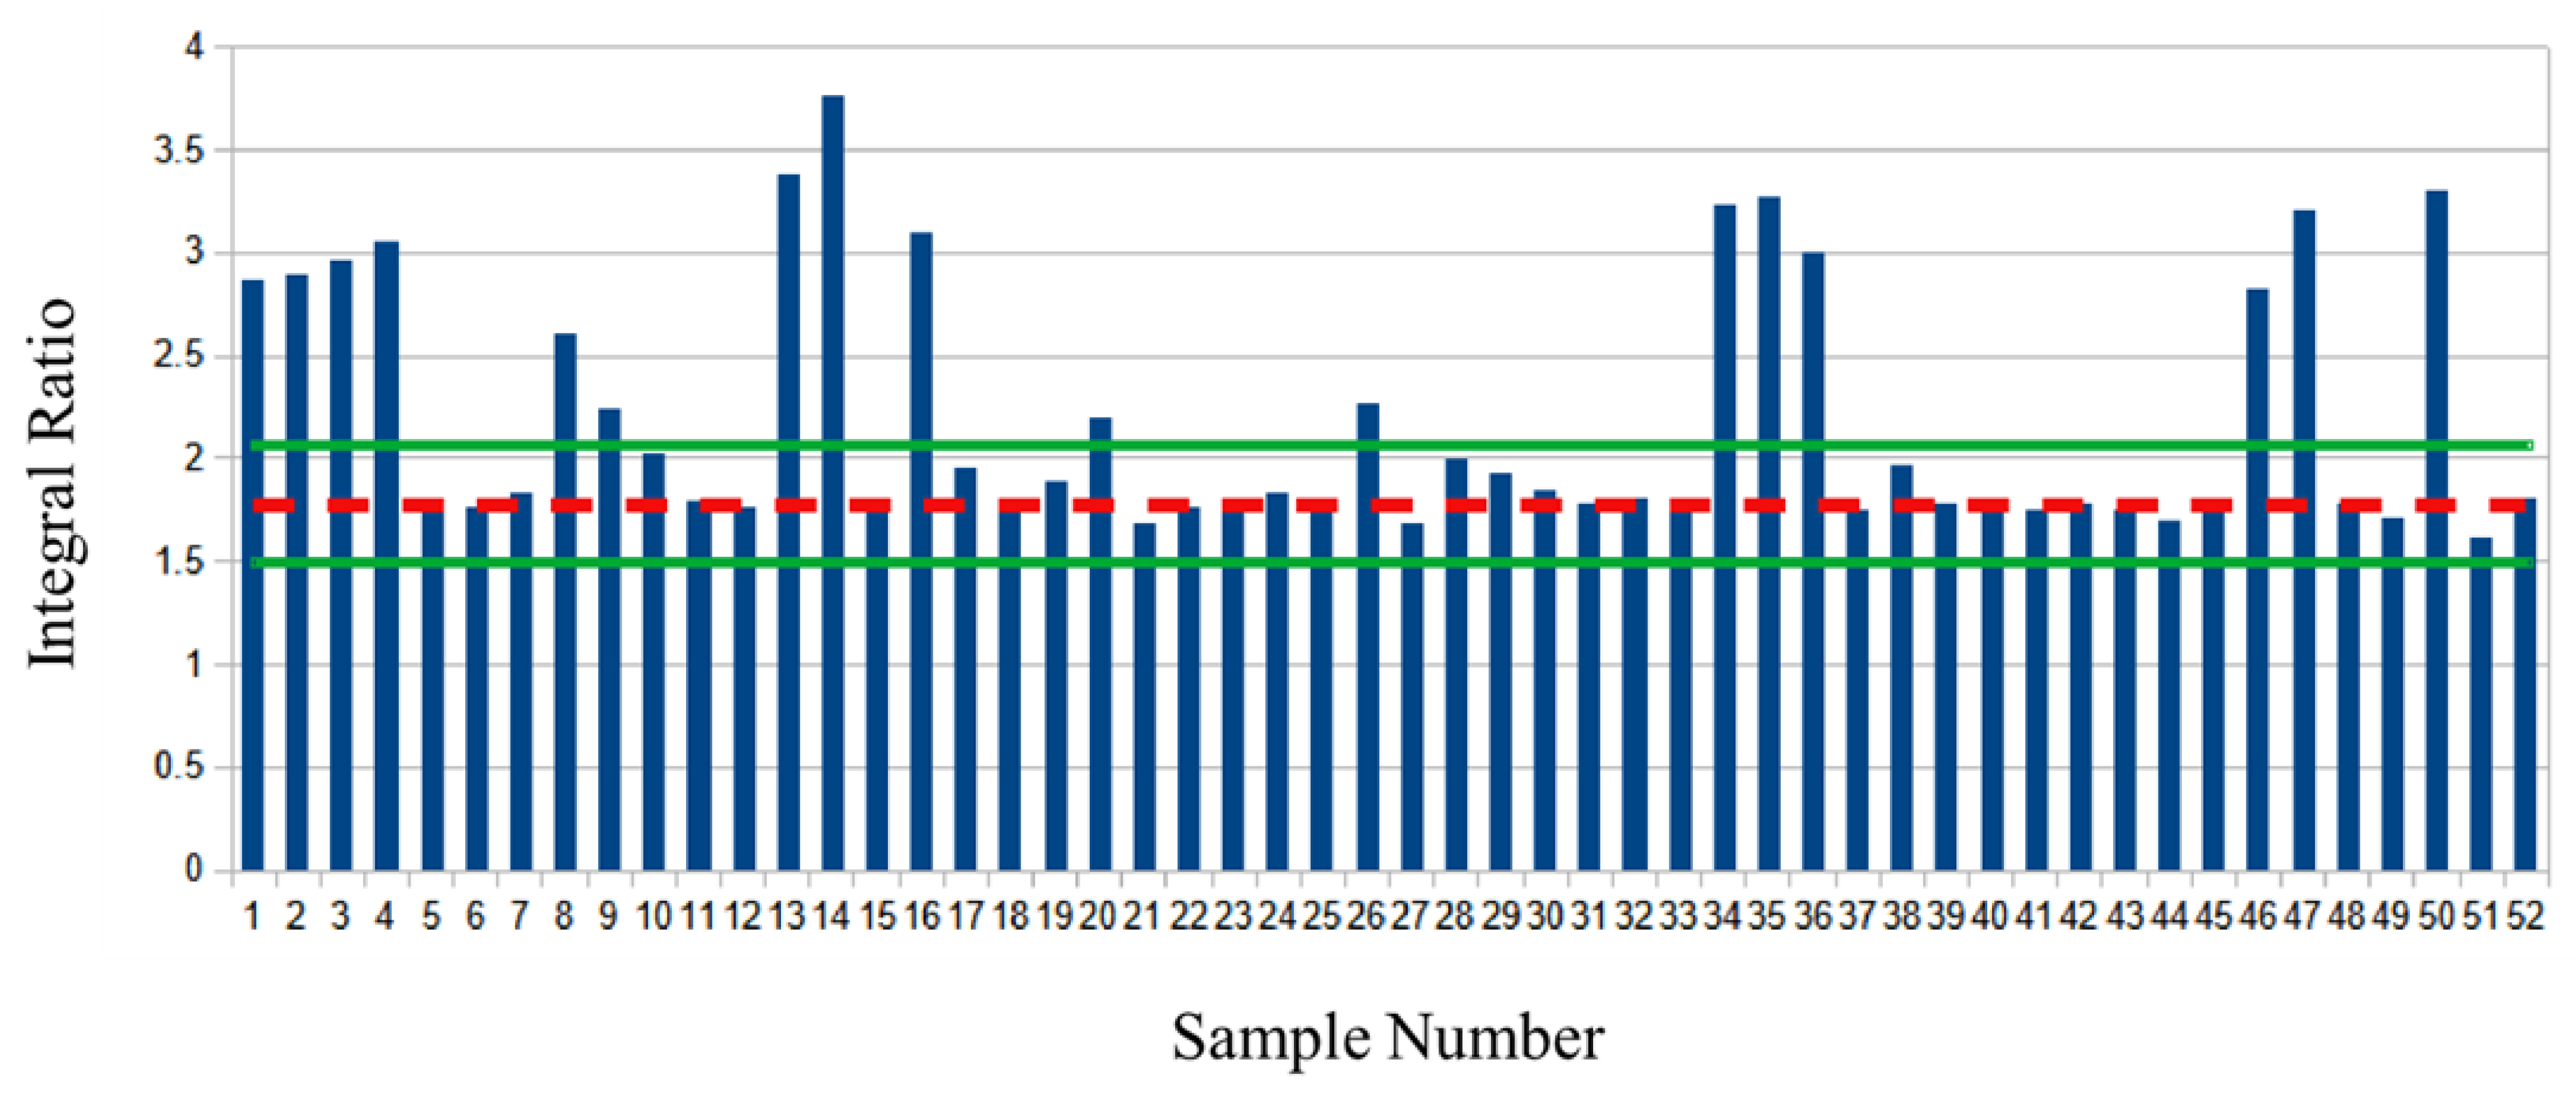
In
Figure 2, the dashed red line is the average value of the unsaturated bonds to glycerol C2 proton ratio (A:B) of the baseline samples. The green lines represent the ± two standard deviations (S.D.) of the baseline sample ratio average. A number of samples (n = 17) appear to be outliers (deviation greater than two S.D.) based on the ratiometric analysis.
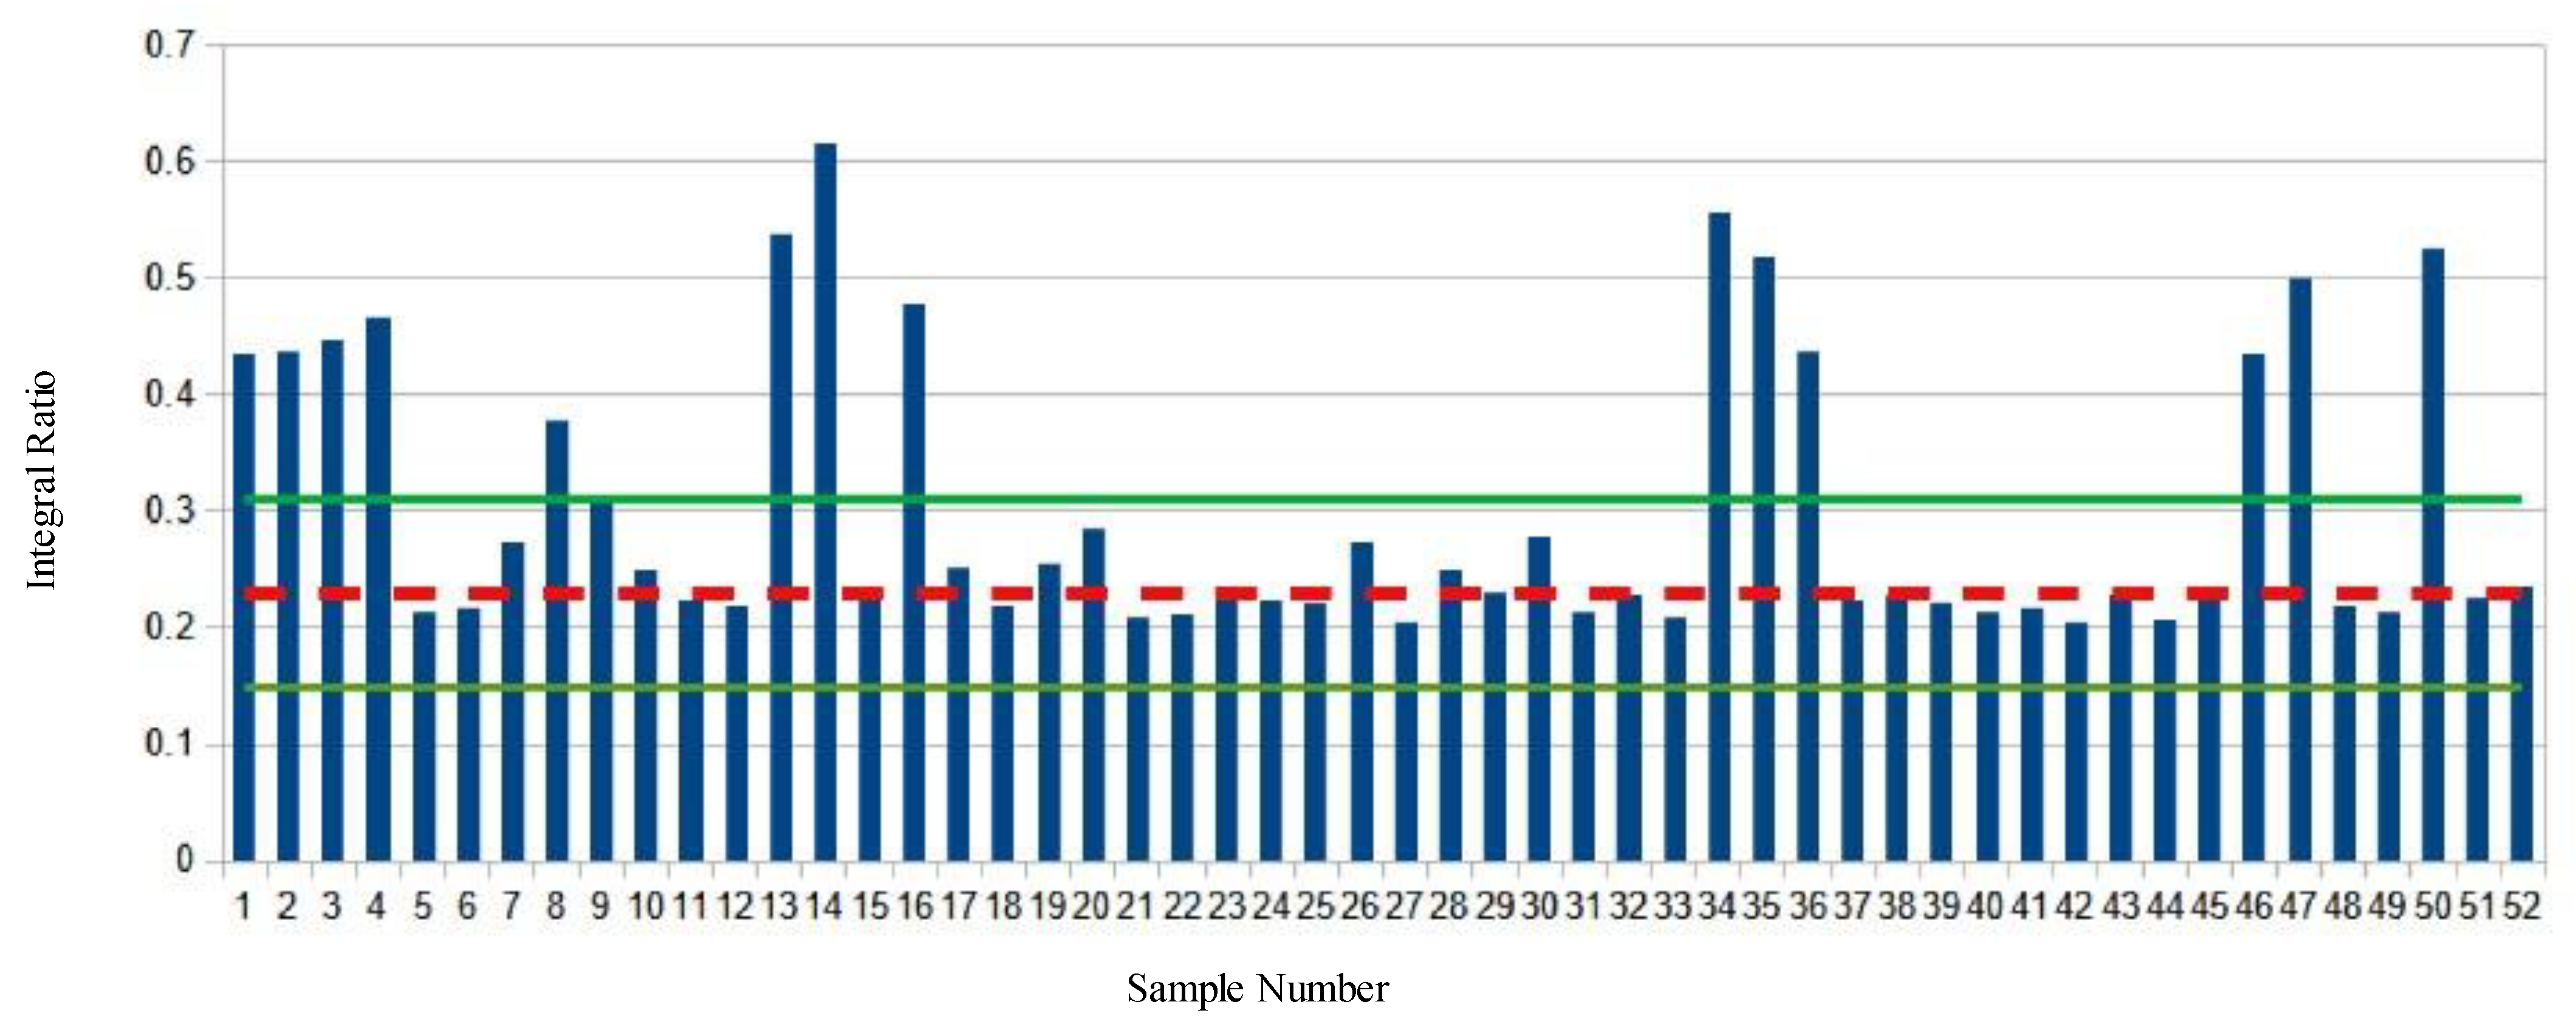
Figure 3 shows the polyunsaturated protons to glycerol C2 proton ratio (C:B) of the market survey samples. The average ratio of the baseline samples is shown with a red dashed line. The green lines indicate the mean plus or minus two S.D. Fourteen different samples show significant deviations from the average values.
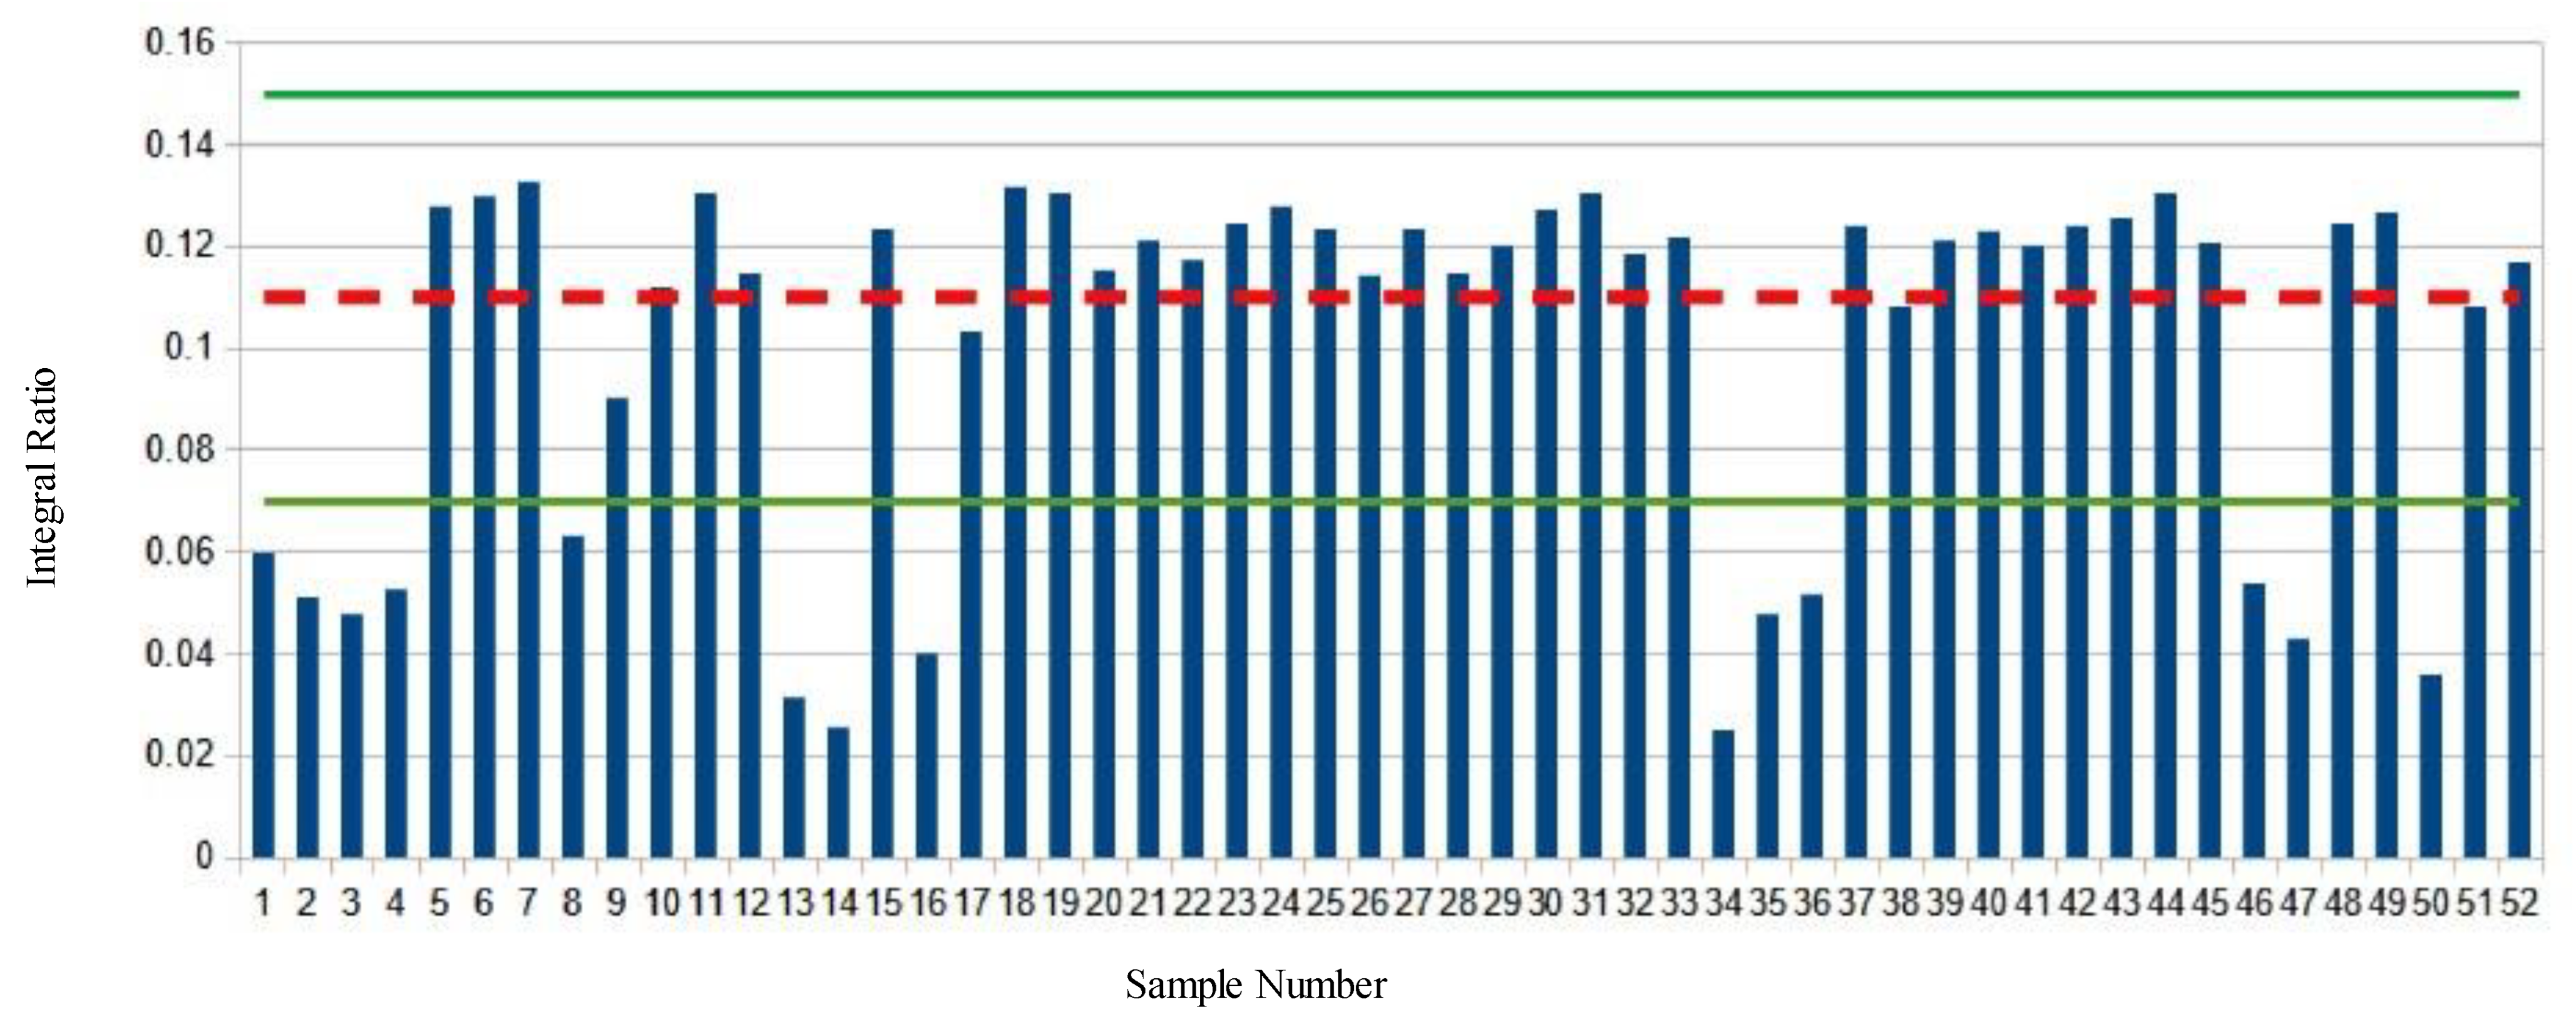
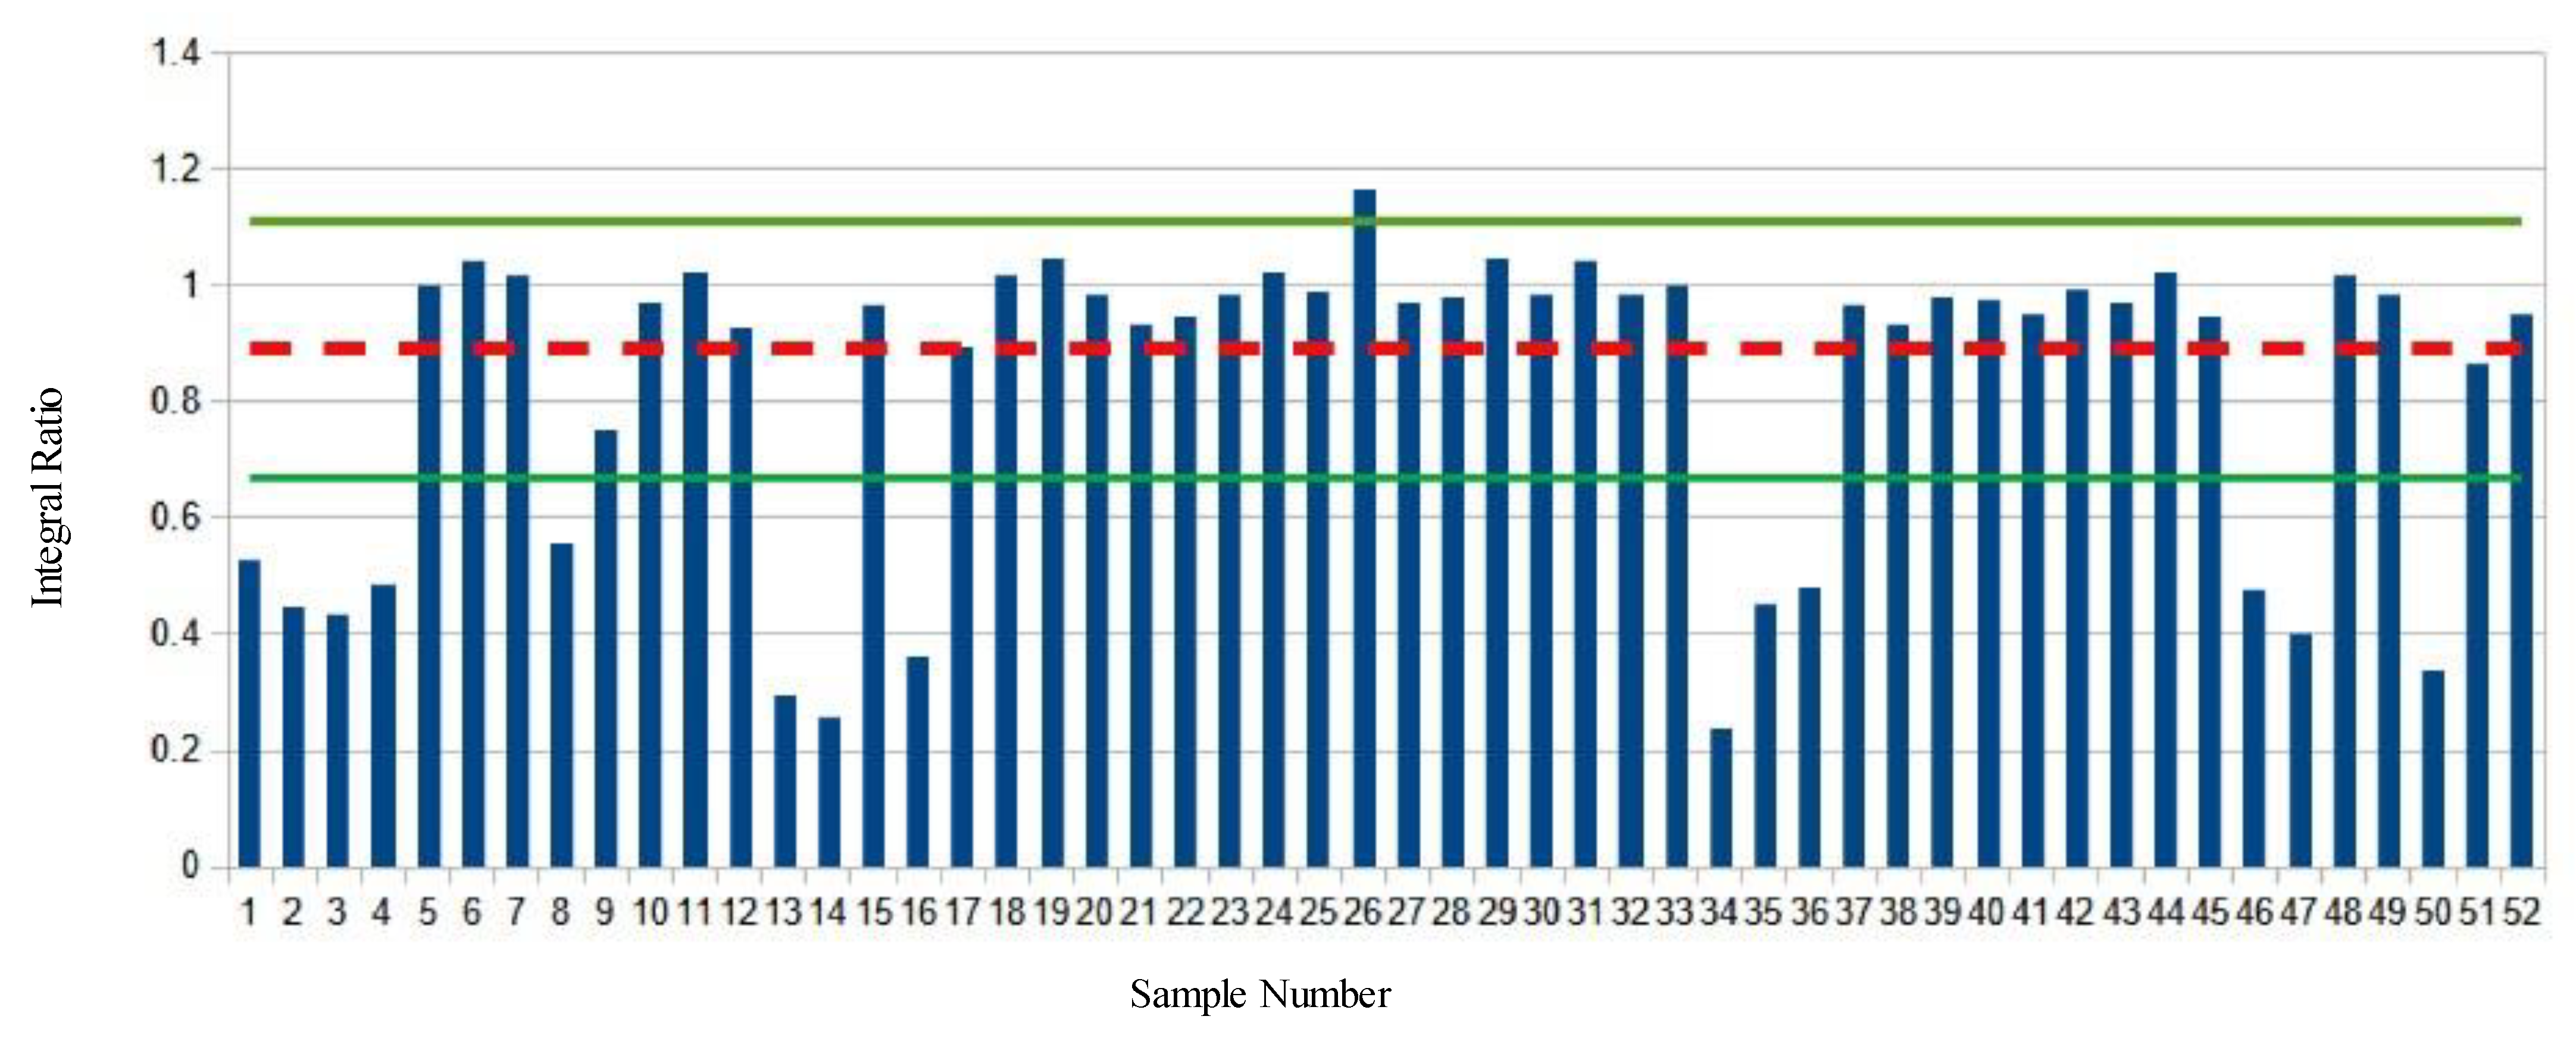
Figure 4 shows the ω-3 methyl to remaining methyl proton ratio (D:E) of the market survey samples. The average ratio of the baseline samples is shown with a red dashed line. The green lines indicate the mean plus or minus two S.D. Again, 14 different samples show significant deviations from the average values, this time to lower integral ratios.
Figure 5 shows the ω-3 methyl protons to glycerol C2 proton ratio (D:B) of the market survey samples. The average ratio of the baseline samples is shown with a red dashed line. The green lines indicate the mean plus or minus two S.D. One sample shows a positive deviation as an outlier, while 14 samples have ratios significantly less than the baseline average.
Samples 1–4, 8, 9, 13, 14, 16, 34–36, 46, 47, and 50 all appear to be outliers, with ratiometric values falling outside of the 95% confidence interval or two standard deviations of the baseline sample mean. These samples consistently fall outside this interval in every ratiometric analysis and appear with different ratios compared to other market samples. Aside from sample 9, these consistently fall more than two standard deviations outside of the baseline mean. As such these samples were presumed to be adulterated and further investigation was pursued by comparing the spectra of one outlying sample to two presumably unadulterated samples. Due to failing two of the four ratiometric checks, sample 9 is also considered to be adulterated.
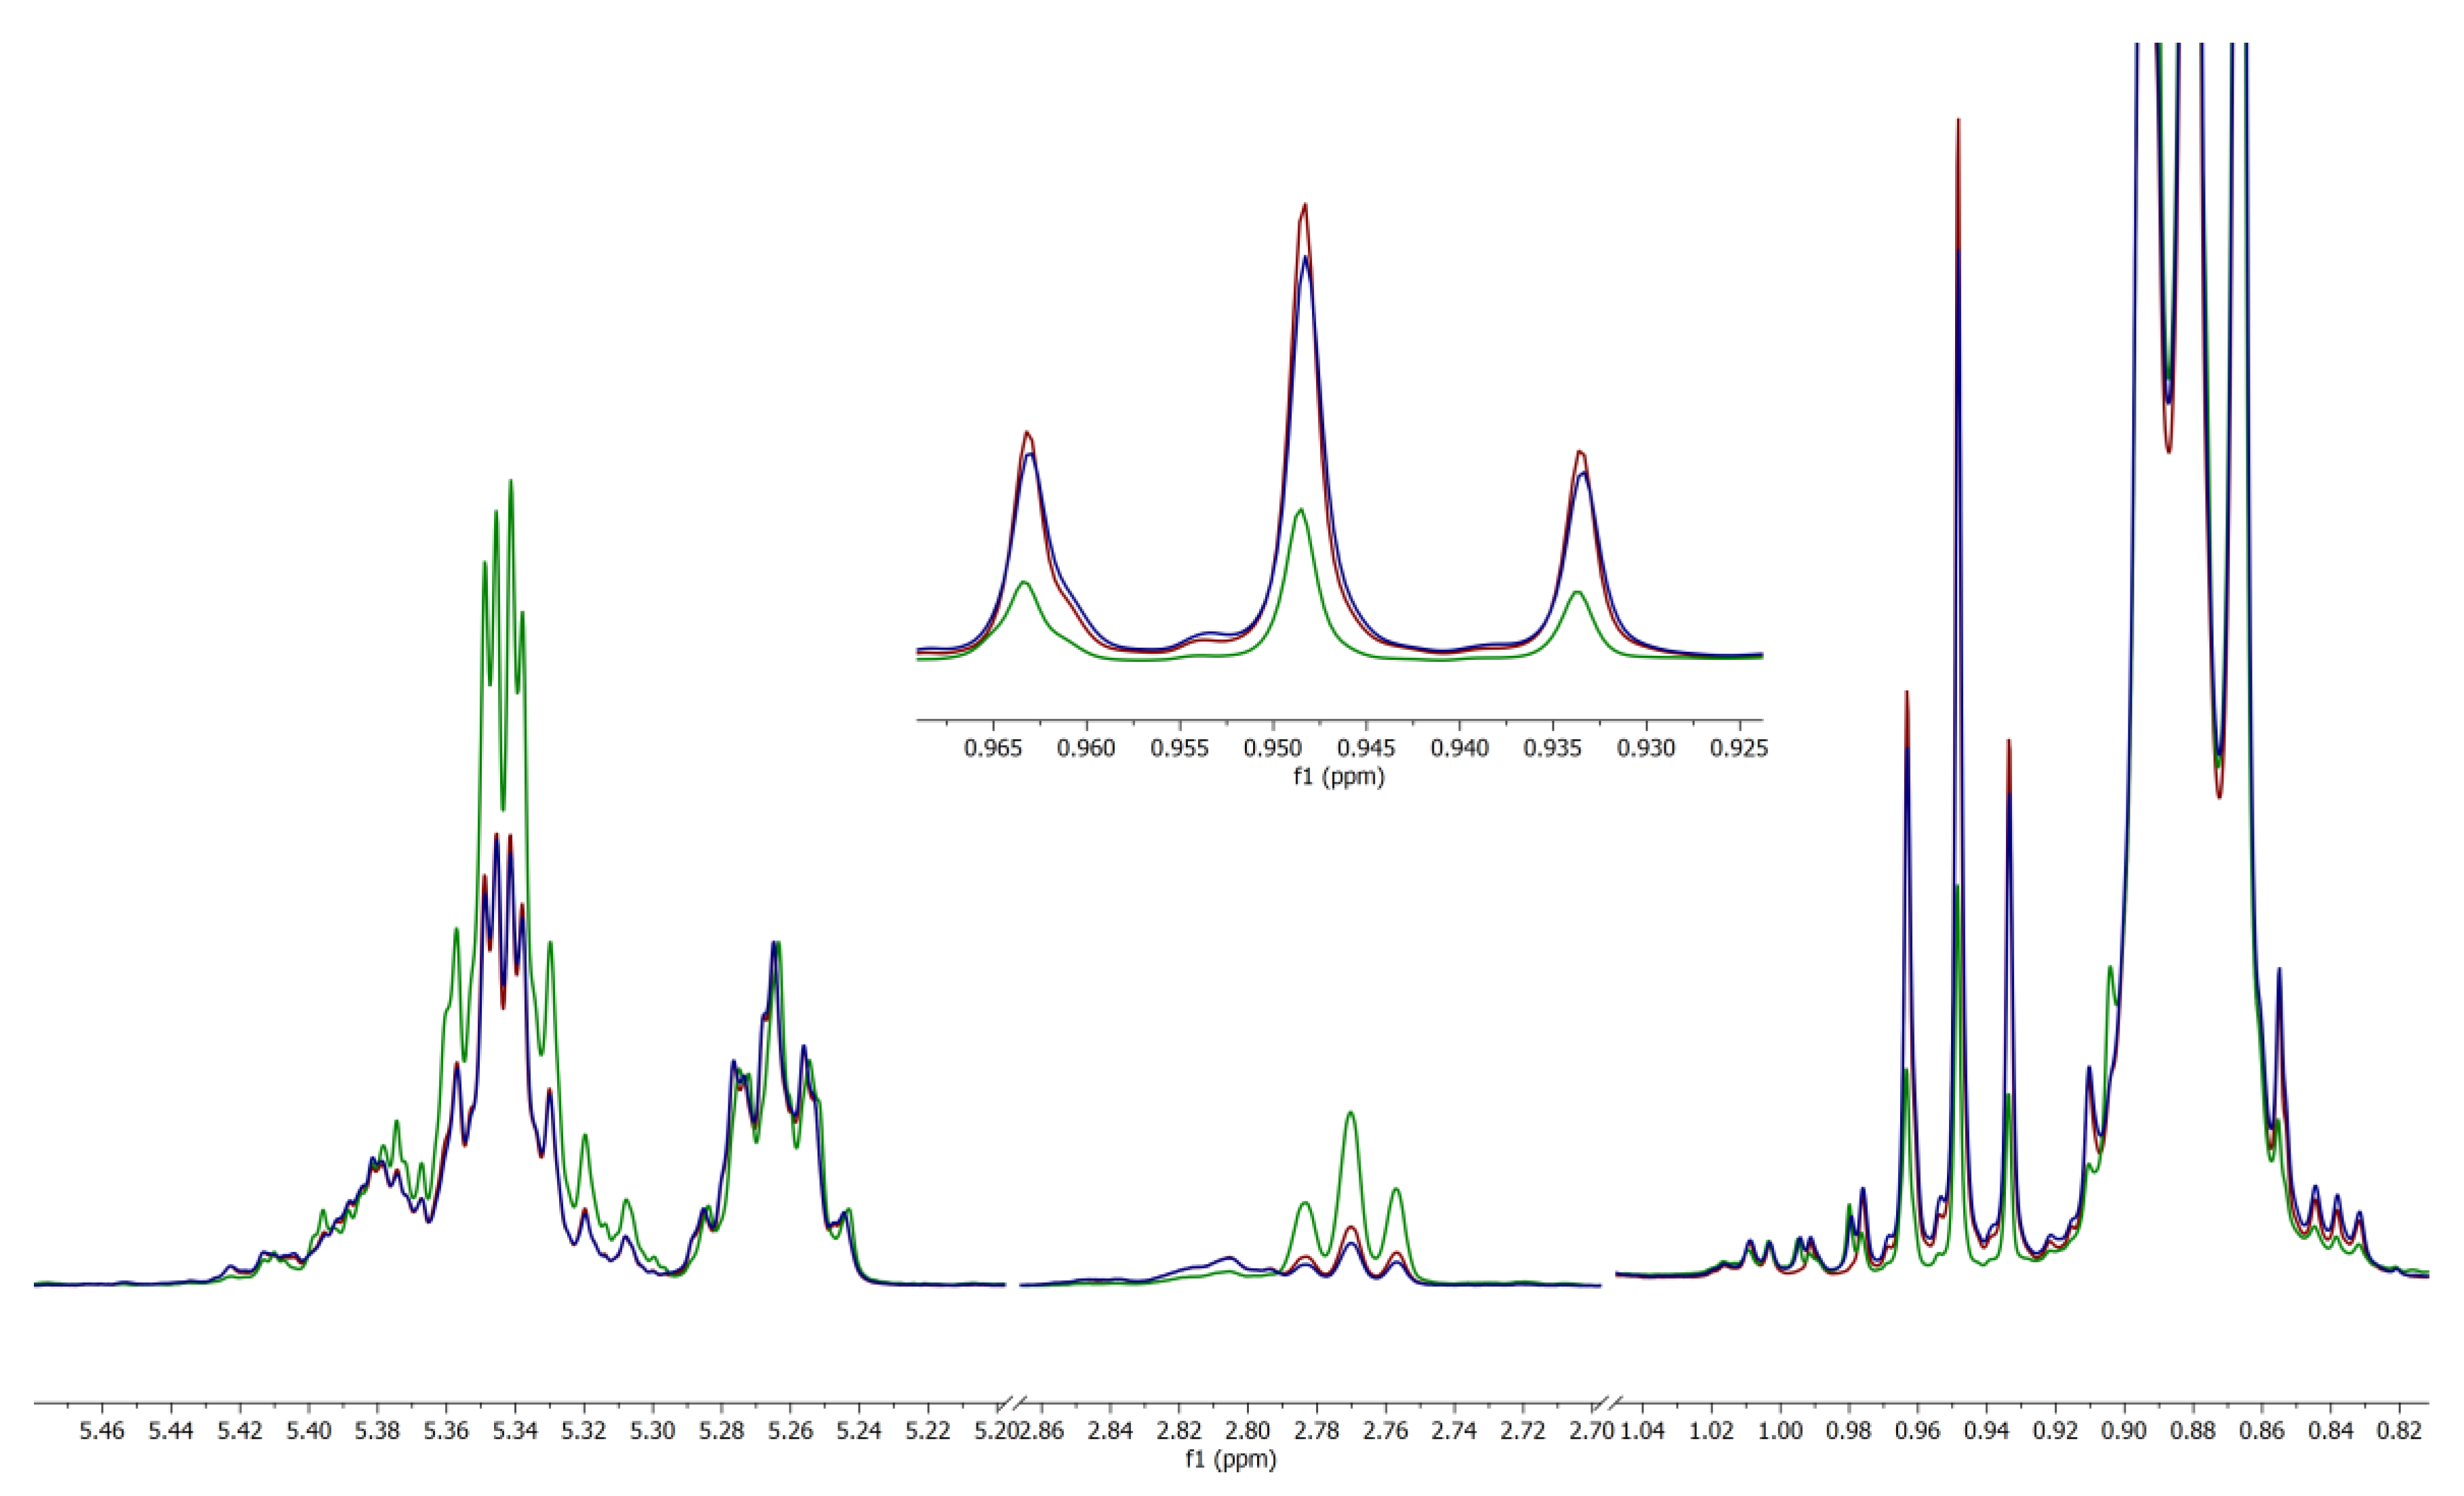
Superimposed spectra of sample 3, sample 42, and baseline sample B1 show a radically different lipid profile in sample 3 versus the others when normalized for intensity to the 5.265 ppm glycerol C2 proton peak (
Figure 6). The glycerol peak was used for normalization due to the majority of lipids in cheese being in the form of triacylglycerol [
8]. The remaining adulterated samples showed overall similar deviation from the baseline spectra with varying degrees of deviation.
The 1H NMR spectra of samples 42 and B1 are very similar. However, sample 3 (green) deviates in the difference in intensity between the C2 glycerol proton peak at 5.265 ppm and the peak of the unsaturated bonds at 5.342 ppm. This is due to sample 3, relative to the C2 glycerol peaks, containing a higher abundance of unsaturated and polyunsaturated bonds than found in the other cheese samples. The ω-3 fatty acid levels are far lower than what would be expected of a genuine cheese sample. An overabundance of unsaturated bonds, polyunsaturated bonds, and low levels of ω-3 fatty acids in sample 3 would suggest adulteration of this sample with a vegetable-sourced oil. Despite being adulterated, sample 3 exhibited no remarkable olfactory or visual differences from any of the other grated cheese samples tested.
In order to identify the adulterant used, a series of intentionally adulterated samples were prepared using sample 19 as a model cheese. Samples were prepared with vegetable oil adulteration in ranges from 5–60 weight% and analyzed as described in the Methods Section. The adulterants used were Canola, grapeseed, peanut, olive, high oleic sunflower, high oleic safflower, high linolenic safflower, soybean, and palm oils. Most oils yielded lipid profiles inconsistent with the adulterated cheese samples, but palm oil yielded a lipid profile nearly identical to sample 3. The results are detailed in
Table 2.
Comparing the other samples suspected of adulteration to intentionally adulterated cheese spectra shows that all of the suspicious samples appear to be adulterated with palm oil to varying degrees. A further study was conducted in order to more conveniently estimate the rate of palm oil adulteration in suspected samples using a calibration curve using integral ratios.
Quantification of the level of palm oil adulteration in these samples was accomplished by generating calibration curves of two peak ratios. This allows for a convenient and more precise estimation of the amount of palm oil in the sample versus the amount of actual cheese. It does not take into account the insoluble anti-caking agents present in all adulterated samples studied and, therefore, is not a measurement of the total
w/
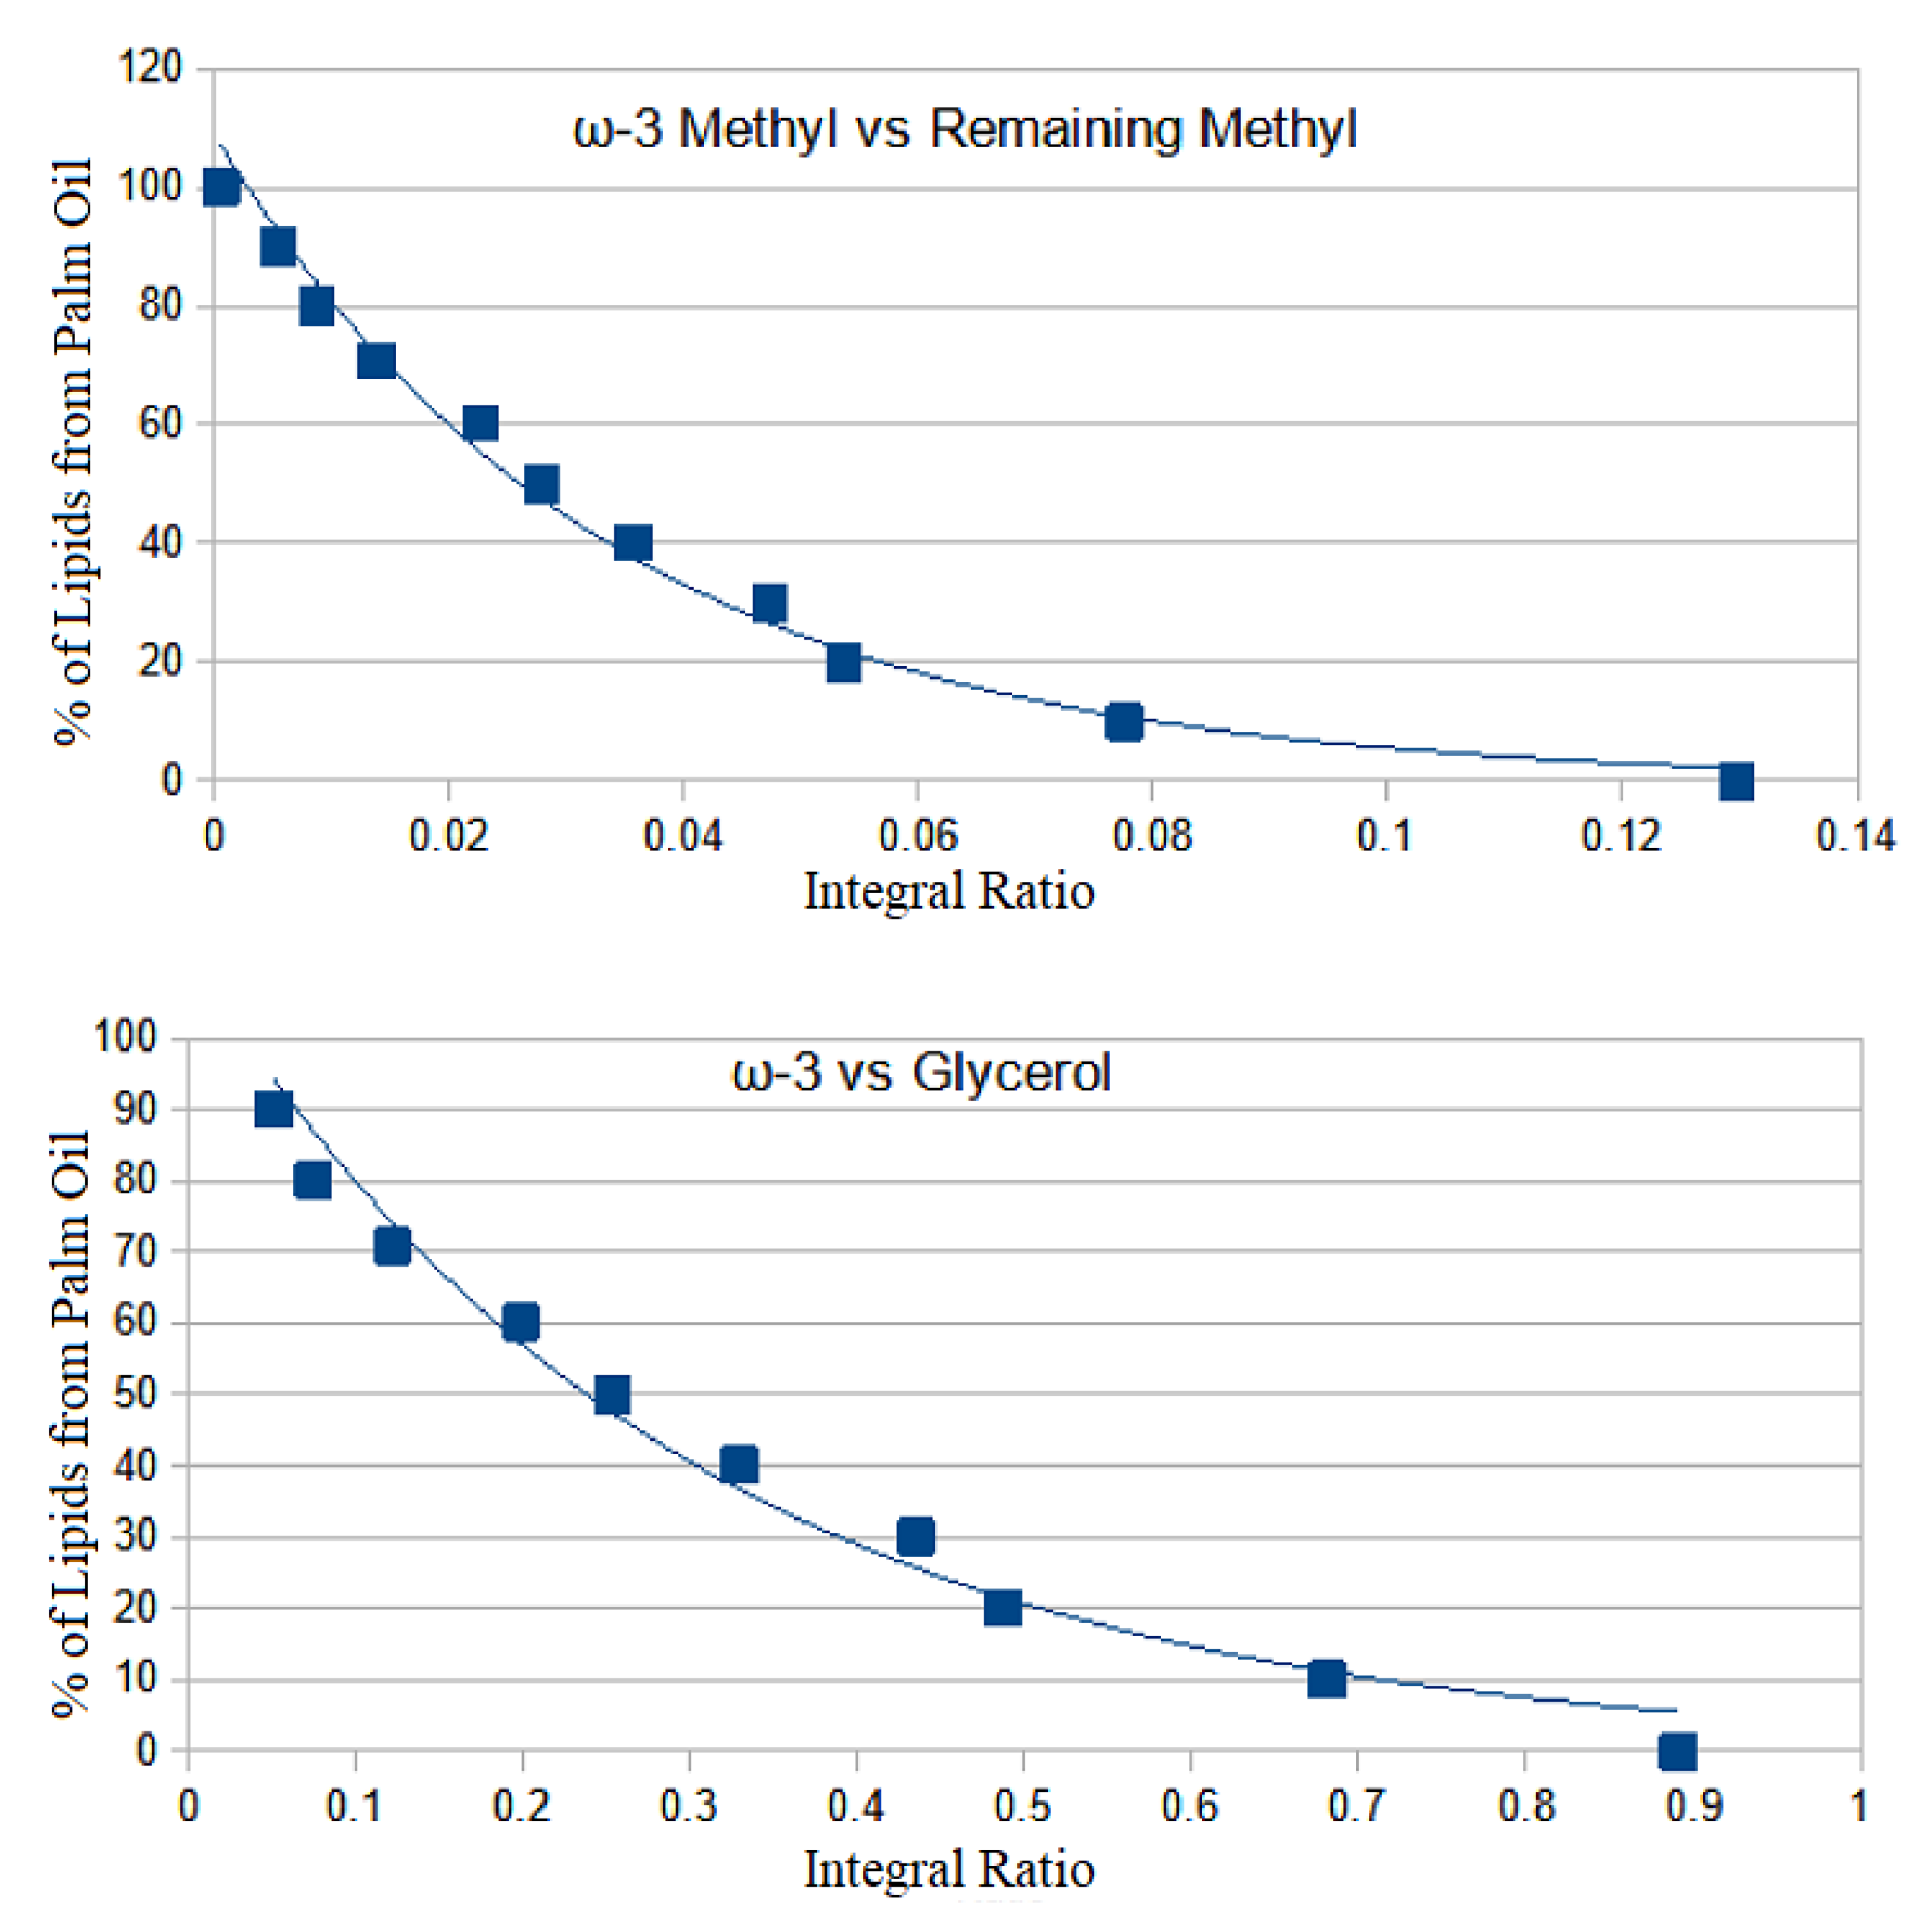
w adulteration rate. Despite this limitation, the calculation does yield important information as to the degree of palm oil adulteration in these samples. Baseline sample B1 was used to make samples adulterated with palm oil in the range of 10 to 90 percent by weight. All samples were extracted and analyzed as described previously. The ratios of the intentionally adulterated cheese were calculated and plotted to generate a calibration curve allowing an estimation of the degree of palm oil adulteration versus cheese in each sample (
Figure 7). The functions for each curve followed an exponential regression. The equation for ω-3 vs. remaining methyl peak was found to be F(x) = 108.9584 × 10
−29.7812x. For the ω-3 vs. glycerol ratio, the equation was F(x) = −112.0973 × 10
−3.3871x. The correlation coefficients for these curves are values of 0.989 and 0.983 respectively.
These calibration curves were used to calculate the approximate amounts of palm oil added to each sample relative to cheese with no accounting for any additional binders. The calculated values were found to be similar to the values determined by overlaying spectra of market survey samples with spectra of serially adulterated samples (
Table 3). While this does not yield an exact determination of the level of adulteration, it does serve to calculate a general estimate of palm oil adulteration levels in these products.
3. Materials and Methods
3.1. Samples
Nine ungrated samples and one grated sample of various cheeses were analyzed to ascertain a lipid profile of unadulterated cheese samples. Of these baseline samples, three were Parmesan, two were Romano, and one was Asiago. To gain a broader understanding of cheese lipid profiles, one sample of Mimolette, one sample of Piave cheese, and one sample each of ungrated and pre-grated mozzarella were also analyzed.
All market survey grated hard cheese samples were obtained from retailers, restaurants, and public school cafeteria kitchens. All samples were composed of Parmesan, Romano, Asiago, and combinations thereof. All samples are detailed in
Table 4.
Canola, grapeseed, peanut, olive, high oleic sunflower, high oleic safflower, high linolenic safflower, soybean, and palm oils were purchased from local and online retailers and used as received.
3.2. Sample Preparation
A 50 ± 2.5 mg sample of each cheese was placed in a 1.5 mL flip-top microcentrifuge tube. To this, 1 mL of deuterated chloroform (CDCl3 99.8% D, 0.03% v/v TMS, Acros Organics, Switzerland) was added and the tube was agitated for 30 min. The resulting extract was removed via pipette and filtered through glass wool directly into a 5 mm NMR tube for analysis.
3.3. 1H NMR
The spectrometer used was a Bruker (Rheinstetten, Germany) Avance III HD spectrometer equipped with a TCI cryoprobe operating at 500.13 MHz. A proton experiment was performed with 16 scans (30° pulse, 20 ppm sweep width, 10 s relaxation time based upon 1.0 s T1, 65,536 data points, 300 K sample temperature). Spectra were processed and analyzed using Mestrenova 14.2 (Mestrelab, Santiago de Compostela, Spain). Processing parameters included referencing to TMS, 0.3 Hz apodization, exponential baseline correction, and automatic phase correction.
4. Conclusions
This study revealed a previously undiscovered method of adulterating pre-grated bovine hard cheeses for economic purposes. Palm oil itself is a clever adulterant owing to its semi-solid state at room temperature, similar color to cheese, and low price compared to cheese. Presumably, these adulterated products contain higher than normal levels of cellulose or other binders in order to maintain the appearance of the product. However, this study is strictly limited to the lipid profile of these products, and no attempts were made to quantify any fillers aside from palm oil.
In this study, 29% of all samples tested were certainly adulterated with palm oil. That combined with nearly half of the adulterated samples possessing lipid fractions composed of greater than 50% palm oil shows a rather brazen attitude in this industry regarding the commission of fraud through the adulteration of these products. The 52 samples tested are by no means an exhaustive survey of all pre-grated hard cheeses sold, however, it does reveal a new frontier in food adulteration. The method described herein will make the detection of this new type of food adulteration straightforward and aid in combating the problem.

 ,
, 


