
Sherlock—A Free and Open-Source System for the Computer-Assisted Structure Elucidation of Organic Compounds from NMR Data


Abstract
:1. Introduction
2. Results and Discussion
2.1. The Test Dataset
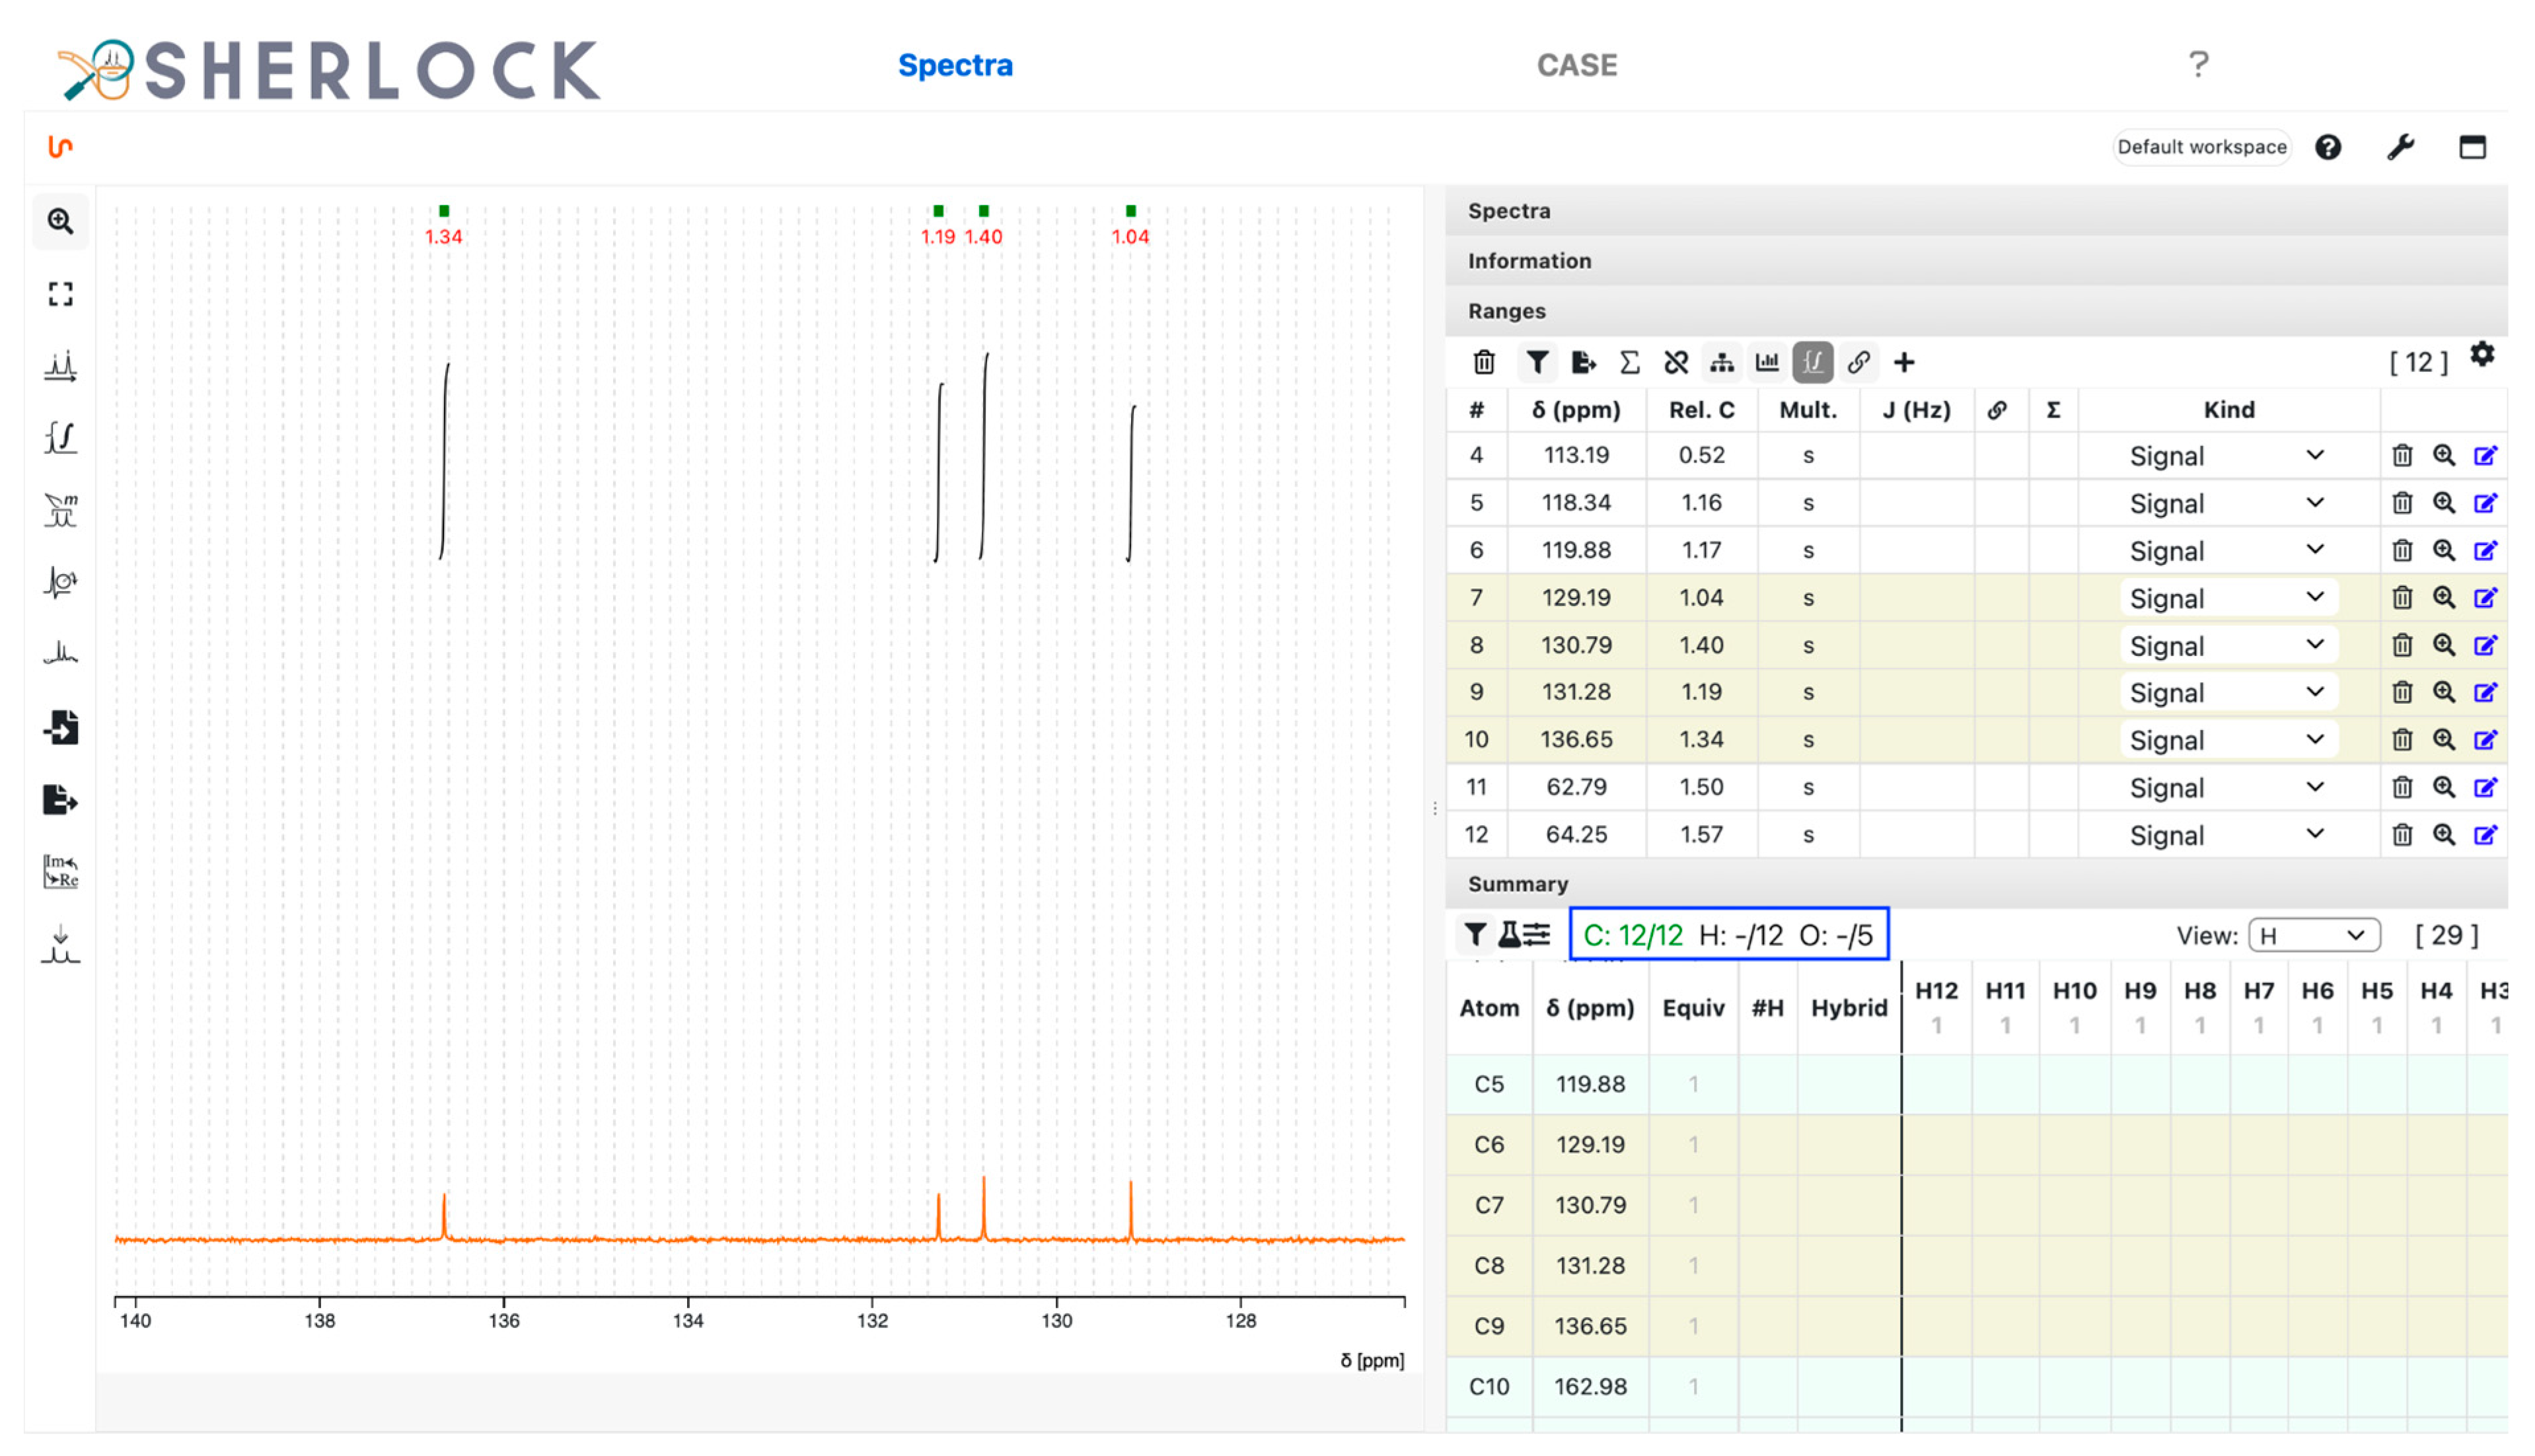
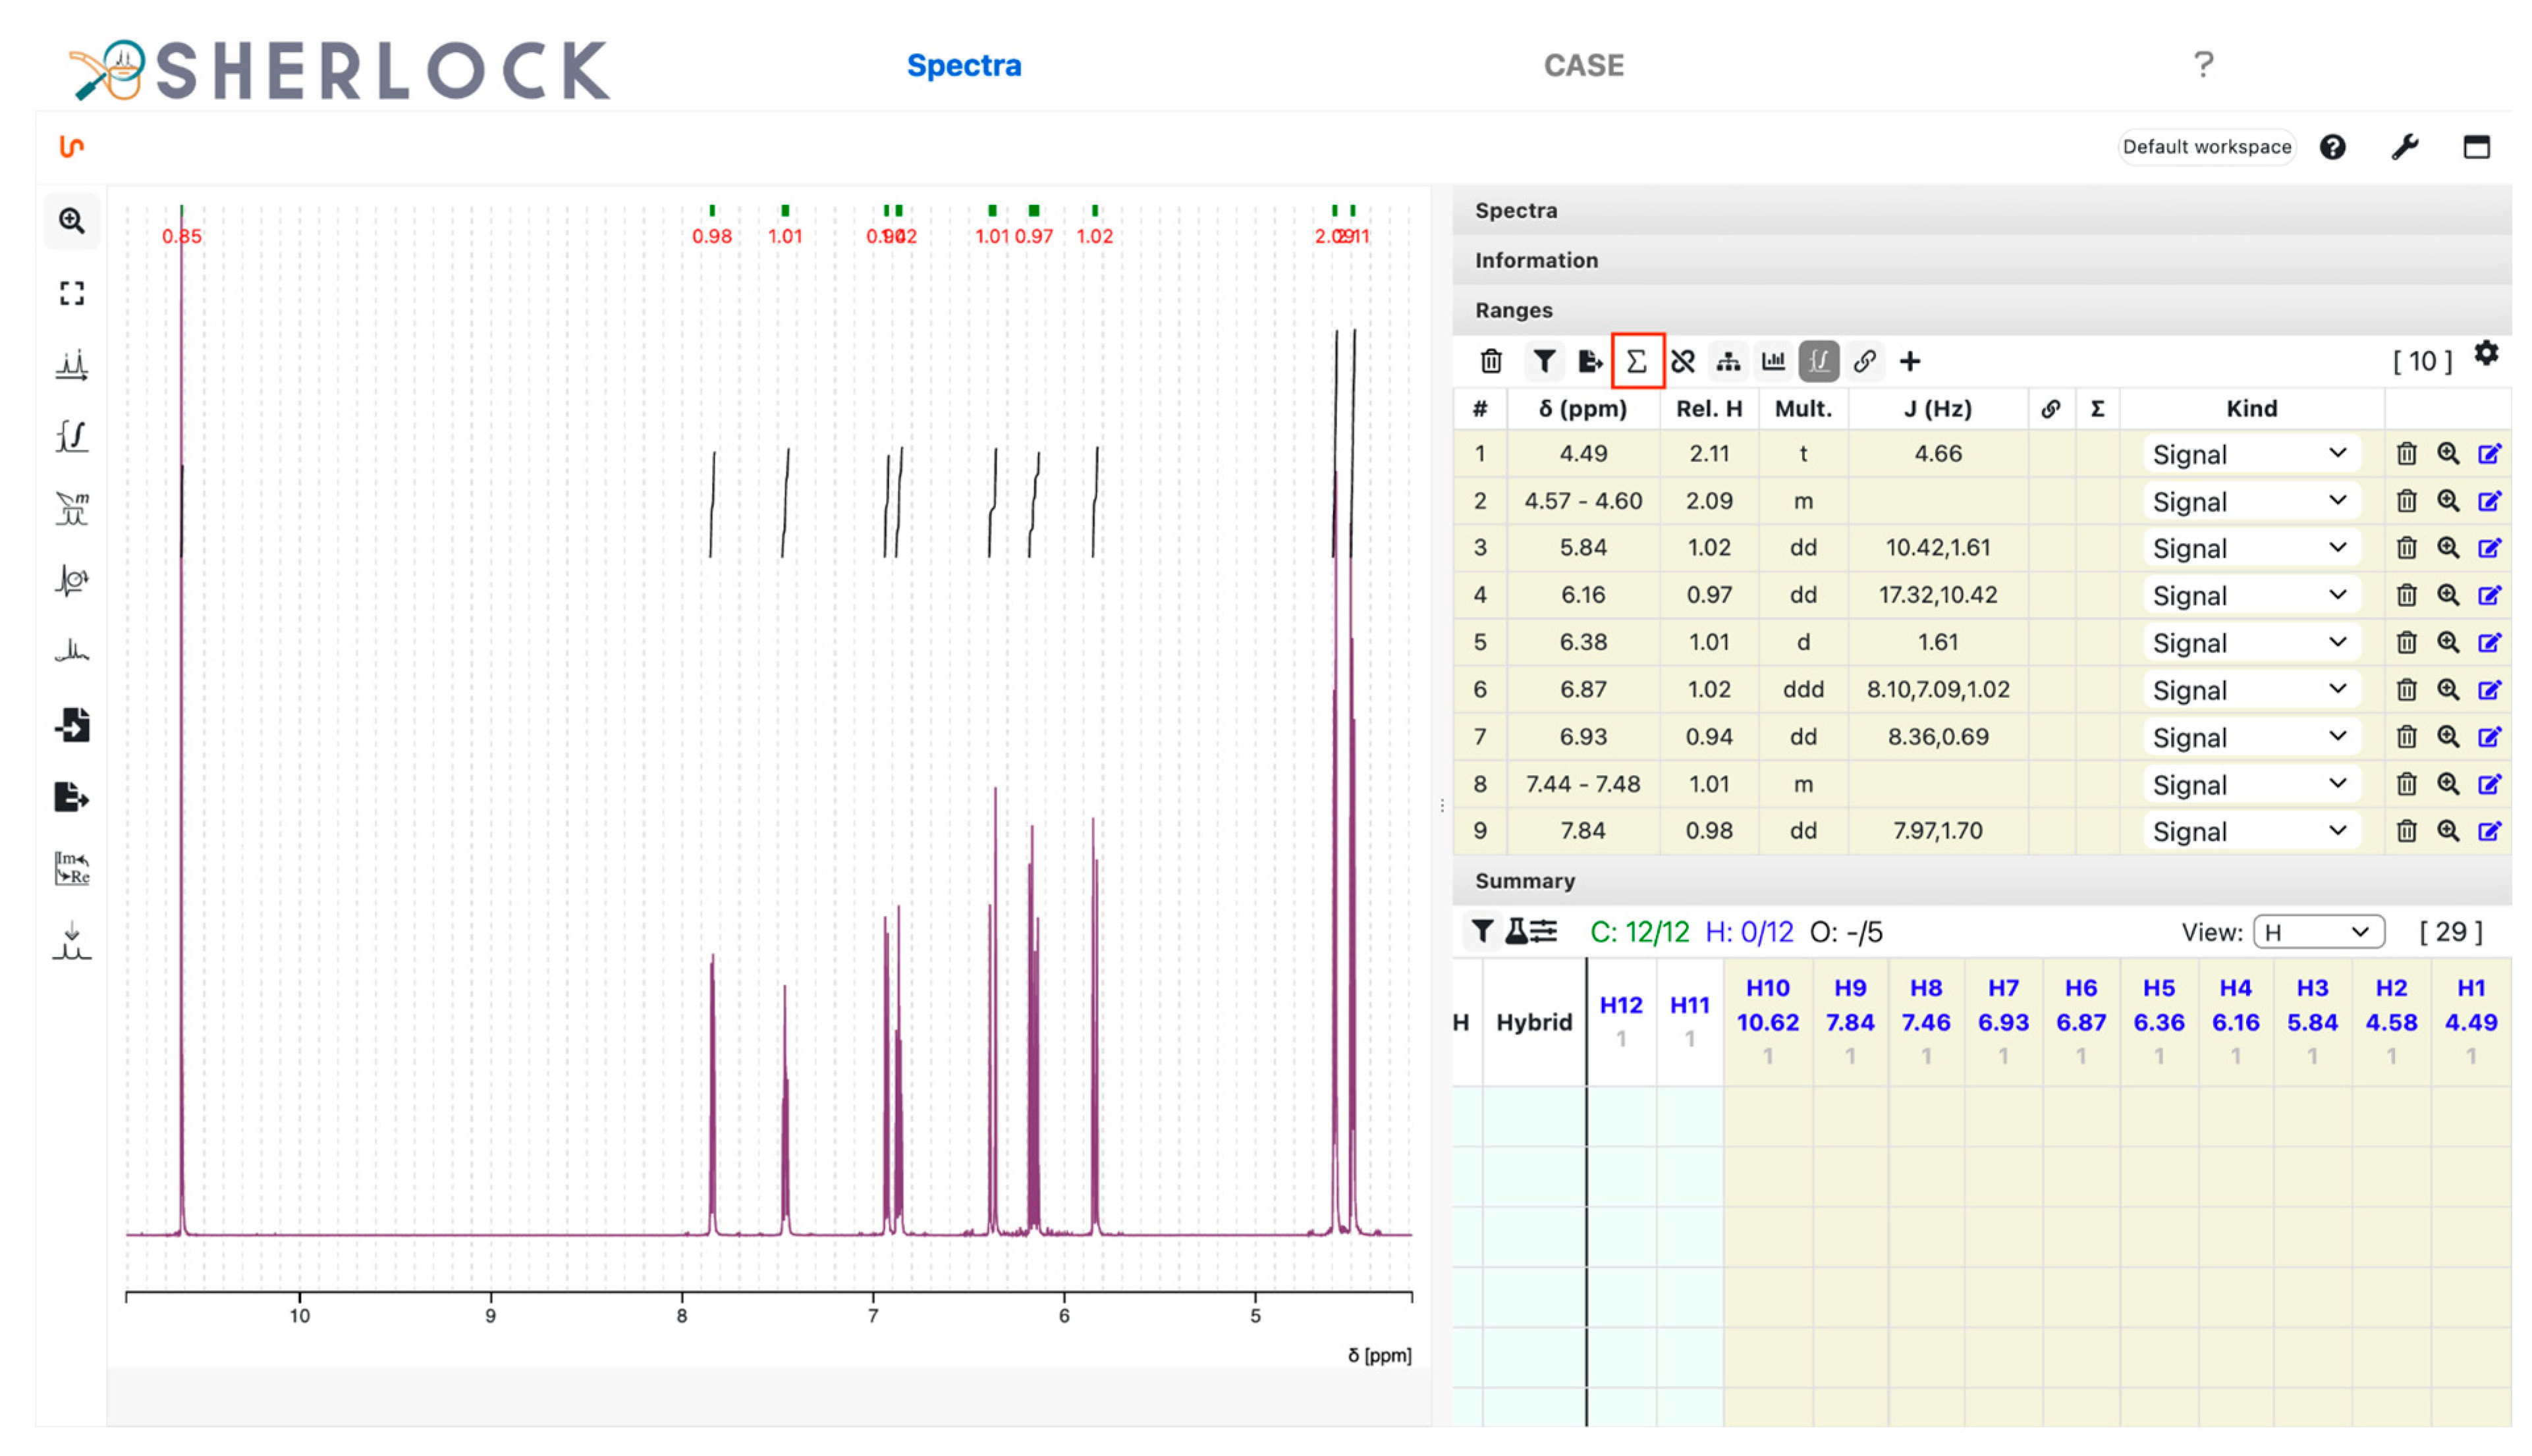
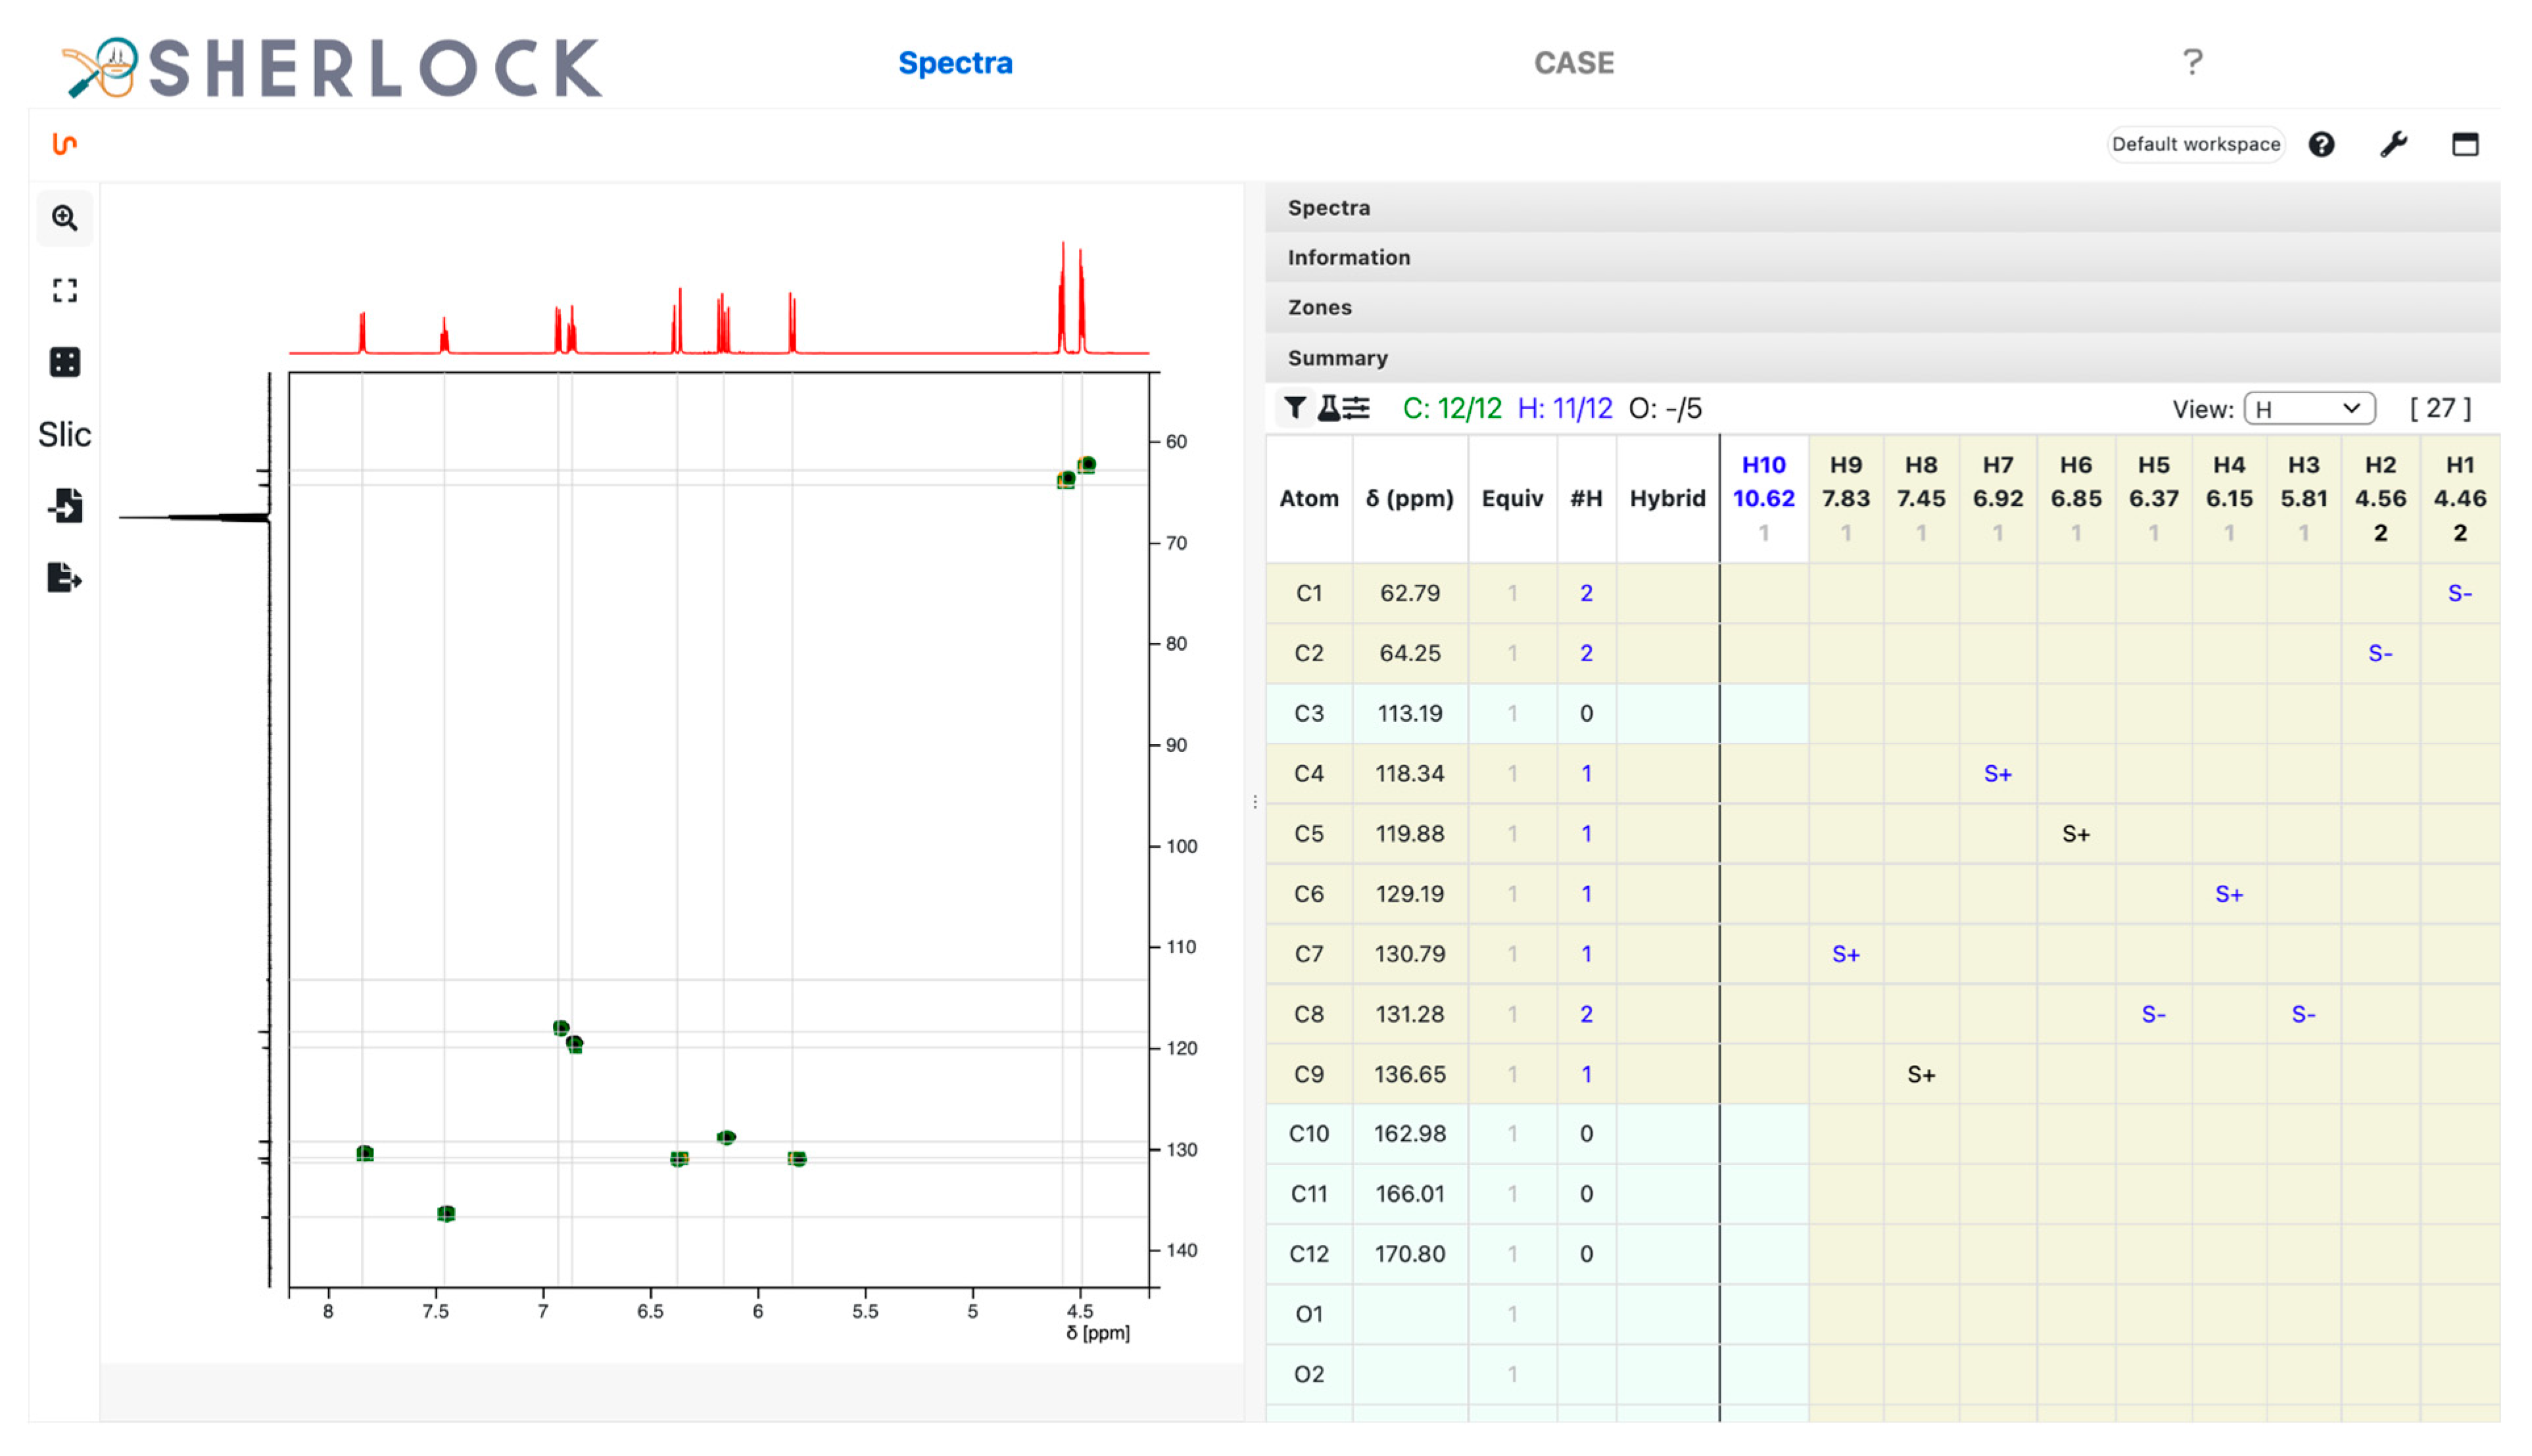
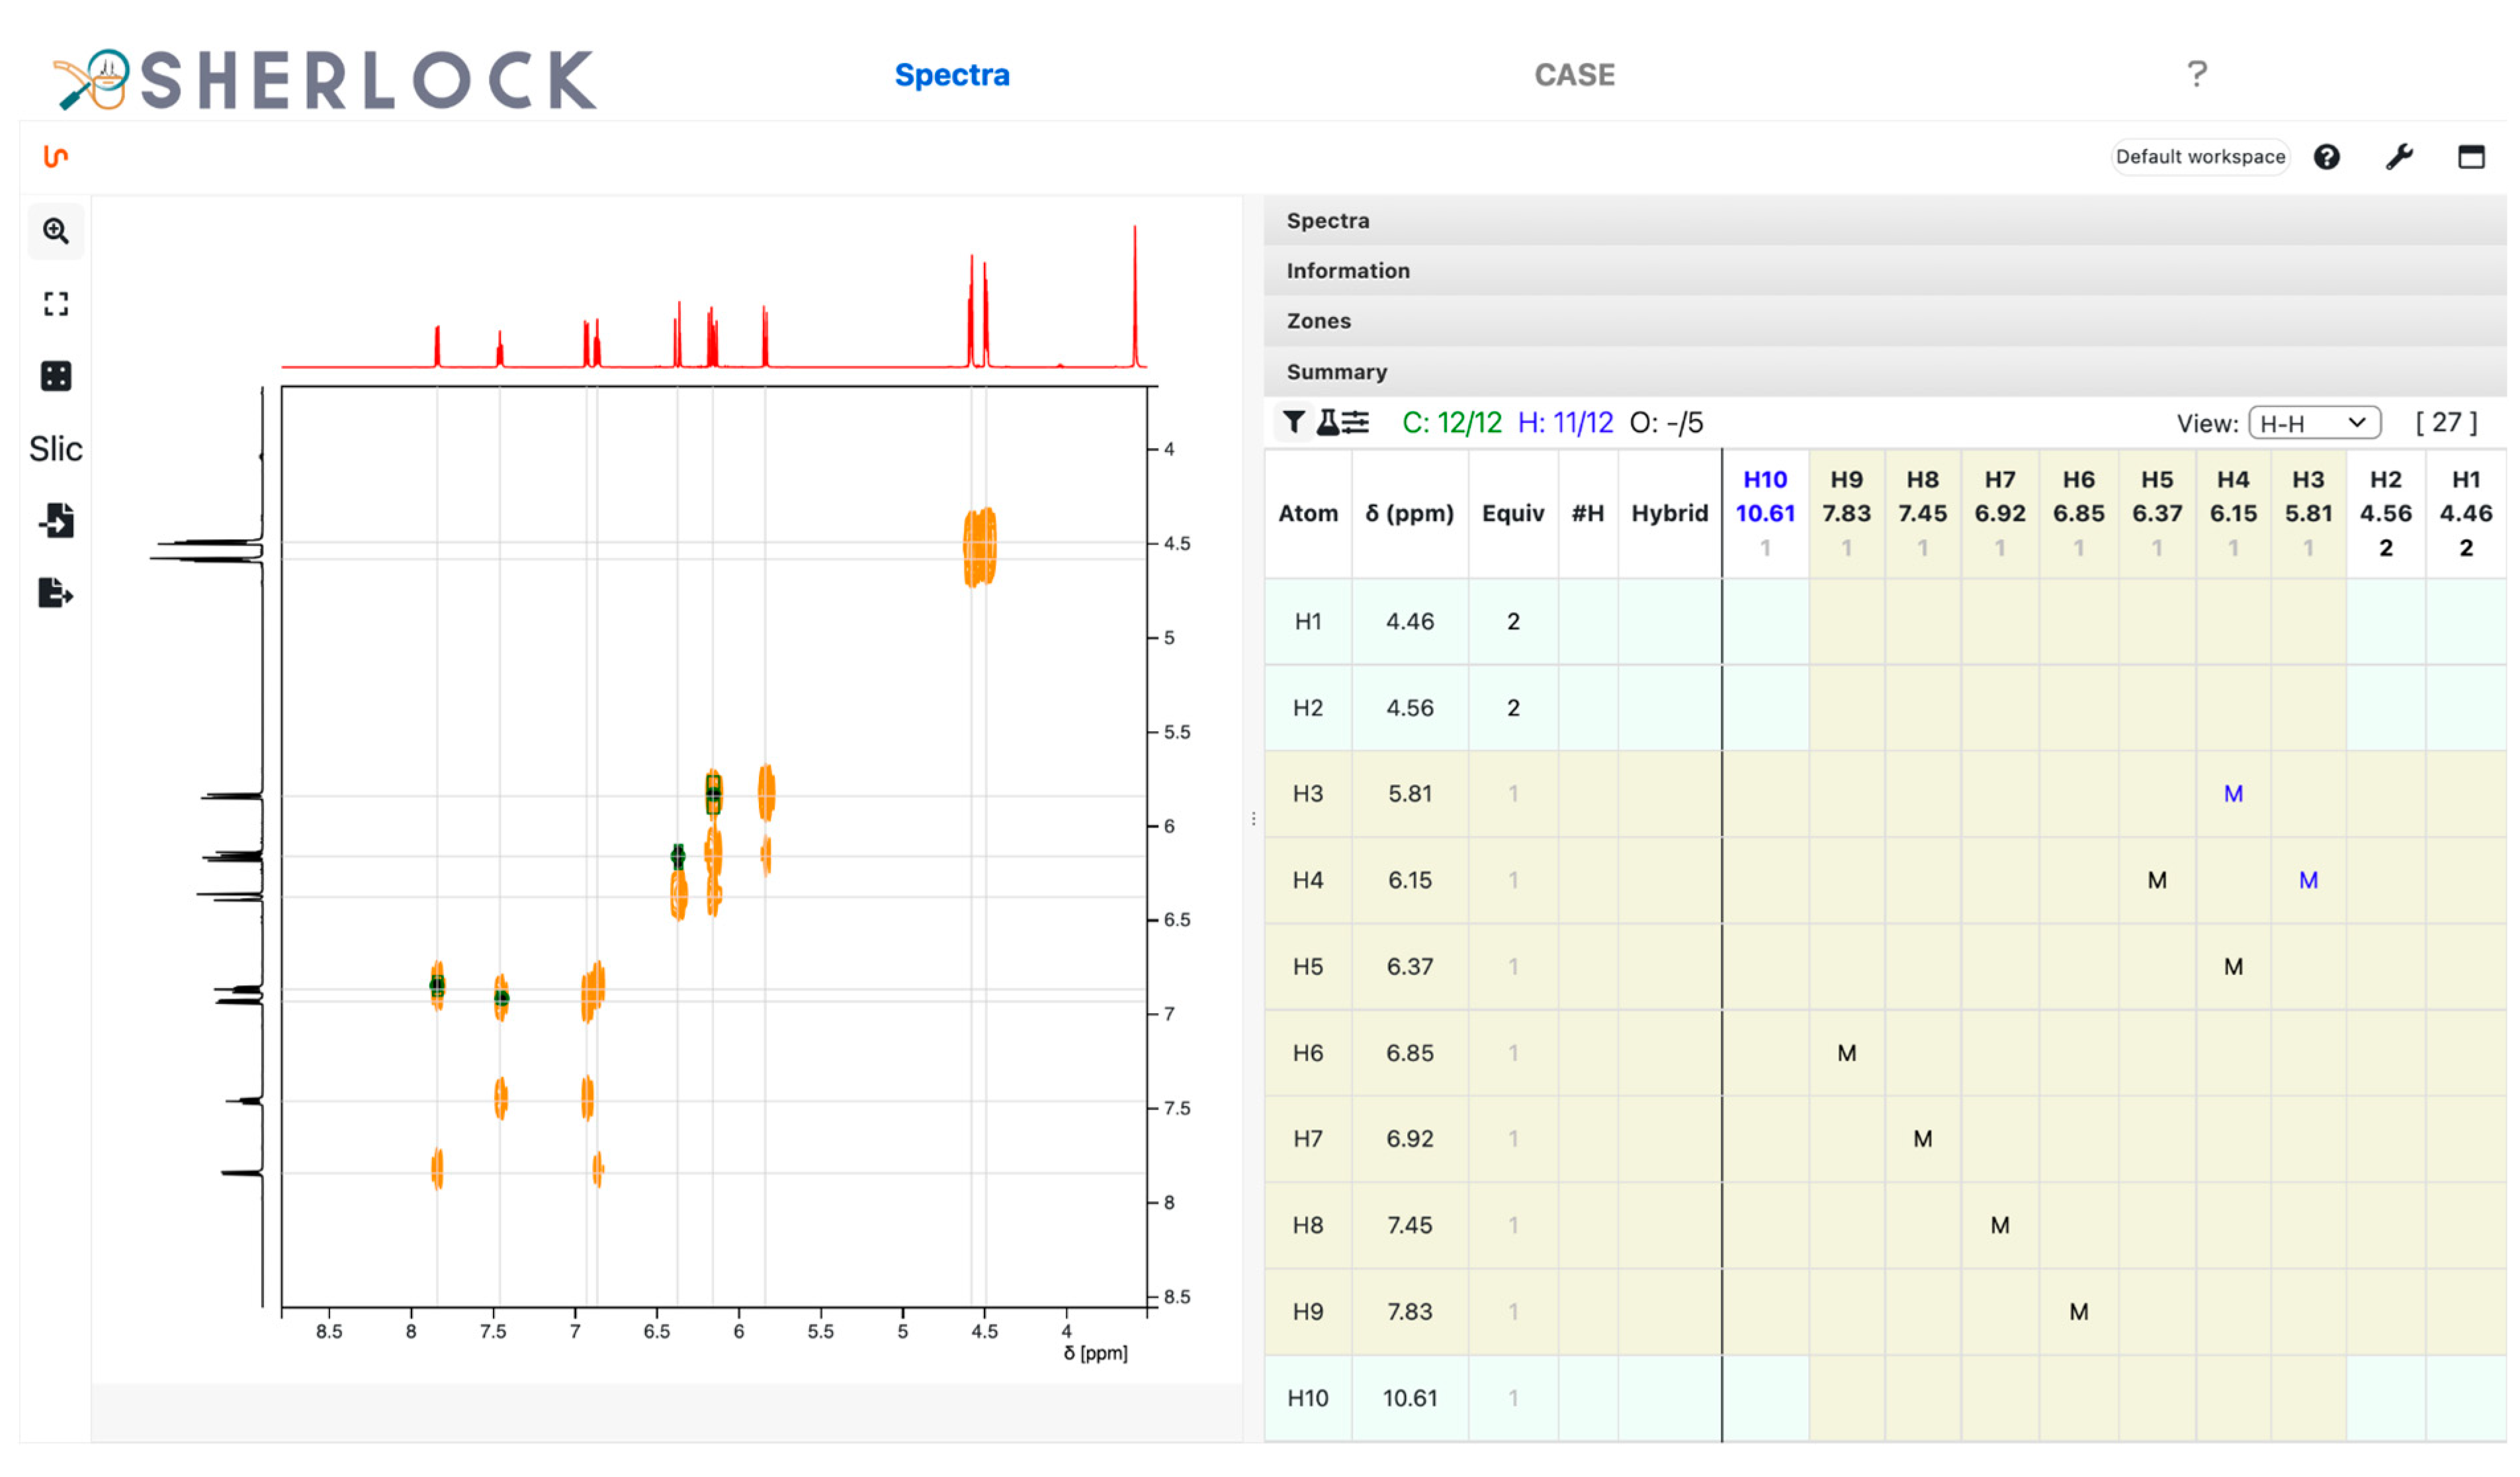
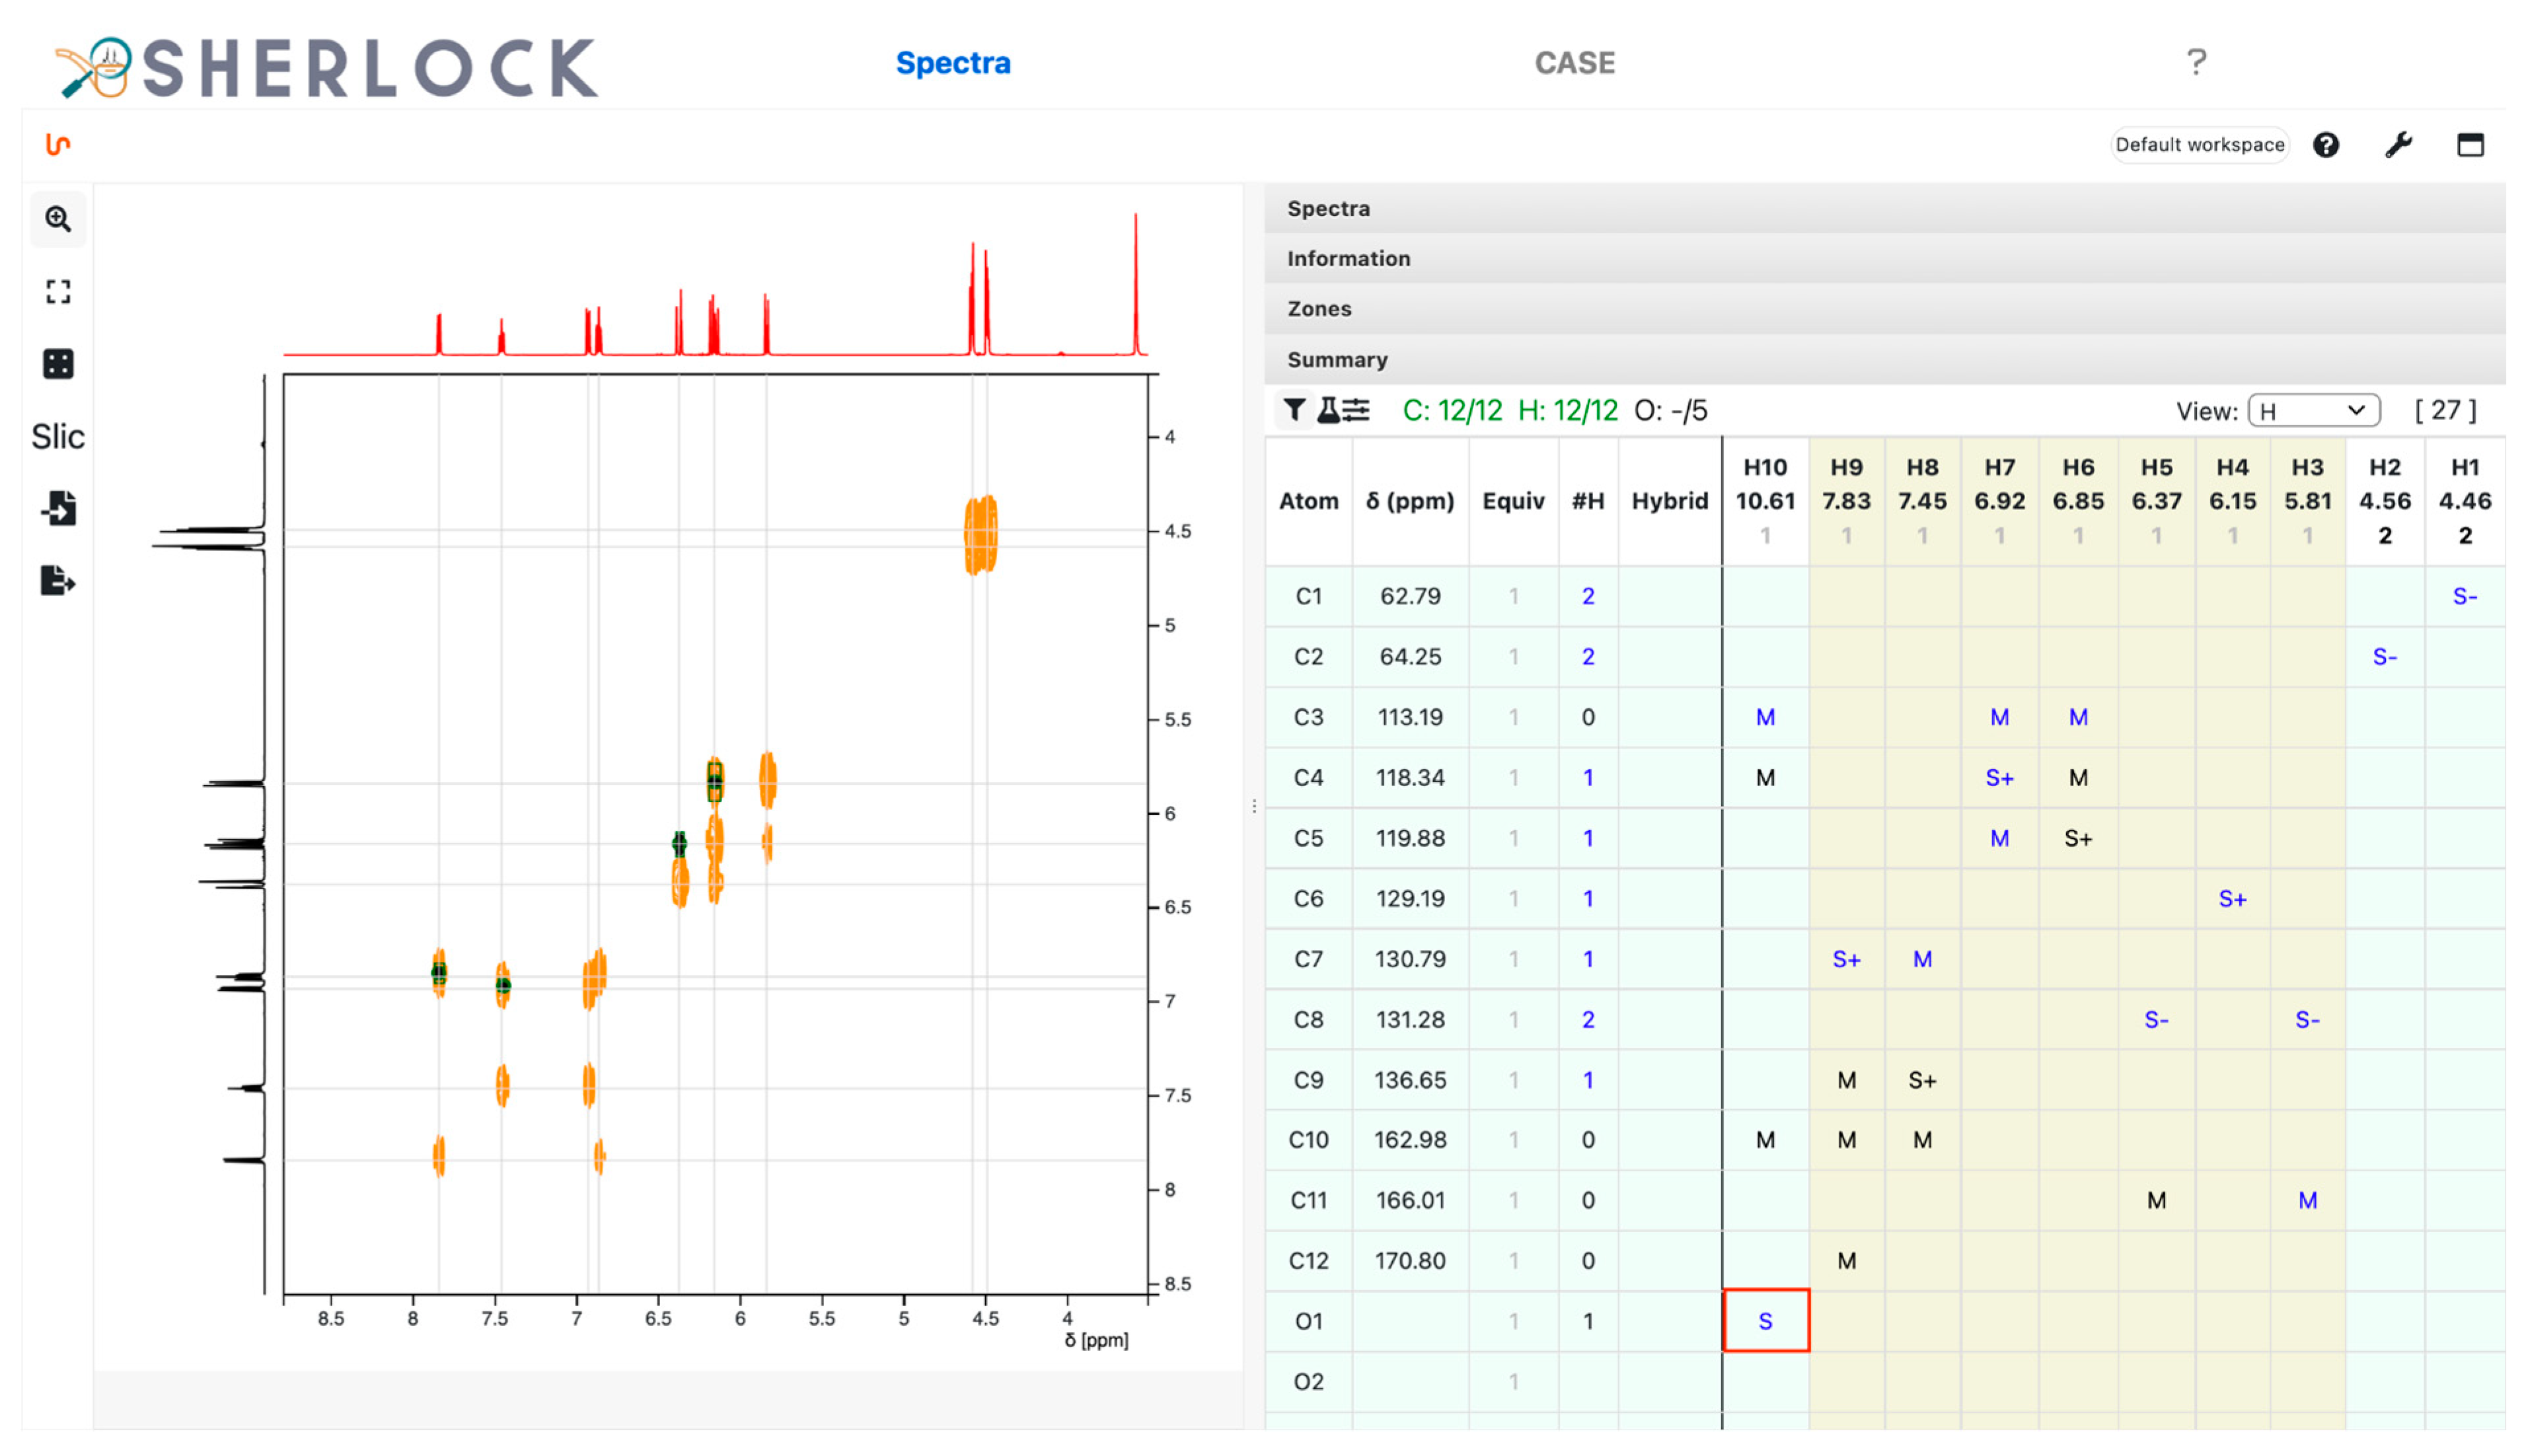
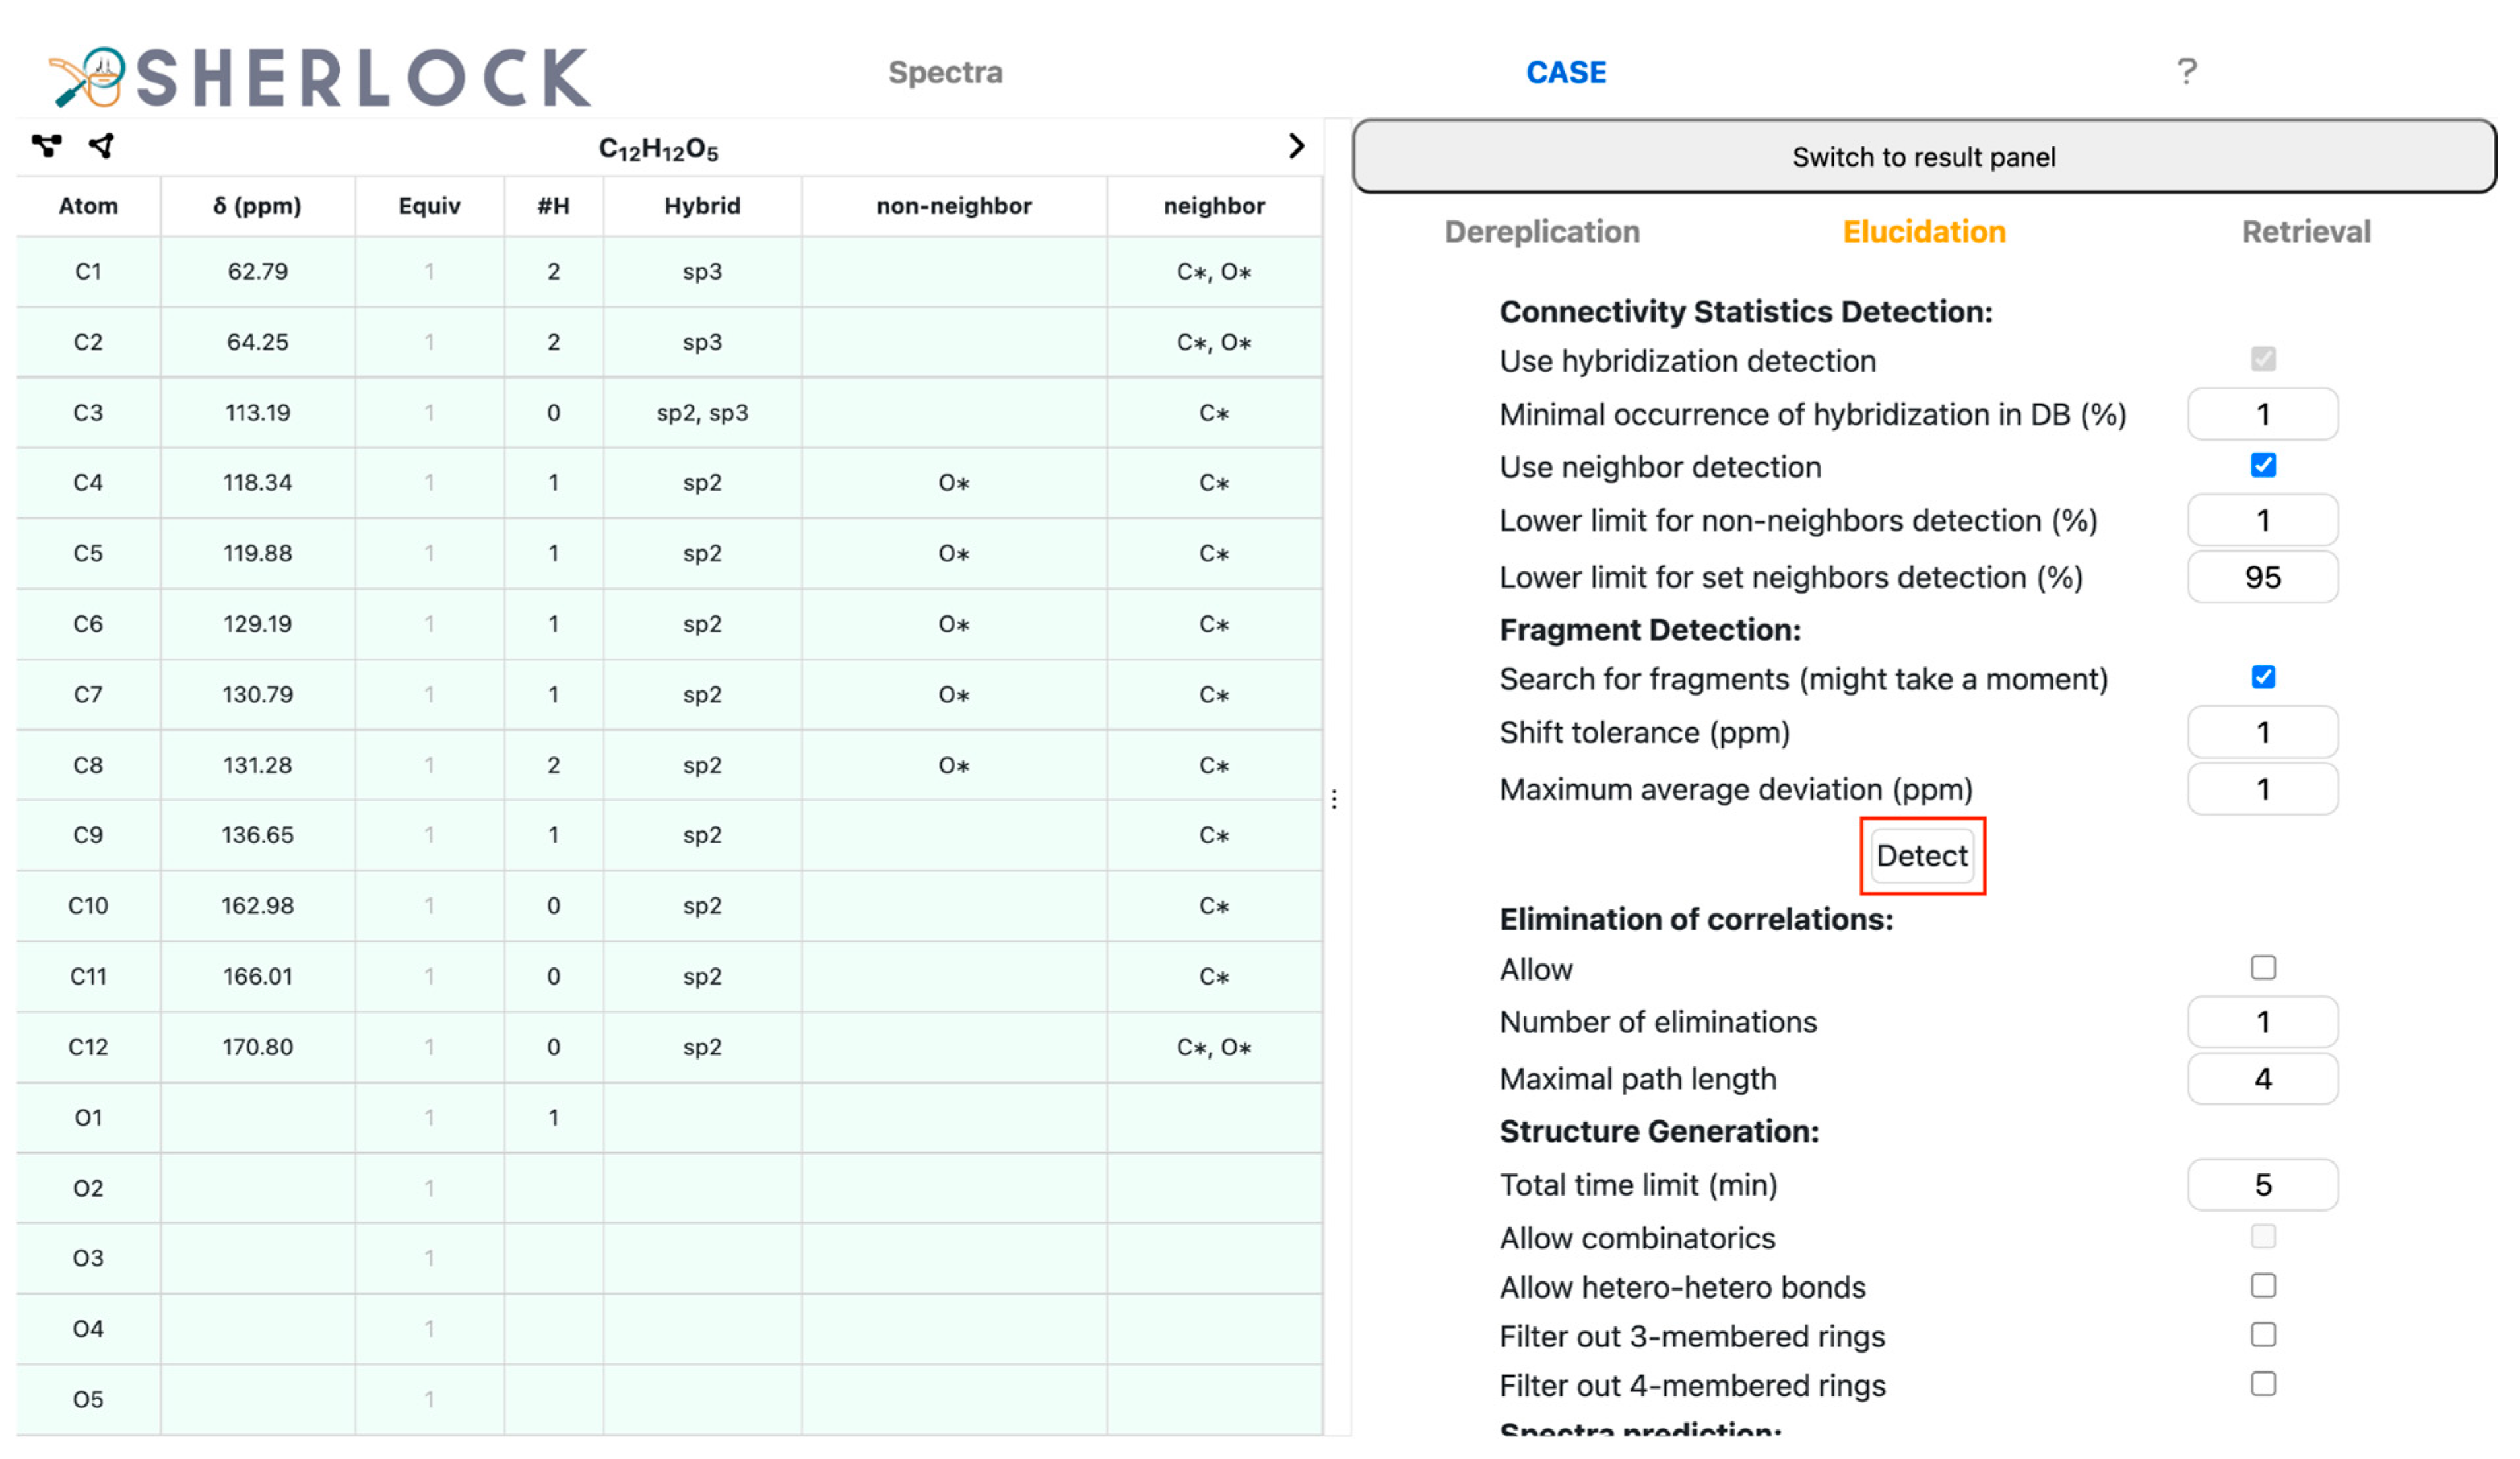
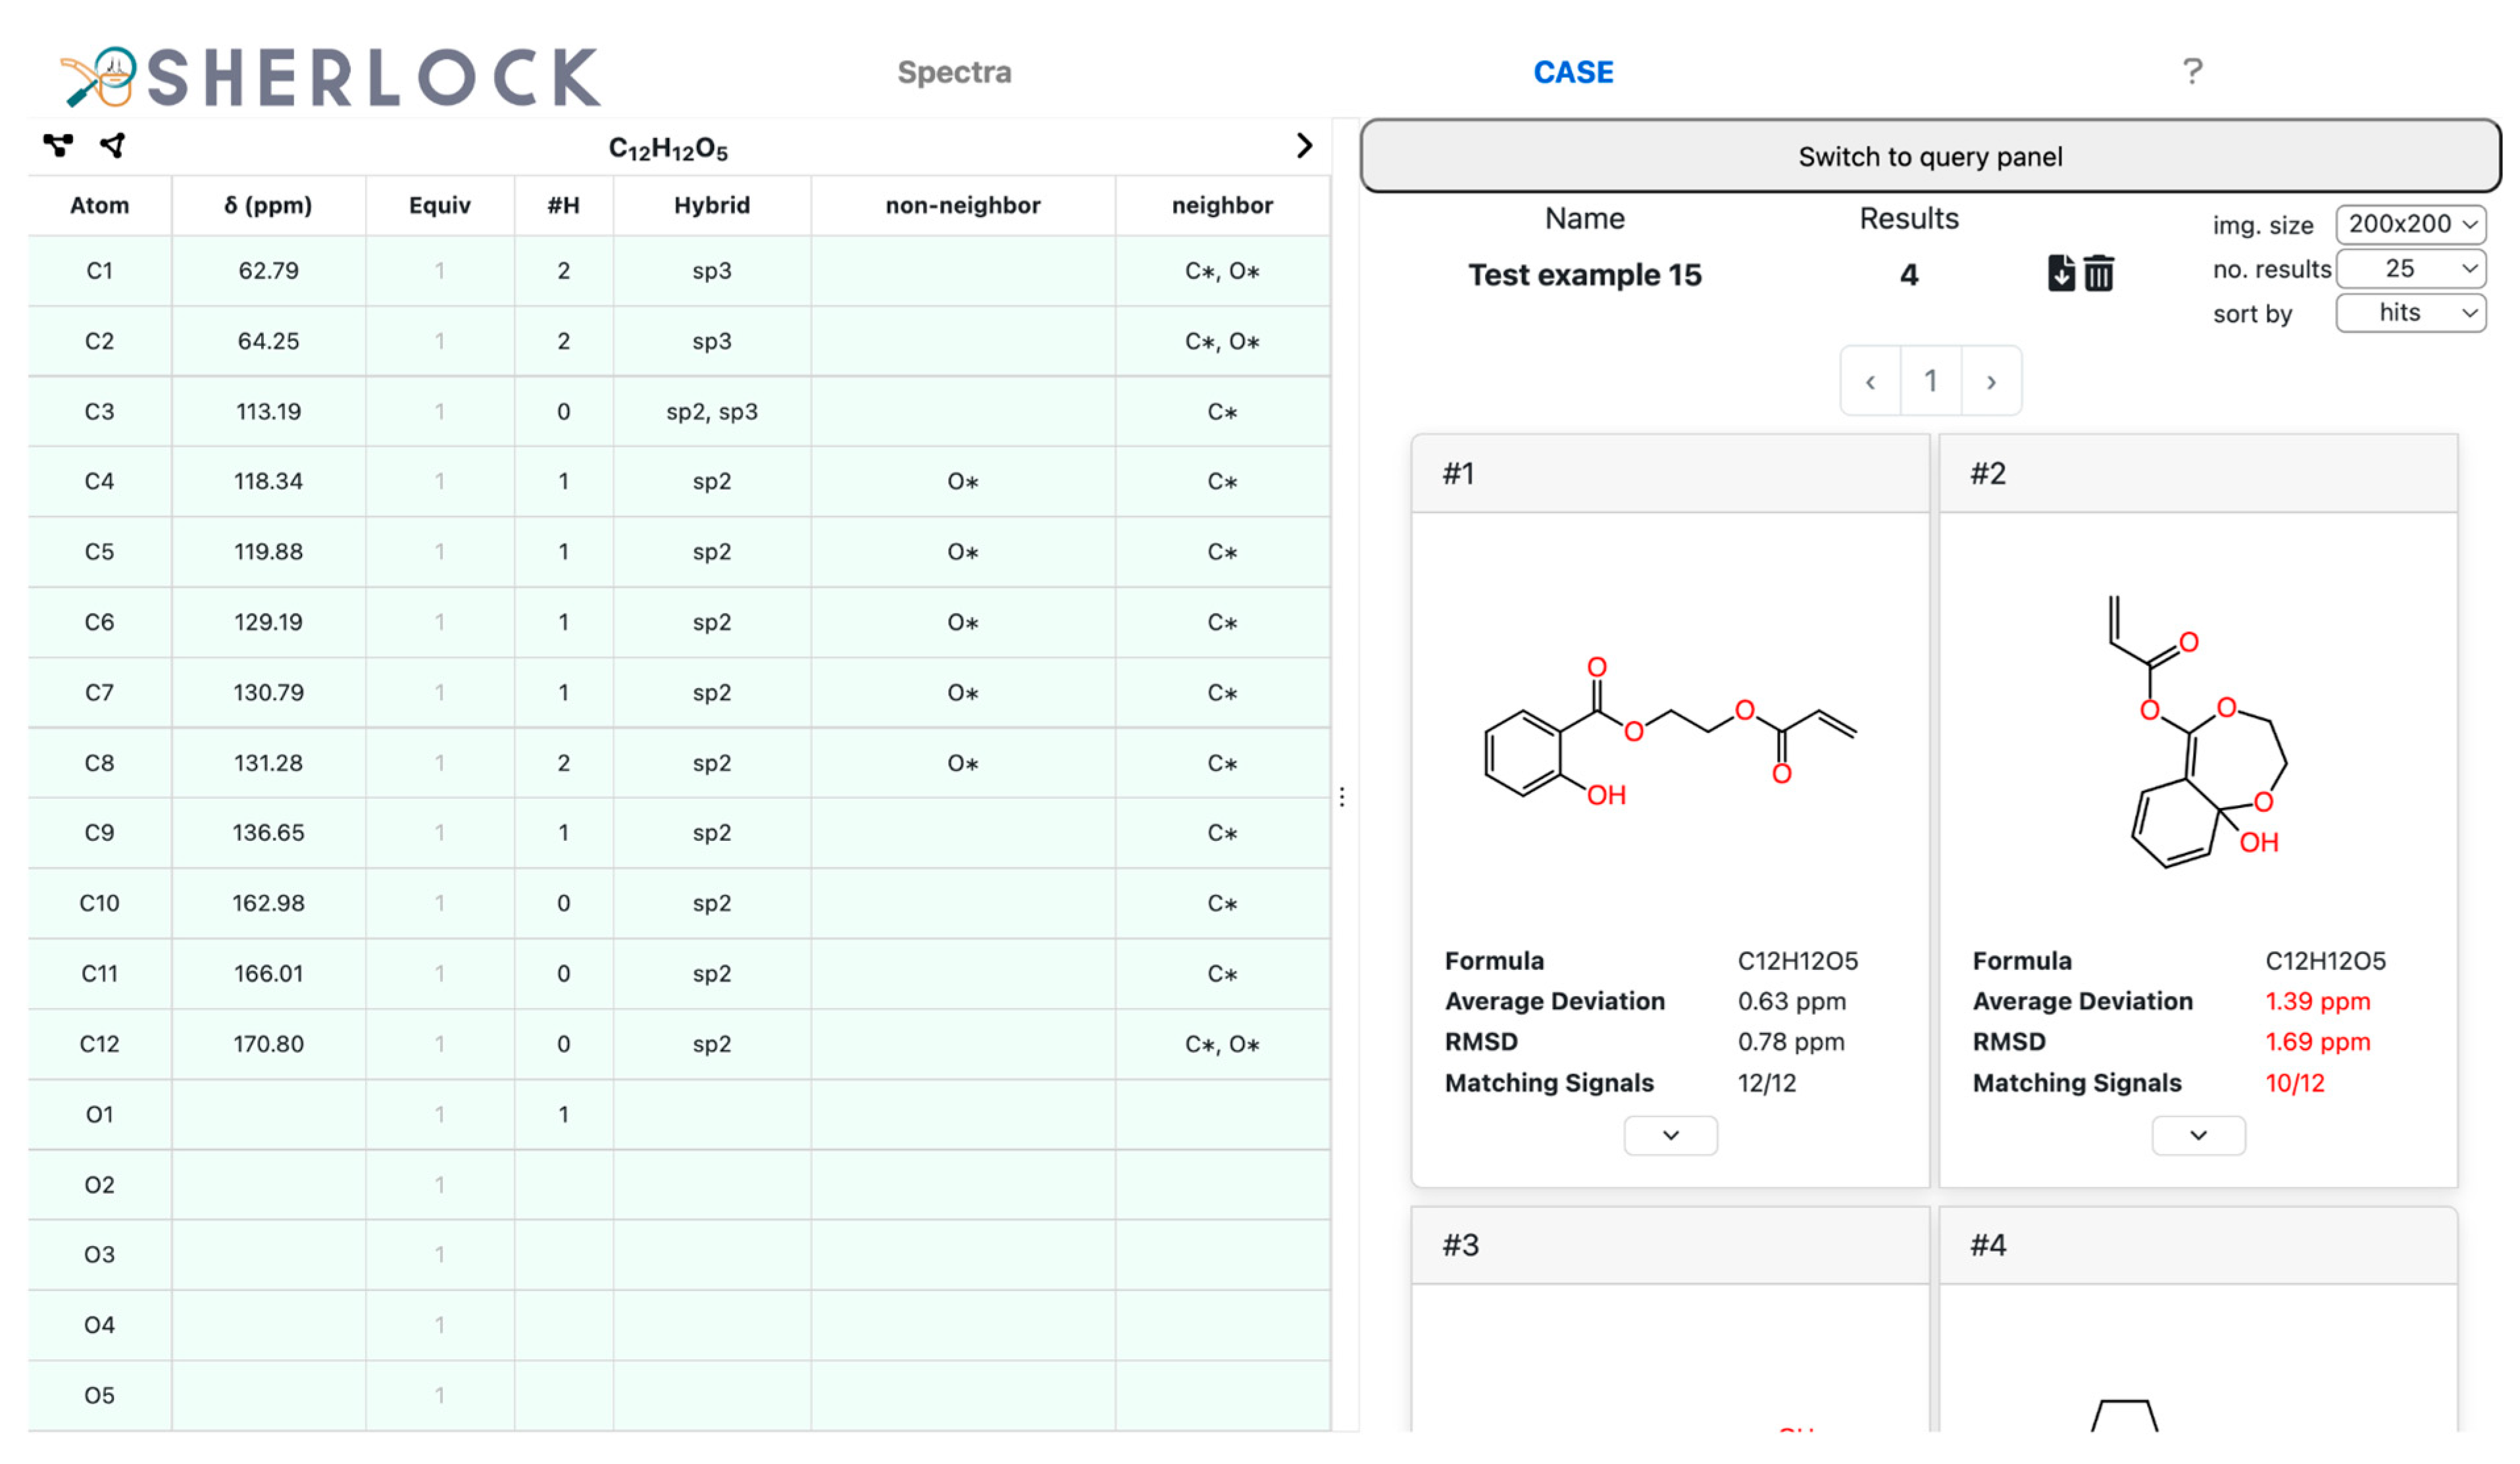
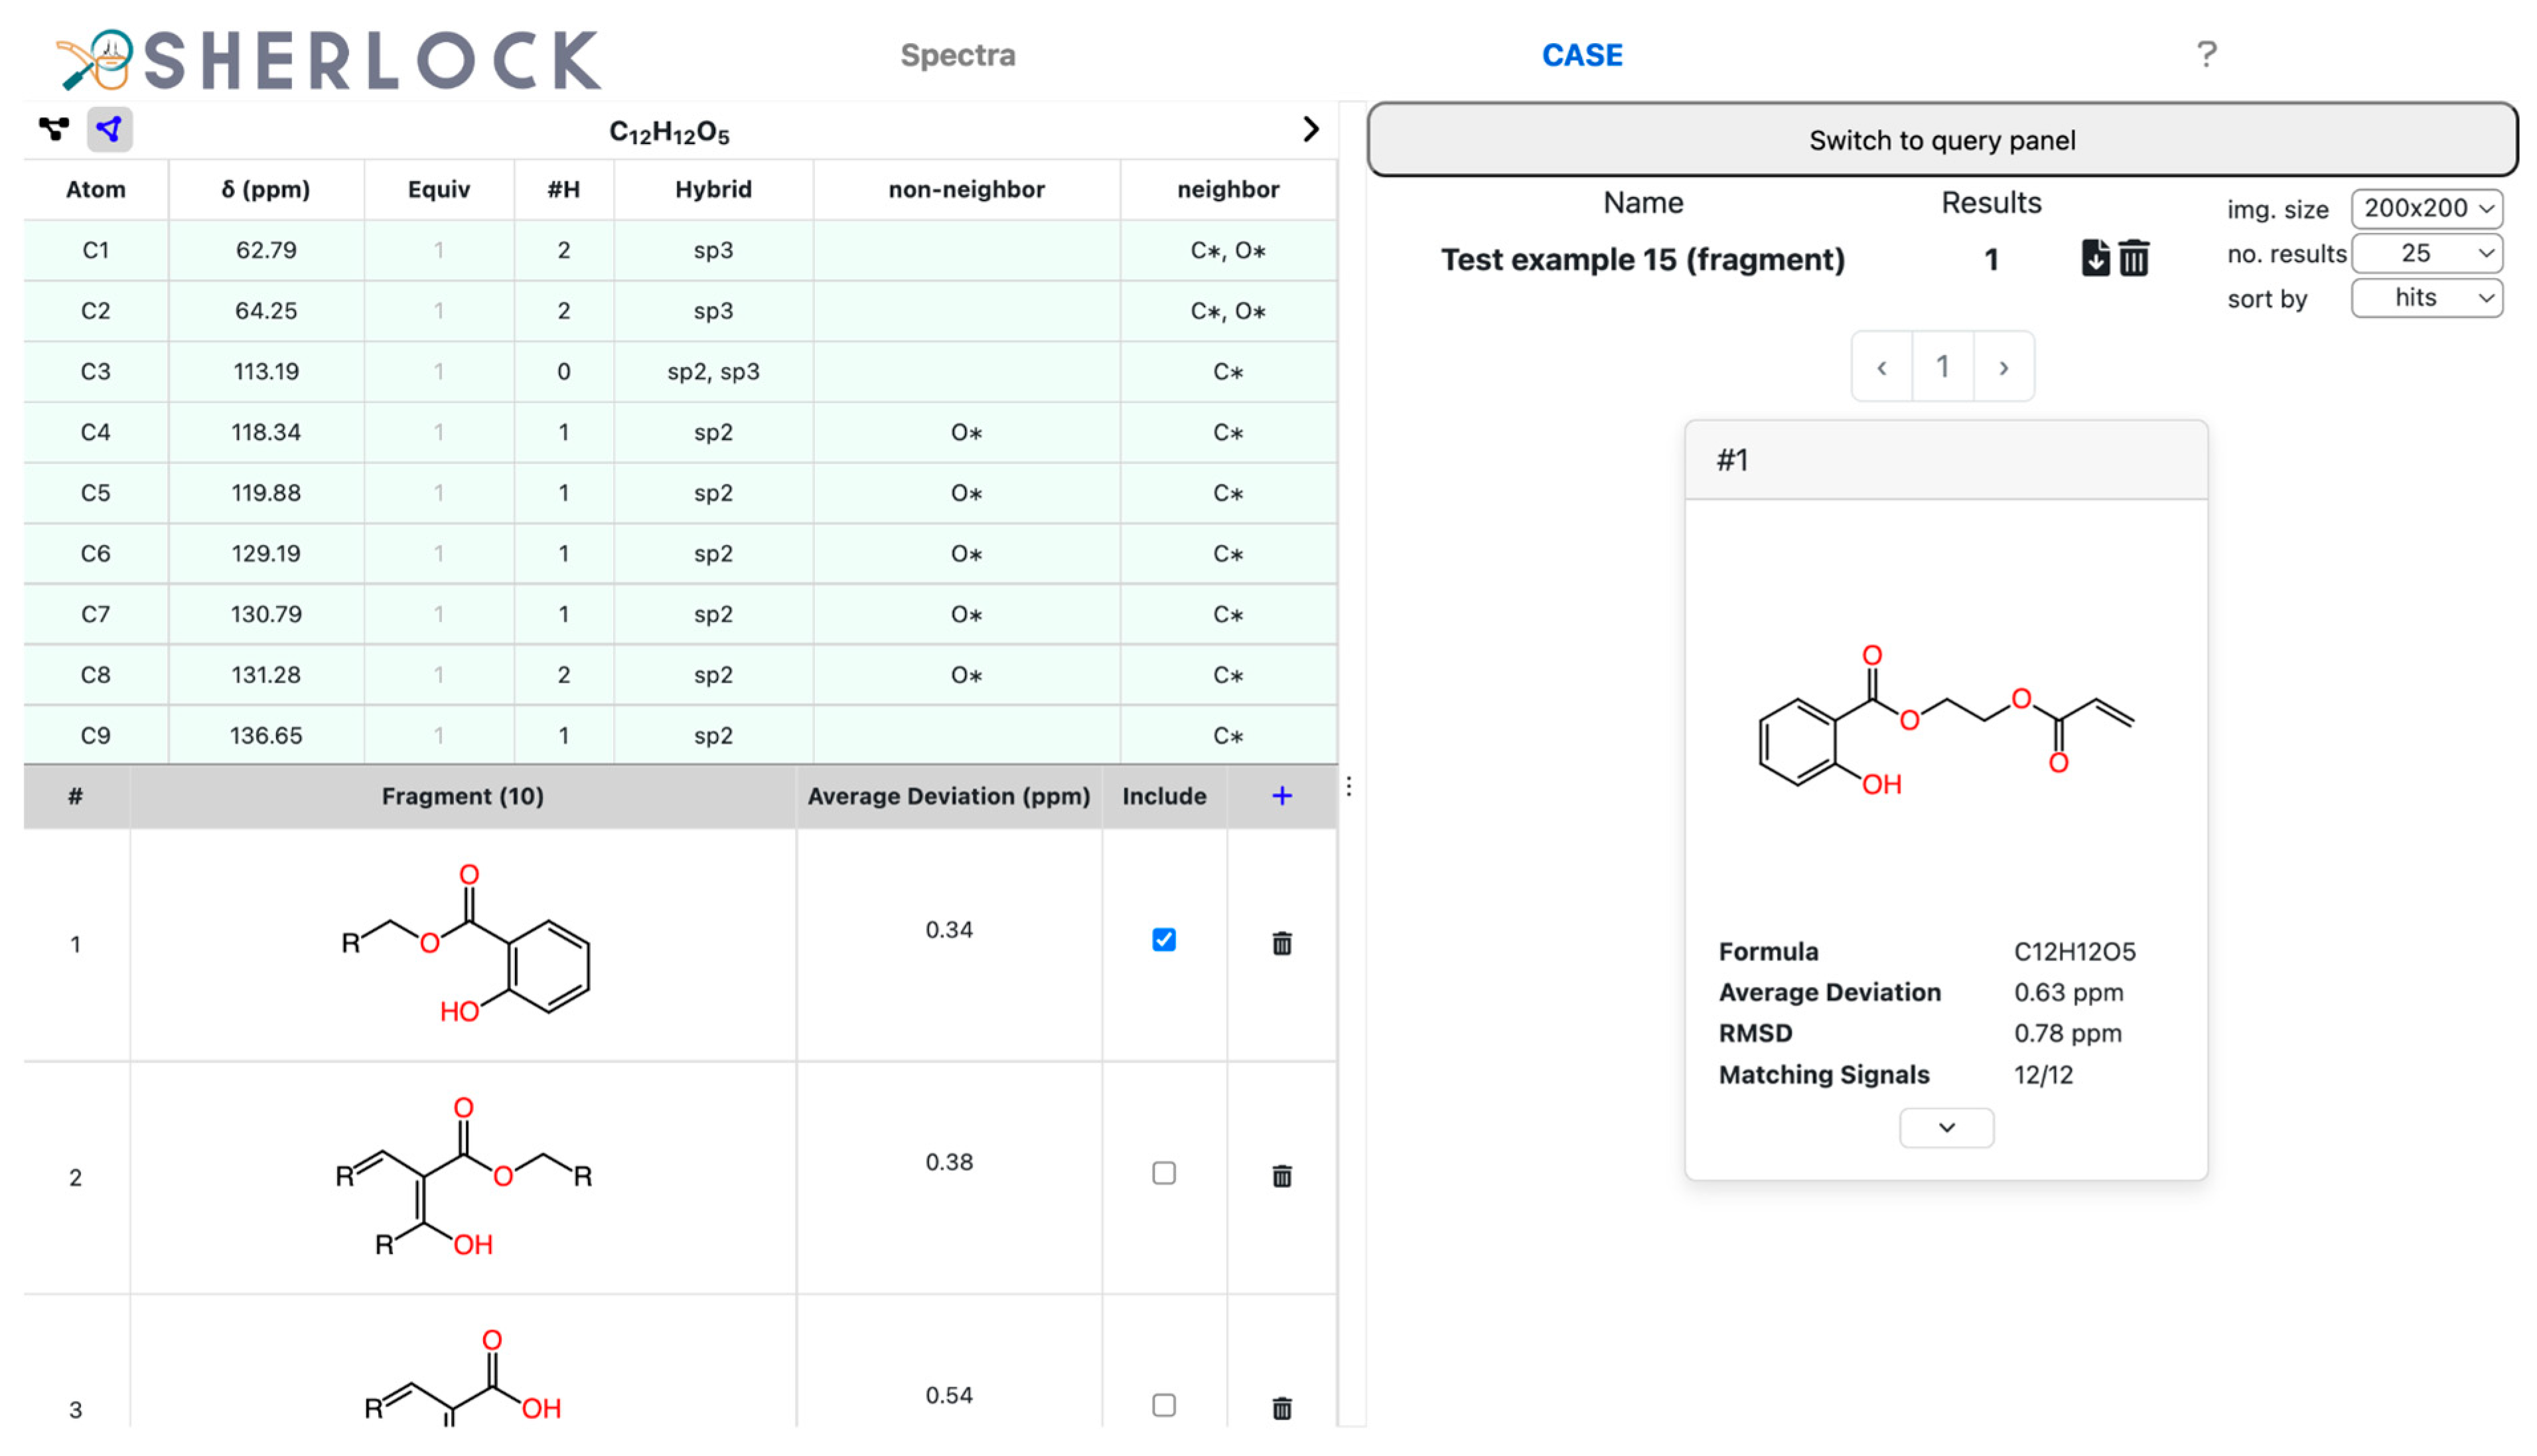
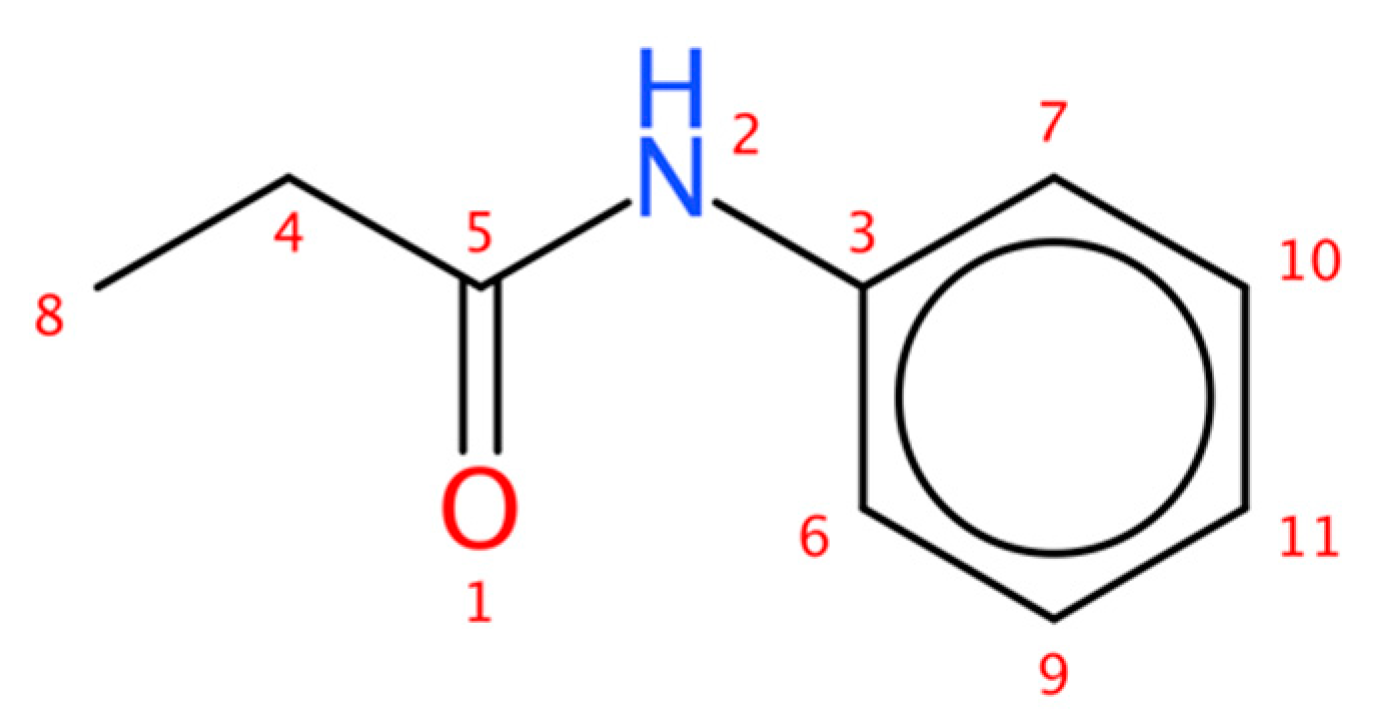
2.2. Test Case 15
3. Methods
3.1. Structure-and-Spectrum Database Design
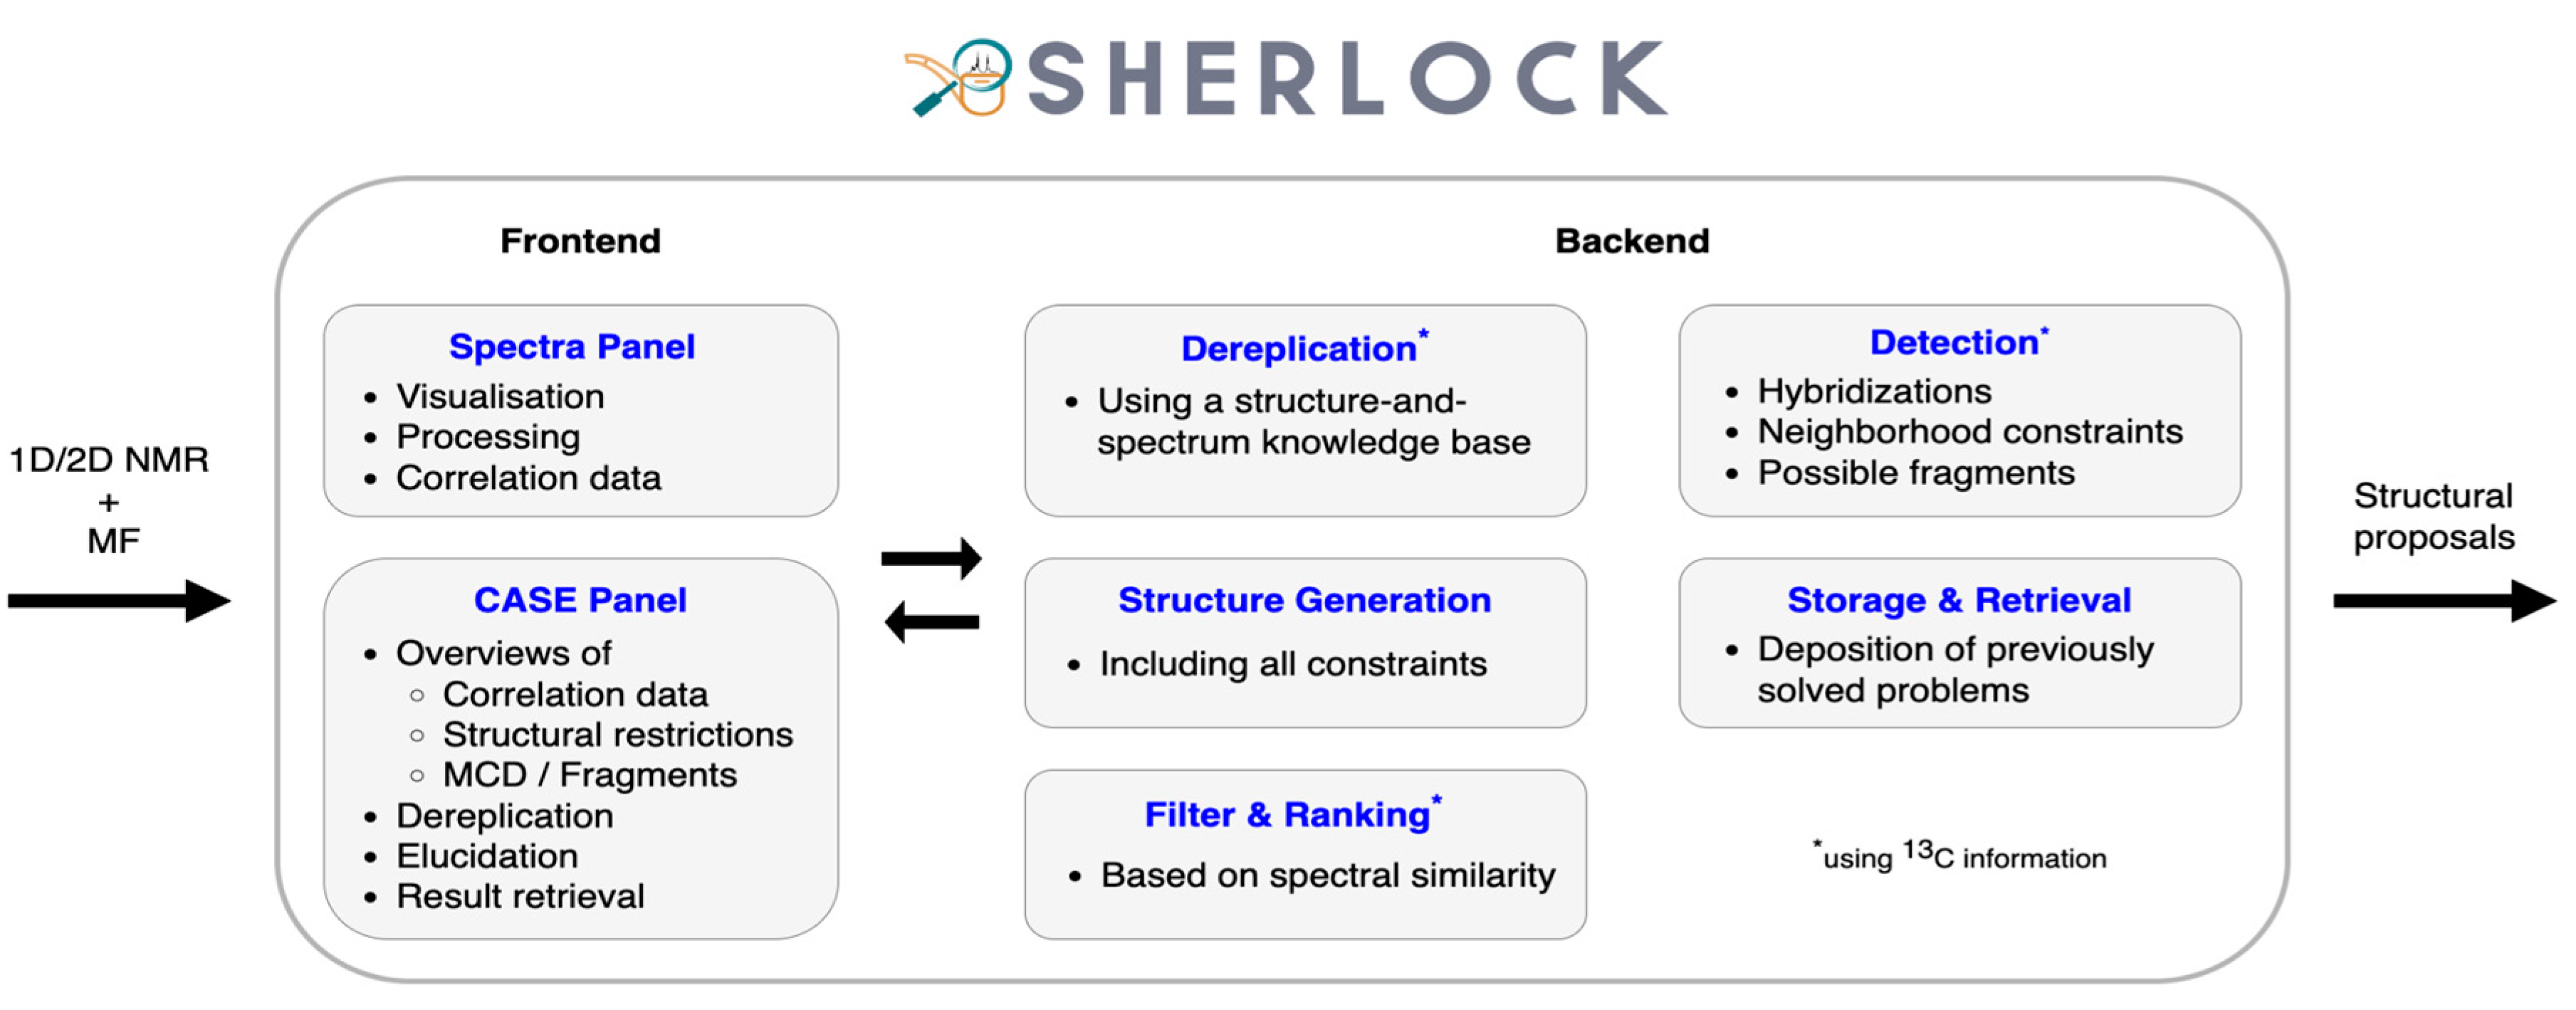
3.2. Frontend
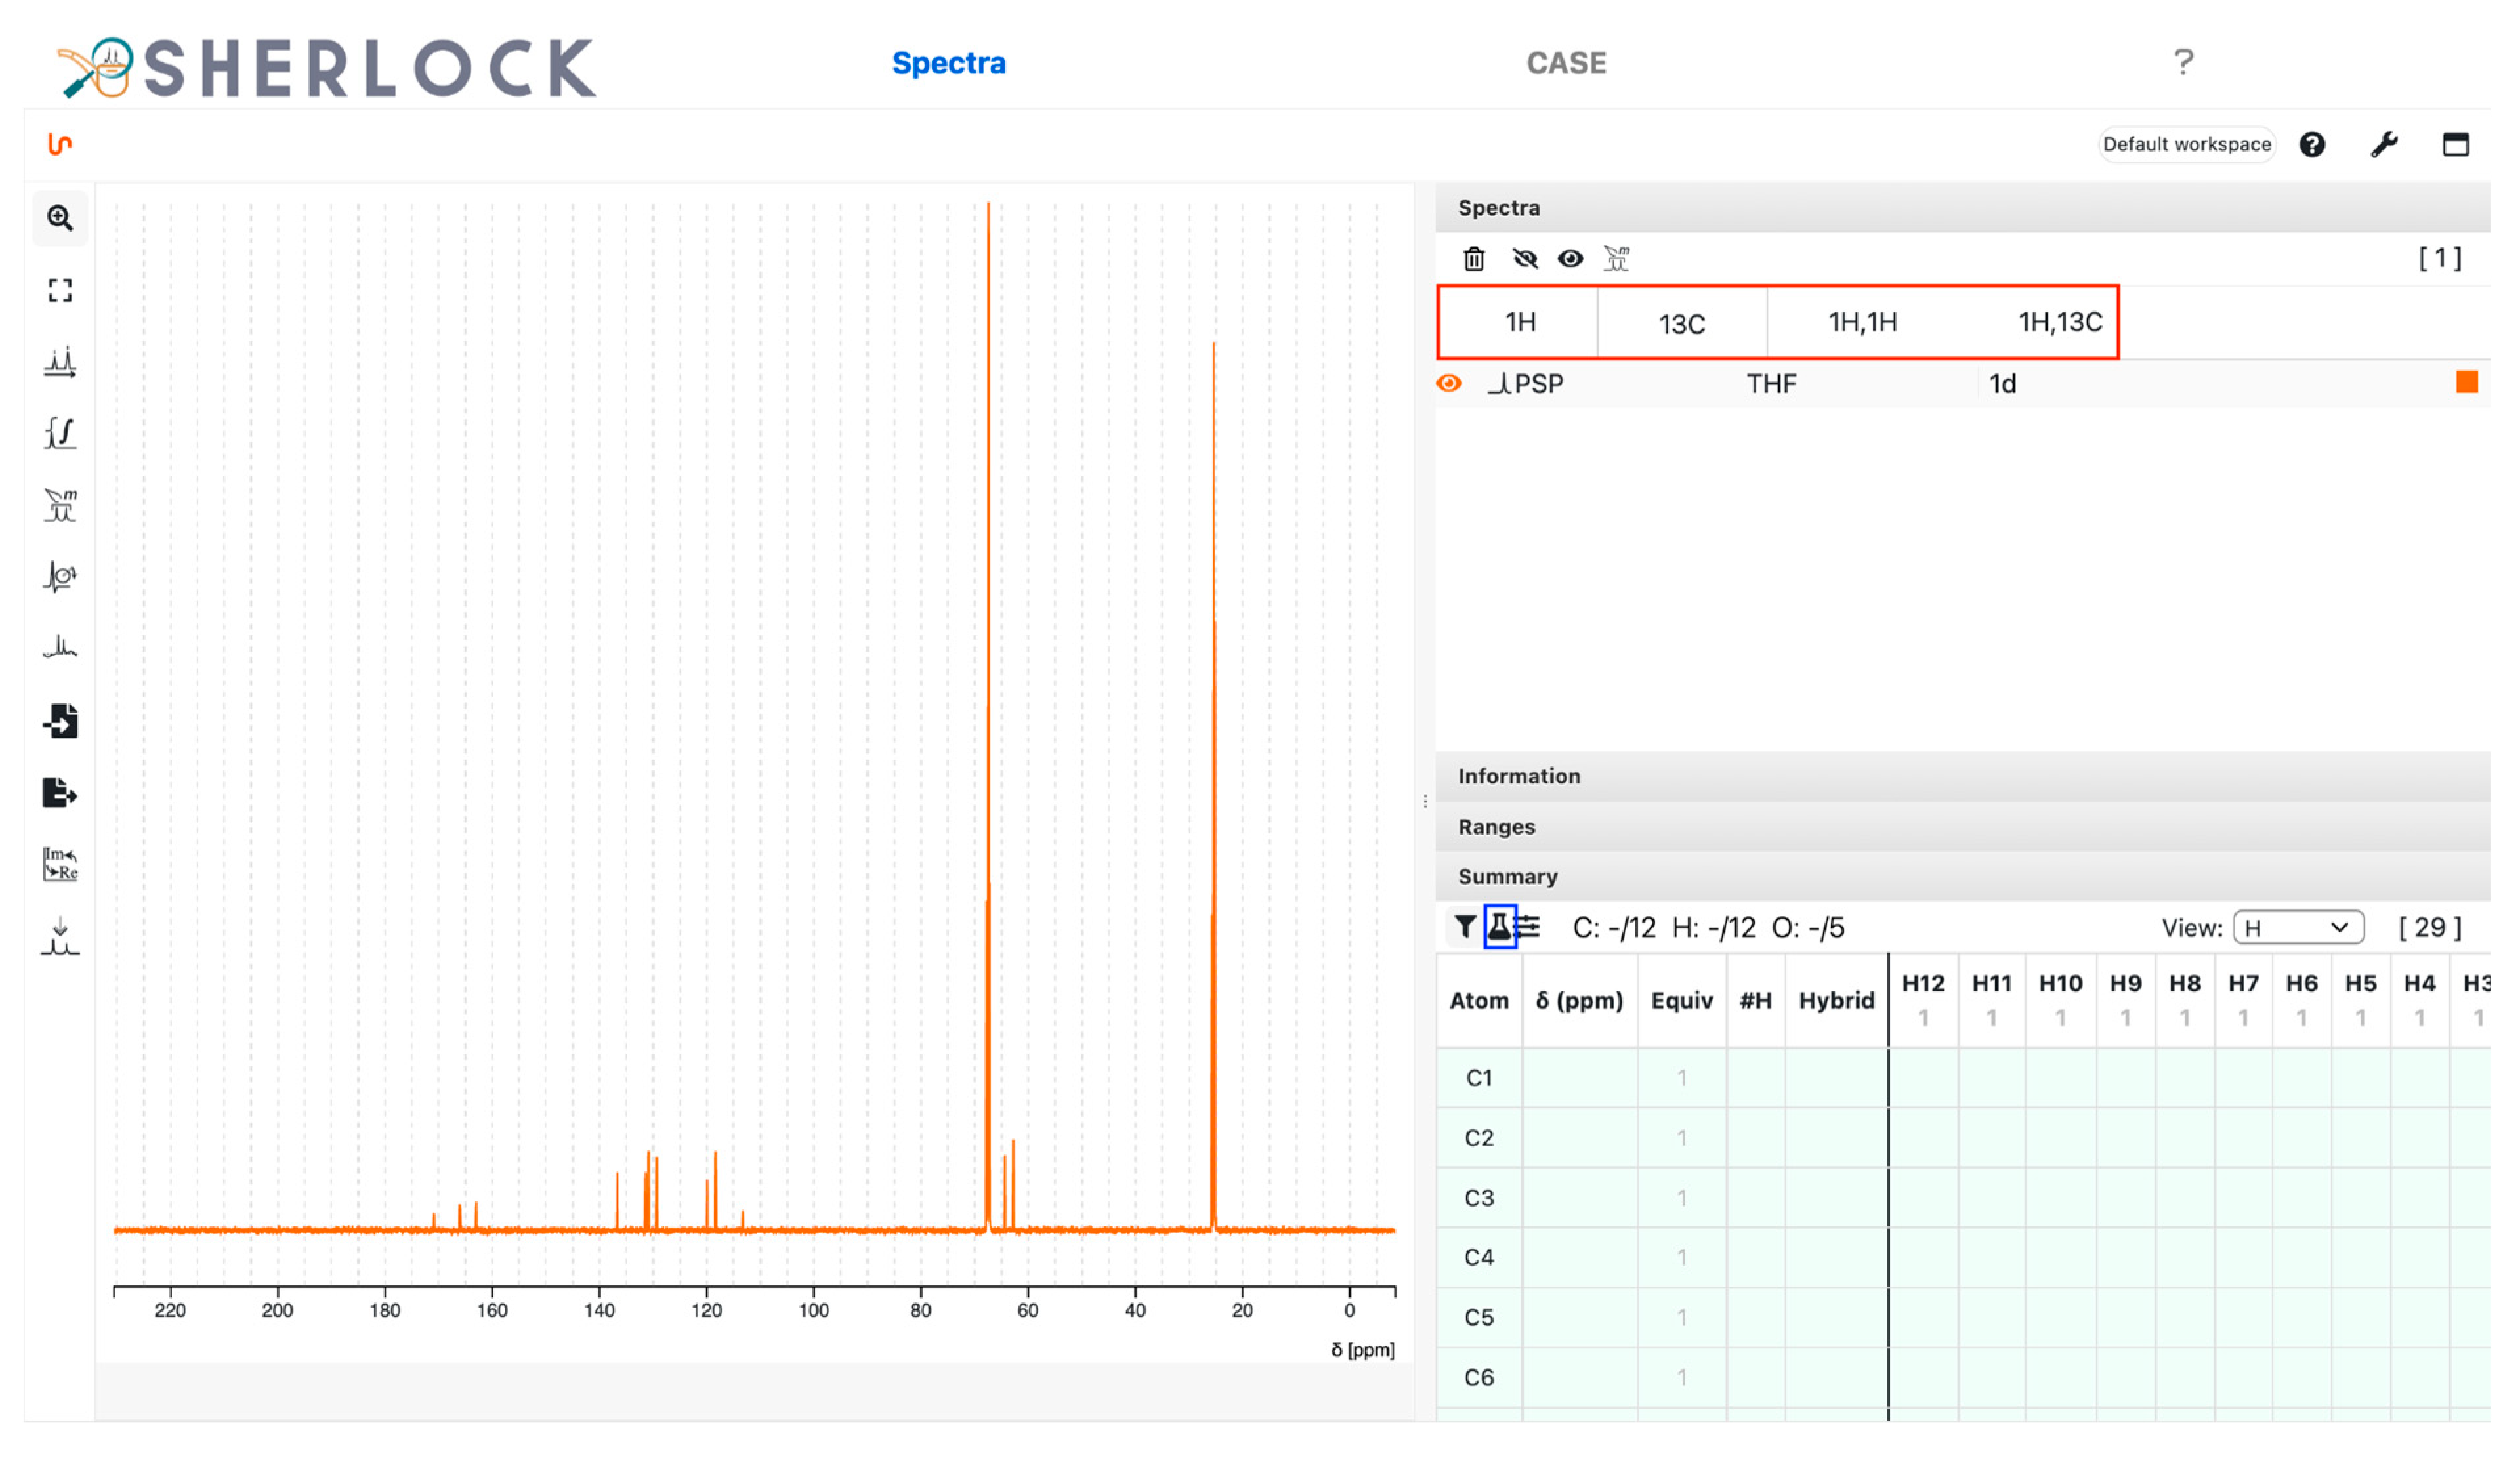
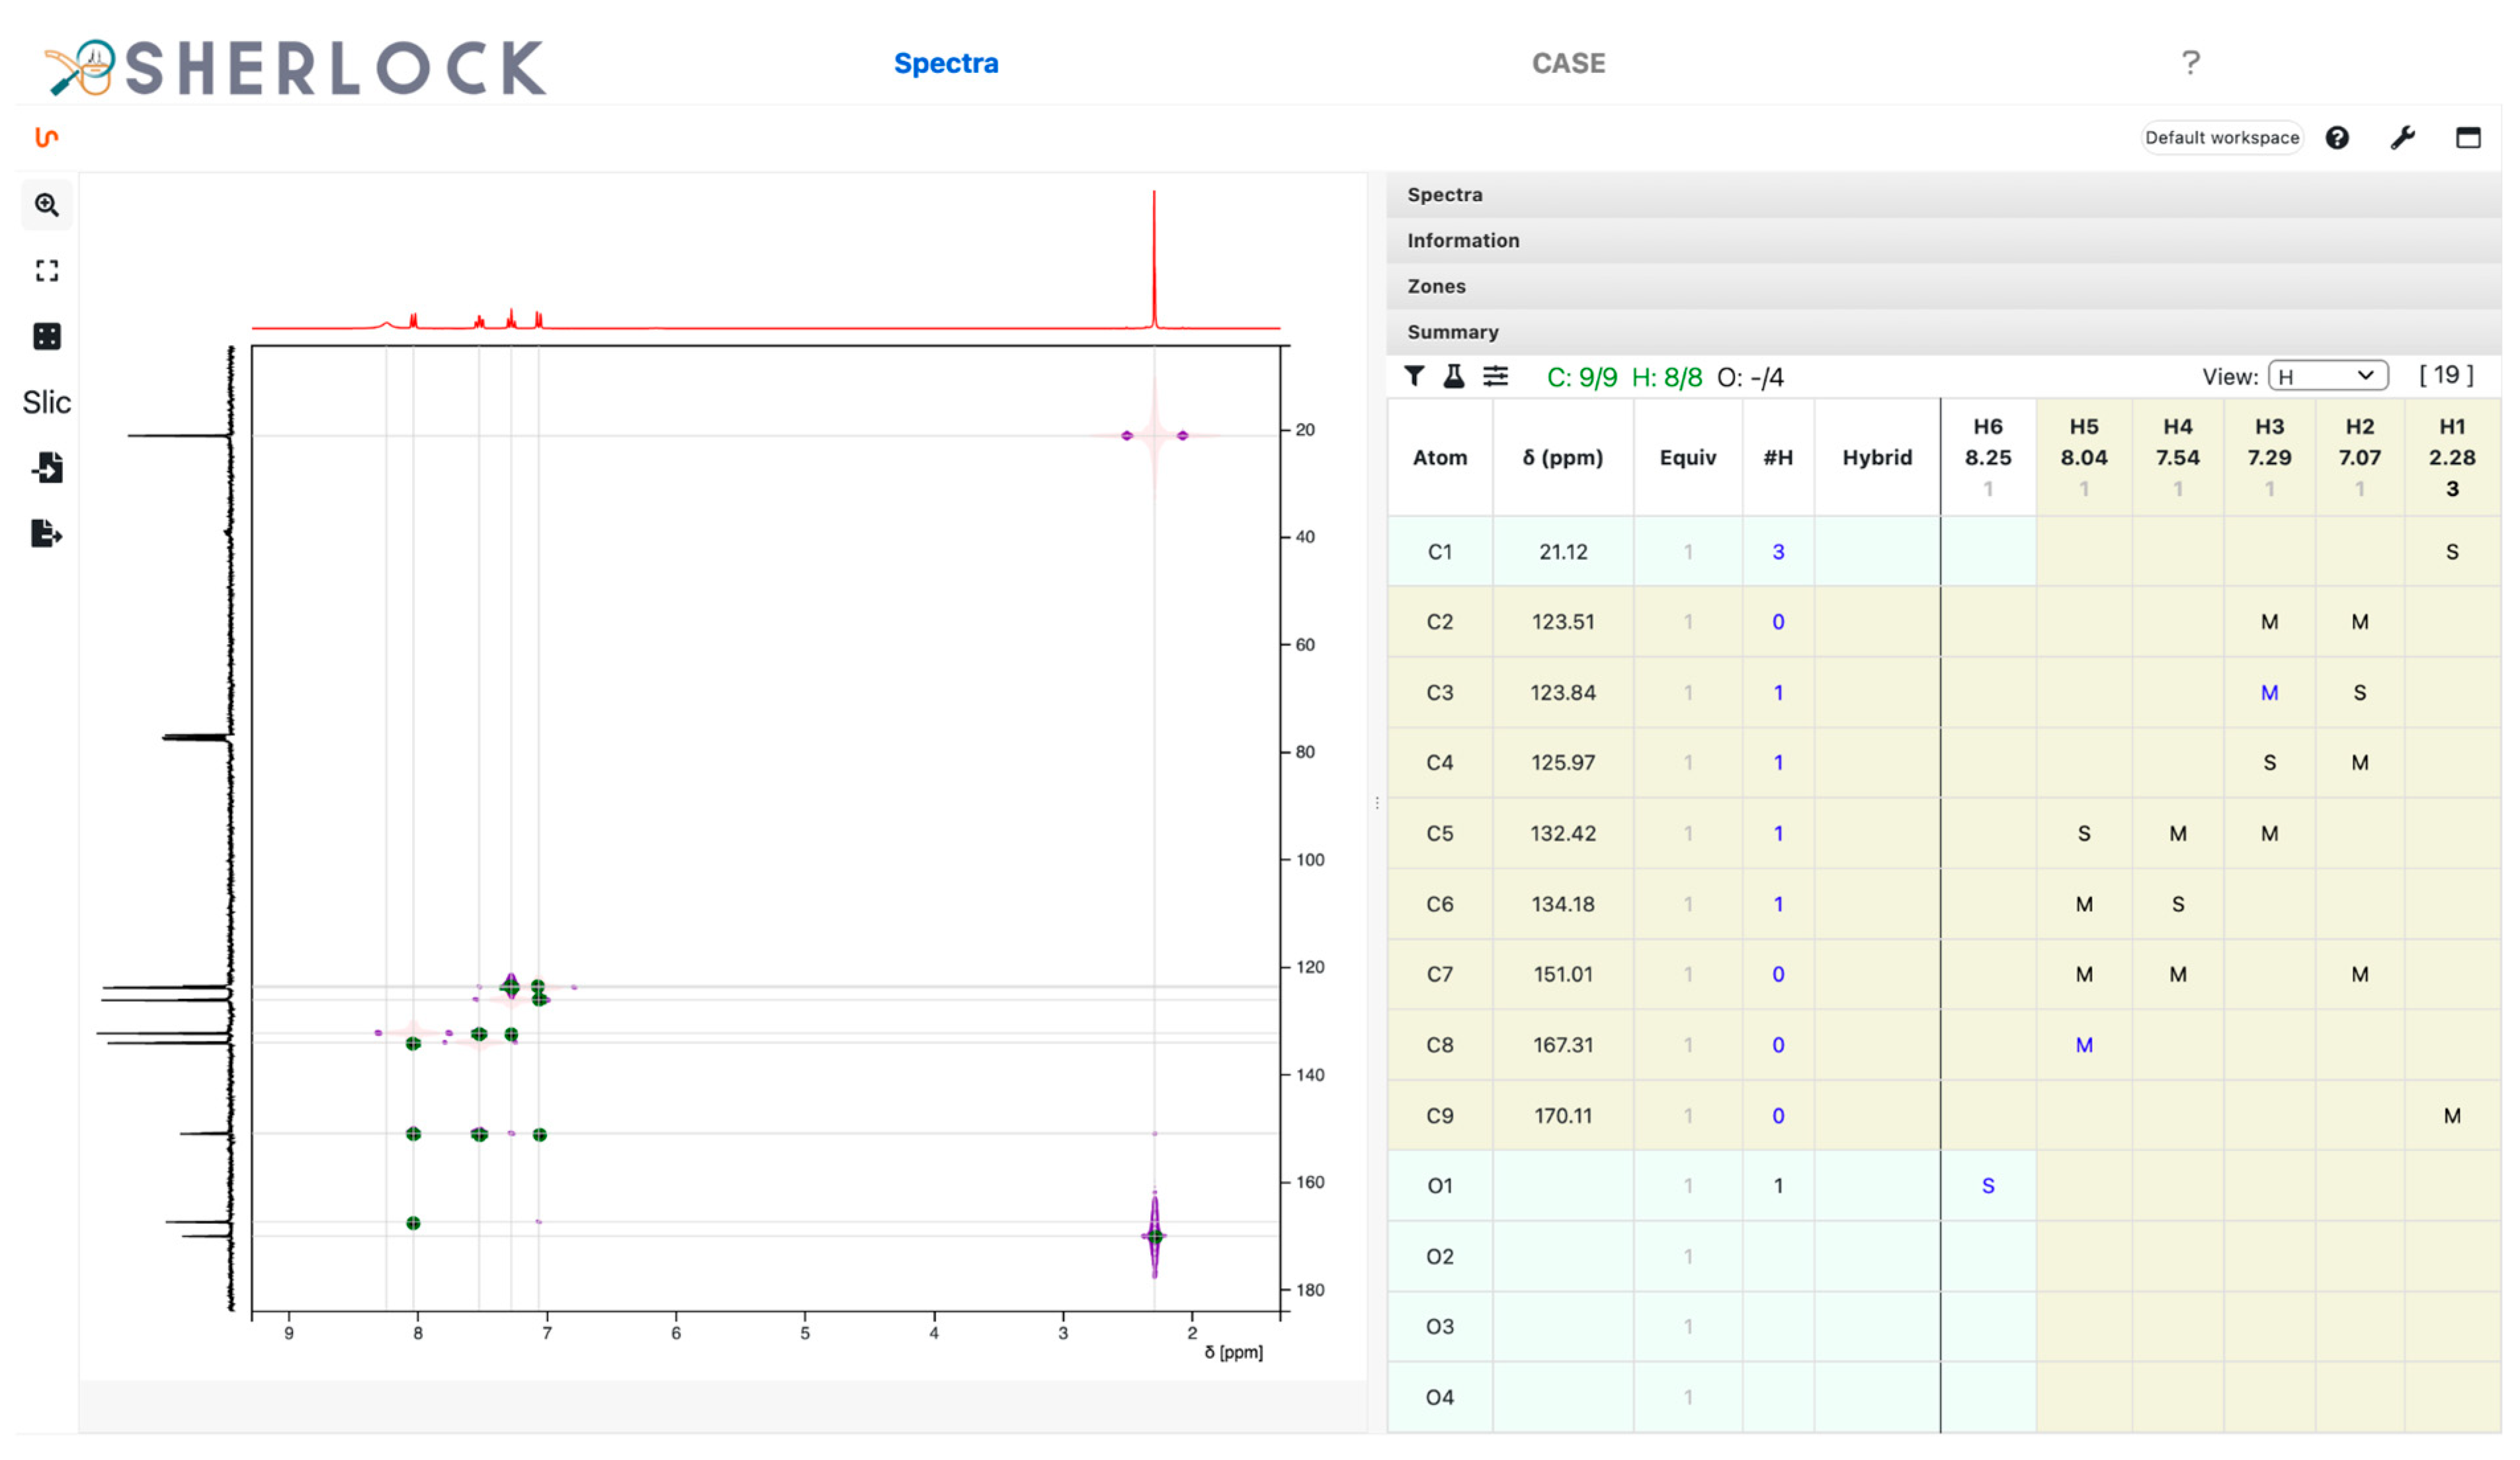
3.2.1. Spectra Tab
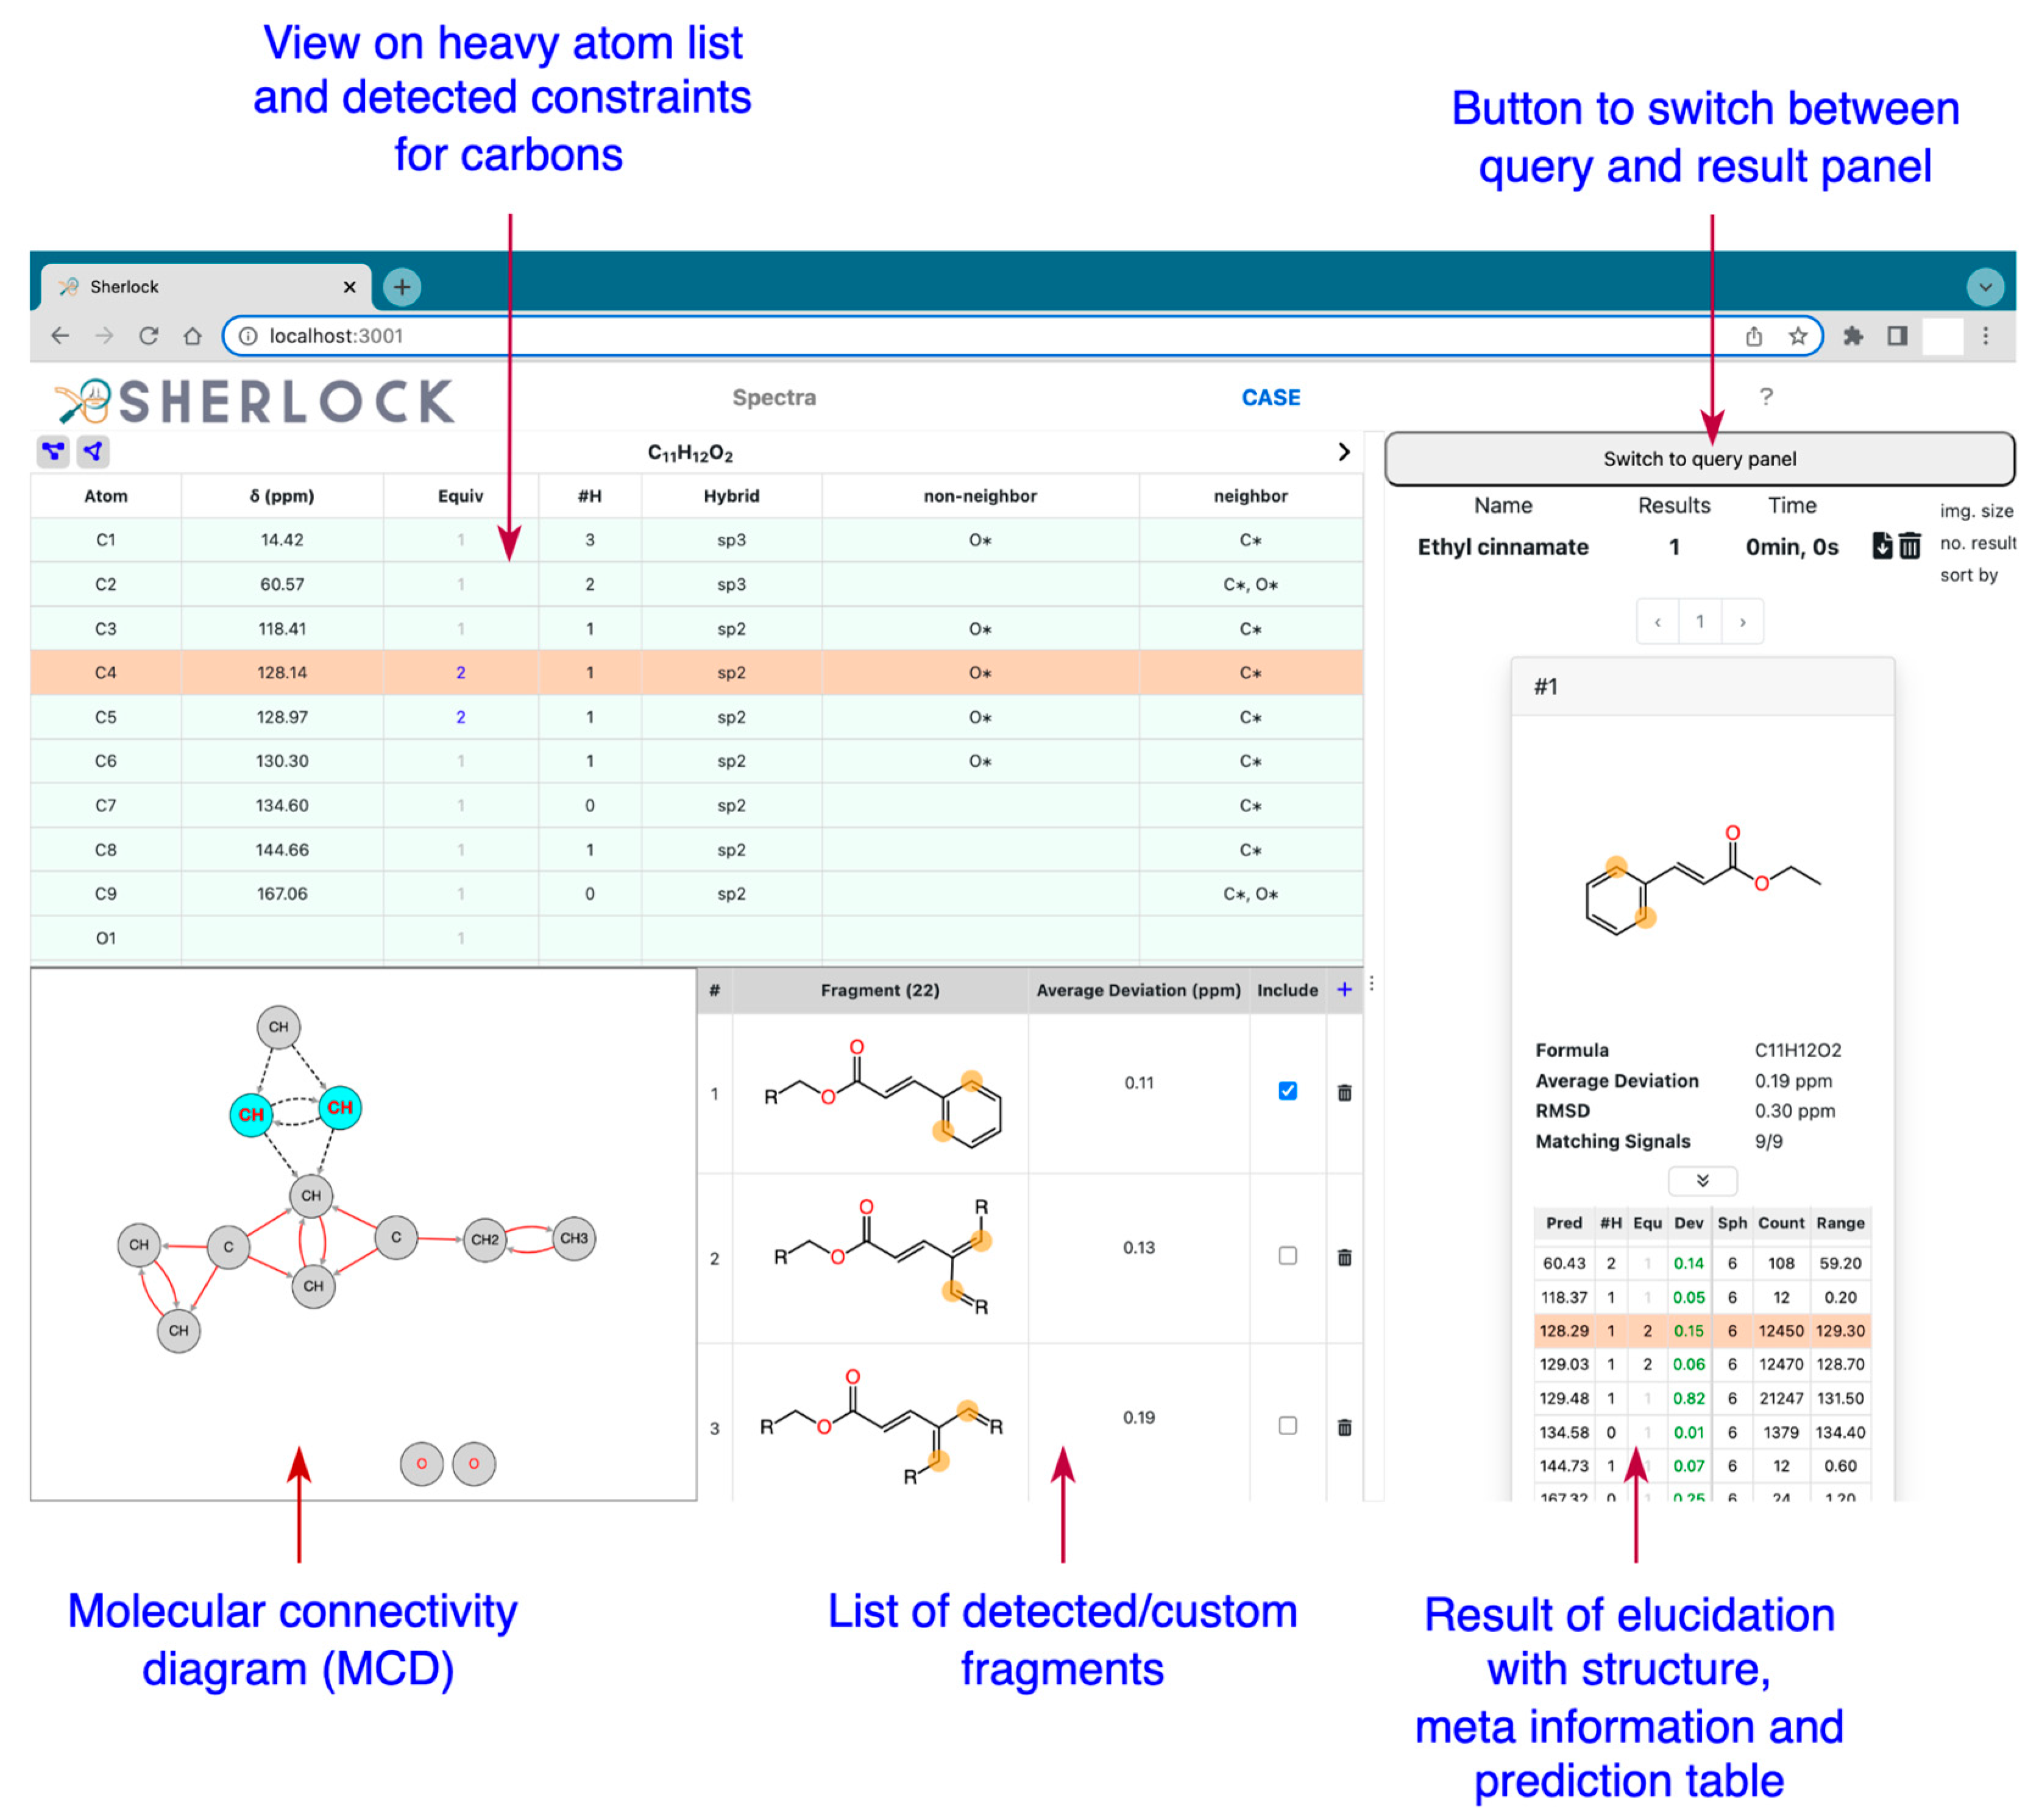
3.2.2. CASE Tab
3.3. Backend
3.3.1. Dereplication
3.3.2. Fragment Library
3.3.3. Statistics-Driven Generation of Structural Constraints
3.3.4. Structure Generation
3.3.5. Spectra Prediction and Ranking
4. Conclusions
5. Implementation, Software and Test Data
5.1. Implementation
5.2. Software and Test Data
Supplementary Materials
Author Contributions
Funding
Institutional Review Board Statement
Informed Consent Statement
Data Availability Statement
Acknowledgments
Conflicts of Interest
Abbreviations
| NMR | Nuclear Magnetic Resonance |
| CASE | Computer-Assisted Structure Elucidation |
| MS | Mass Spectrometry |
| GUI | Graphical User Interface |
| MF | Molecular Formula |
| ppm | Parts Per Million |
| MCD | Molecular Connectivity Diagram |
| NN | Non-Neighbor (forbidden) |
| SN | Set Neighbour (mandatory) |
| HYBR | Hybridization |
| HHB | Hetero-Hetero Bond |
| DEV | Allowed Deviation (tolerance) |
| AVGDEV | Allowed Average Deviation |
| RMSD | Root-Mean-Square Deviation |
| HSQC | Heteronuclear Single Quantum Coherence |
| me-HSQC | Multiplicity-edited HSQC |
| HMBC | Heteronuclear Multiple Bond Correlation |
| COSY | Correlated Spectroscopy |
| DEPT | Distortionless Enhancement by Polarisation Transfer |
| THF | Tetrahydrofuran |
| DOI | Digital Object Identifier |
References
- Elyashberg, M. Identification and structure elucidation by NMR spectroscopy. TrAC Trends Anal. Chem. 2015, 69, 88–97. [Google Scholar] [CrossRef]
- Elyashberg, M.; Argyropoulos, D. Computer Assisted Structure Elucidation (CASE): Current and future perspectives. Magn. Reson. Chem. 2021, 59, 669–690. [Google Scholar] [CrossRef]
- Steinbeck, C. LUCY—A Program for Structure Elucidation from NMR Correlation Experiments. Angew. Chem. Int. Ed. Engl. 1996, 35, 1984–1986. [Google Scholar] [CrossRef]
- Burns, D.C.; Mazzola, E.P.; Reynolds, W.F. The role of computer-assisted structure elucidation (CASE) programs in the structure elucidation of complex natural products. Nat. Prod. Rep. 2019, 36, 919–933. [Google Scholar] [CrossRef]
- Elyashberg, M.; Williams, A. ACD/Structure Elucidator: 20 Years in the History of Development. Molecules 2021, 26, 6623. [Google Scholar] [CrossRef]
- Steinbeck, C. Recent developments in automated structure elucidation of natural products. Nat. Prod. Rep. 2004, 21, 512–518. [Google Scholar] [CrossRef]
- Steinbeck, C. Computer-Assisted Structure Elucidation. In Handbook of Chemoinformatics; Gasteiger, J., Ed.; Wiley-VCH: Weinheim, Germany, 2003; Volume 3, pp. 1378–1406. [Google Scholar] [CrossRef]
- Elyashberg, M.E.; Williams, A.; Blinov, K. Contemporary Computer-Assisted Approaches to Molecular Structure Elucidation; Royal Society of Chemistry: London, UK, 2015; Available online: https://play.google.com/store/books/details?id=fmsoDwAAQBAJ (accessed on 30 September 2022).
- Lindel, T.; Junker, J.; Köck, M. 2D-NMR-guided constitutional analysis of organic compounds employing the computer program COCON. Eur. J. Org. Chem. 1999, 1999, 573–577. [Google Scholar] [CrossRef]
- Steinbeck, C. SENECA: A platform-independent, distributed, and parallel system for computer-assisted structure elucidation in organic chemistry. J. Chem. Inf. Comput. Sci. 2001, 41, 1500–1507. [Google Scholar] [CrossRef] [PubMed]
- Nuzillard, J.-M.; Georges, M. Logic for structure determination. Tetrahedron 1991, 47, 3655–3664. [Google Scholar] [CrossRef]
- Plainchont, B.; de Paulo Emerenciano, V.; Nuzillard, J.-M. Recent advances in the structure elucidation of small organic molecules by the LSD software. Magn. Reson. Chem. 2013, 51, 447–453. [Google Scholar] [CrossRef]
- Pesek, M.; Juvan, A.; Jakoš, J.; Košmrlj, J.; Marolt, M.; Gazvoda, M. Database Independent Automated Structure Elucidation of Organic Molecules Based on IR, 1H NMR, 13C NMR, and MS Data. J. Chem. Inf. Model. 2021, 61, 756–763. [Google Scholar] [CrossRef] [PubMed]
- Mnova, v14.3.0, Mestrelab: Santiago de Compostela, Spain. 2016. Available online: https://mestrelab.com/software/mnova/ (accessed on 30 September 2022).
- Kessler, P.; Godejohann, M. Identification of tentative marker in Corvina and Primitivo wines with CMC-se. Magn. Reson. Chem. 2018, 56, 480–492. [Google Scholar] [CrossRef]
- Elyashberg, M.E.; Blinov, K.A.; Martirosian, E.R. A new approach to computer-aided molecular structure elucidation: The expert system Structure Elucidator. Lab. Autom. Inf. Manage. 1999, 34, 15–30. [Google Scholar] [CrossRef]
- Structure Elucidator Suite—ACD/Labs; v2022; ACD/Labs: Toronto, ON, Canada, 2021; Available online: https://www.acdlabs.com/products/spectrus-platform/structure-elucidator-suite/ (accessed on 30 September 2022).
- Kuhn, S.; Johnson, S.R. Stereo-Aware Extension of HOSE Codes. ACS Omega. 2019, 4, 7323–7329. [Google Scholar] [CrossRef]
- Schütz, V.; Purtuc, V.; Felsinger, S.; Robien, W. CSEARCH-STEREO: A new generation of NMR database systems allowing three-dimensional spectrum prediction. Fresenius J. Anal. Chem. 1997, 359, 33–41. [Google Scholar] [CrossRef]
- Blinov, K.A.; Elyashberg, M.E.; Molodtsov, S.G.; Williams, A.J.; Martirosian, E.R. An expert system for automated structure elucidation utilizing 1H-1H, 13C-1H and 15N-1H 2D NMR correlations. Fresenius J. Anal. Chem. 2001, 369, 709–714. [Google Scholar] [CrossRef]
- Steinbeck, C.; Krause, S.; Kuhn, S. NMRShiftDB-constructing a free chemical information system with open-source components. J. Chem. Inf. Comput. Sci. 2003, 43, 1733–1739. [Google Scholar] [CrossRef] [PubMed]
- Sorokina, M.; Merseburger, P.; Rajan, K.; Yirik, M.A.; Steinbeck, C. COCONUT online: Collection of Open Natural Products database. J. Cheminform. 2021, 13, 2. [Google Scholar] [CrossRef]
- Patiny, L.; Musallam, H.; Zasso, M.; Bolaños, A.; Kostro, D.; Wenk, M.; Ahkrin, S.; Jeannerat, D.; Ziegler, E.; Liermann, J.; et al. NMRium, v0.33.0. ReactJS component to display and process NMR spectra. Zenodo, 2022. [CrossRef]
- Molodtsov, S.G.; Elyashberg, M.E.; Blinov, K.A.; Williams, A.J.; Martirosian, E.E.; Martin, G.E.; Lefebvre, B. Structure elucidation from 2D NMR spectra using the StrucEluc expert system: Detection and removal of contradictions in the data. J. Chem. Inf. Comput. Sci. 2004, 44, 1737–1751. [Google Scholar] [CrossRef]
- Hubert, J.; Nuzillard, J.-M.; Renault, J.-H. Dereplication strategies in natural product research: How many tools and methodologies behind the same concept? Phytochem. Rev. 2017, 16, 55–95. [Google Scholar] [CrossRef]
- Schroll, G.; Duffield, A.M.; Djerassi, C.; Buchanan, B.G.; Sutherland, G.L.; Feigenbaum, E.A.; Lederberg, J. Applications of artificial intelligence for chemical inference, I.I.I. Aliphatic ethers diagnosed by their low-resolution mass spectra and nuclear magnetic resonance data. J. Am. Chem. Soc. 1969, 91, 7440–7445. [Google Scholar] [CrossRef]
- Sutherland, G. Stanford Artificial Intelligence Laboratory. Dendral—A Computer Program for Generating and Filtering Chemical Structures; Computer Science Department, Stanford University: Stanford, CA, USA, 1967. [Google Scholar]
- Munk, M.E. Computer-based structure determination: Then and now. J. Chem. Inf. Comput. Sci. 1998, 38, 997–1009. [Google Scholar] [CrossRef]
- Will, M.; Fachinger, W.; Richert, J.R. Fully automated structure Elucidation—A spectroscopist’s dream comes true. J. Chem. Inf. Comput. Sci. 1996, 36, 221–227. [Google Scholar] [CrossRef]
- Nuzillard, J.-M. The PyLSD Software. Version Alpha-7. Available online: https://nuzillard.github.io/PyLSD/ (accessed on 30 September 2022).
- Nuzillard, J.-M. The LSD Software. v3.5.2. Available online: https://nuzillard.github.io/LSD/ (accessed on 30 September 2022).
- Bremser, W. Hose—A novel substructure code. Anal. Chim. Acta. 1978, 103, 355–365. [Google Scholar] [CrossRef]
- Steinbeck, C.; Han, Y.; Kuhn, S.; Horlacher, O.; Luttmann, E.; Willighagen, E. The Chemistry Development Kit (CDK): An open-source Java library for Chemo- and Bioinformatics. J. Chem. Inf. Comput. Sci. 2003, 43, 493–500. [Google Scholar] [CrossRef]
- Willighagen, E.L.; Mayfield, J.W.; Alvarsson, J.; Berg, A.; Carlsson, L.; Jeliazkova, N.; Kuhn, S.; Pluskal, T.; Rojas-Chertó, M.; Spjuth, O.; et al. The Chemistry Development Kit (CDK) v2.0: Atom typing, depiction, molecular formulas, and substructure searching. J. Cheminform. 2017, 9, 33. [Google Scholar] [CrossRef] [PubMed]
- Bechhofer, S.; Buchan, I.; De Roure, D.; Missier, P.; Ainsworth, J.; Bhagat, J.; Couch, P.; Cruickshank, D.; Delderfield, M.; Dunlop, I.; et al. Why linked data is not enough for scientists. Future Gener Comput. Syst. 2013, 29, 599–611. [Google Scholar] [CrossRef]
- Wilkinson, M.D.; Dumontier, M.; Jan Aalbersberg, I.; Appleton, G.; Axton, M.; Baak, A.; Blomberg, N.; Boiten, J.-W.; da Silva Santos, L.B.; Bourne, P.E.; et al. The FAIR Guiding Principles for scientific data management and stewardship. Sci. Data 2016, 3, 160018. [Google Scholar] [CrossRef] [Green Version]


| # | Structure | Solutions | Rank | Duration (Sec) | Settings | Average Deviation (ppm) | Matching Signals |
|---|---|---|---|---|---|---|---|
| 1 |  1-Naphthoic Acid | 2 | 1 | 1 | default | 0.25 | 11/11 |
| 1 | 1 | 1 | first fragment | ||||
| 2 |  N-Phenylpropanamide | 1 | 1 | 1 | default | 0.23 | 7/7 |
| 1 | 1 | 1 | first fragment | ||||
| 3 |  N-(4-Methylphenyl) propanamide | 2 | 1 | 1 | default | 0.60 | 8/8 |
| 1 | 1 | 1 | first fragment | ||||
| 4 |  Panthenol | 10 | 1 | 1 | default | 0.17 | 7/9 |
| 1 | 1 | 1 | first fragment | ||||
| 5 |  ** 8-(dimethylphosphoryl) -2,6-dimethyloct-2-ene | 1 | 1 | 1 | NN: 0.1% SN: 100% | 1.77 | 11/11 |
| 1 | 1 | 1 | first fragment | ||||
| 6 |  ** 4-Methoxybenzaldehyde O-[tris(1-methylethyl)silyl]oxime | 9 | 1 | 3 | default | 1.16 | 8/8 |
| 2 | 1 | 1 | first fragment | ||||
| 7 |  Ethyl cinnamate | 2 | 1 | 1 | default | 0.19 | 9/9 |
| 1 | 1 | 1 | first fragment | ||||
| 8 |  * Citric acid | 6 | 1 | 1 | default | 1.90 | 4/4 |
| 6 | 1 | 1 | first fragment | ||||
| 9 |  * Nalidixic acid | > 500 | 1 | 63 | default | 1.69 | 12/12 |
| - | - | - | first fragment | ||||
| 1 | 1 | 4 | first fragment (DEV: 3 ppm) | ||||
| 10 |  Nicotinic acid | 1 | 1 | 1 | default | 2.09 | 6/6 |
| 1 | 1 | 1 | first fragment | ||||
| 11 |  ** Ac-Tyr(allyl)-OEt | 9 | 1 | 1 | default | 0.44 | 14/14 |
| 1 | 1 | 1 | first fragment | ||||
| 12 |  **N-Ac-Trp-OEt | 1 | 1 | 1 | default | 0.70 | 15/15 |
| 1 | 1 | 1 | first fragment | ||||
| 13 |  ** propan-2-yl 4-(1-hydroxyethyl)benzoate | 2 | 1 | 1 | default | 1.32 | 9/9 |
| 1 | 1 | 1 | first fragment | ||||
| 14 |  ** 2-iodo-4-phenylphenol | 2 | 1 | 1 | default | 0.90 | 10/10 |
| - | - | - | first fragment | ||||
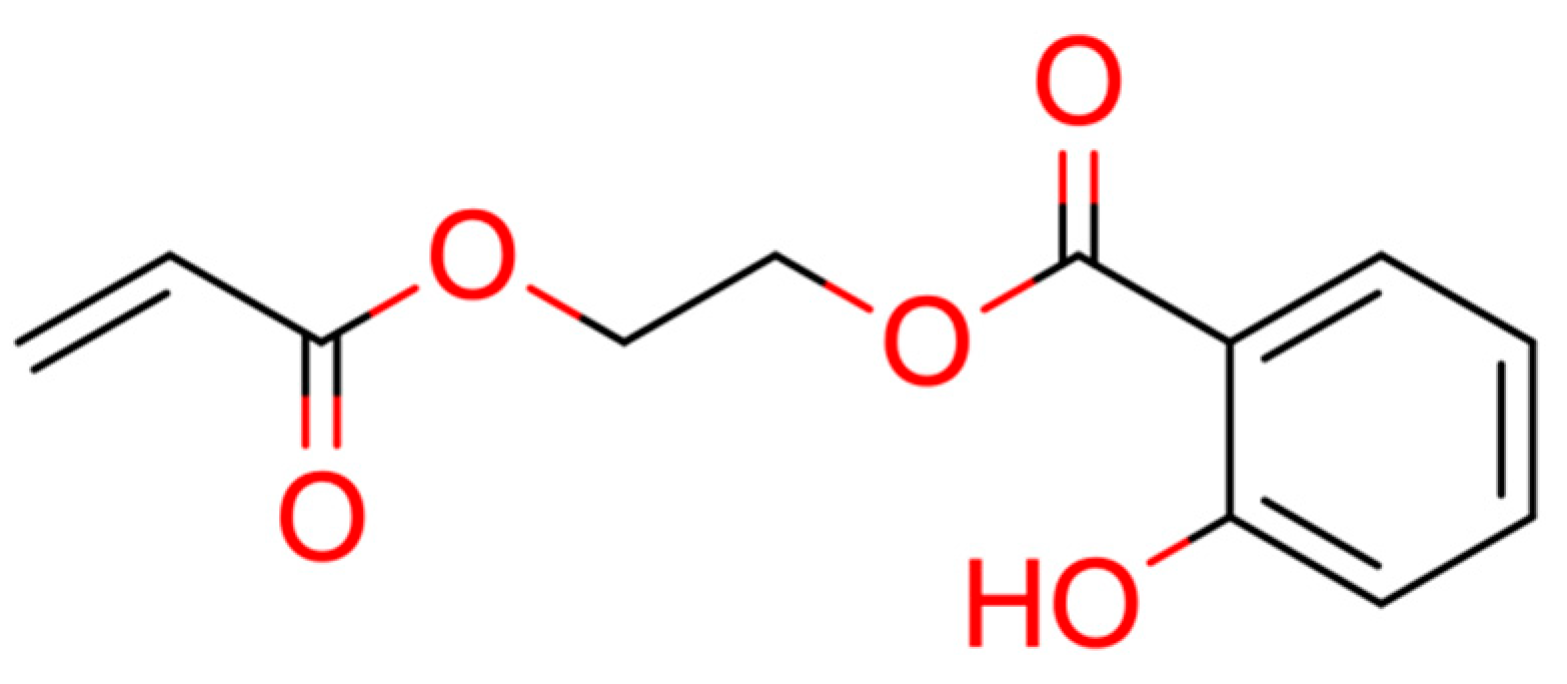
| 15 |  ** 2-prop-2-enoyloxyethyl 2-hydroxybenzoate | 4 | 1 | 1 | default | 0.63 | 12/12 |
| 1 | 1 | 1 | first fragment | ||||
| 16 |  Ibuprofen | 1 | 1 | 1 | default | 0.35 | 10/10 |
| 1 | 1 | 1 | first fragment | ||||
| 17 |  ** 1,2-Bis [(o-ethylphenyl) methylene]hydrazine | 2 | 1 | 380 | HHB | 1.72 | 7/9 |
| - | - | - | first fragment | ||||
| 18 |  Eserine | 6 | 1 | 1 | default | 0.28 | 15/15 |
| 1 | 1 | 1 | first fragment | ||||
| 19 |  Cucurbitacin E | 4 | 1 | 2 | default | 0.66 | 28/32 |
| 1 | 1 | 1 | first fragment | ||||
| 20 |  3-hydroxy-drimenol | 1 | 1 | 1 | default | 1.36 | 13/15 |
| 1 | 1 | 1 | first fragment | ||||
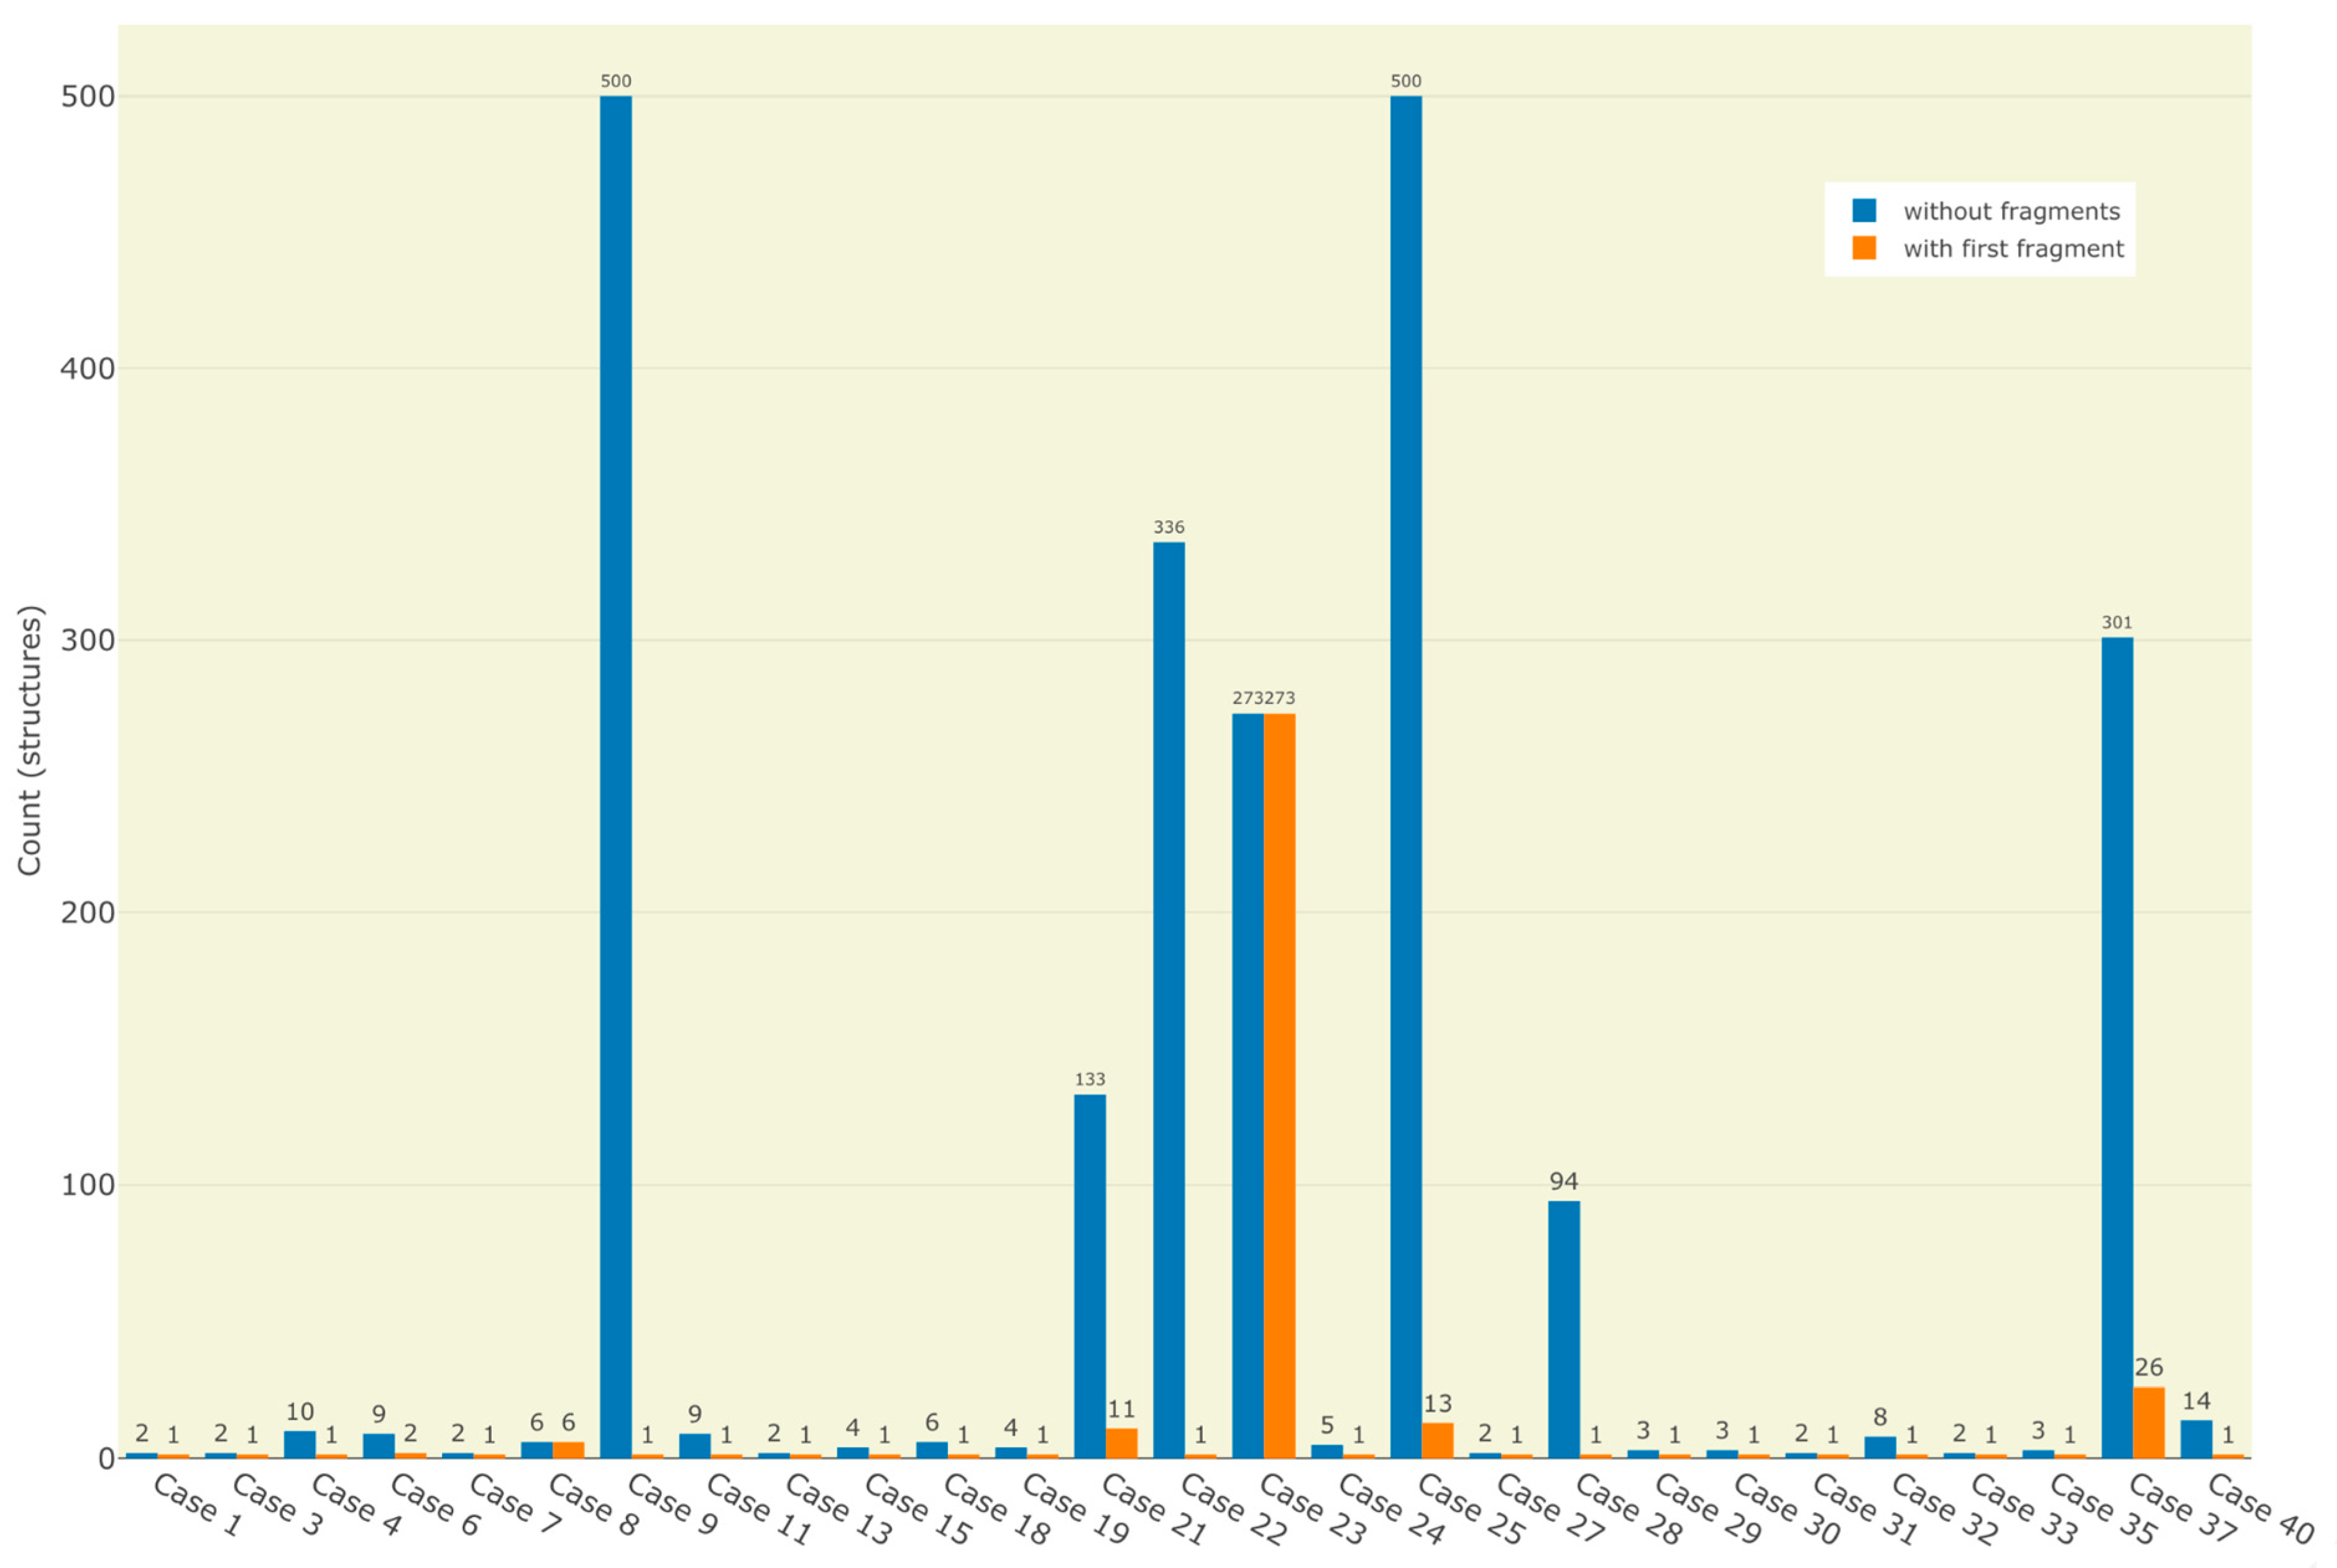
| 21 |  ** Barnesin A | 133 | 8 | 116 | default | 1.92 | 23/23 |
| 11 | 4 | 109 | first fragment | ||||
| 22 |  Allantofuranone | 336 | 1 | 28 | default | 0.11 | 15/15 |
| 1 | 1 | 2 | first fragment | ||||
| 23 |  ** 3-[(2,6-dimethyl-1,2,4a,5,6,7,8,8a-octahydronaphthalen-1-yl)-hydroxymethylidene]-5-methylpyrrolidine-2,4-dione | 273 | 6 | 25 | default | 2.12 | 17/18 |
| 273 | 6 | 19 | first fragment | ||||
| 24 |  Caripyrin | 5 | 1 | 1 | default | 0.74 | 10/10 |
| 1 | 1 | 1 | first fragment | ||||
| 25 |  ** Sinapigladioside | > 500 | 1 | 705 | HYBR: 0.1% SN: 100% | 1.02 | 12/13 |
| 13 | 1 | 18 | first fragment | ||||
| 26 |  Butylparaben | 1 | 1 | 1 | default | 0.33 | 9/9 |
| 1 | 1 | 1 | first fragment | ||||
| 27 |  (2-iodo-5-methoxyphenyl)methanol | 2 | 1 | 1 | default | 0.03 | 8/8 |
| 1 | 1 | 1 | first fragment | ||||
| 28 |  Cocaine | 94 | 1 | 8 | default | 0.95 | 15/15 |
| 1 | 1 | 1 | first fragment | ||||
| 29 |  Cytisine | 3 | 1 | 1 | default | 0.41 | 11/11 |
| 1 | 1 | 1 | first fragment | ||||
| 30 |  ** 4-(2,2,2-trifluoroethoxy)aniline | 3 | 1 | 1 | default | 1.21 | 5/6 |
| - | - | - | first fragment | ||||
| 1 | 1 | 1 | first fragment (DEV: 2 ppm) | ||||
| 31 |  Ethylbenzene | 2 | 1 | 1 | default | 0.51 | 6/6 |
| 1 | 1 | 1 | first fragment | ||||
| 32 |  Aspirin | 8 | 1 | 1 | default | 0.50 | 9/9 |
| 1 | 1 | 1 | first fragment | ||||
| 33 |  α-D-glucose | 2 | 1 | 1 | default | 0.40 | 6/6 |
| 1 | 1 | 1 | first fragment | ||||
| 34 |  Ethyl but-2-enoate | 1 | 1 | 1 | default | 0.34 | 6/6 |
| 1 | 1 | 1 | first fragment | ||||
| 35 |  Menthol | 3 | 1 | 1 | default | 0.94 | 8/10 |
| 1 | 1 | 1 | first fragment | ||||
| 36 |  (4R)-Ipsdienol | 1 | 1 | 1 | default | 0.78 | 10/10 |
| 1 | 1 | 1 | first fragment | ||||
| 37 |  ** 1,3,3-trimethyl-2-(1,3-thiazol-2-yl)bicyclo [2.2.1]heptan-2-ol | 301 | 1 | 18 | default | 1.63 | 10/13 |
| - | - | - | first fragment | ||||
| 26 | 1 | 2 | first fragment (DEV: 4 ppm, AVGDEV: 2 ppm) | ||||
| 38 |  Estragole | 1 | 1 | 1 | default | 0.18 | 8/8 |
| 1 | 1 | 1 | first fragment | ||||
| 39 |  Butyl acrylate | 1 | 1 | 1 | default | 0.57 | 7/7 |
| 1 | 1 | 1 | first fragment | ||||
| 40 |  6-Pentyl-2H-pyran-2-one | 14 | 1 | 1 | default | 0.12 | 10/10 |
| 1 | 1 | 1 | first fragment | ||||
| 41 |  ** Rubterolone A | No result | |||||
| 42 |  ** Actinospirol A | No result | |||||
| 43 |  ** Pseudoxylallemycin B | No result | |||||
| 44 |  ** Necroxime A | No result | |||||
| 45 |  ** Gladiofungin A | No result | |||||
| Atom | 13C Signal | ||
|---|---|---|---|
| Index | Chemical Shift (ppm) | Equivalence | Number of Protons |
| 3 | 137.9 | 1 | 0 |
| 4 | 30.8 | 1 | 2 |
| 5 | 172.2 | 1 | 0 |
| 6,7 | 119.8 | 2 | 1 |
| 8 | 9.89 | 1 | 3 |
| 9,10 | 129.0 | 2 | 1 |
| 11 | 124.2 | 1 | 1 |
| Description | DOI |
|---|---|
| Frontend (source code, v1.0.4) | https://doi.org/10.5281/zenodo.7032805 |
| Frontend (Docker image, v1.0.4) | https://doi.org/10.5281/zenodo.7032810 |
| Backend (source code, v1.1.0) | https://doi.org/10.5281/zenodo.7037546 |
| Backend (Docker images, v1.1.1) | https://doi.org/10.5281/zenodo.7115924 |
| CASEkit (source code, v1.0.1) | https://doi.org/10.5281/zenodo.7115819 |
Disclaimer/Publisher’s Note: The statements, opinions and data contained in all publications are solely those of the individual author(s) and contributor(s) and not of MDPI and/or the editor(s). MDPI and/or the editor(s) disclaim responsibility for any injury to people or property resulting from any ideas, methods, instructions or products referred to in the content. |
© 2023 by the authors. Licensee MDPI, Basel, Switzerland. This article is an open access article distributed under the terms and conditions of the Creative Commons Attribution (CC BY) license (https://creativecommons.org/licenses/by/4.0/).
Share and Cite
Wenk, M.; Nuzillard, J.-M.; Steinbeck, C. Sherlock—A Free and Open-Source System for the Computer-Assisted Structure Elucidation of Organic Compounds from NMR Data. Molecules 2023, 28, 1448. https://doi.org/10.3390/molecules28031448
Wenk M, Nuzillard J-M, Steinbeck C. Sherlock—A Free and Open-Source System for the Computer-Assisted Structure Elucidation of Organic Compounds from NMR Data. Molecules. 2023; 28(3):1448. https://doi.org/10.3390/molecules28031448
Chicago/Turabian StyleWenk, Michael, Jean-Marc Nuzillard, and Christoph Steinbeck. 2023. "Sherlock—A Free and Open-Source System for the Computer-Assisted Structure Elucidation of Organic Compounds from NMR Data" Molecules 28, no. 3: 1448. https://doi.org/10.3390/molecules28031448