
Homoleptic Complexes of Heterocyclic Curcuminoids with Mg(II) and Cu(II): First Conformationally Heteroleptic Case, Crystal Structures, and Biological Properties †
 ,
,  , , , , ,
Abstract
:
1. Introduction
2. Results and Discussion
2.1. IR Spectra
2.2. NMR Spectra
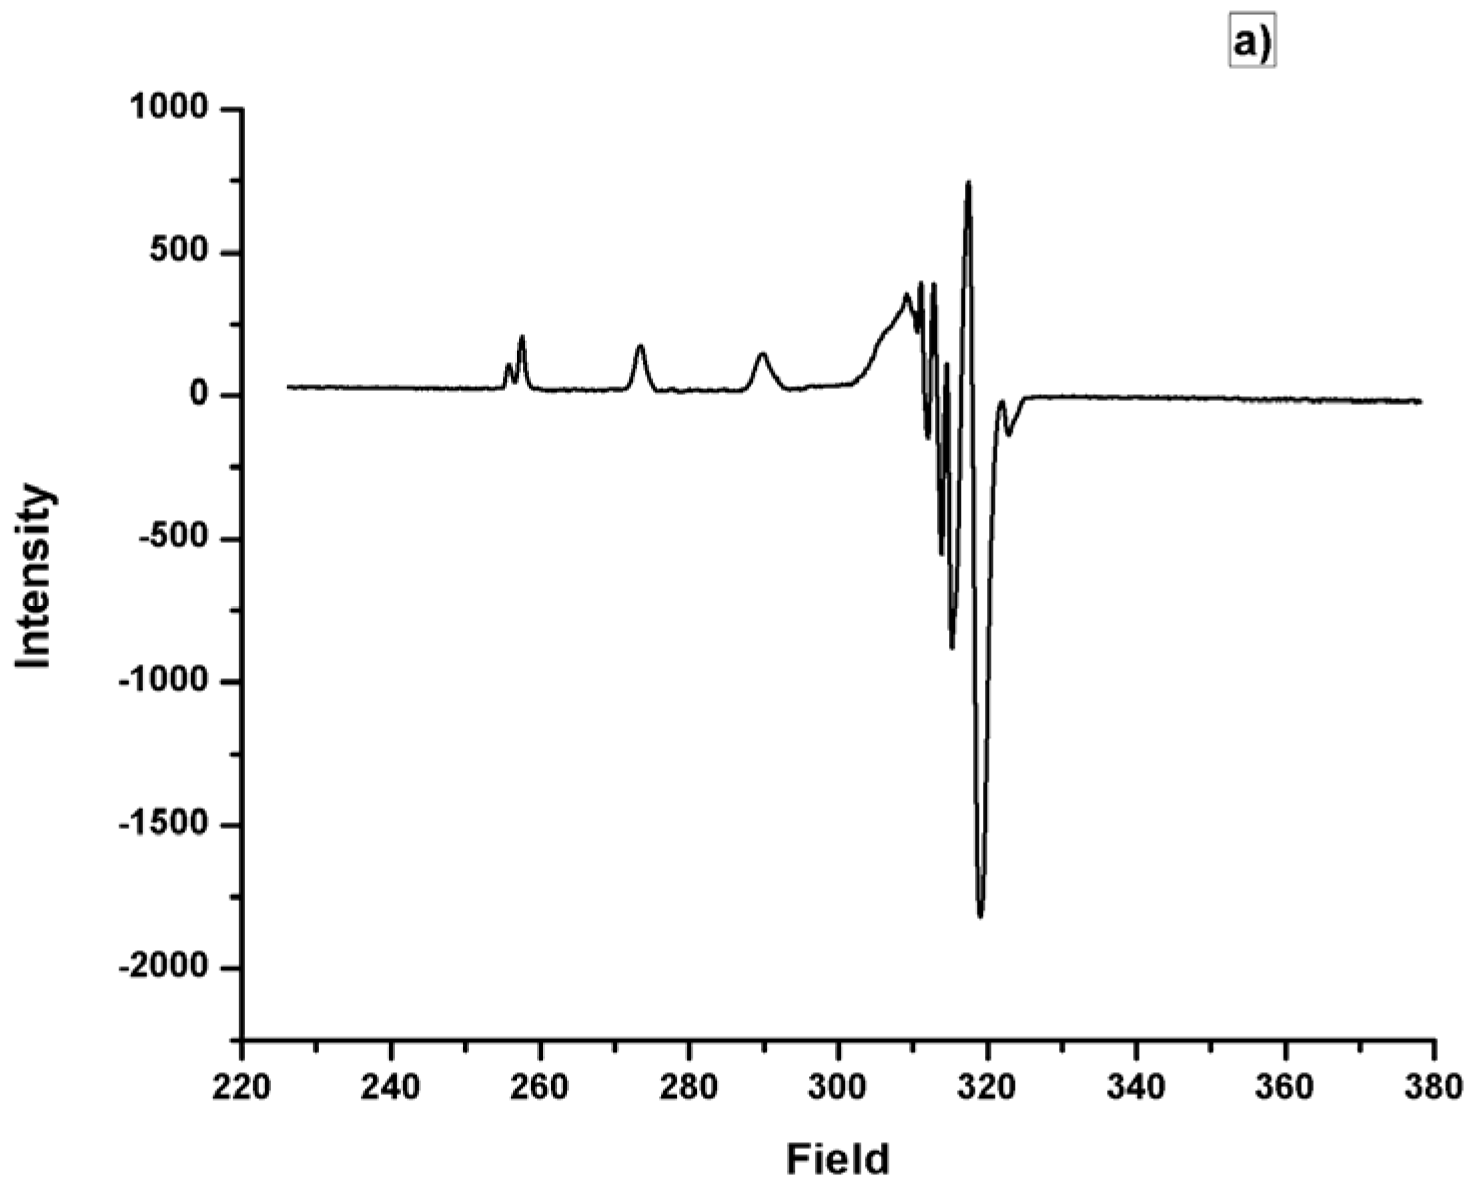
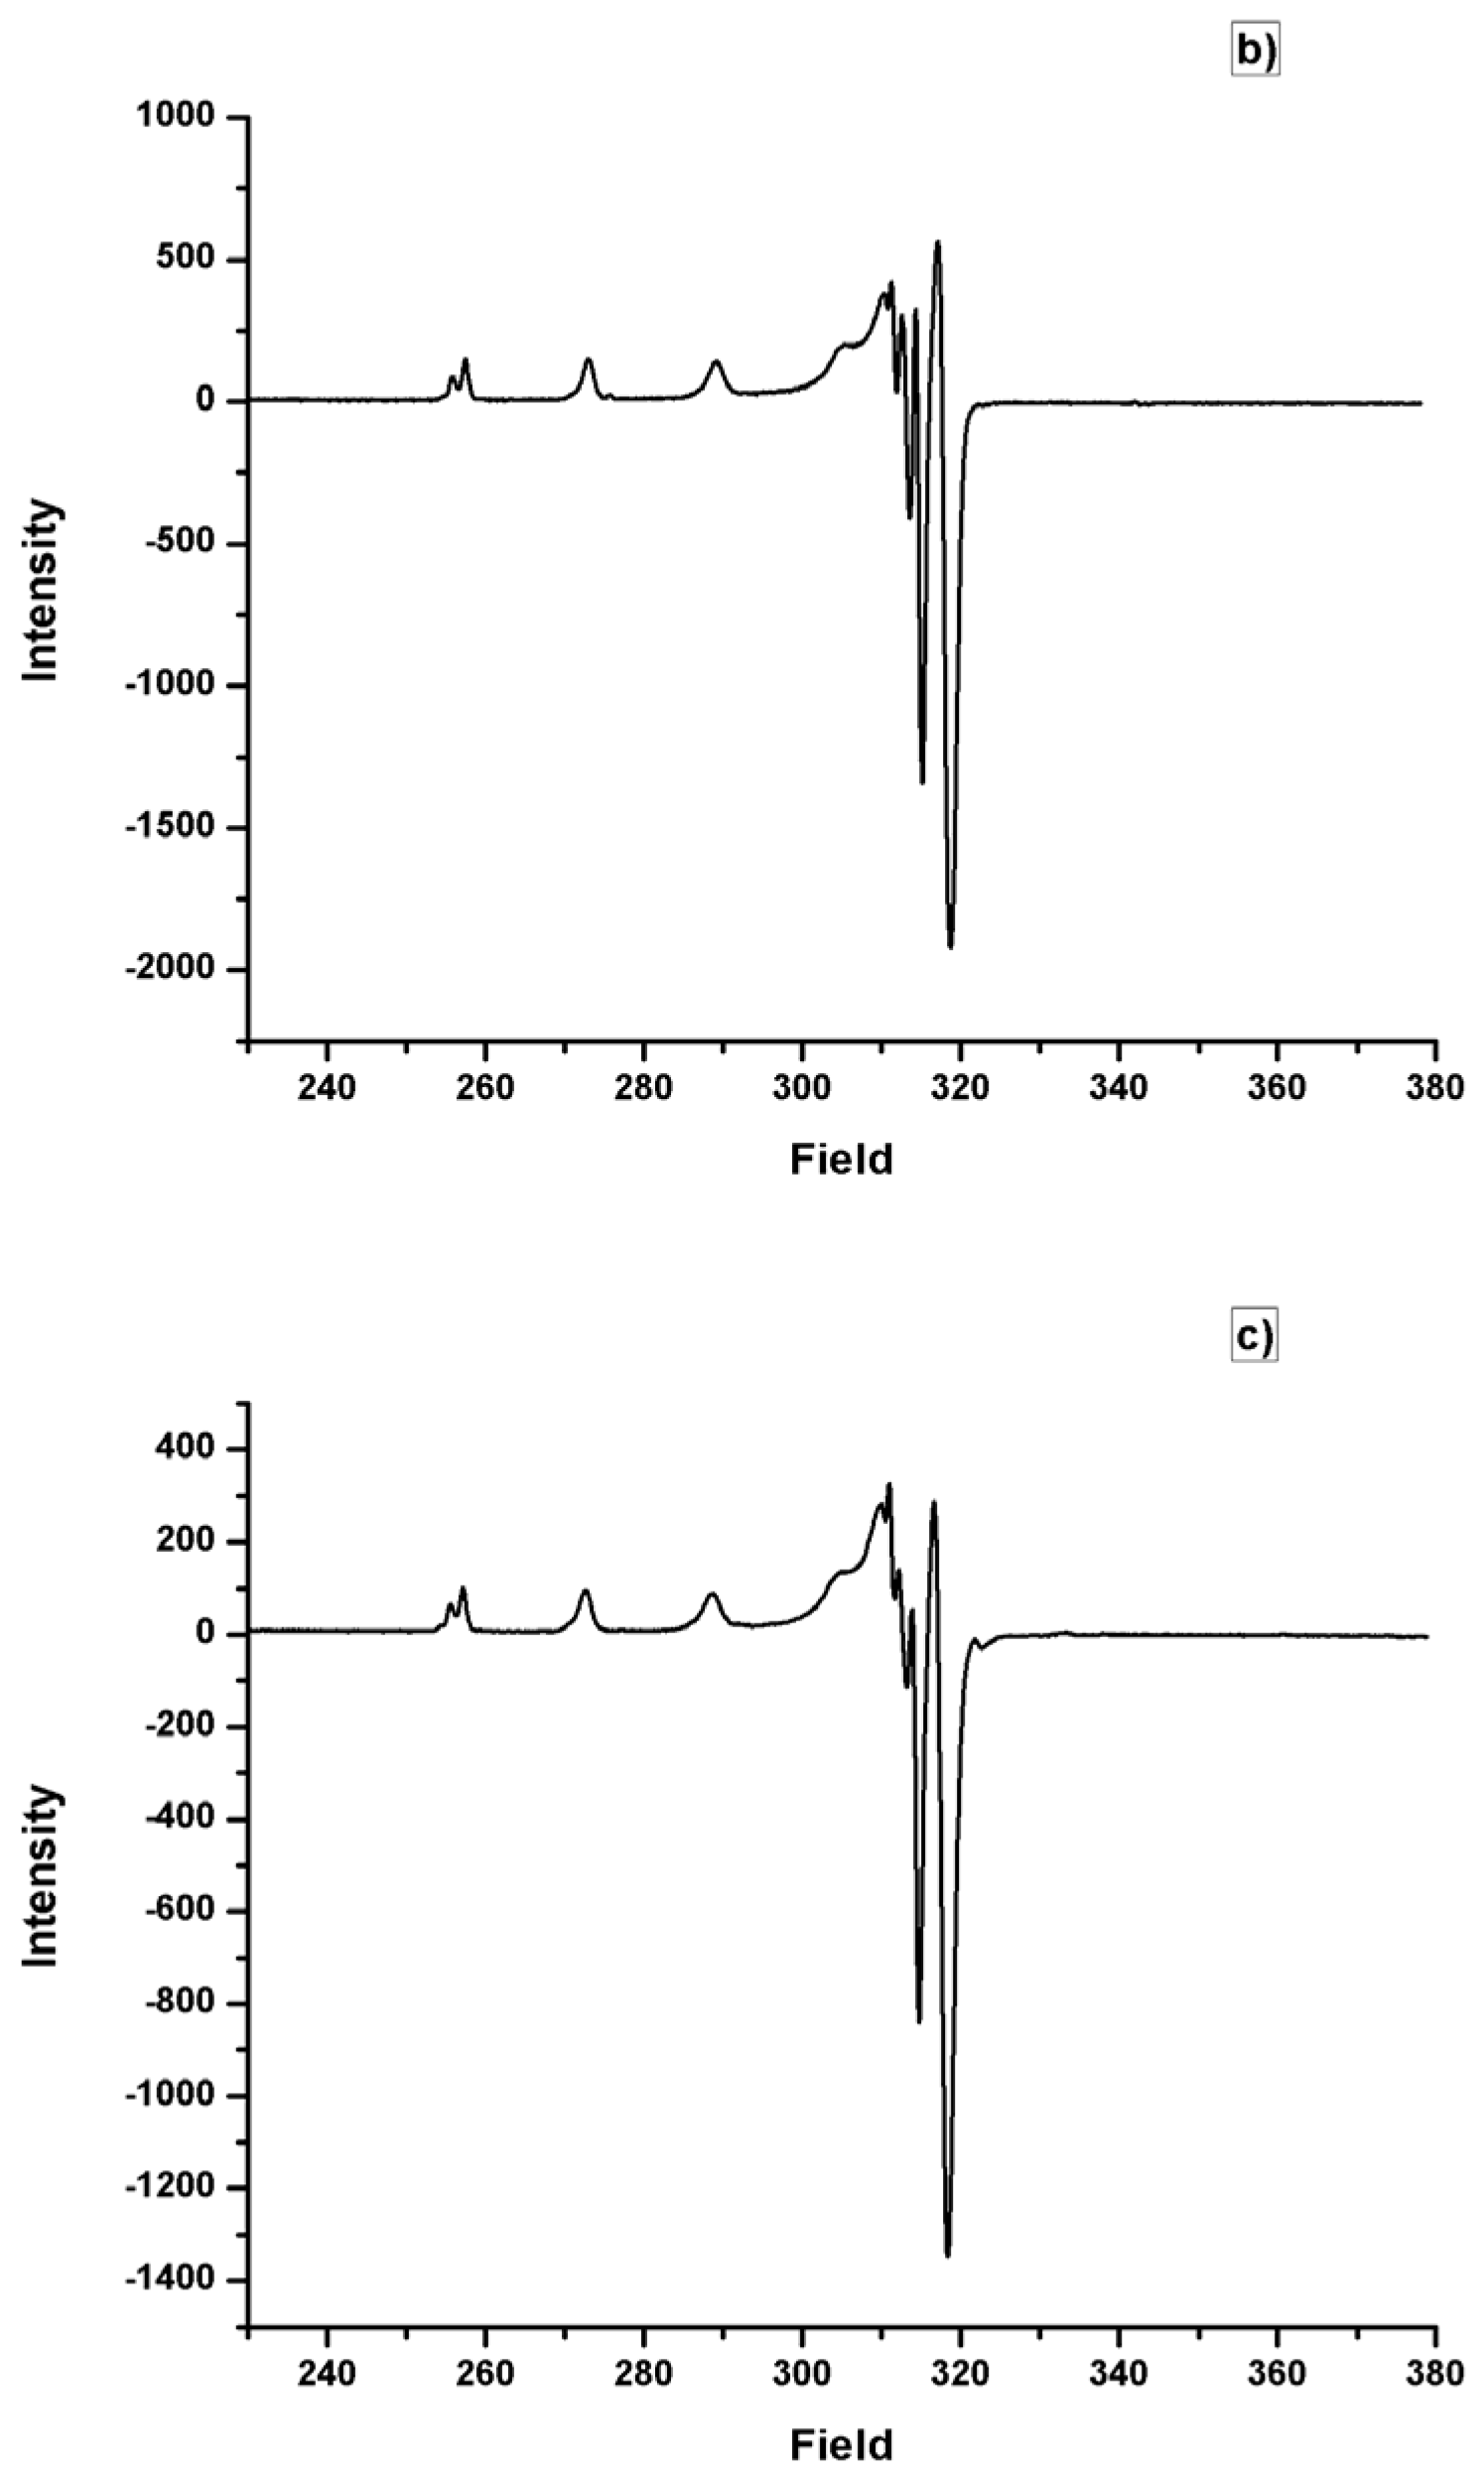
2.3. EPR Spectra
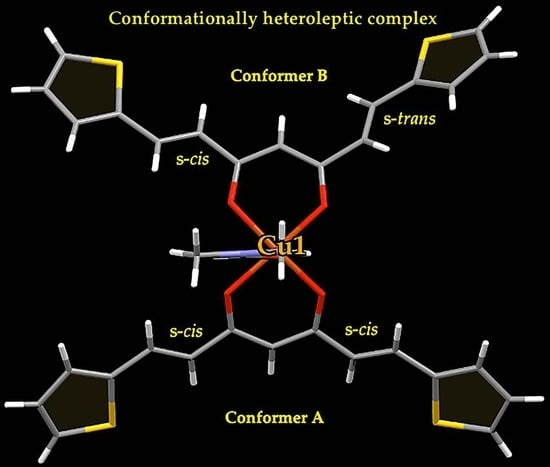
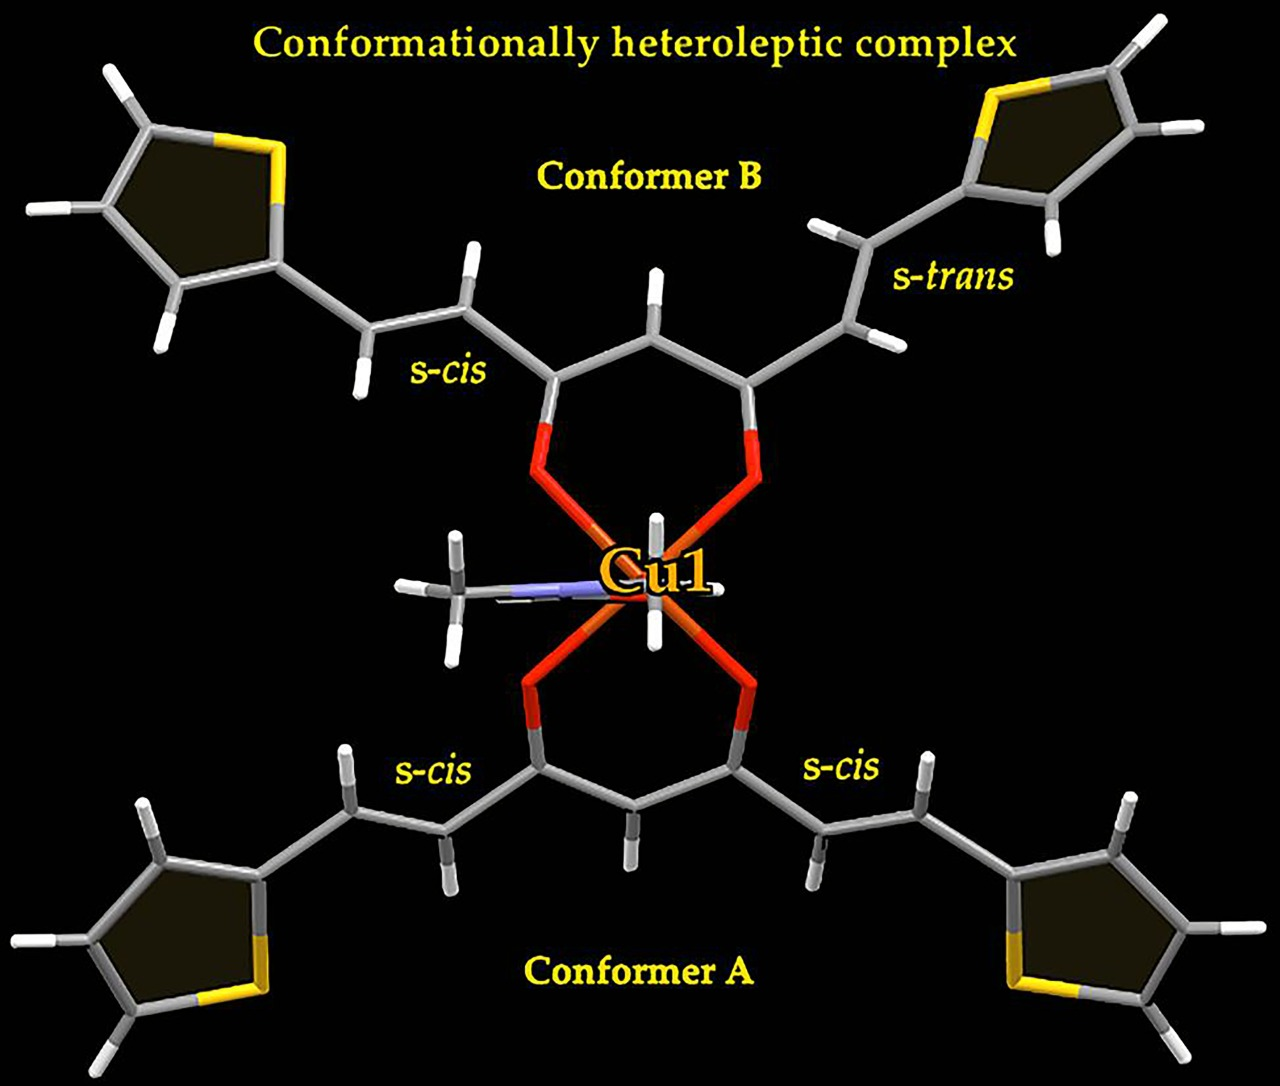
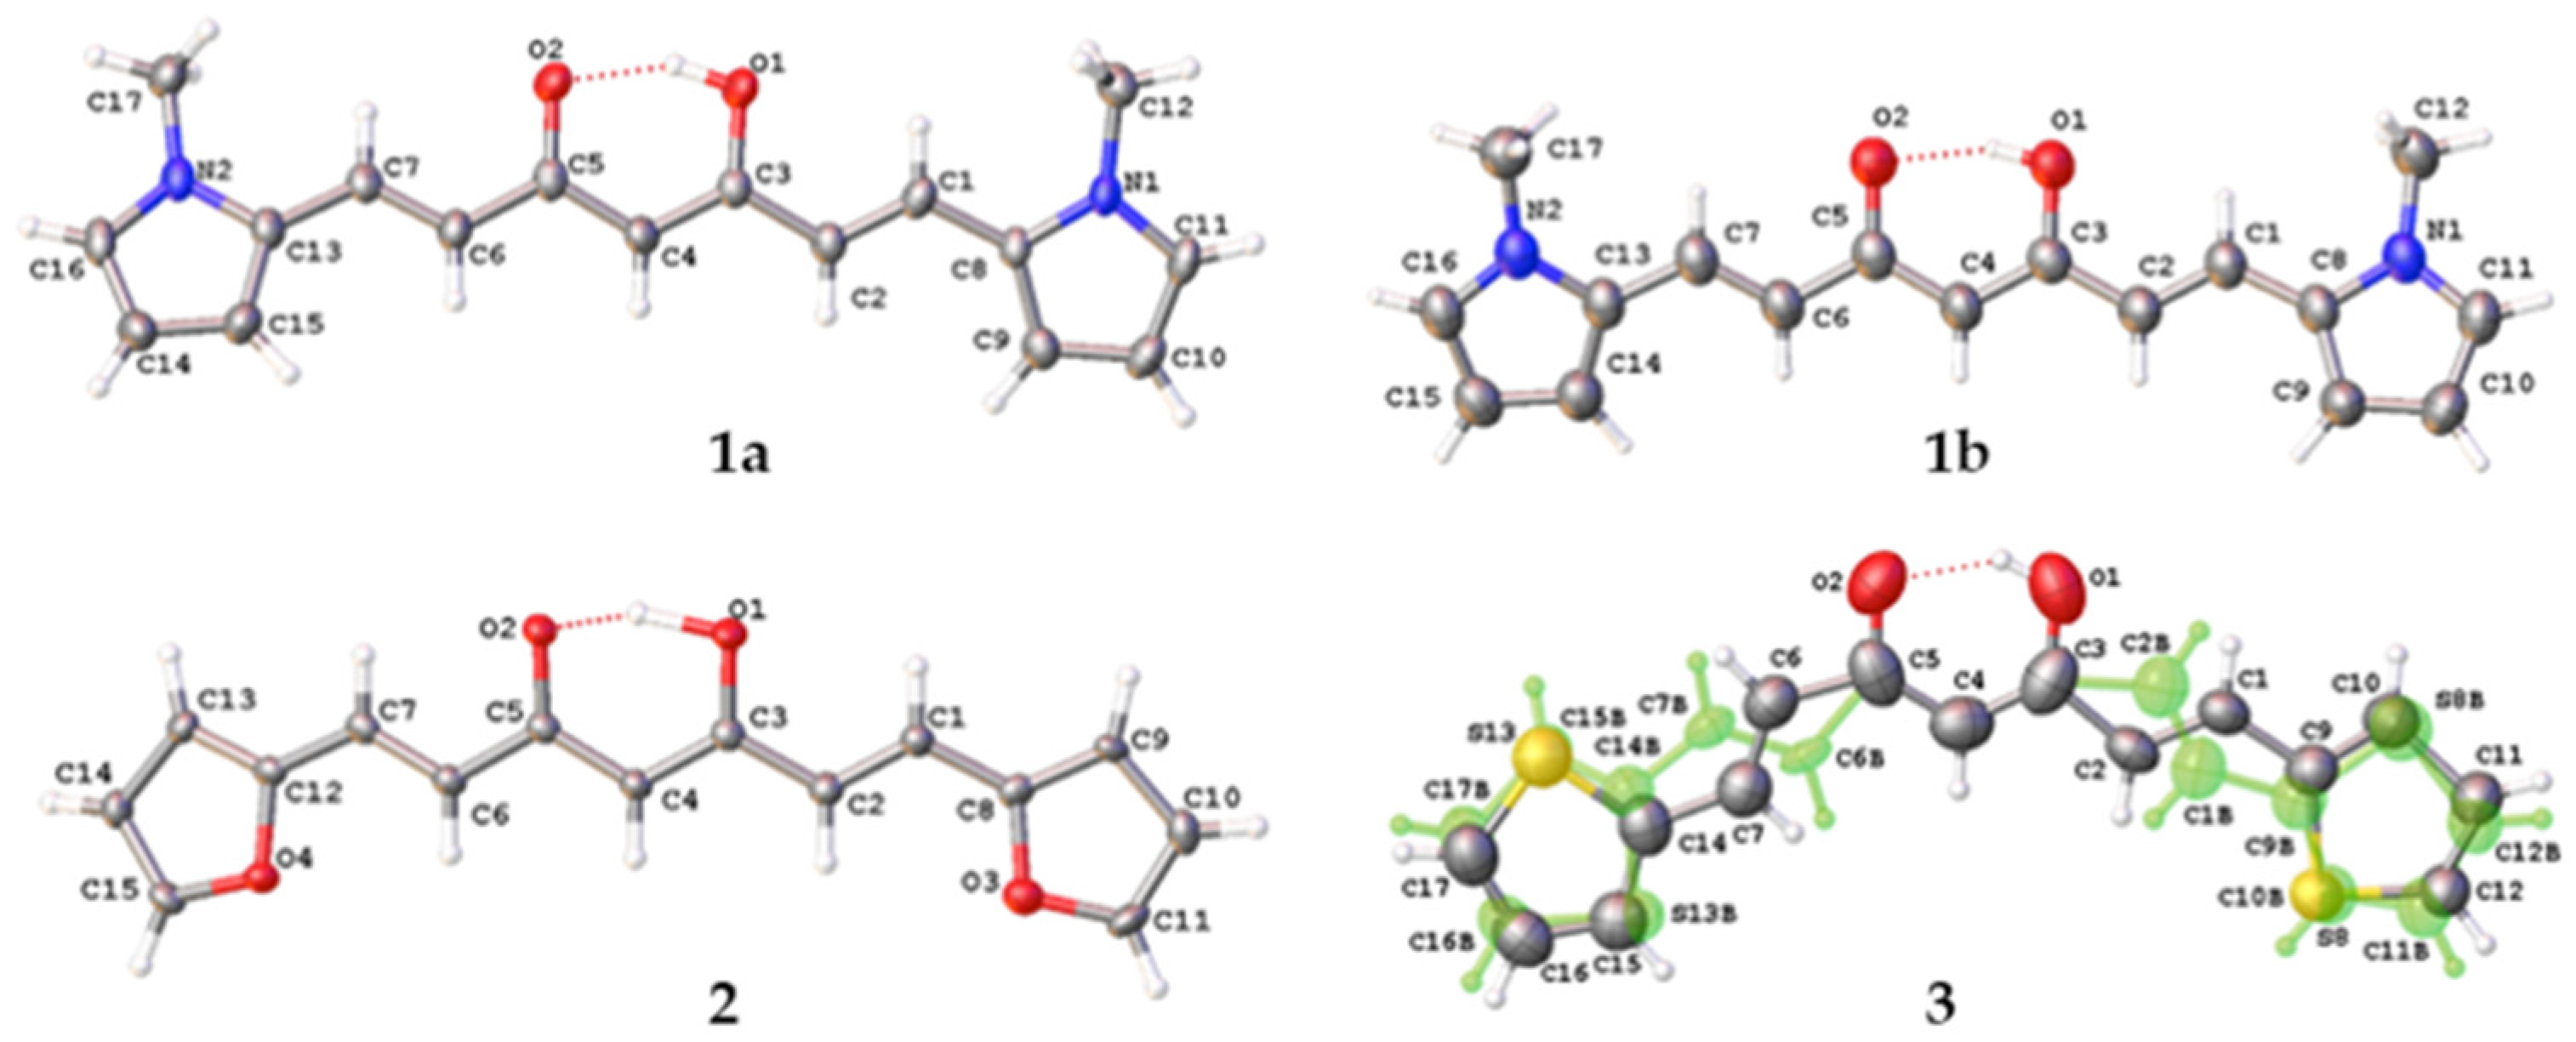
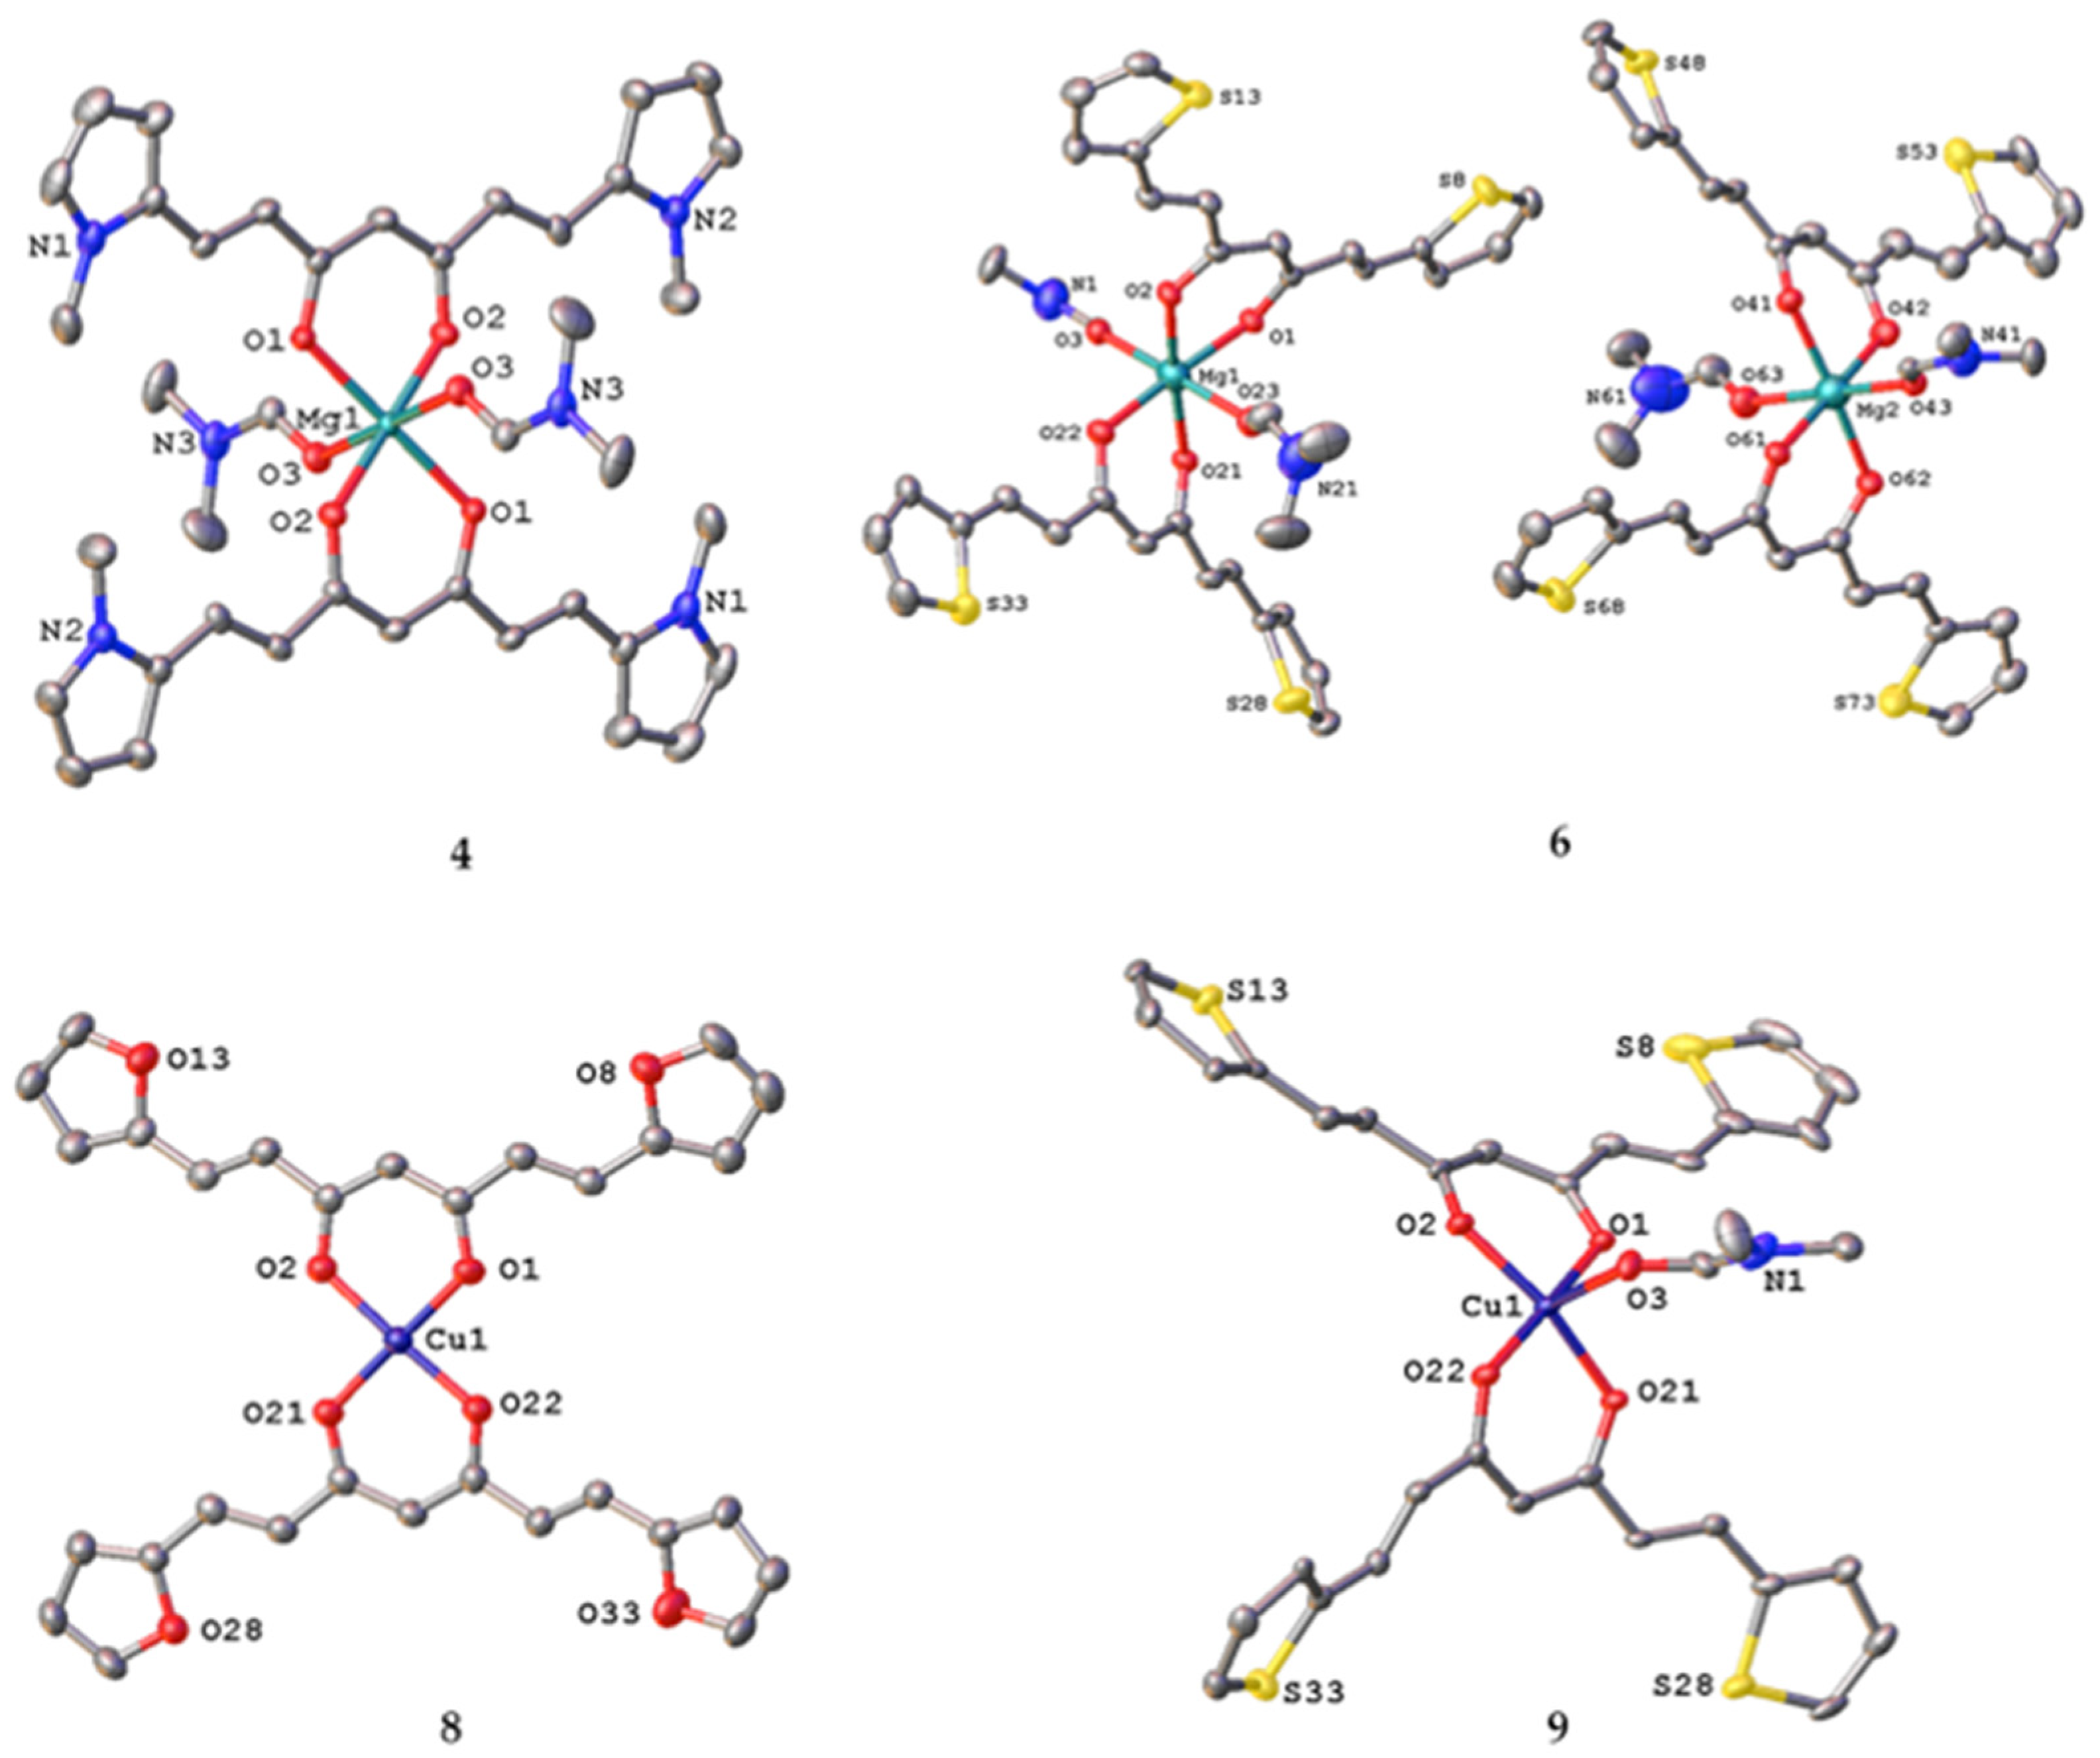
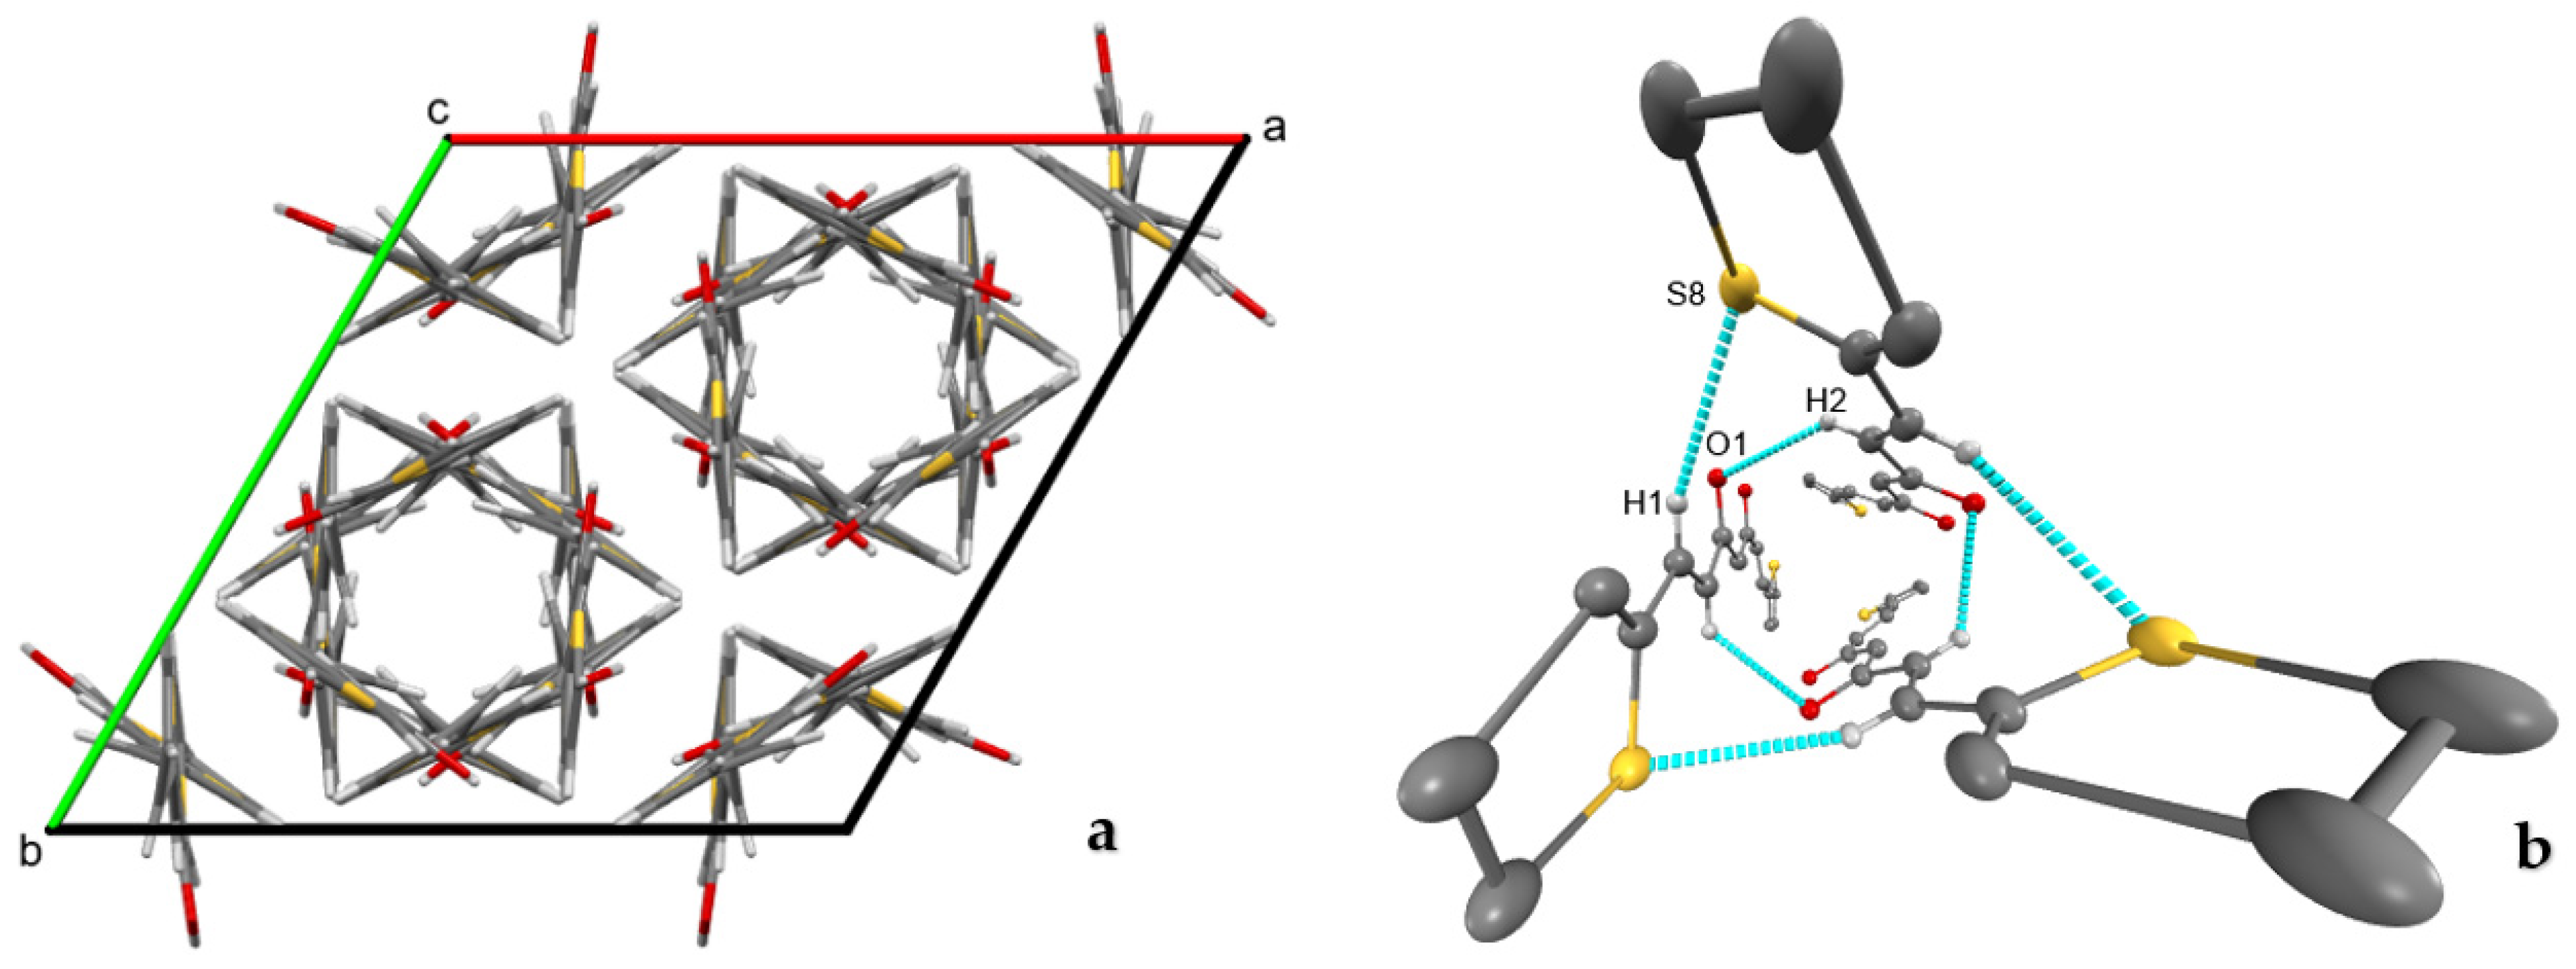
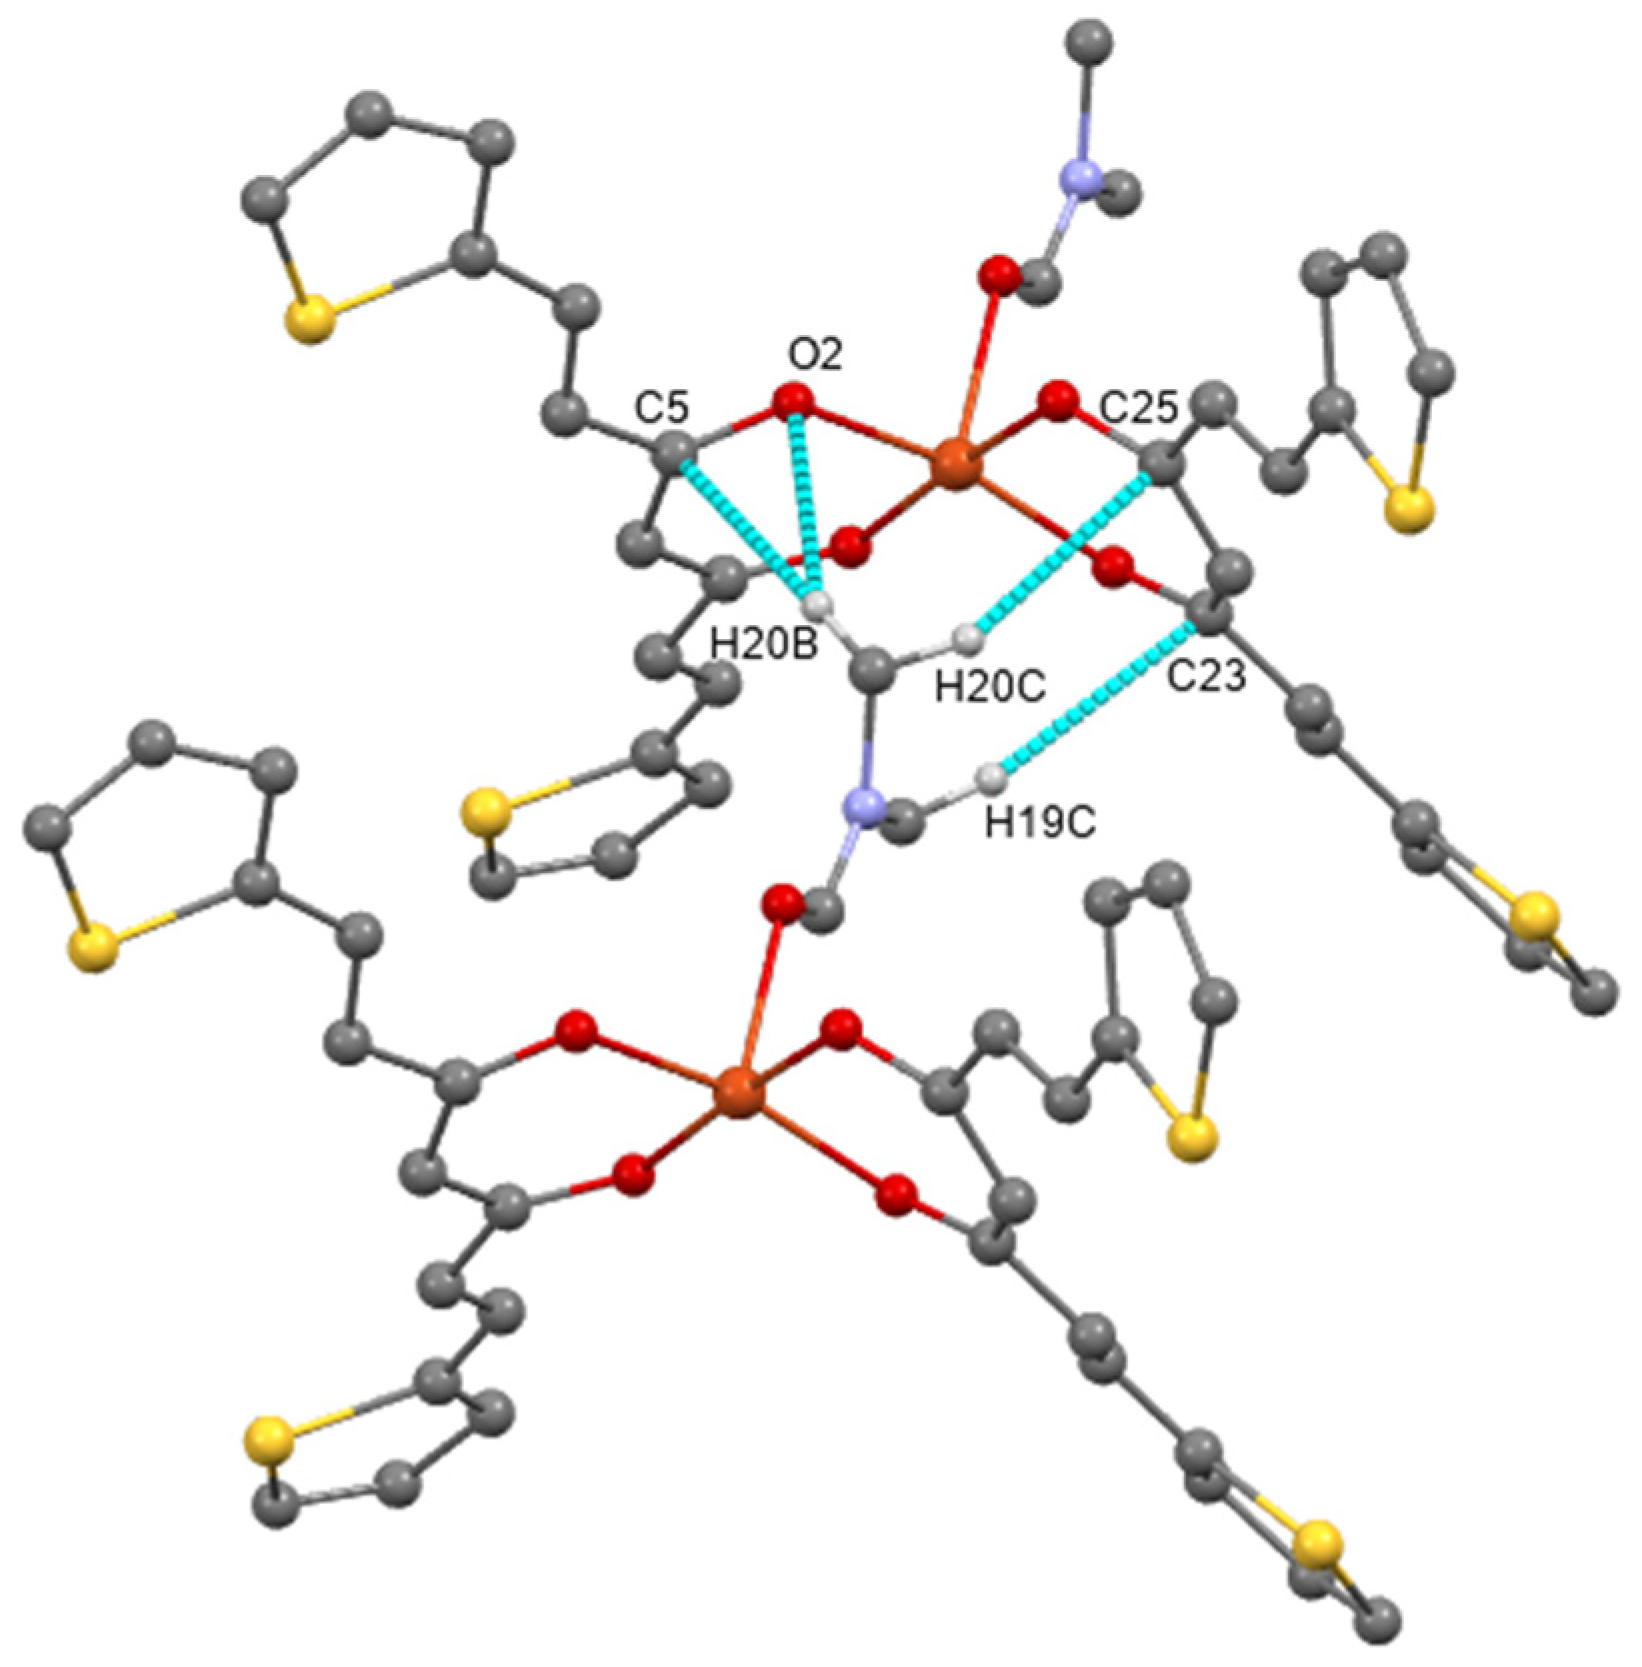
2.4. Single Crystal X-ray Diffraction
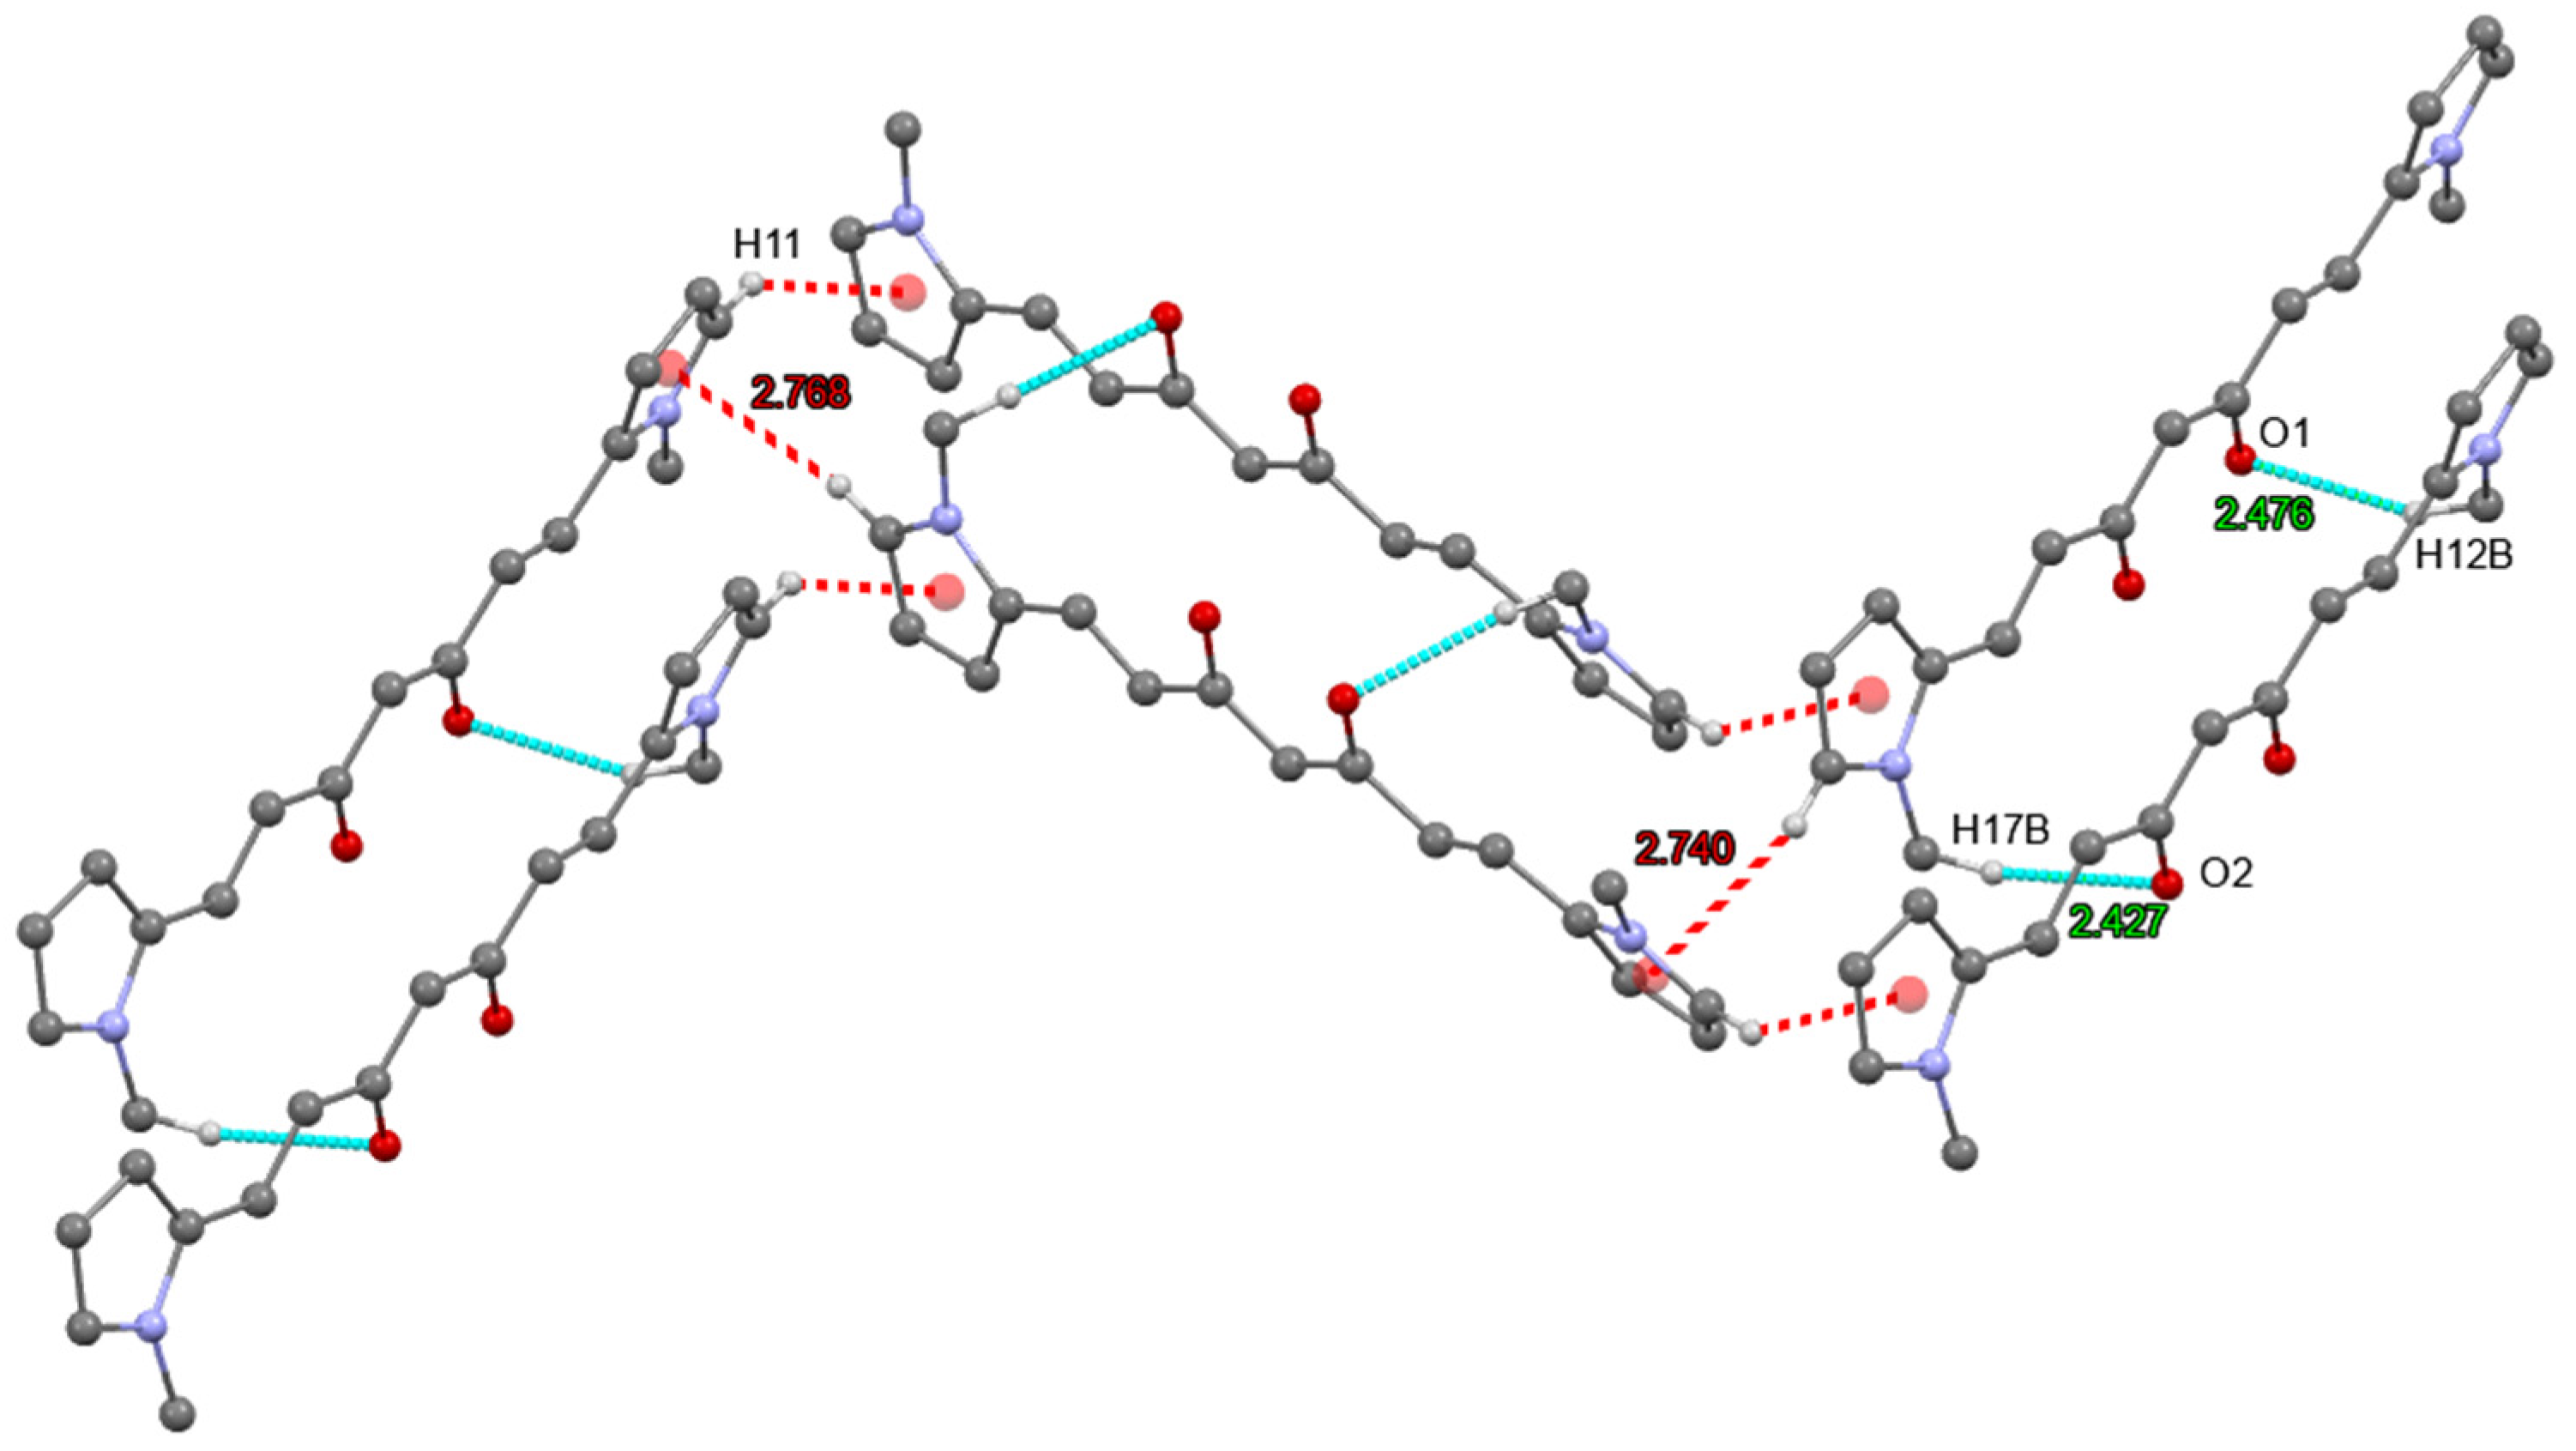
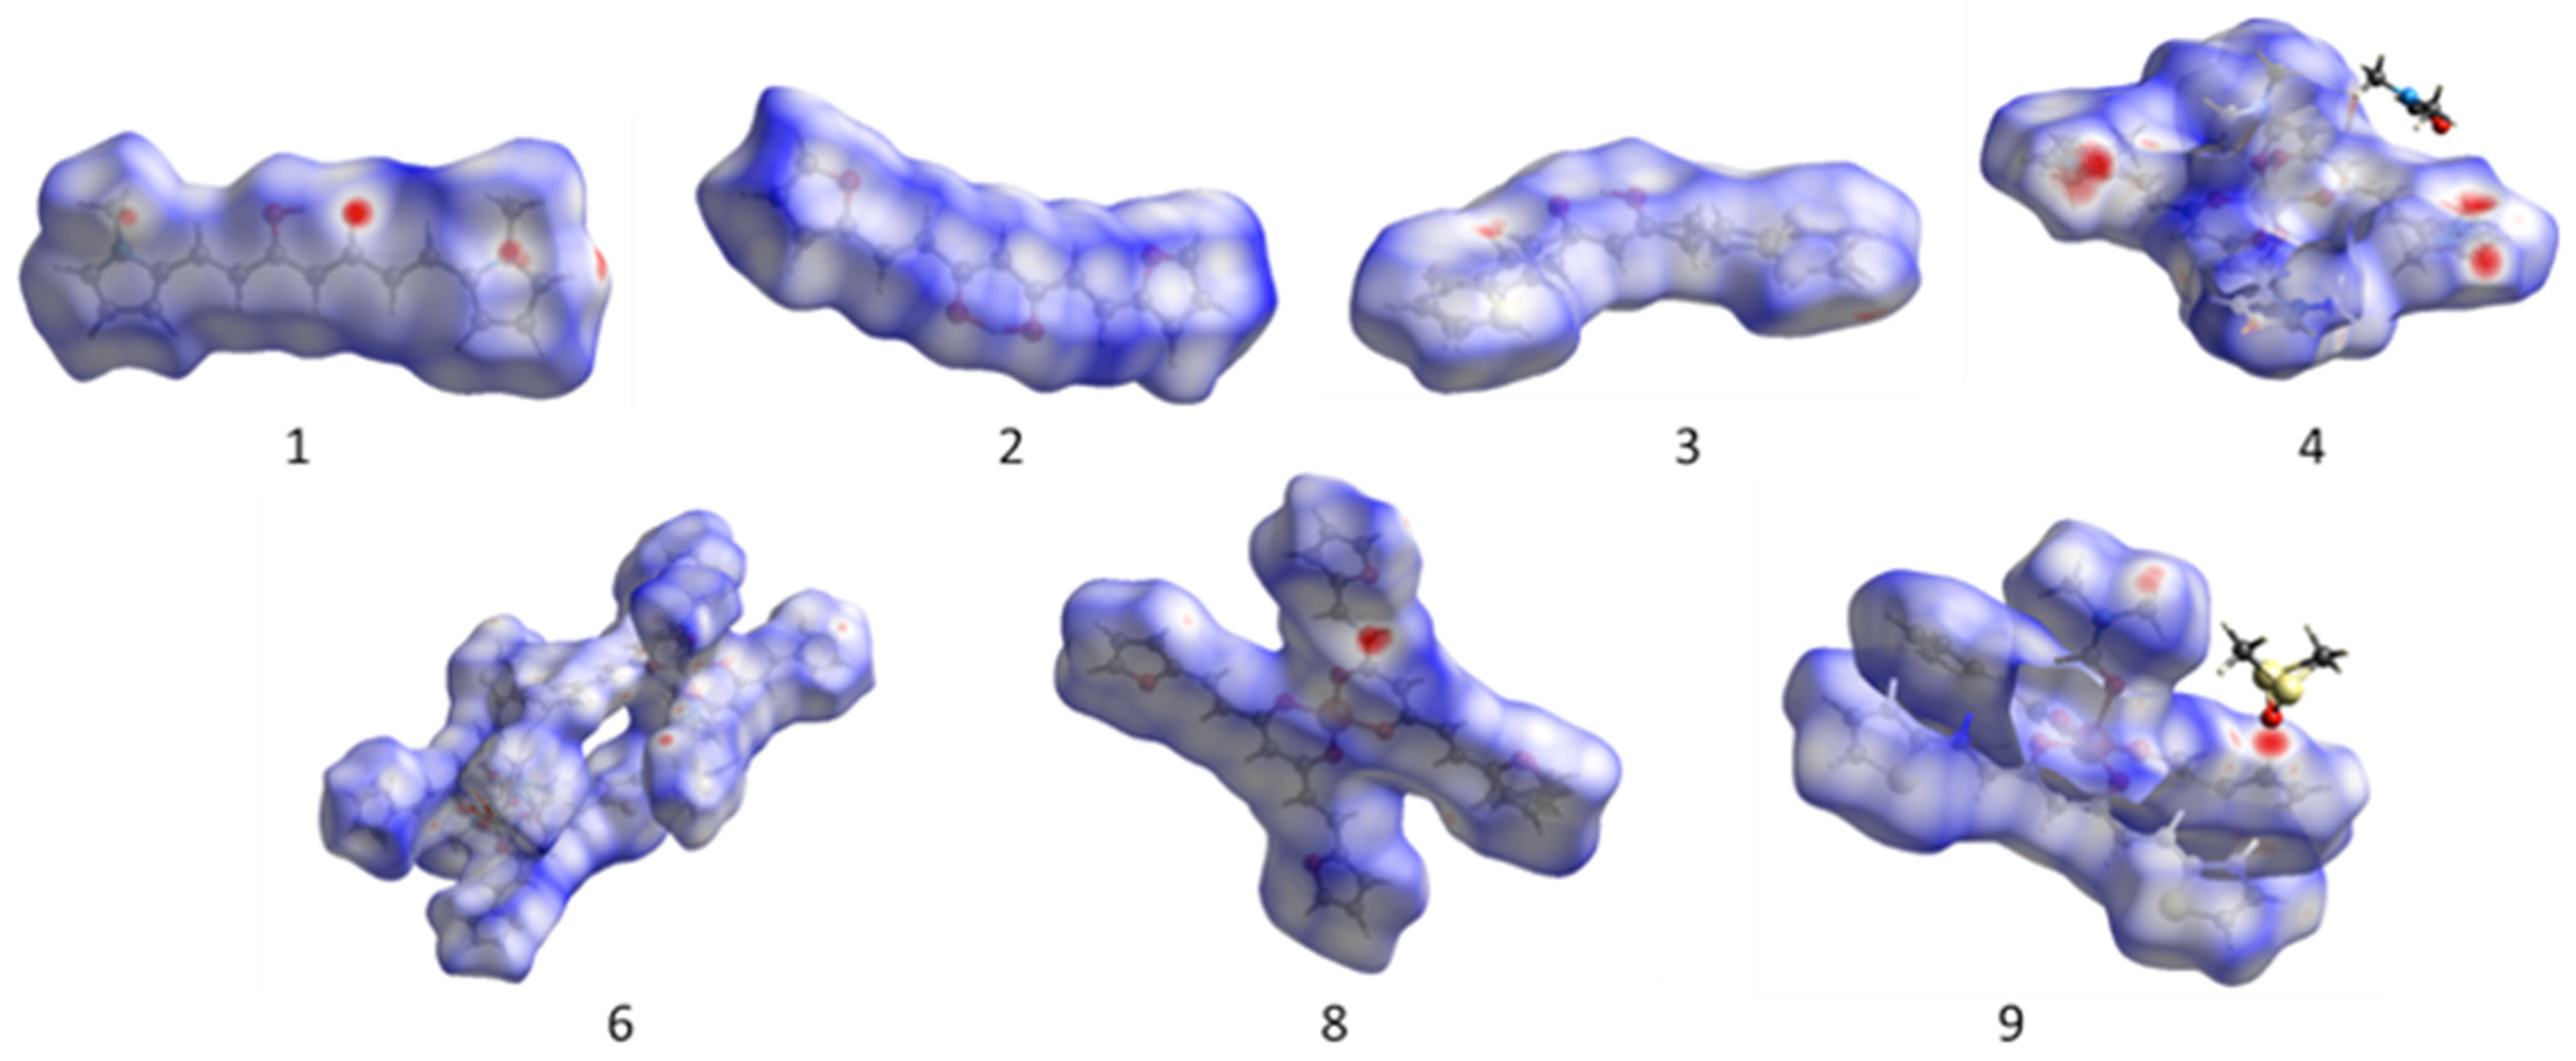
2.5. Analysis of Non-Covalent Interactions
2.6. Hirshfeld Surfaces
2.7. Inhibition of Lipoperoxidation (LP) in Rat Brain Homogenate
2.8. Cytotoxic Activity
3. Materials and Methods
3.1. Physical Measurements
3.2. Spectroscopic Determinations
3.3. Inhibition of Lipid Peroxidation on Rat Brain
3.3.1. Animal
3.3.2. Rat Brain Homogenate Preparation
3.3.3. Induction of Lipid Peroxidation and Thiobarbituric Acid Reactive Substances (TBARS) Quantification
3.4. Cytotoxic Activity in Human Tumor Cells
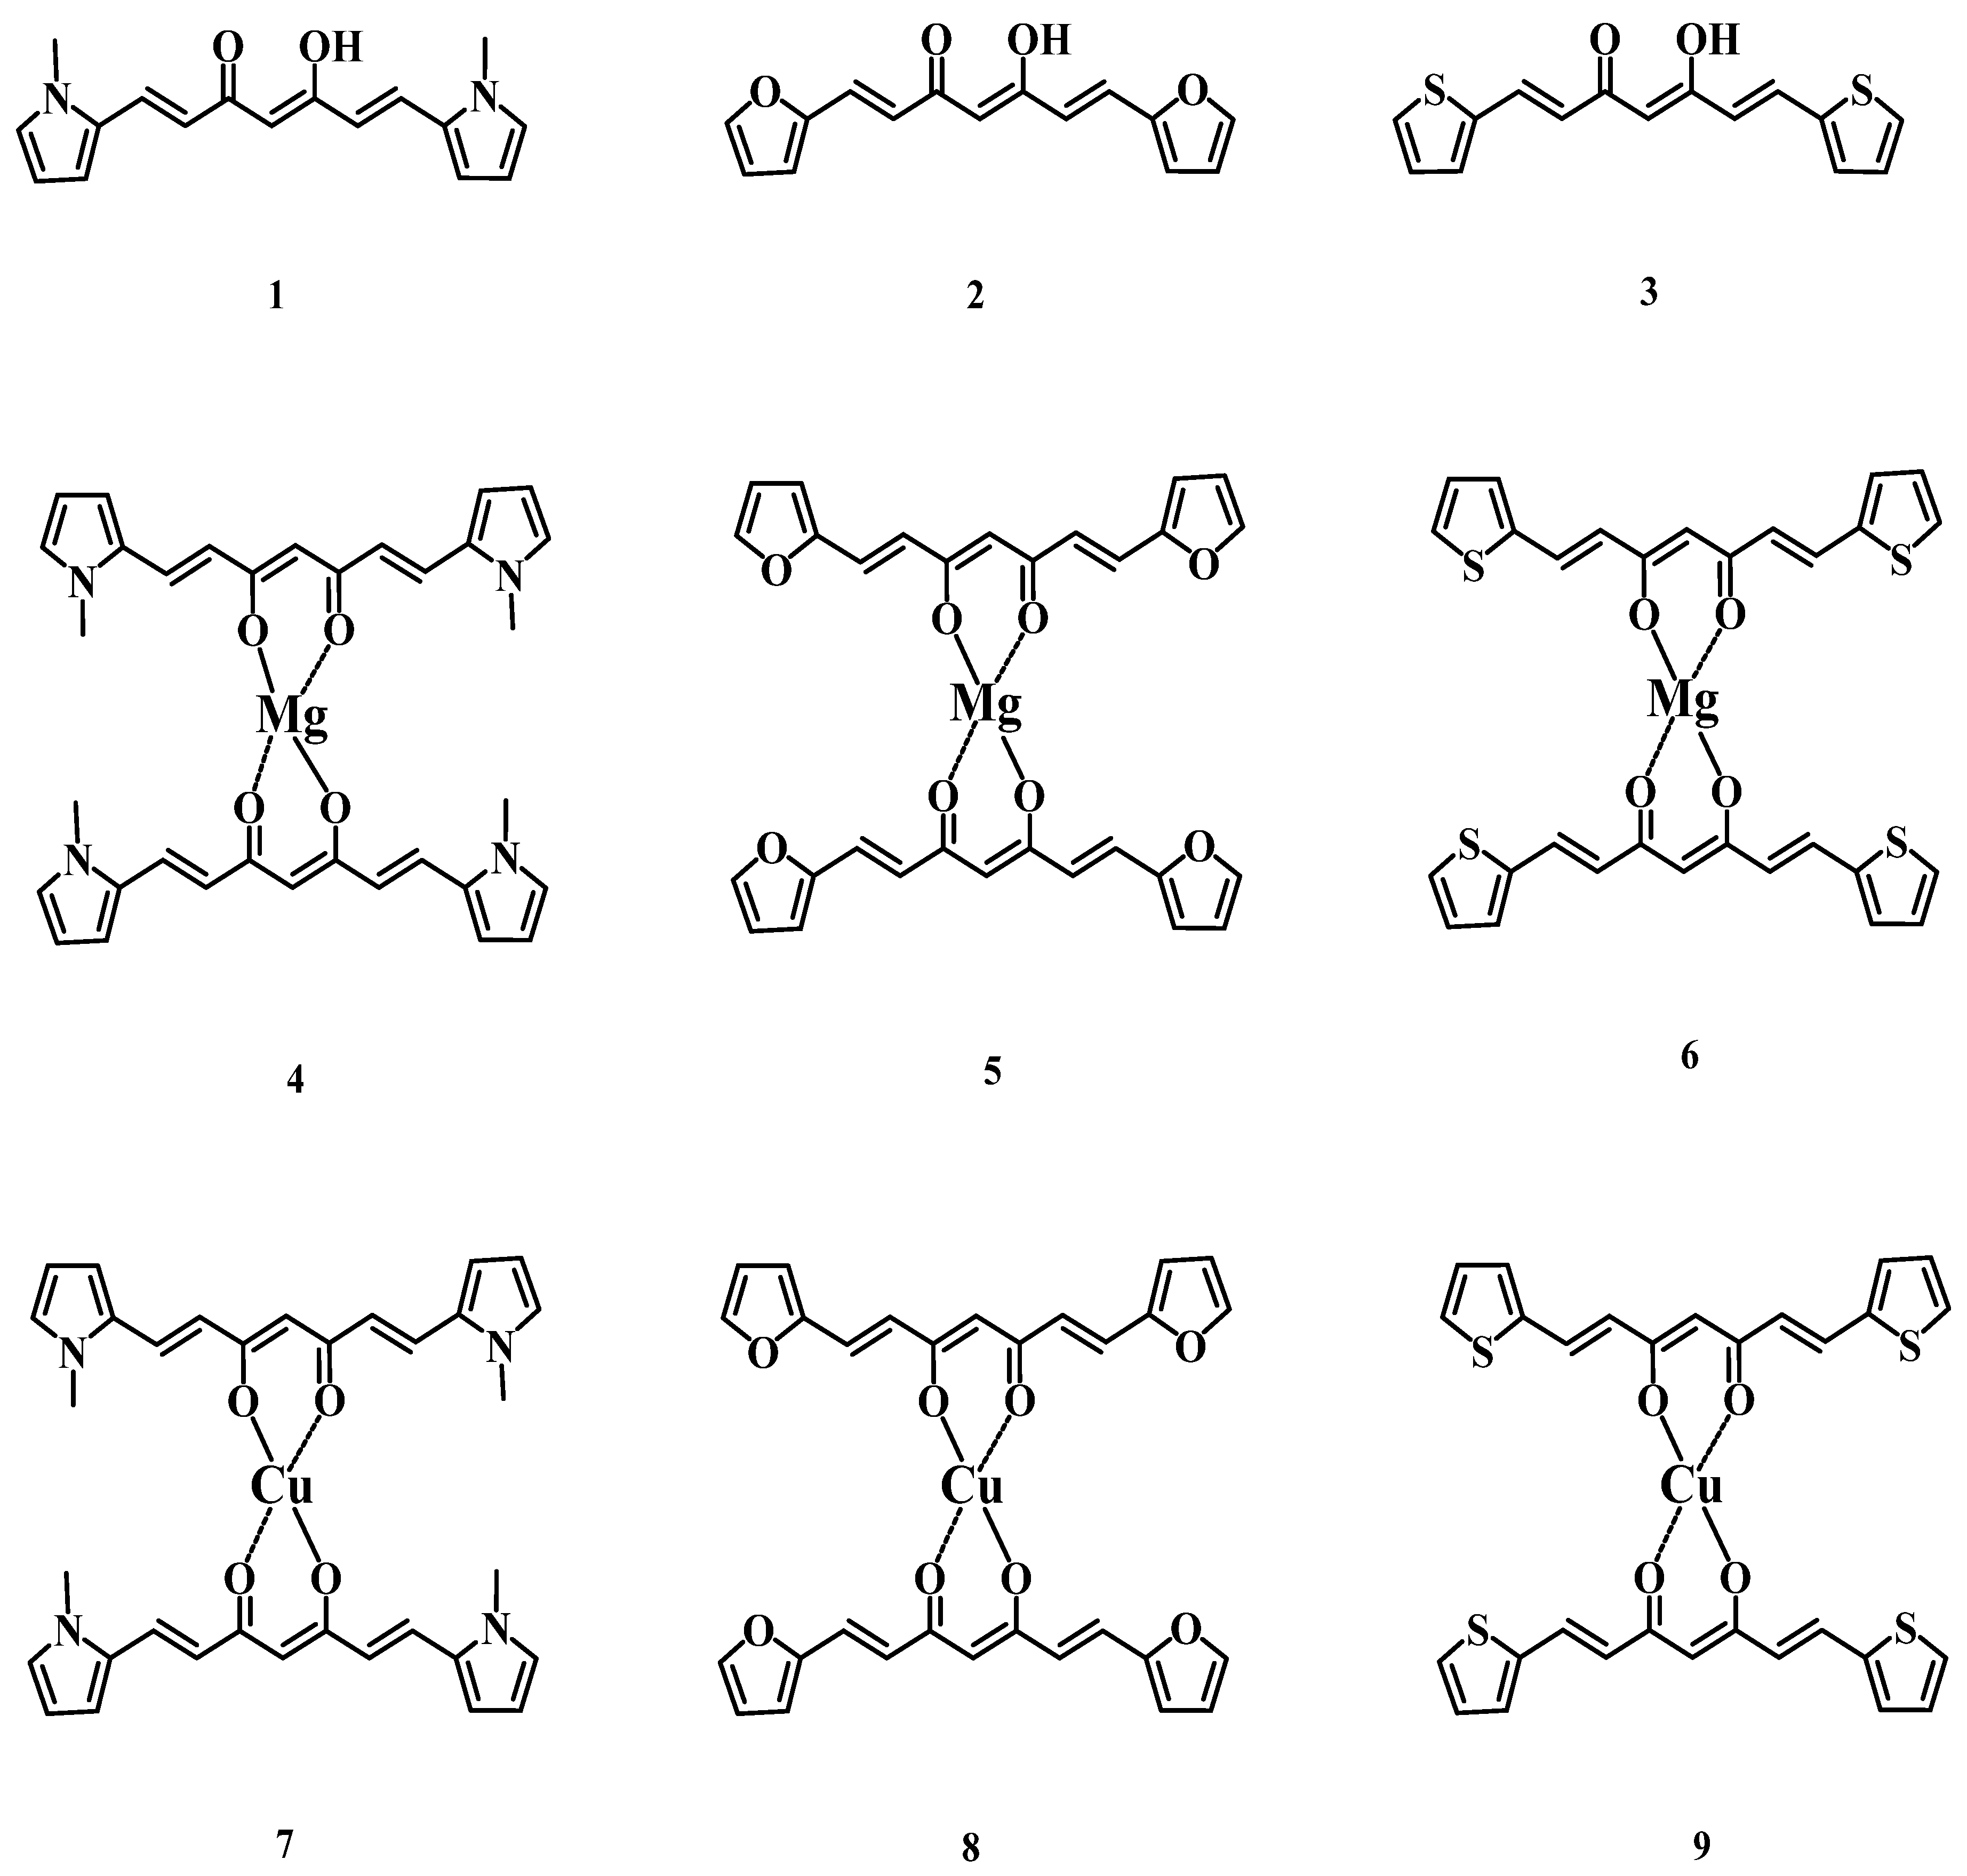
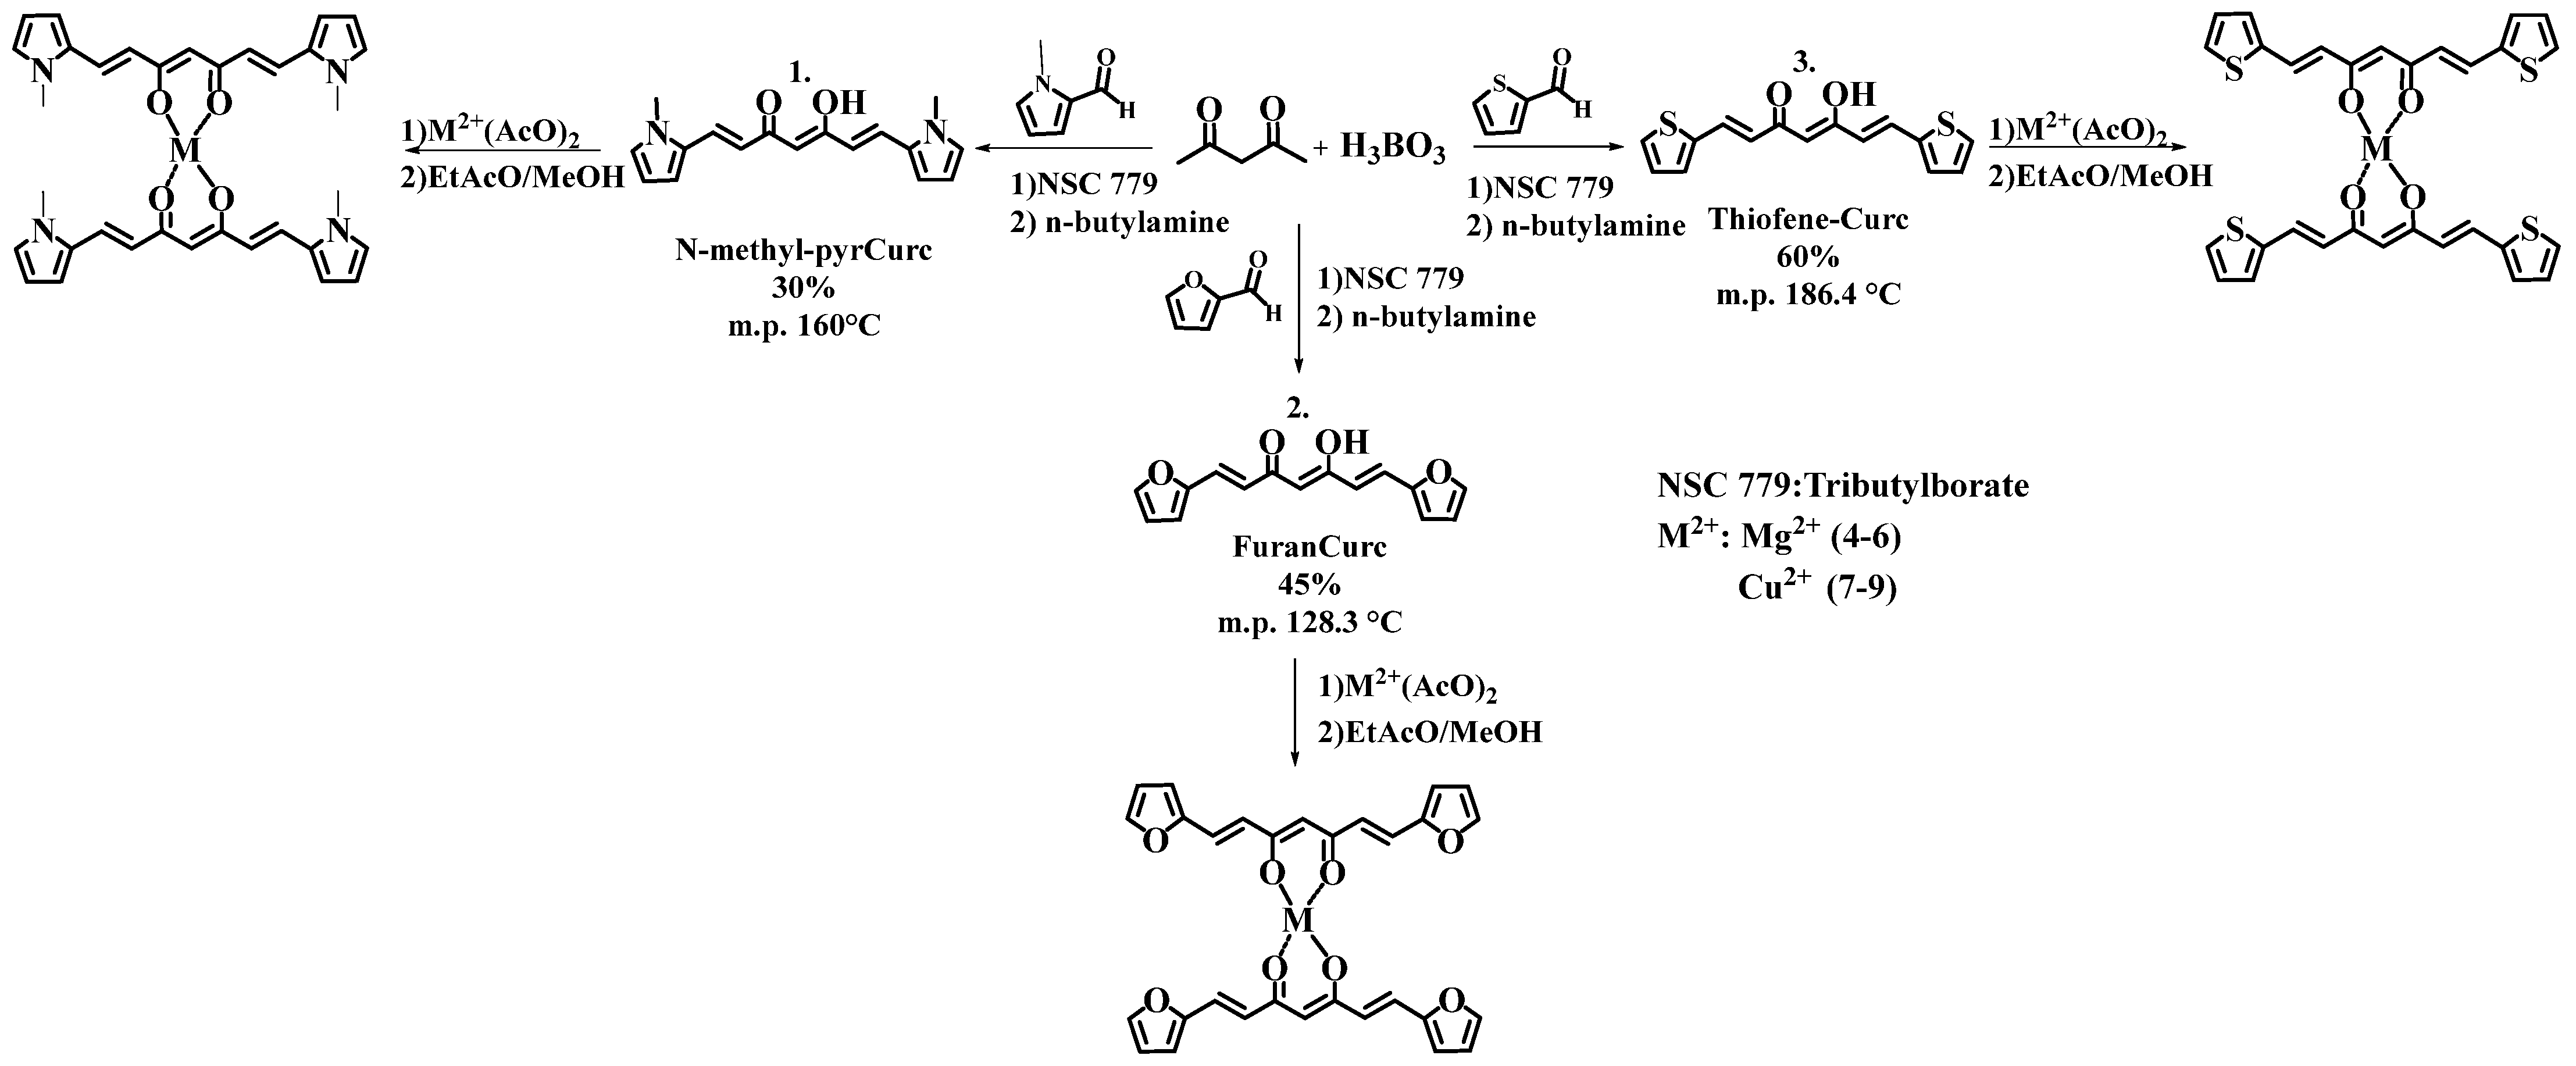
3.5. Synthesis of Compounds
4. Conclusions
Supplementary Materials
Author Contributions
Funding
Institutional Review Board Statement
Informed Consent Statement
Data Availability Statement
Acknowledgments
Conflicts of Interest
Sample Availability
References
- Wanninger, S.; Lorenz, V.; Subhan, A.; Edelmann, F.T. Metal complexes of curcumin—Synthetic strategies, structures and medicinal applications. Chem. Soc. Rev. 2015, 44, 4986–5002. [Google Scholar] [CrossRef] [PubMed]
- Goel, A.; Kunnumakkara, A.B.; Aggarwal, B.B. Curcumin as “Curecumin”: From kitchen to clinic. Biochem. Pharmacol. 2008, 75, 787–809. [Google Scholar] [CrossRef] [PubMed]
- Naksuriya, O.; Okonogi, S.; Schiffelers, R.M.; Hennink, W.E. Curcumin nanoformulations: A review of pharmaceutical properties and preclinical studies and clinical data related to cancer treatment. Biomaterials 2014, 35, 3365–3383. [Google Scholar] [CrossRef] [PubMed]
- Ghosh, S.; Banerjee, S.; Sil, P.C. The beneficial role of curcumin on inflammation, diabetes and neurodegenerative disease: A recent update. Food Chem. Toxicol. 2015, 83, 111–124. [Google Scholar] [CrossRef]
- Sarkar, T.; Butcher, R.J.; Banerjee, S.; Mukherjee, S.; Hussain, A. Visible light-induced cytotoxicity of a dinuclear iron(III) complex of curcumin with low-micromolar IC50 value in cancer cells Dedicated to Professor Animesh Chakravorty on his 80th birthday. Inorganica Chim. Acta 2016, 439, 8–17. [Google Scholar] [CrossRef]
- Tajbakhsh, S.; Mohammadi, K.; Deilami, I.; Zandi, K.; Ramedani, E.; Asayesh, G. Antibacterial activity of indium curcumin and indium diacetylcurcumin. African J. Biotechnol. 2008, 21, 3832–3835. [Google Scholar]
- Vreese, R.D.; Grootaert, C.; Sander, D.; Theppawong, A.; Van Damme, S.; Van Bogaert, M.; Van Camp, J.; D’hooghe, M. Synthesis of novel curcuminoids accommodationg a central b-enaminone motif and their impact on cell growth and oxidative stress. Eur. J. Med. Chem. 2016, 123, 726–737. [Google Scholar] [CrossRef]
- Opa, V.; BoonChoong, P.; Watanabe, H.; Tohda, M.; Kummasud, N.; Sumanont, Y. Manganese complexes of curcumin and its derivatives: Evaluation for the radical scavenging ability and neuroprotective activity. Free Radic. Biol. Med. 2003, 12, 1632–1644. [Google Scholar]
- Aliaga-Alcalde, N.; Marqués-Gallego, P.; Kraaijkamp, M.; Herranz-Lancho, C.; Dulk, H.D.; Gorner, H.; Roubeau, O.; Teat, S.J.; Weyhermuler, T.; Reedijk, J. Copper curcuminoids containing anthracene groups: Fluorescent molecules with cytotoxic activity. Inorg. Chem. 2010, 20, 9655–9663. [Google Scholar] [CrossRef]
- Pucci, D.; Bellini, T.; Crispini, A.; D’Agnano, I.; Liguori, P.F.; Garcia-Orduña, P.; Pirillo, S.; Valentini, A.; Zanchetta, G. DNA binding and cytotoxicity of fluorescent curcumin-based Zn(II) complexes. Medchemcomm 2012, 4, 462–468. [Google Scholar] [CrossRef]
- Zhang, W.; Chen, C.; Shi, H.; Yang, M.; Liu, Y.; Ji, P.; Chen, H.; Tan, R.X.; Li, E. Curcumin is a biologically active copper chelator with antitumor activity. Phytomedicine 2016, 1, 1–8. [Google Scholar] [CrossRef] [PubMed]
- Meza-Morales, W.; Estévez-Carmona, M.M.; Álvarez-Ricardo, Y.; Obregón-Mendoza, M.A.; Cassani, J.; Ramírez-Apan, M.T.; Escobedo-Martínez, C.; Soriano-García, M.; Reynolds, W.F.; Enríquez, R.G. Full structural characterization of homoleptic complexes of diacetylcurcumin with Mg, Zn, Cu, and Mn: Cisplatin-level Cytotoxicity in Vitro with Minimal Acute Toxicity in Vivo. Molecules 2019, 8, 1598. [Google Scholar] [CrossRef] [PubMed] [Green Version]
- Meza-Morales, W.; Machado-Rodríguez, J.C.; Álvarez-Ricardo, Y.; Obregón-Mendoza, M.A.; Nieto-Camacho, A.; Toscano, R.A.; Soriano-García, M.; Cassani, J.; Enríquez, R.G. A new family of homoleptic copper complexes of curcuminoids: Synthesis, characterization and biological properties. Molecules 2019, 5, 910. [Google Scholar] [CrossRef] [PubMed]
- Theppawong, A.; Van de Walle, T.; Grootaert, C.; Bultinck, M.; Desmet, T.; Van Camp, J.; D’hooghe, M. Synthesis of Novel Aza-aromatic Curcuminoids with Improved Biological Activities towards Various Cancer Cell Lines. ChemistryOpen 2018, 5, 381–392. [Google Scholar] [CrossRef] [PubMed]
- Qiu, X.; Liu, Z.; Shao, W.Y.; Liu, X.; Jing, D.P.; Yu, Y.J.; An, L.K.; Huang, S.L.; Bu, X.Z.; Huang, Z.S.; et al. Synthesis and evaluation of curcumin analogues as potential thioredoxin reductase inhibitors. Bioorganic Med. Chem. 2008, 16, 8035–8041. [Google Scholar] [CrossRef]
- Ahmed, M.M.; Khan, M.A.; Rainsford, K.D. Synthesis of Thiophene and NO-Curcuminoids for anti-inflammatory and Anti-Cancer Activities. Molecules 2013, 2, 1483–1501. [Google Scholar] [CrossRef]
- Rajesh, J.; Gubendran, A.; Rajagopal, G.; Athappan, P. Synthesis, spectra and DNA interactions of certain mononuclear transition metal(II) complexes of macrocyclic tetraaza diacetyl curcumin ligand. J. Mol. Struct. 2012, 1010, 169–178. [Google Scholar] [CrossRef]
- Zhao, X.Z.; Jiang, T.; Wang, L.; Yang, H.; Zhang, S.; Zhou, P. Interaction of curcumin with Zn(II) and Cu(II) ions based on experiment and theoretical calculation. J. Mol. Struct. 2010, 984, 316–325. [Google Scholar] [CrossRef]
- Attanasio, E.; Collamati, I.; Ercolani, C. Ligand arragement in tetragonally CuO4N and CuO4N2 chromophores formed from copper (II) a-nitroketonates and sterically hindered N-bases. J.Chem. Soc. Dalton Trans. 1974, 2442–2448. [Google Scholar]
- Garribba, E.; Micera, G. The Determination of the Geometry of Cu (II) Complexes an EPR Spectroscopy Experiment. J. Chem. Educ. 2006, 83, 1229–1232. [Google Scholar] [CrossRef]
- Rajagopal, G.; Prasanna, N.; Athappan, P. Copper(II) and ruthenium(II)/(III) Schiff base complexes. Trans. Metal Chem. 1999, 24, 251–257. [Google Scholar] [CrossRef]
- Goto, H.; Osawa, E. Corner flapping: A simple and fast algorithm exhaustive generation of ring conformations. J. Am. Chem. Soc. 1989, 111, 8950–8951. [Google Scholar] [CrossRef]
- Goto, H.; Osawa, E. An efficient algorithm for searching low-energy conformers of cyclic and acyclic molecules. J. Chem. Soc. Perkin Trans. 1993, 4, 187–198. [Google Scholar] [CrossRef]
- Addison, A.W.; Rao, T.N.; Reedijk, J.; van Rijn, J.; Verschoor, G.C. Synthesis, structure, and spectroscopic properties of copper(II) compounds containing nitrogen–sulphur donor ligands; the crystal and molecular structure of aqua[1,7-bis(N-methylbenzimidazol-2′-yl)-2,6-[dithiaheptane] copper(II) perchlorate. J. Chem. Soc. Dalton Trans. 1984, 17, 1349–1356. [Google Scholar] [CrossRef]
- Nishio, M.; Umezawa, Y.; Honda, K.; Tsuboyama, S.; Suezawa, H. CH/π hydrogen bonds in organic and organometallic chemistry. CrystEngComm 2009, 11, 1757–1788. [Google Scholar] [CrossRef]
- Gautam, R.; Desiraju, D. The C-H···O Hydrogen Bond: Structural Implications and Supramolecular Design. Acc. Chem. Res. 1996, 29, 441–449. [Google Scholar]
- Spackman, M.A.; McKinnon, J.J.; Jayatilaka, D. Hirshfeld surface analysis. CrystEngCom 2009, 11, 19–32. [Google Scholar] [CrossRef]
- Parkin, A.; Barr, G.; Dong, W.; Gilmore, C.J.; Jayatilaka, D.; McKinnon, J.J.; Spackman, M.A.; Wilson, C.C. Comparing entire crystal structures: Structural genetic fingerprinting. CrystEngComm 2007, 9, 648–652. [Google Scholar] [CrossRef]
- Spackman, P.R.; Turner, M.J.; McKinnon, J.J.; Wolff, S.K.; Grimwood, D.J.; Jayatilaka, D.; Spackman, M.A. CrystalExplorer: A program for Hirshfeld surface analysis, visualization and quantitative analysis of molecular crystals. J. Appl. Cryst. 2021, 54, 1006–1011. [Google Scholar] [CrossRef]
- Barik, A.; Mishra, B.; Kunwar, A.; Kadam, R.M.; Shen, L. Comparative study of copper (II) e curcumin complexes as superoxide dismutase mimics and free radical scavengers. Eur. J. Med. Chem. 2007, 42, 431–439. [Google Scholar] [CrossRef]
- Li, Y.; Gu, Z.; Zhang, C.; Li, S.; Zhang, L.; Zhou, G. Synthesis, characterization and ROS-mediated antitumor effects of palladium(II) complexes of curcuminoids. Eur. J. Med. Chem. 2018, 144, 662–671. [Google Scholar] [CrossRef] [PubMed]
- Armarego, W.L.E.; Chai, L. Purification of Fifth Edition. Butterworth-Heinemann: Oxford, UK, 2003; ISBN 9780750675710. [Google Scholar] [CrossRef]
- Sheldrick, G.M. A short history of SHELX. Acta Crystallogr. Sect. A Found. Crystallogr. 2008, 64, 112–122. [Google Scholar] [CrossRef] [PubMed]
- Domínguez, M.; Nieto, A.; Marin, J.C.; Keck, A.S.; Jeffery, E.; Céspedes, C.L. Antioxidant Activities of Extracts from Barkleyanthus salicifolius (Asteraceae) and Penstemon gentianoides. J. Agric. Food Chem. 2005, 15, 5889–5895. [Google Scholar] [CrossRef] [PubMed]
- Rossato, J.I.; Ketzer, L.A.; Centurião, F.B.; Silva, S.J.N.; Ludtke, D.S.; Zeni, G.; Braga, A.L.; Rubin, M.A.; Rocha, J.B.T. Antioxidant Properties of New Chalcogenides Against Lipid Peroxidation in Rat Brain. Neurochem. Res. 2002, 4, 297–303. [Google Scholar] [CrossRef] [PubMed]
- Lowry, O.H.; Rosebrough, N.J.; Farr, A.L.; Randall, R.J. Protein measurement with the folin phenol reagent. J. Biol. Chem. 1951, 1, 265–275. [Google Scholar] [CrossRef]
- Ng, T.B.; Liu, F.; Wang, Z.T. Antioxidative activity of natural products from plants. Life Sci. 2000, 66, 709–723. [Google Scholar] [CrossRef]
- Ohkawa, H.; Ohishi, N.; Yagi, K. Assay for Lipid Peroxides in Animal Tissues Thiobarbituric Acid Reaction. Anal. Biochem. 1979, 358, 351–358. [Google Scholar] [CrossRef]
- Monks, A.; Scudiero, D.; Skehan, P.; Shoemaker, R.; Paull, K.; Vistica, D.; Hose, C.; Langley, L.; Cronise, P.; Vaigro-Wolff, A. Feasibility of a high-flux anticancer drug screen using a diverse panel of cultured human tumor cell lines. J. Natl. Cancer Inst. 1991, 83, 757–766. [Google Scholar] [CrossRef]
- Meerloo, J.V.; Kaspers, G.J.L.; Cloos, J. Cell Culture: Cell sensitivity assays: The MTT assay. Methods Mol. Biol. 2011, 731, 237–245. [Google Scholar] [CrossRef]
- Concepción Lozada, M.; Soria-Arteche, O.; Ramírez Apan, M.T.; Nieto-Camacho, A.; Enríquez, R.G.; Izquierdo, T.; Jiménez-Corona, A. Synthesis, cytotoxic and antioxidant evaluations of amino derivatives from perezone. Bioorganic Med. Chem. 2012, 20, 5077–5084. [Google Scholar] [CrossRef]


| Compounds | Keto-Enol (cm−1) | -CH=C- (cm−1) | C-H Stretch (cm−1) | C-H Bending (cm−1) | Vibrations M-O (cm−1) |
|---|---|---|---|---|---|
| N-methyl-pyrCurc | 1696 and 1605 | 948 | 2921–2875 | - | - |
| FuranCurc | 1698 and 1623 | 957 | 3124 | - | - |
| ThiopheneCurc | 1609 | 960 | - | - | - |
| N-methyl-pyrCurc-Mg | 1620 | 962 | 2942 | - | 1508 and 446 |
| FuranCurc-Mg | 1630 | 958 | - | - | 1519 and 500 |
| ThiopheneCurc-Mg | 1600 | 956 | 3018 | - | 1497 and 476 |
| N-methyl-pyrCurc-Cu | 1707 and 1684 | 957 | 2977–2929 | - | 1500 and 421 |
| FuranCurc-Cu | 1731 and 1623 | 961 | 3137–3109 | - | 1503 and 418 |
| ThiopheneCurc-Cu | 1673 and 1613 | 953 | 3102–2843 | - | 1502 and 484 |
| Compound | OH (δ) | Methine (δ) | α to the Diketone (δ) | β to the Diketone (δ) | Methyl (δ) | Aromatic (δ) |
|---|---|---|---|---|---|---|
| N-methyl-pyrCurc | 16.66 | 5.96 | 6.49 | 7.52 | 3.72 | 6.15–7.03 |
| FuranCurc | 16.06 | 6.20 | 6.57 | 7.46 | - | 6.66–7.88 |
| ThiopheneCurc | 16.07 | 6.19 | 6.57 | 7.82 | - | 7.18–7.75 |
| N-methyl-pyrCurc-Mg | - | 5.43 | 6.42 | 7.36 | 3.65 | 6.06–6.88 |
| FuranCurc-Mg | - | 5.55 | 6.51 | 7.19 | - | 6.58–7.75 |
| ThiopheneCurc-Mg | - | 5.58 | 6.48 | 7.54 | - | 7.10–7.58 |
| Complexes | g‖ | g┴ | A‖ (10−4 cm−1) | A┴ (10−4 cm−1) | g‖/A‖ (cm−1) |
|---|---|---|---|---|---|
| N-methyl-pyrCurc-Cu | 2.29 | 2.06 | 16.5 | 1.9 | 138.8 |
| FuranCurc-Cu | 2.30 | 2.06 | 16.2 | 1.3 | 141.2 |
| ThiopheneCurc-Cu | 2.30 | 2.06 | 15.9 | 1.1 | 146.0 |
| Compound | 1a | 1b | 2 | 3 | 4 | 6 | 8 | 9 |
|---|---|---|---|---|---|---|---|---|
| Empirical formula | C17 H18 N2 O2 | C17 H18 N2 O2 | C15 H12 O4 | C15 H12 O2 S2 | C46 H62 Mg N8 O8 | C36 H36 Mg N2 O6 S4 | C30 H22 Cu O8 | C68 H64 Cu2 N2 O11 S9 |
| Formula weight | 282.33 | 282.33 | 256.25 | 288.37 | 879.34 | 745.22 | 574.01 | 1500.83 |
| Temperature, K | 150 (2) | 298 (2) | 100 (2) | 298 (2) | 150 (2) | 298 (2) | 298 (2) | 100 (2) |
| Wavelength, Å | 0.71073 | 1.54178 | 0.71073 | 0.71073 | 0.71073 | 0.71073 | 0.71073 | 0.71073 |
| Crystal system | Monoclinic | Monoclinic | Orthorhombic | Trigonal | Monoclinic | Triclinic | Monoclinic | Monoclinic |
| Space group | P 21/c | P 21/c | P b c a | R-3c | P 21/n | P-1 | P 21/c | C 2/c |
| a, Å | 15.569 (4) | 5.3583 (5) | 13.6597 (7) | 14.6851 (8) | 14.1600 (6) | 16.443 (4) | 9.7687 (5) | 24.315 (4) |
| b, Å | 5.2794 (11) | 23.644 (2) | 5.3390 (3) | 14.6851 (8) | 8.2794 (3) | 16.545 (4) | 12.2654 (7) | 8.4402 (11) |
| c, Å | 17.787 (4) | 12.0857 (12) | 33.3961 (18) | 66.215 (4) | 20.9371 (8) | 16.769 (4) | 22.2667 (13) | 34.353 (5) |
| α ° | 90 | 90 | 90 | 90 | 90 | 118.636 (6) | 90 | 90 |
| β, ° | 90.325 (6) | 99.852 (7) | 90 | 90 | 102.936 (1) | 95.528 (7) | 101.275 (2) | 110.675 (6) |
| γ, ° | 90 | 90 | 90 | 120 | 90 | 99.686 (6) | 90 | 90 |
| Volume, Å3 | 1461.9 (5) | 1508.5 (2) | 2435.5 (2) | 12366.2 (15) | 2392.29 (16) | 3863.3 (17) | 2616.4 (3) | 6596.0 (16) |
| Z | 4 | 4 | 8 | 36 | 2 | 4 | 4 | 4 |
| Dcalc, Mg/m3) | 1.283 | 1.243 | 1.398 | 1.394 | 1.221 | 1.281 | 1.457 | 1.511 |
| Absorption coefficient, mm−1 | 0.085 | 0.661 | 0.102 | 0.381 | 0.096 | 0.307 | 0.887 | 0.993 |
| F (000) | 600 | 600 | 1072 | 5400 | 940 | 1560 | 1180 | 3104 |
| Crystal size, mm | 0.384 × 0.176 × 0.070 | 0.372 × 0.342 × 0.026 | 0.266 × 0.224 × 0.142 | 0.385 × 0.242 × 0.202 | 0.407 × 0.291 × 0.218 | 0.296 × 0.213 × 0.148 | 0.417 × 0.290 × 0.118 | 0.416 × 0.172 × 0.020 |
| θ range for data collection, ° | 2.290 to 26.367 | 3.739 to 72.094 | 2.439 to 29.573 | 2.924 to 25.675 | 2.655 to 29.130 | 2.157 to 27.103 | 2.497 to 27.102 | 2.533 to 28.699 |
| Index ranges | −17 ≤ h ≤ 19, −6 ≤ k ≤ 6, −22 ≤ l ≤ 22 | −6 ≤ h ≤ 5, −29 ≤ k ≤ 29, −14 ≤ l ≤ 14 | −18 ≤ h ≤ 18, −7 ≤ k ≤ 7, −46 ≤ l ≤ 46 | −15 ≤ h ≤ 17, −17 ≤ k ≤ 17, −80 ≤ l ≤ 80 | −17 ≤ h ≤ 19, −11 ≤ k ≤ 11, −28 ≤ l ≤ 24 | −21 ≤ h ≤ 21, −21 ≤ k ≤ 21, −21 ≤ l ≤ 21 | −10 ≤ h ≤ 12, −15 ≤ k ≤ 15,−28 ≤ l ≤ 28 | −32 ≤ h ≤ 32, −11 ≤ k ≤ 11,−46 ≤ l ≤ 46 |
| Reflections collected | 9864 | 17,960 | 27,981 | 45,772 | 26,658 | 84,301 | 45,719 | 74,767 |
| Independent reflections | 2987 [R (int) = 0.0917] | 2924 [R (int) = 0.0991] | 3415 [R (int) = 0.0992] | 2610 [R (int) = 0.1000] | 6432 [R (int) = 0.0586] | 17012 [R (int) = 0.0695] | 5766 [R (int) = 0.0947] | 8512 [R (int) = 0.1389] |
| Completeness | 99.2%, to θ = 25.242° | 98.3%, to θ = 67.679° | 99.8%, to θ = 25.242° | 99.5%, to θ = 25.242° | 99.6%, to θ = 25.242° | 99.9%, to θ = 25.242° | 99.8%, to θ = 25.242° | 99.8%, to θ = 25.242° |
| Max. and min. transmission, e.Å−3 | 0.7457 and 0.6371 | 0.7541 and 0.4853 | 0.7460 and 0.7005 | 0.7457 and 0.6830 | 0.7460 and 0.6911 | 0.7460 and 0.7045 | 0.7457 and 0.6429 | 0.7458 and 0.6069 |
| Data/restraints/parameters | 2987/0/195 | 2924/1/195 | 3415/0/175 | 2610/795/302 | 6432/264/342 | 17012/3009/1126 | 5766/400/389 | 8512/0/424 |
| Goodness-of-fit on F2 | 1.035 | 1.030 | 1.034 | 1.025 | 1.036 | 1.015 | 1.001 | 1.066 |
| Final R indices [I > 2σ (I)] | R1 = 0.0817, wR2 = 0.1854 | R1 = 0.0626, wR2 = 0.1520 | R1 = 0.0633, wR2 = 0.1332 | R1 = 0.0591, wR2 = 0.1359 | R1 = 0.0578, wR2 = 0.1268 | R1 = 0.0618, wR2 = 0.1468 | R1 = 0.0550, wR2 = 0.1124 | R1 = 0.0627, wR2 = 0.1084 |
| R indices (all data) | R1 = 0.1590, wR2 = 0.2172 | R1 = 0.1189, wR2 = 0.1870 | R1 = 0.1202, wR2 = 0.1572 | R1 = 0.1209, wR2 = 0.1700 | R1 = 0.1161, wR2 = 0.1504 | R1 = 0.1619, wR2 = 0.1883 | R1 = 0.1388, wR2 = 0.1464 | R1 = 0.1062, wR2 = 0.1228 |
| Largest diff. peak and hole, e.Å−3 | 0.333 and −0.257 | 0.144 and −0.126 | 0.433 and −0.391 | 0.187 and −0.288 | 0.408 and −0.300 | 0.650 and −0.370 | 0.479 and −0.281 | 1.252 and −0.528 |
| Compound | Interaction | D-H···A (Å) | D···A (Å) | D-H-A (°) | Symmetry |
|---|---|---|---|---|---|
| 1a | C17-H17B···O2 | 2.427 | 3.385 | 165.65 | x, −1 + y, z |
| C12-H12B···O1 | 2.476 | 3.396 | 156.27 | x, −1 + y, z | |
| C11-H11···Cg1 | 2.768 | 3.586 | 144.76 | 1 − x, −1/2 + y, 1.5 − z | |
| C16-H16···Cg2 | 2.740 | 3.575 | 147.17 | −x, −1/2 + y, 1/2 − z | |
| 1b | C17-H17B···O2 | 2.456 | 3.369 | 158.73 | 1 + x, y, z |
| C12-H12B···O1 | 2.600 | 3.501 | 156.49 | 1 + x, y, z | |
| C11-H11···Cg3 | 2.942 | 3.746 | 145.61 | −x, −1/2 + y, 1/2 − z | |
| C16-H16···Cg4 | 2.805 | 3.638 | 149.59 | 1 − x, −1/2 + y, 1/2 − z | |
| 2 | C9-H9···O2 | 2.616 | 3.488 | 152.96 | 1 − x, −y, 1 − z |
| C13-H13···C12 | 2.839 | 3.643 | 142.98 | 1 − x, −1/2 + y, 1/2 − z | |
| 3 | C2H2···O1 | 2.670 | 3.373 | 132.85 | 1 − y, x − y, z |
| C1H1···S8 | 2.945 | 3.798 | 153.02 | 1 − y, x − y, z | |
| C10-H10···Cg5 | 2.679 | 3.565 | 159.45 | 1 − y, x − y, z | |
| 4 | C10-H10···C7 | 2.681 | 3.408 | 133.79 | 1/2 − x, −1/2 + y, 1.5−z |
| C2-H2···O4 | 2.593 | 3.541 | 175.26 | −1 + x, y, z | |
| C9-H9···O4 | 2.494 | 3.421 | 165.30 | −1 + x, y, z | |
| 6 | C56-H56···O62 | 2.590 | 3.315 | 135.17 | −x, 2-y, −z |
| C41H41···C58 | 2.751 | 3.474 | 135.18 | −x, 1-y, −z | |
| C61-H61···C58 | 2.730 | 3.368 | 126.55 | −x, 1-y, −z | |
| 8 | C35-H35···C21 | 2.874 | 3.602 | 152.49 | 2 − x, −1/2 + y, 1/2 − z |
| C35-H35···C22 | 2.742 | 3.723 | 154.17 | 2 − x, −1/2 + y, 1/2 − z | |
| C35-H35···C29 | 2.879 | 3.688 | 146.15 | 2 − x, −1/2 + y, 1/2 − z | |
| C35-H35···O28 | 2.687 | 3.480 | 143.70 | 2 − x, −1/2 + y, 1/2 − z | |
| 9 | C16-H16···O3 | 2.651 | 3.425 | 138.99 | 1/2 − x, 1/2 + y, 1/2 − z |
| C7-H7···C17 | 2.814 | 3.721 | 160.33 | 1/2 − x, 1/2 + y, 1/2 − z | |
| C4-H4···S28 | 2.914 | 3.812 | 158.09 | 1 − x, 2 − y, 1 − z | |
| C32-H32···C27 | 2.795 | 3.390 | 121.52 | 1.5 − x, 1.5 − y, 1 − z | |
| C20-H20B···O2 | 2.559 | 3.456 | 152.15 | x, 1 + y, z | |
| C20-H20B···C5 | 2.698 | 3.672 | 172.10 | x, 1 + y, z | |
| C19-H19C···C23 | 2.791 | 3.750 | 165.90 | x, 1 + y, z | |
| C20-H20C···C25 | 2.766 | 3.626 | 146.84 | x, 1 + y, z |
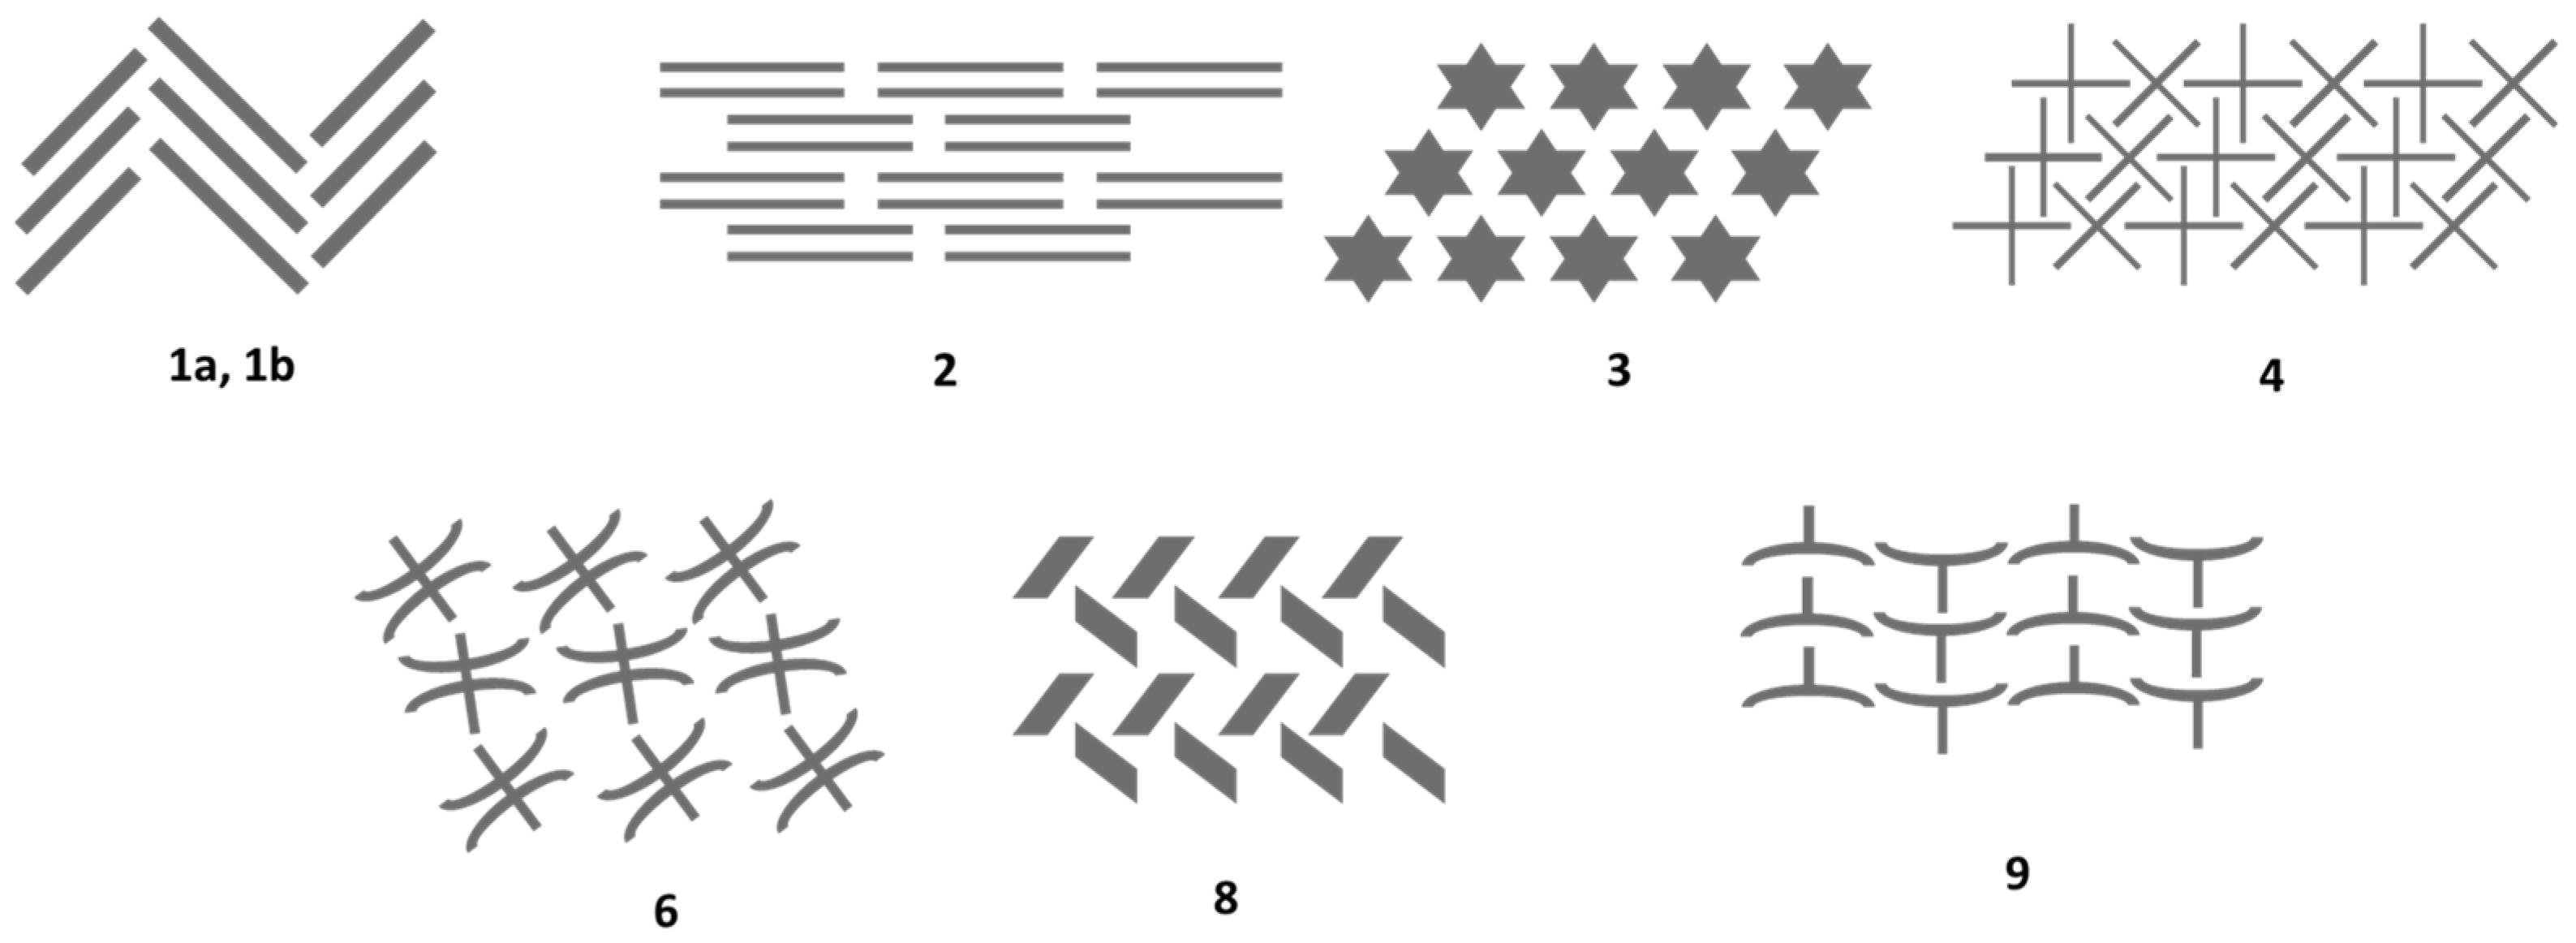
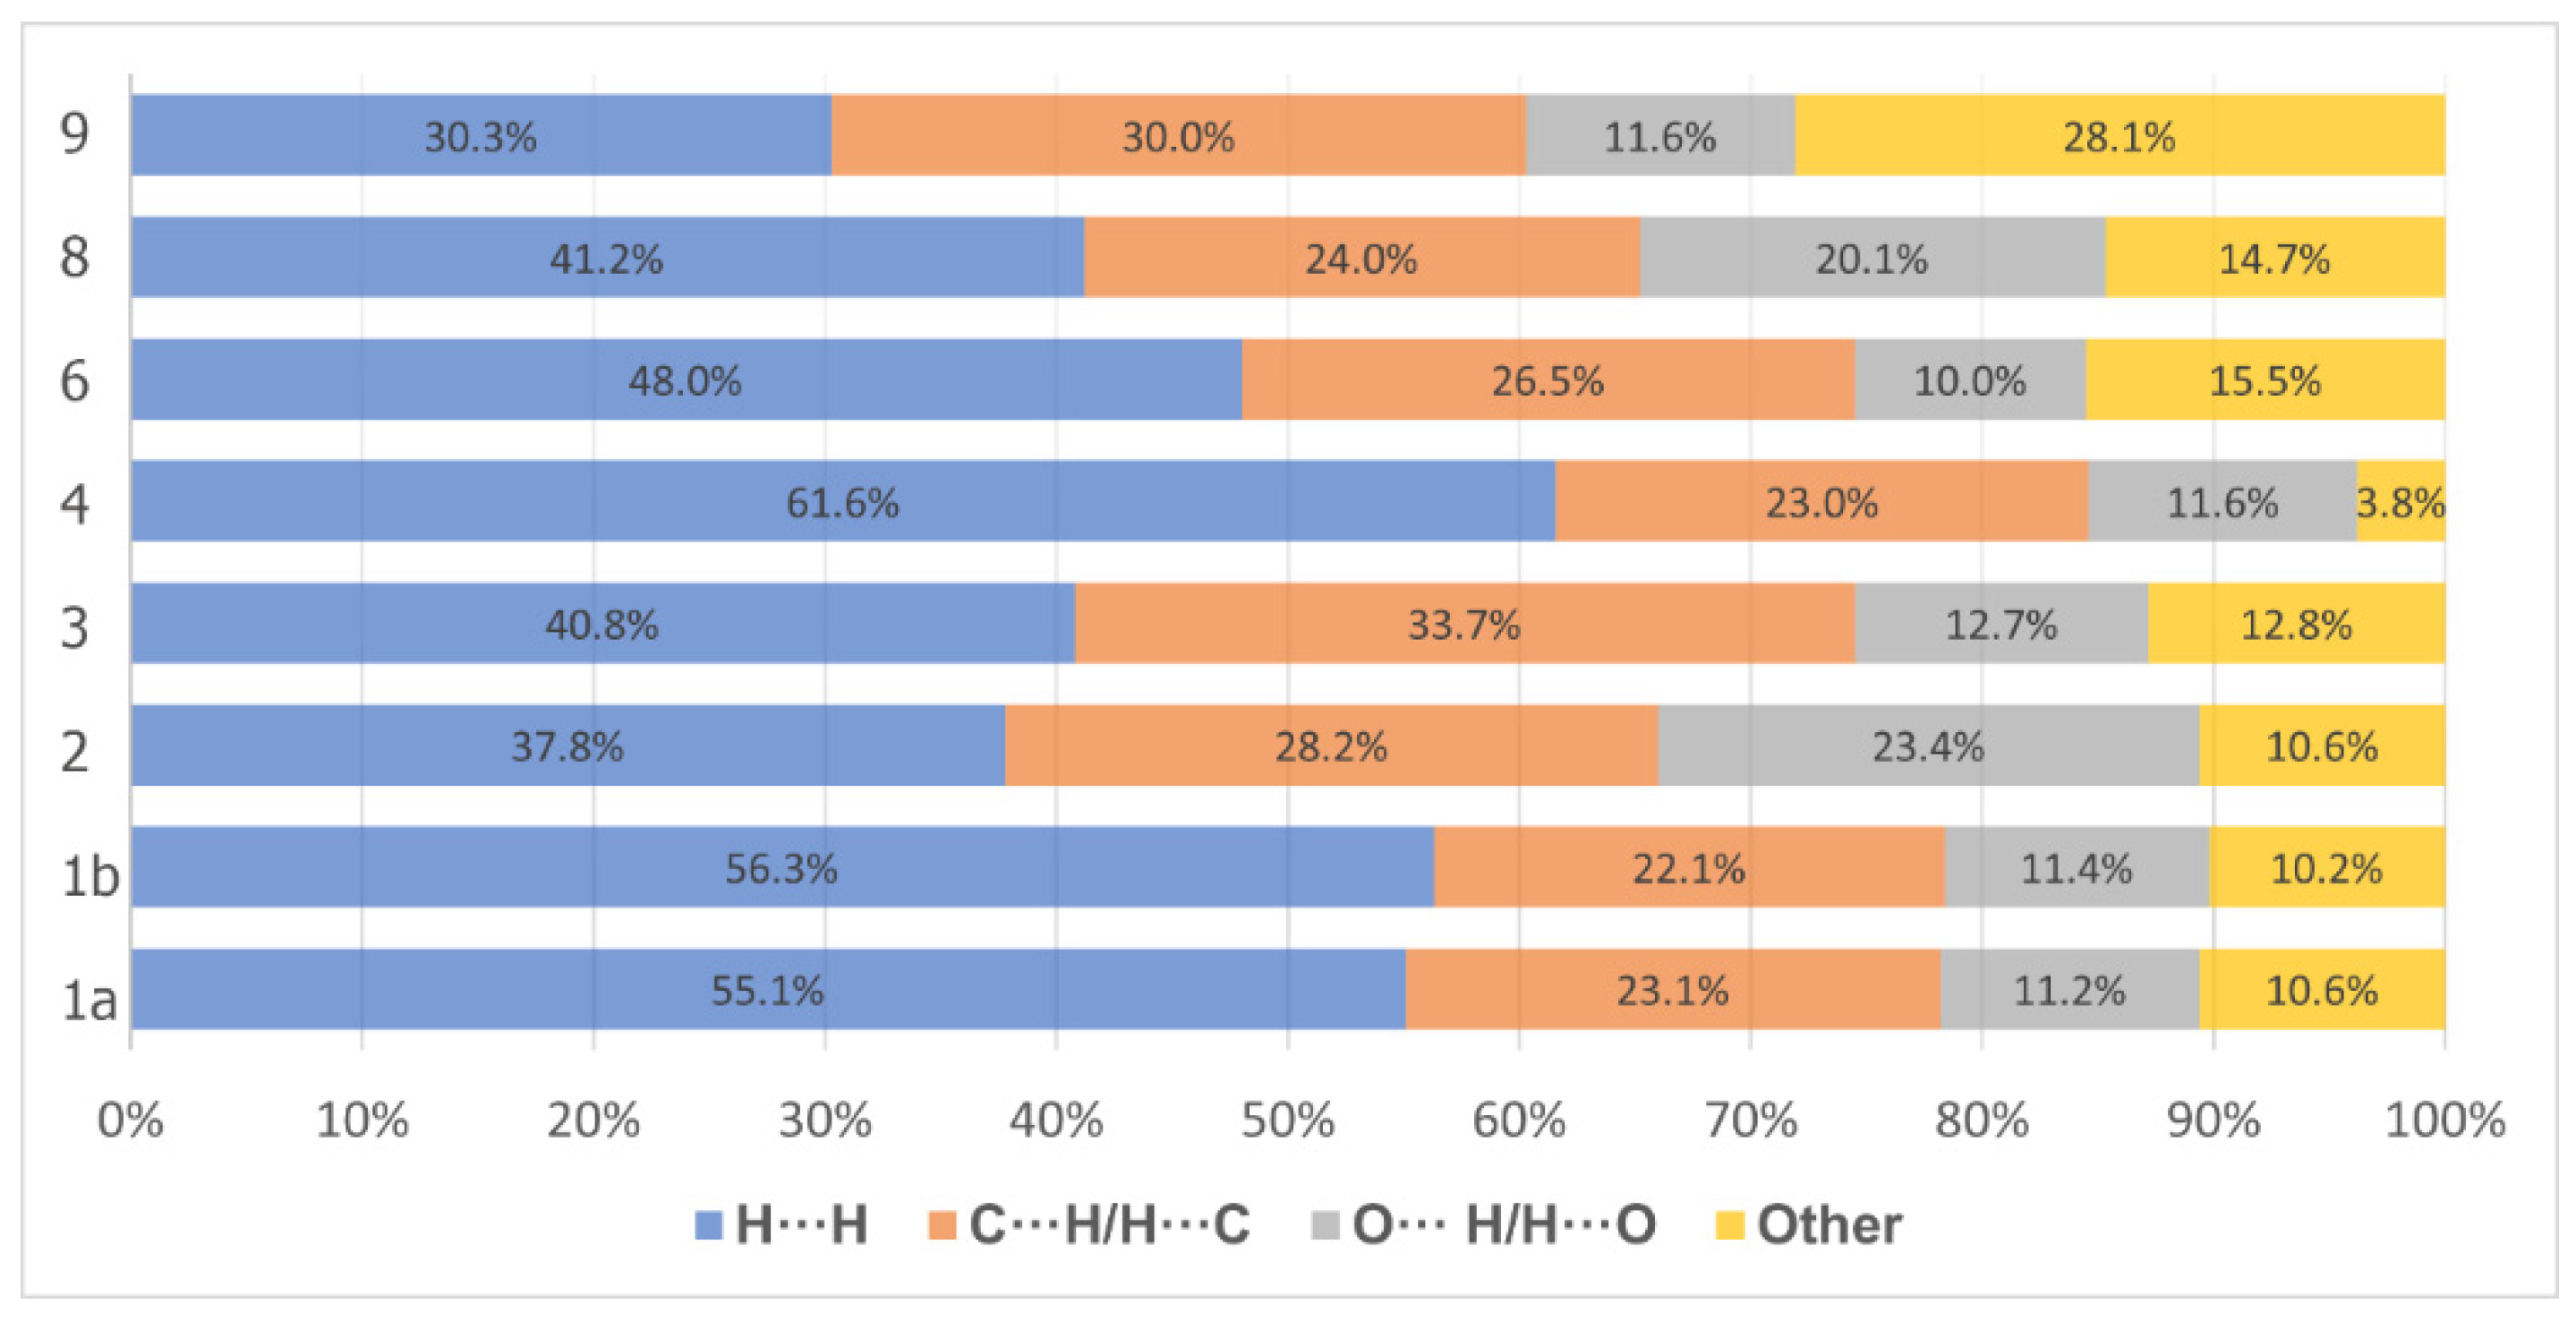
| Compound | H···H | C···H/H···C | O··· H/H···O | D··· H/H···D (D=S, N) |
|---|---|---|---|---|
| 1a |  55.1% |  23.1% |  11.2% |  2.4% (N··· H) |
| 1b |  56.3% |  22.1% |  11.4% |  2.4% (N··· H) |
| 2 |  37.8% |  28.2% |  23.4% | |
| 3 |  40.8% |  33.7% |  12.7% |  8.4% (S··· H) |
| 4 |  61.6% |  23.0% |  11.6% |  2.8% (N··· H) |
| 6 |  48.0% |  26.5% |  10.0% |  0.4% (N··· H) |
| 8 |  41.2% |  24.0% |  20.1% | |
| 9 |  30.3% |  30.0% |  11.6% |  14.3% (S··· H) |
| Compounds | Concentration | % of Inhibition |
|---|---|---|
| N-methyl-pyrCurc | 1 10 100 | 13.71 17.41 84.75 |
| FuranCurc | 1 10 100 | −6.24 1.59 93.46 |
| ThiopheneCurc | 1 10 100 | 0.23 25.43 51.90 |
| N-methyl-pyrCurc-Mg | 1 | −4.22 |
| 10 | 12.24 | |
| 100 | 69.70 | |
| FuranCurc-Mg | 1 | 3.19 |
| 10 | 45.20 | |
| 100 | 93.66 | |
| ThiopheneCurc-Mg | 1 | −4.52 |
| 10 | 24.10 | |
| 100 | 62.27 | |
| N-methyl-pyrCurc-Cu | 1 | −7.20 |
| 10 | 38.48 | |
| 100 | 71.20 | |
| FuranCurc-Cu | 1 | 0.83 |
| 10 | 27.46 | |
| 100 | 88.94 | |
| ThiopheneCurc-Cu | 1 | 5.67 |
| 10 | 51.00 | |
| 100 | 53.96 |
| Compounds | Concentration (μM) | TBARS (nmol/mg prot.) | Inhibition (%) | IC50 |
|---|---|---|---|---|
| FuranCurc (n = 3) | Basal Control 13.34 17.78 23.71 31.62 42.17 56.23 74.13 | 0.562 ± 0.274 9.962 ± 0.256 9.385 ± 0.416 8.634 ± 0.462 7.356 ± 0.928 5.091 ± 1.356 ** 3.590±1.114 ** 1.891±0.178 ** 1.167±0.148 ** | 5.6 ± 5.31 13.14 ± 5.84 25.93 ± 9.98 48.97 ± 13.11 ** 64.24 ± 10.44 ** 81.06 ± 1.43 ** 88.25 ± 1.57 ** | 33.93±4.65 |
| ThiopheneCurc (n = 3) | Basal Control 10 17.78 31.62 56.23 100 177.83 | 0.279 ± 0.055 5.349 ± 0.267 4.398 ± 0.177 ** 3.157 ± 0.139 ** 2.042 ± 0.116 ** 1.528 ± 0.035 ** 1.425 ± 0.094 ** 1.766 ± 0.119 ** | 17.68 ± 0.97 ** 40.94 ± 0.36 ** 61.81 ± 1.08 ** 71.25 ± 1.79 ** 73.06 ± 3.06 ** 66.63 ± 3.83 ** | 22.02 ± 0.15 |
| FuranCurc-Mg (n = 3) | Basal Control 5.62 7.50 10 13.34 17.78 23.71 31.62 | 0.562 ± 0.274 9.962 ± 0.256 9.194 ± 0.341 8.790 ± 0.262 5.967 ± 0.888 ** 3.326 ± 0.562 ** 1.676 ± 0.069 ** 1.278 ± 0.070 ** 1.194 ± 0.059 ** | 7.69 ± 2.82 11.75 ± 1.62 40.05 ± 8.79 ** 66.59 ± 5.55 ** 83.13 ± 1.01 ** 87.14 ± 0.88 ** 87.98 ± 0.77 ** | 11.26 ± 1.73 |
| ThiopheneCurc-Cu (n = 3) | Basal Control 3.16 5.62 10 17.78 31.62 56.23 | 0.279 ± 0.055 5.349 ± 0.267 4.665 ± 0.144 * 3.651 ± 0.200 ** 2.693 ± 0.029 ** 2.280 ± 0.052 ** 2.351 ± 0.046 ** 2.225 ± 0.055 ** | 12.51 ± 3.57 * 31.7 ± 2.33 ** 49.46 ± 1.96 ** 57.25 ± 1.19 ** 55.9 ± 1.51 ** 58.14 ± 2.66 ** | 10.30 ± 0.59 |
| % of Inhibition | |||||||
|---|---|---|---|---|---|---|---|
| Products (25 μM) | U251 | PC-3 | K562 | HCT-15 | MCF-7 | SKLU-1 | COS7 |
| Curc | 67.1 | 94.4 | 80.1 | 80.0 | 82.4 | 94.51 | 71.6 |
| N-methyl-pyrCurc (1) | 52.83 | 60.39 | 65.8 | 18.15 | 99.9 | 100 | 100 |
| FuranCurc (2) | 0 | 10.8 | 6.4 | 0 | 0 | 0 | 46.2 |
| ThiopheneCurc (3) | 0 | 14.8 | 4.4 | 0 | 13.4 | 0 | 0 |
| N-methyl-pyrCurc-Cu (7) | 71.62 | 64.99 | 74.67 | 100 | 100 | 100 | 100 |
| FuranCurc-Cu (8) | 100 | 100 | 90.1 | 72.4 | 92.8 | 95.0 | 100 |
| ThiopheneCurc-Cu (9) | 58.2 | 63.6 | 84.4 | 38,1 | 57.9 | 91.0 | 0 |
| (12.5 μM) | |||||||
| N-methyl-pyrCurc-Mg (4) | 19.5 | 1.4 | 28.8 | 15.8 | 35.7 | 18.1 | 23.4 |
| FuranCurc-Mg (5) | 65.9 | 51.2 | 16.4 | 83.2 | 24.2 | 8.6 | 0 |
| ThiopheneCurc-Mg (6) | 19.5 | 2.2 | 9.4 | 72.2 | 2.0 | 30.7 | 0 |
| Products | U251 | PC-3 | K562 | HCT-15 | MCF-7 | SKLU-1 | COS7 |
|---|---|---|---|---|---|---|---|
| N-methyl-pyrCurc | 25.8 ± 2.7 | - | 12.9 ± 1.0 | 22.4 ± 2.4 | 27.3 ± 4.3 | 13.0 ± 1.9 | - |
| FuranCurc | 11.7 ± 2.9 | 35.9 ± 3.9 | - | - | - | 15.5 ± 2.0 | - |
| ThiopheneCurc | - | - | - | - | - | - | - |
| FuranCurc-Mg | 8.6 ± 0.6 | 19.7 ± 0.05 | - | 11.2 ± 1.0 | - | - | 19.07 ± 0.37 |
| ThiopheneCurc-Mg | - | - | - | 32.42 ± 1.0 | - | - | - |
| N-methyl-pyrCurc-Cu | 10.6 ± 1.0 | - | 5.9 ± 1.5 | 12.9 ± 2.1 | 10.8 ± 1.7 | 10.3 ± 1.0 | - |
| FuranCurc-Cu | 4.0 ± 0.3 | 3.0 ± 0.1 | - | - | - | 6.5 ± 0.2 | - |
| ThiopheneCurc-Cu | - | - | 38.6 ± 8.1 | - | - | - | - |
| Cisplatin | 4.7 ± 0.4 | 8.94 ± 0.9 | 8.6 ± 0.9 | 10.0 ± 0.9 | 9.4 ± 1.0 | 4.3 ± 0.5 | 7.2 ± 0.6 |
Disclaimer/Publisher’s Note: The statements, opinions and data contained in all publications are solely those of the individual author(s) and contributor(s) and not of MDPI and/or the editor(s). MDPI and/or the editor(s) disclaim responsibility for any injury to people or property resulting from any ideas, methods, instructions or products referred to in the content. |
© 2023 by the authors. Licensee MDPI, Basel, Switzerland. This article is an open access article distributed under the terms and conditions of the Creative Commons Attribution (CC BY) license (https://creativecommons.org/licenses/by/4.0/).
Share and Cite
Meza-Morales, W.; Alejo-Osorio, Y.; Alvarez-Ricardo, Y.; Obregón-Mendoza, M.A.; Machado-Rodriguez, J.C.; Arenaza-Corona, A.; Toscano, R.A.; Ramírez-Apan, M.T.; Enríquez, R.G. Homoleptic Complexes of Heterocyclic Curcuminoids with Mg(II) and Cu(II): First Conformationally Heteroleptic Case, Crystal Structures, and Biological Properties. Molecules 2023, 28, 1434. https://doi.org/10.3390/molecules28031434
Meza-Morales W, Alejo-Osorio Y, Alvarez-Ricardo Y, Obregón-Mendoza MA, Machado-Rodriguez JC, Arenaza-Corona A, Toscano RA, Ramírez-Apan MT, Enríquez RG. Homoleptic Complexes of Heterocyclic Curcuminoids with Mg(II) and Cu(II): First Conformationally Heteroleptic Case, Crystal Structures, and Biological Properties. Molecules. 2023; 28(3):1434. https://doi.org/10.3390/molecules28031434
Chicago/Turabian StyleMeza-Morales, William, Yuritzi Alejo-Osorio, Yair Alvarez-Ricardo, Marco A. Obregón-Mendoza, Juan C. Machado-Rodriguez, Antonino Arenaza-Corona, Rubén A. Toscano, María Teresa Ramírez-Apan, and Raúl G. Enríquez. 2023. "Homoleptic Complexes of Heterocyclic Curcuminoids with Mg(II) and Cu(II): First Conformationally Heteroleptic Case, Crystal Structures, and Biological Properties" Molecules 28, no. 3: 1434. https://doi.org/10.3390/molecules28031434