

Discovery of Transfer Factors in Plant-Derived Proteins and an In Vitro Assessment of Their Immunological Activities
 ,
,
Abstract
:
1. Introduction
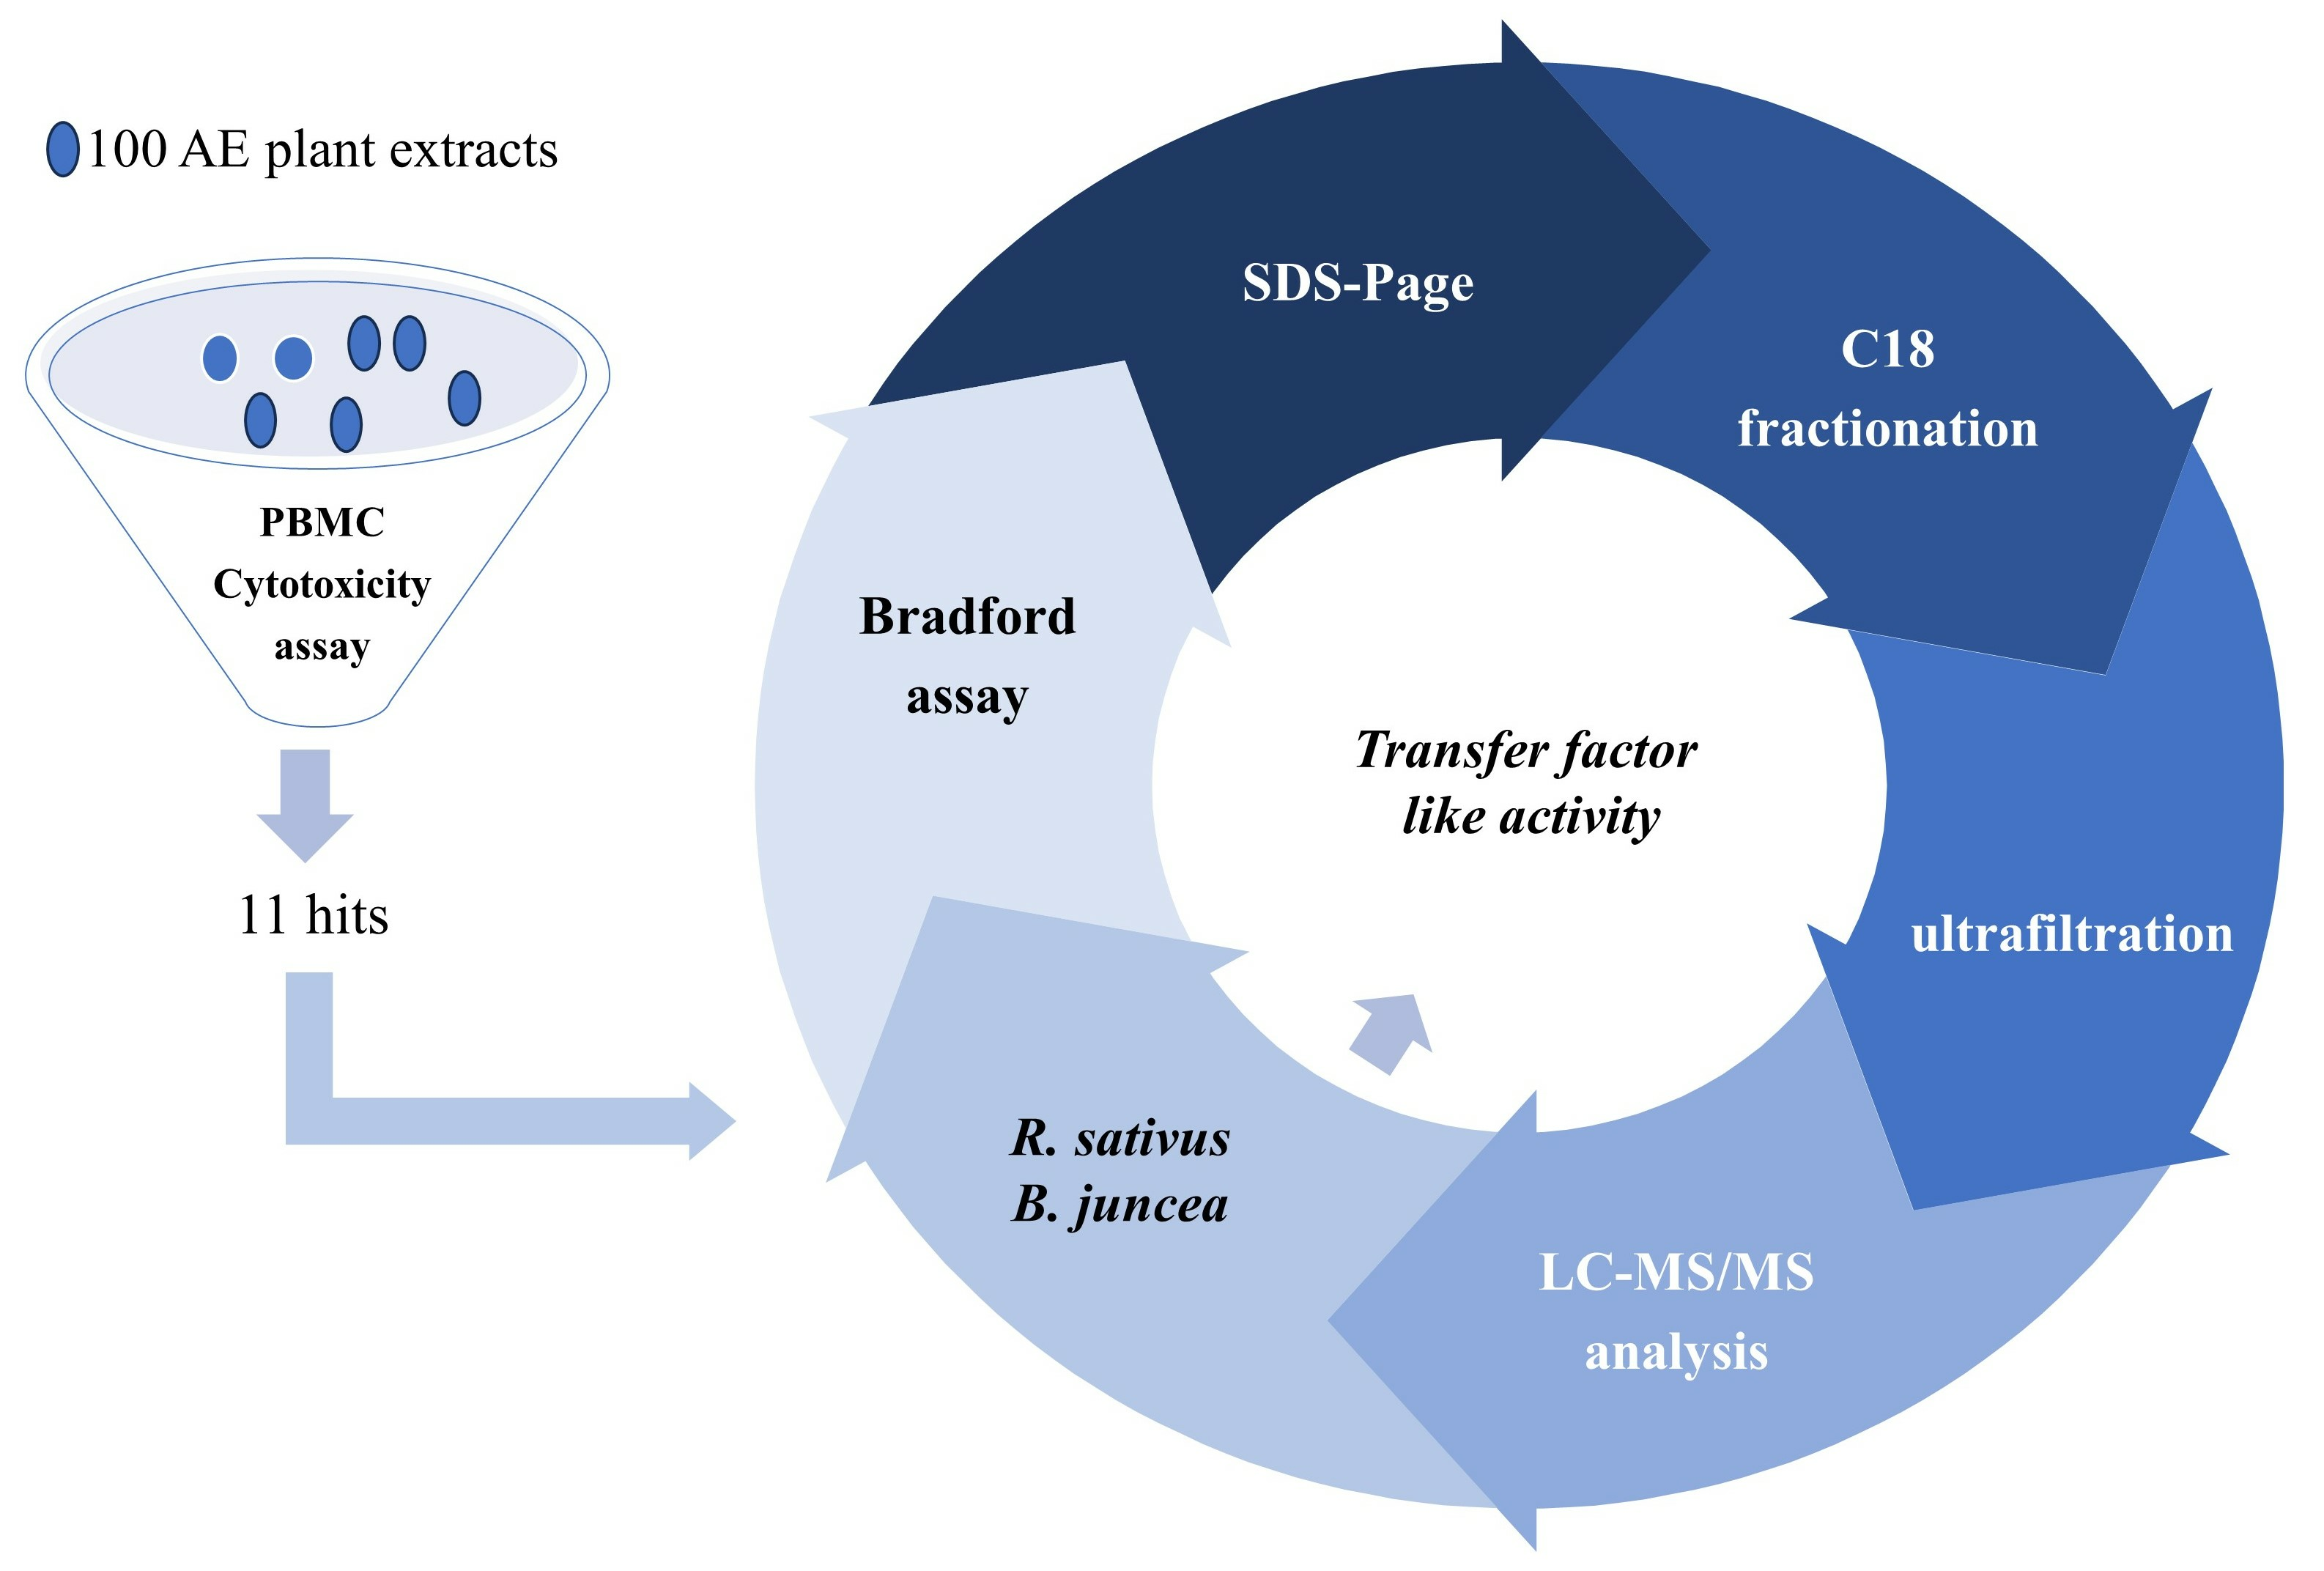
2. Results
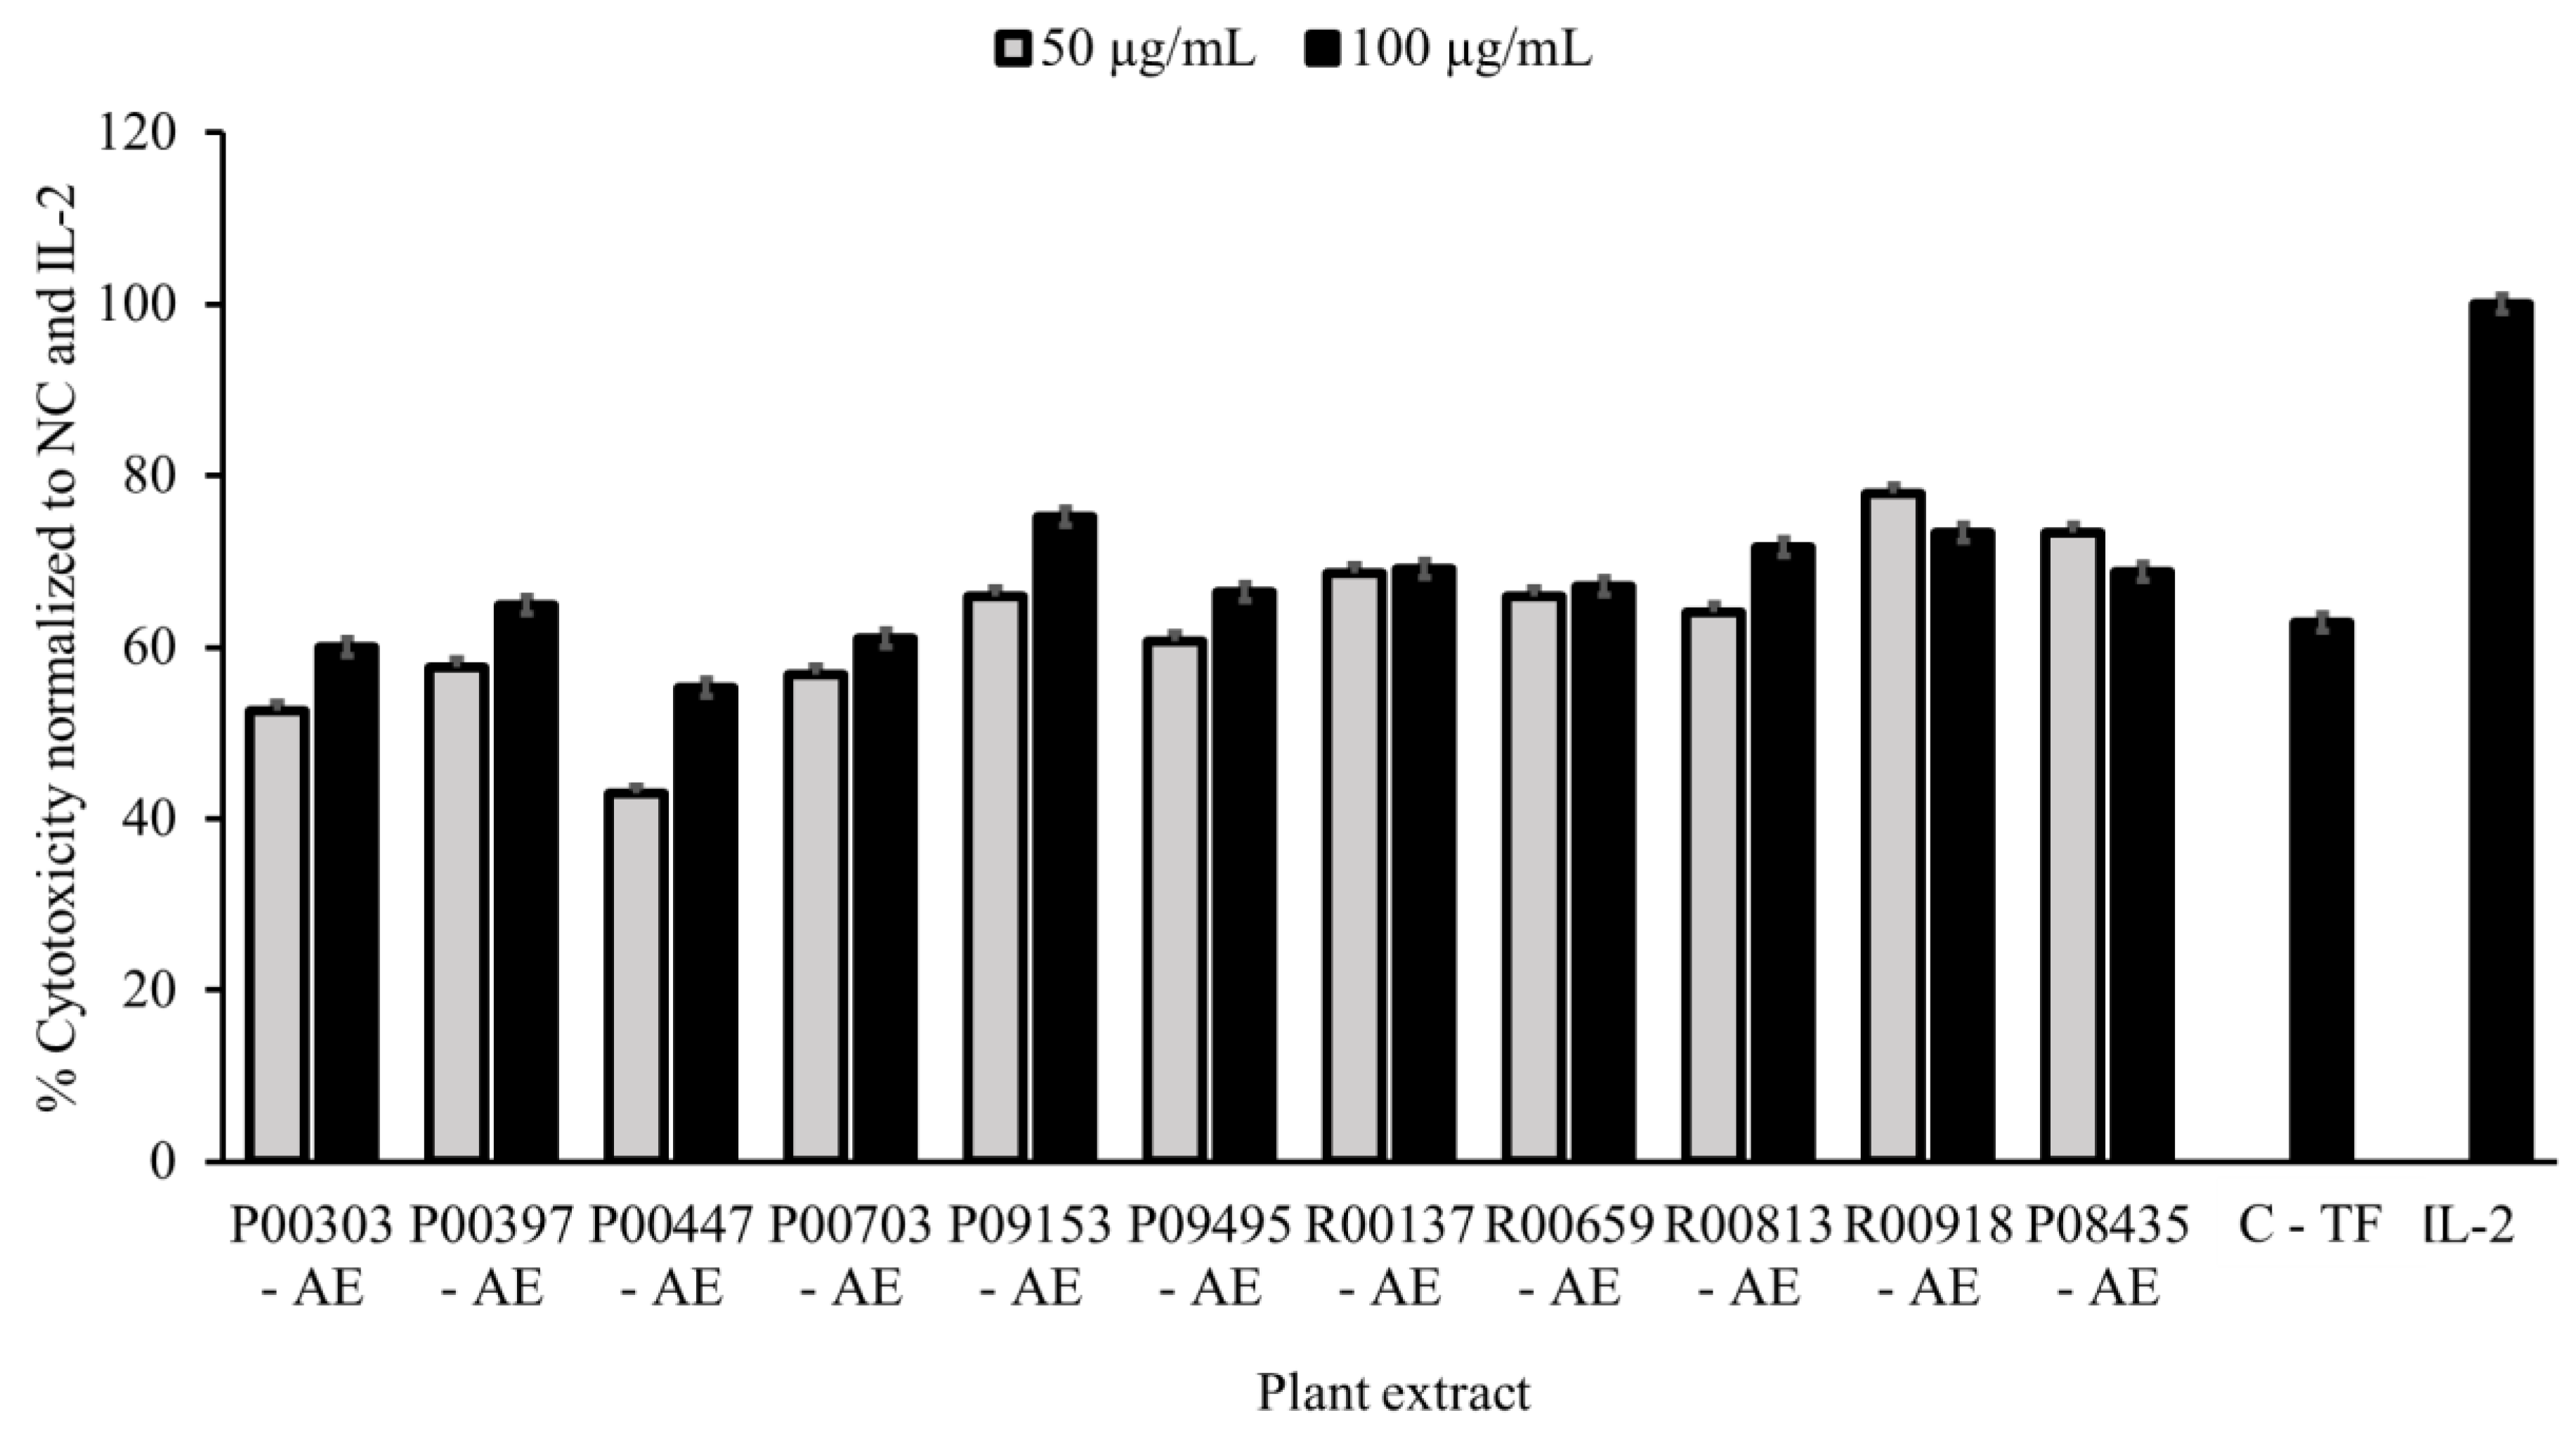
2.1. Primary Screening
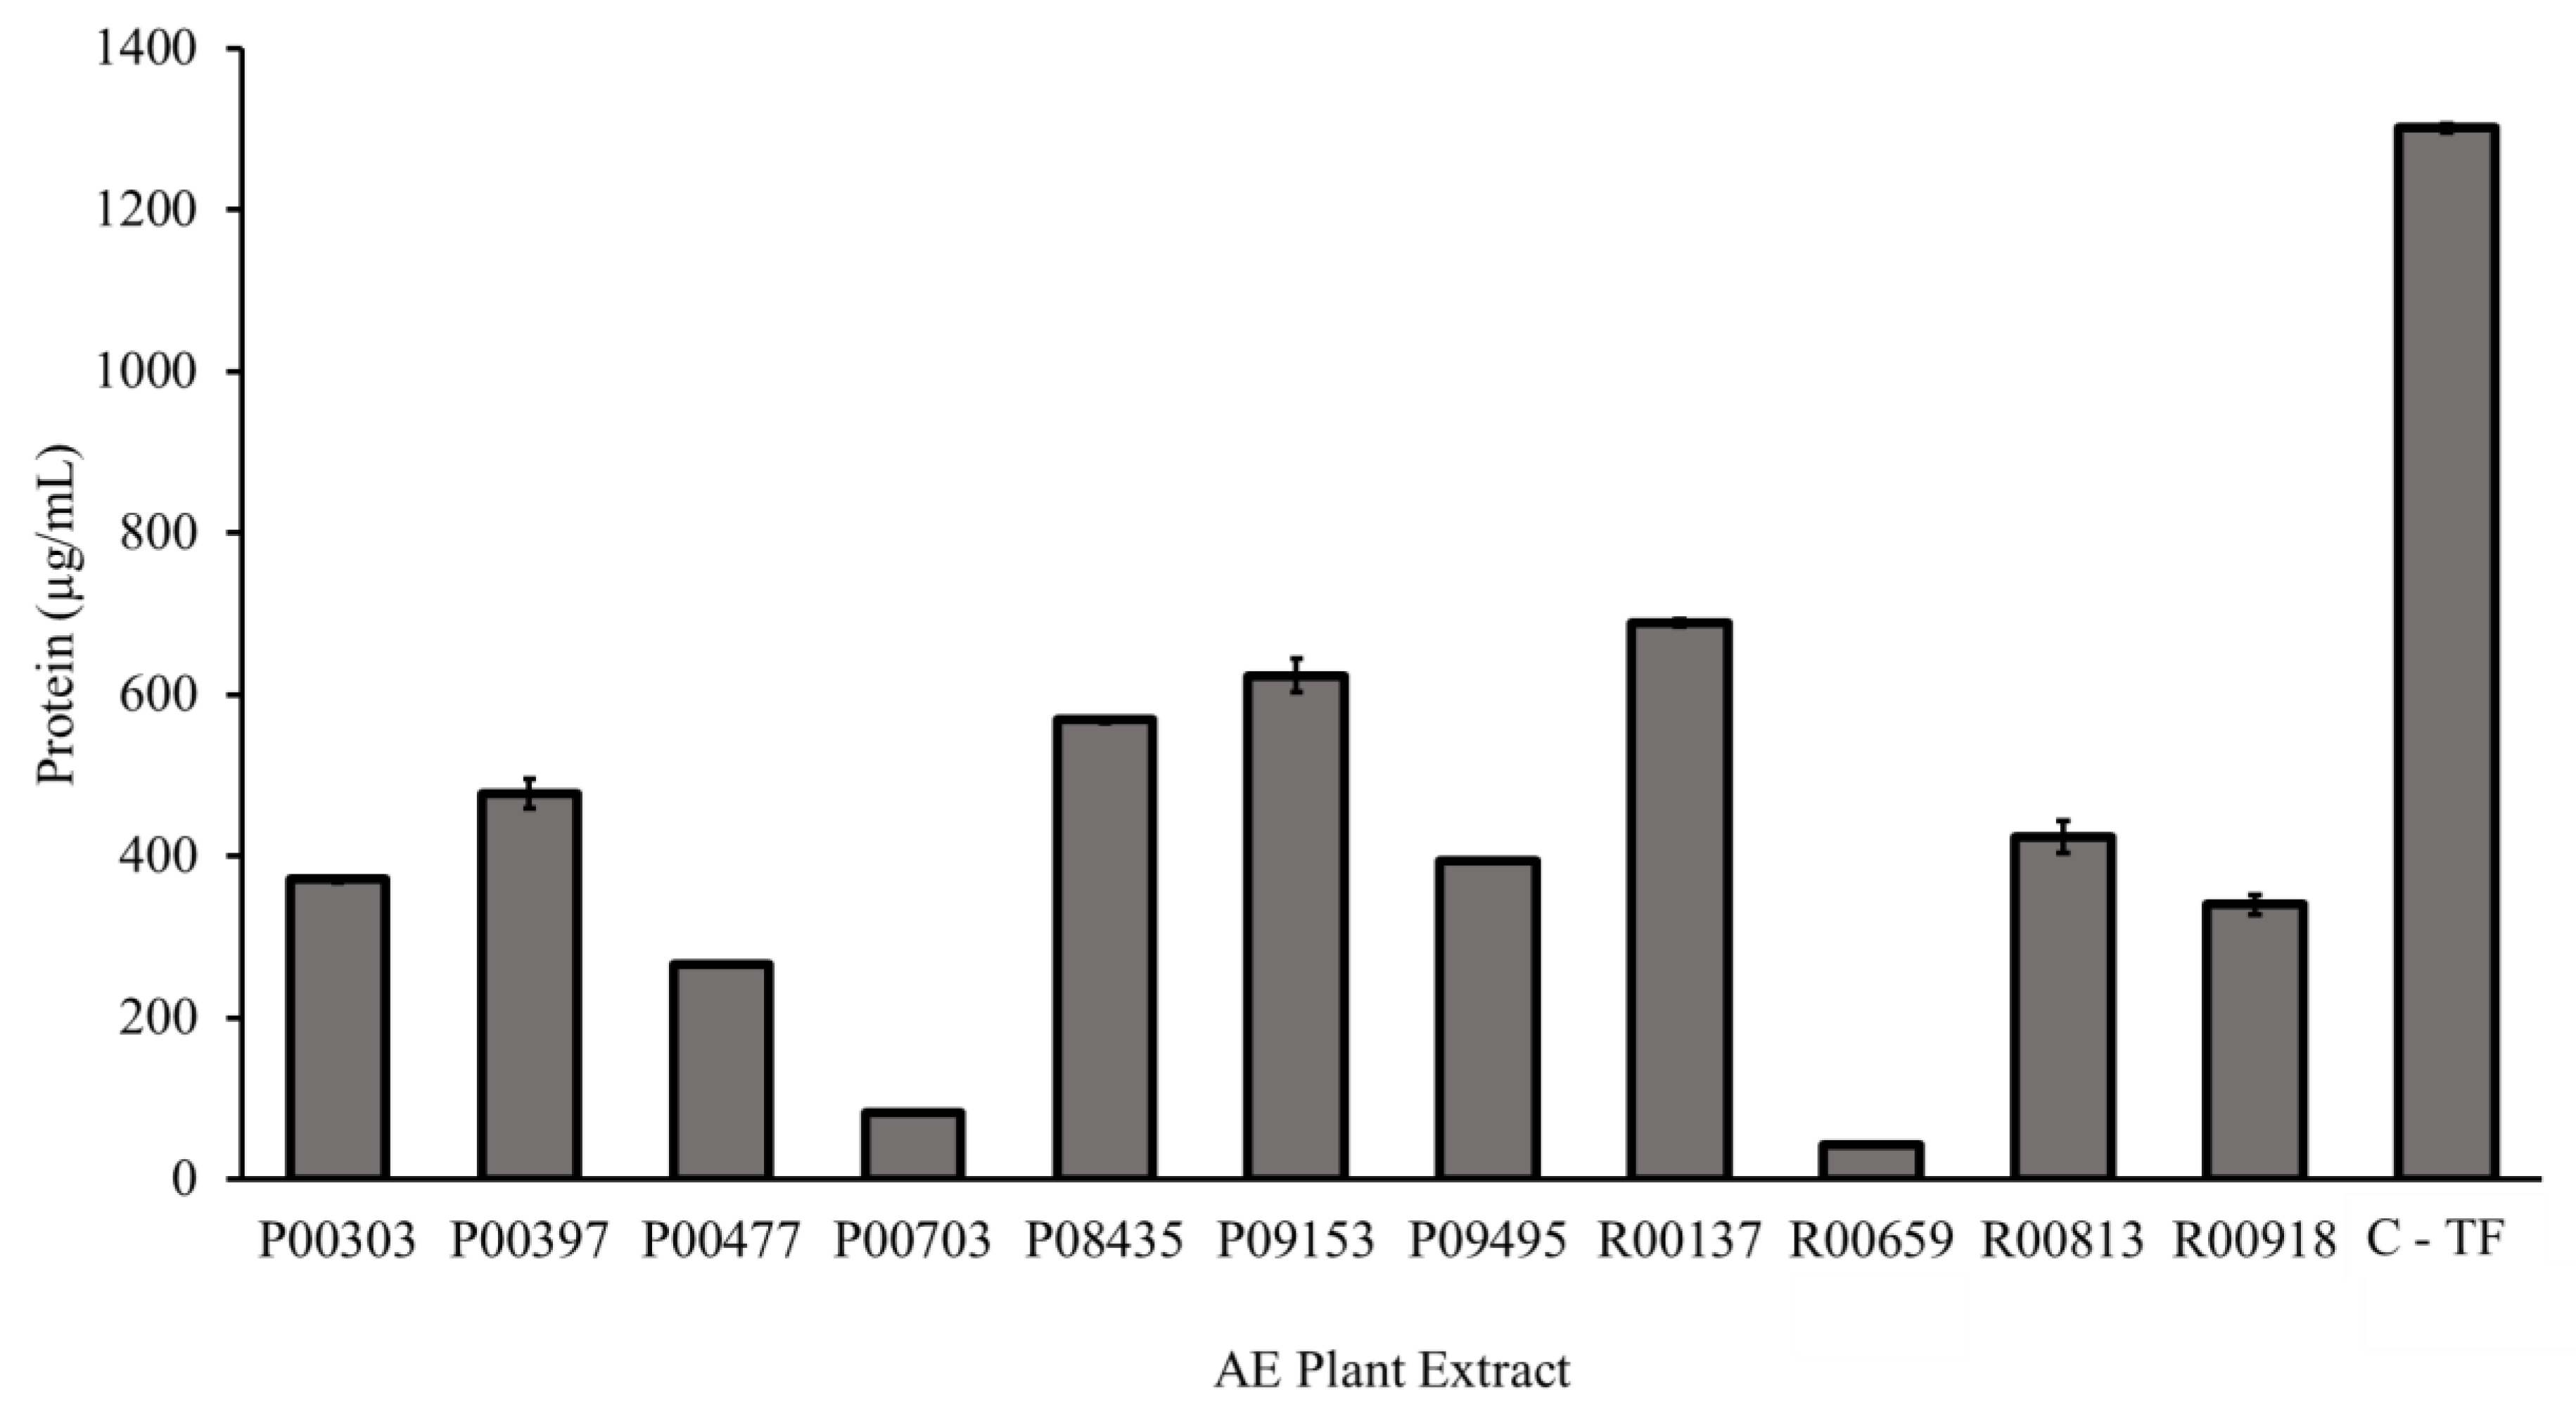
2.2. Protein Content as Measured by a Bradford Assay
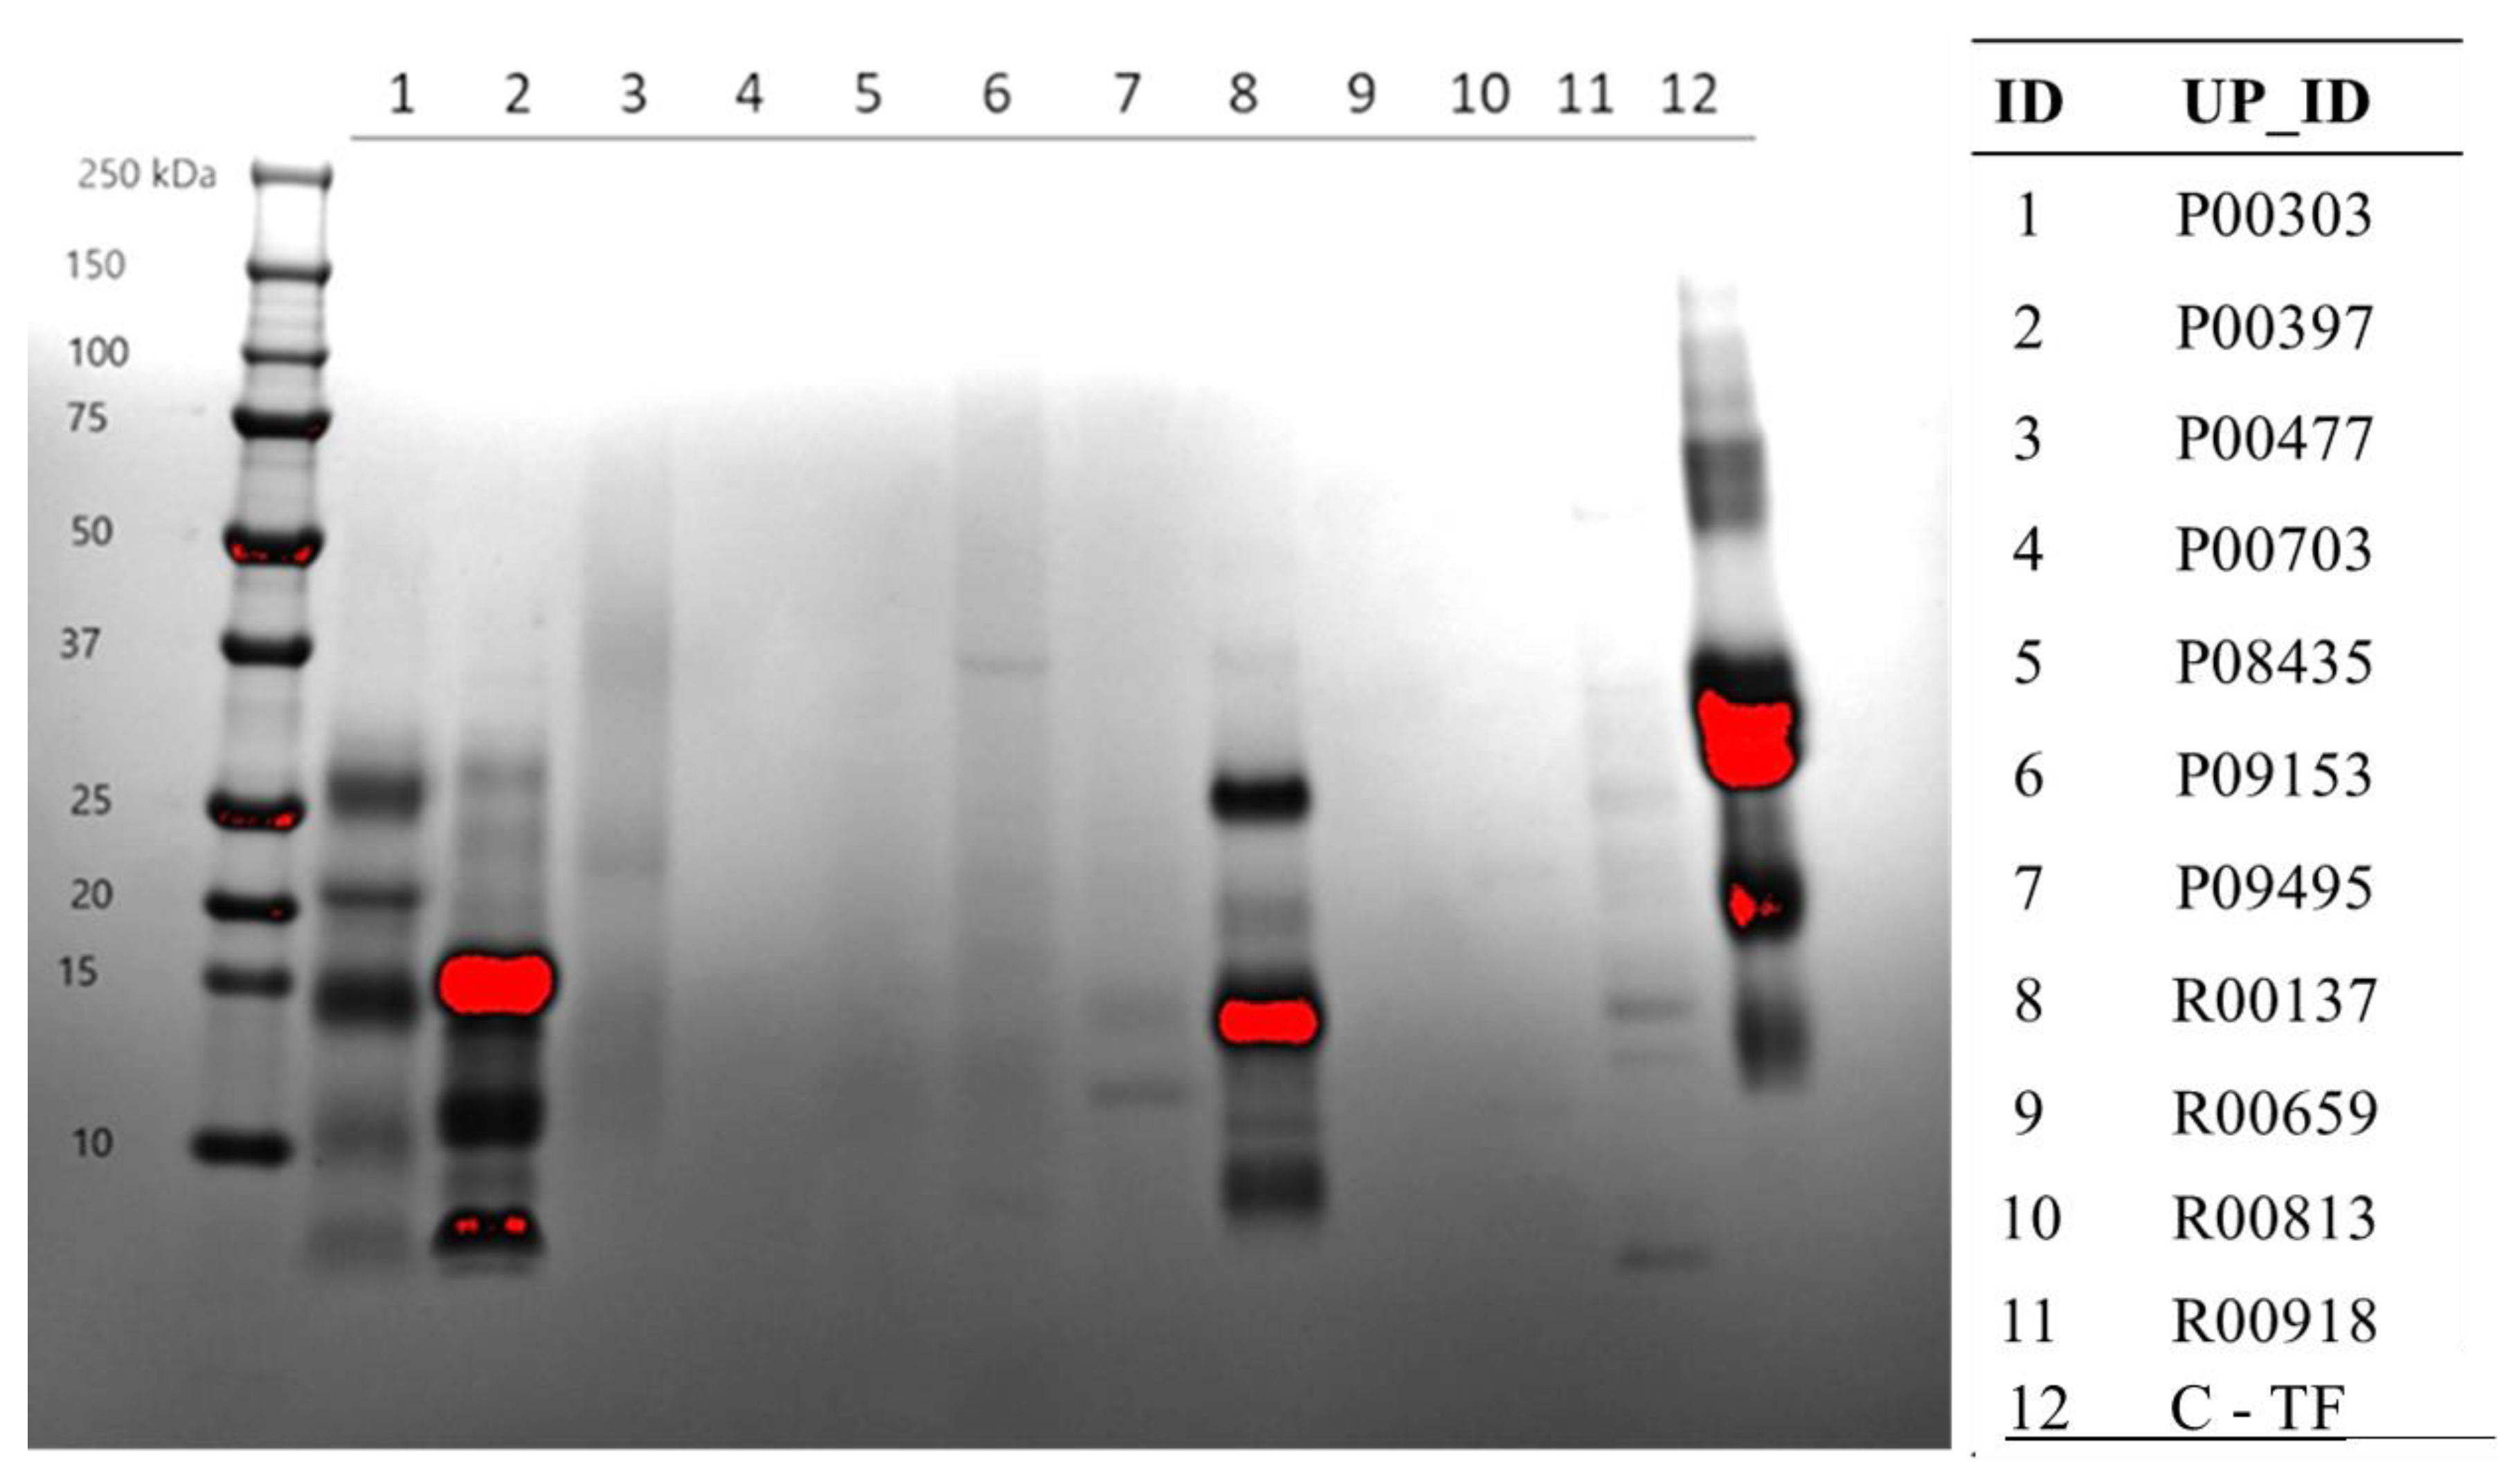
2.3. Protein Content on SDS-PAGE Gel
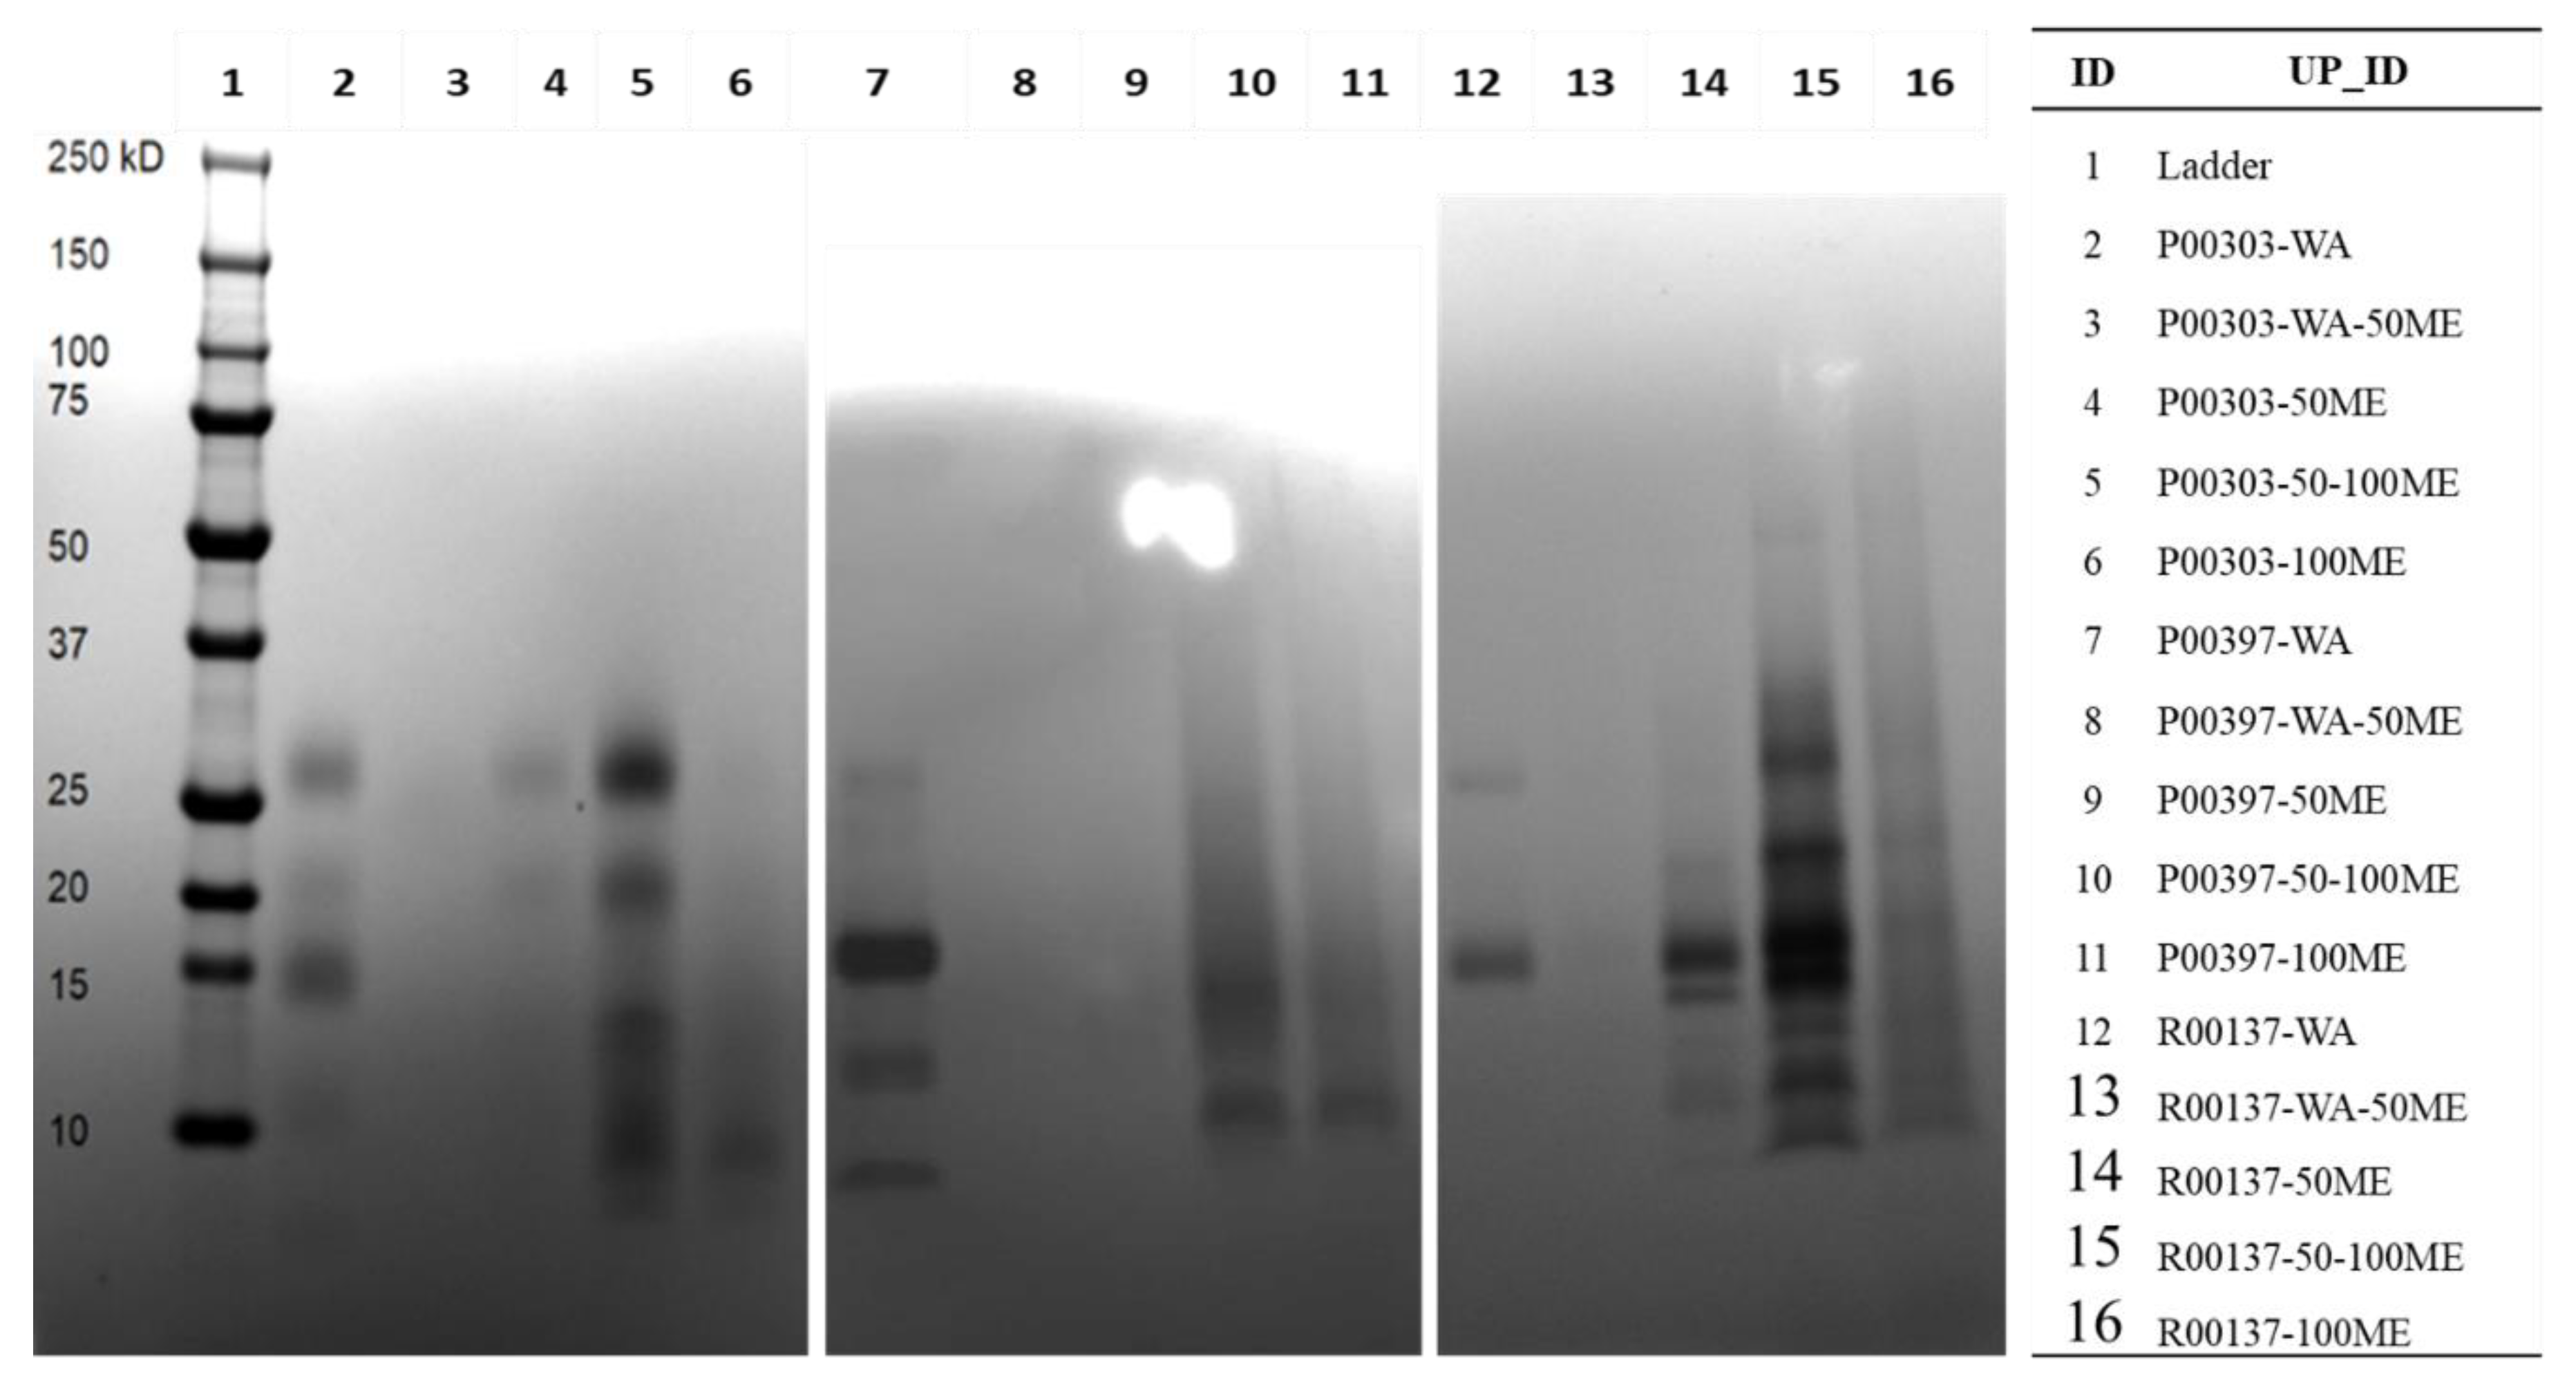
2.4. Methanol Fractions of Top Three Hits on SDS Page
2.5. Activity of C18 Column-Fractionated AE Extracts
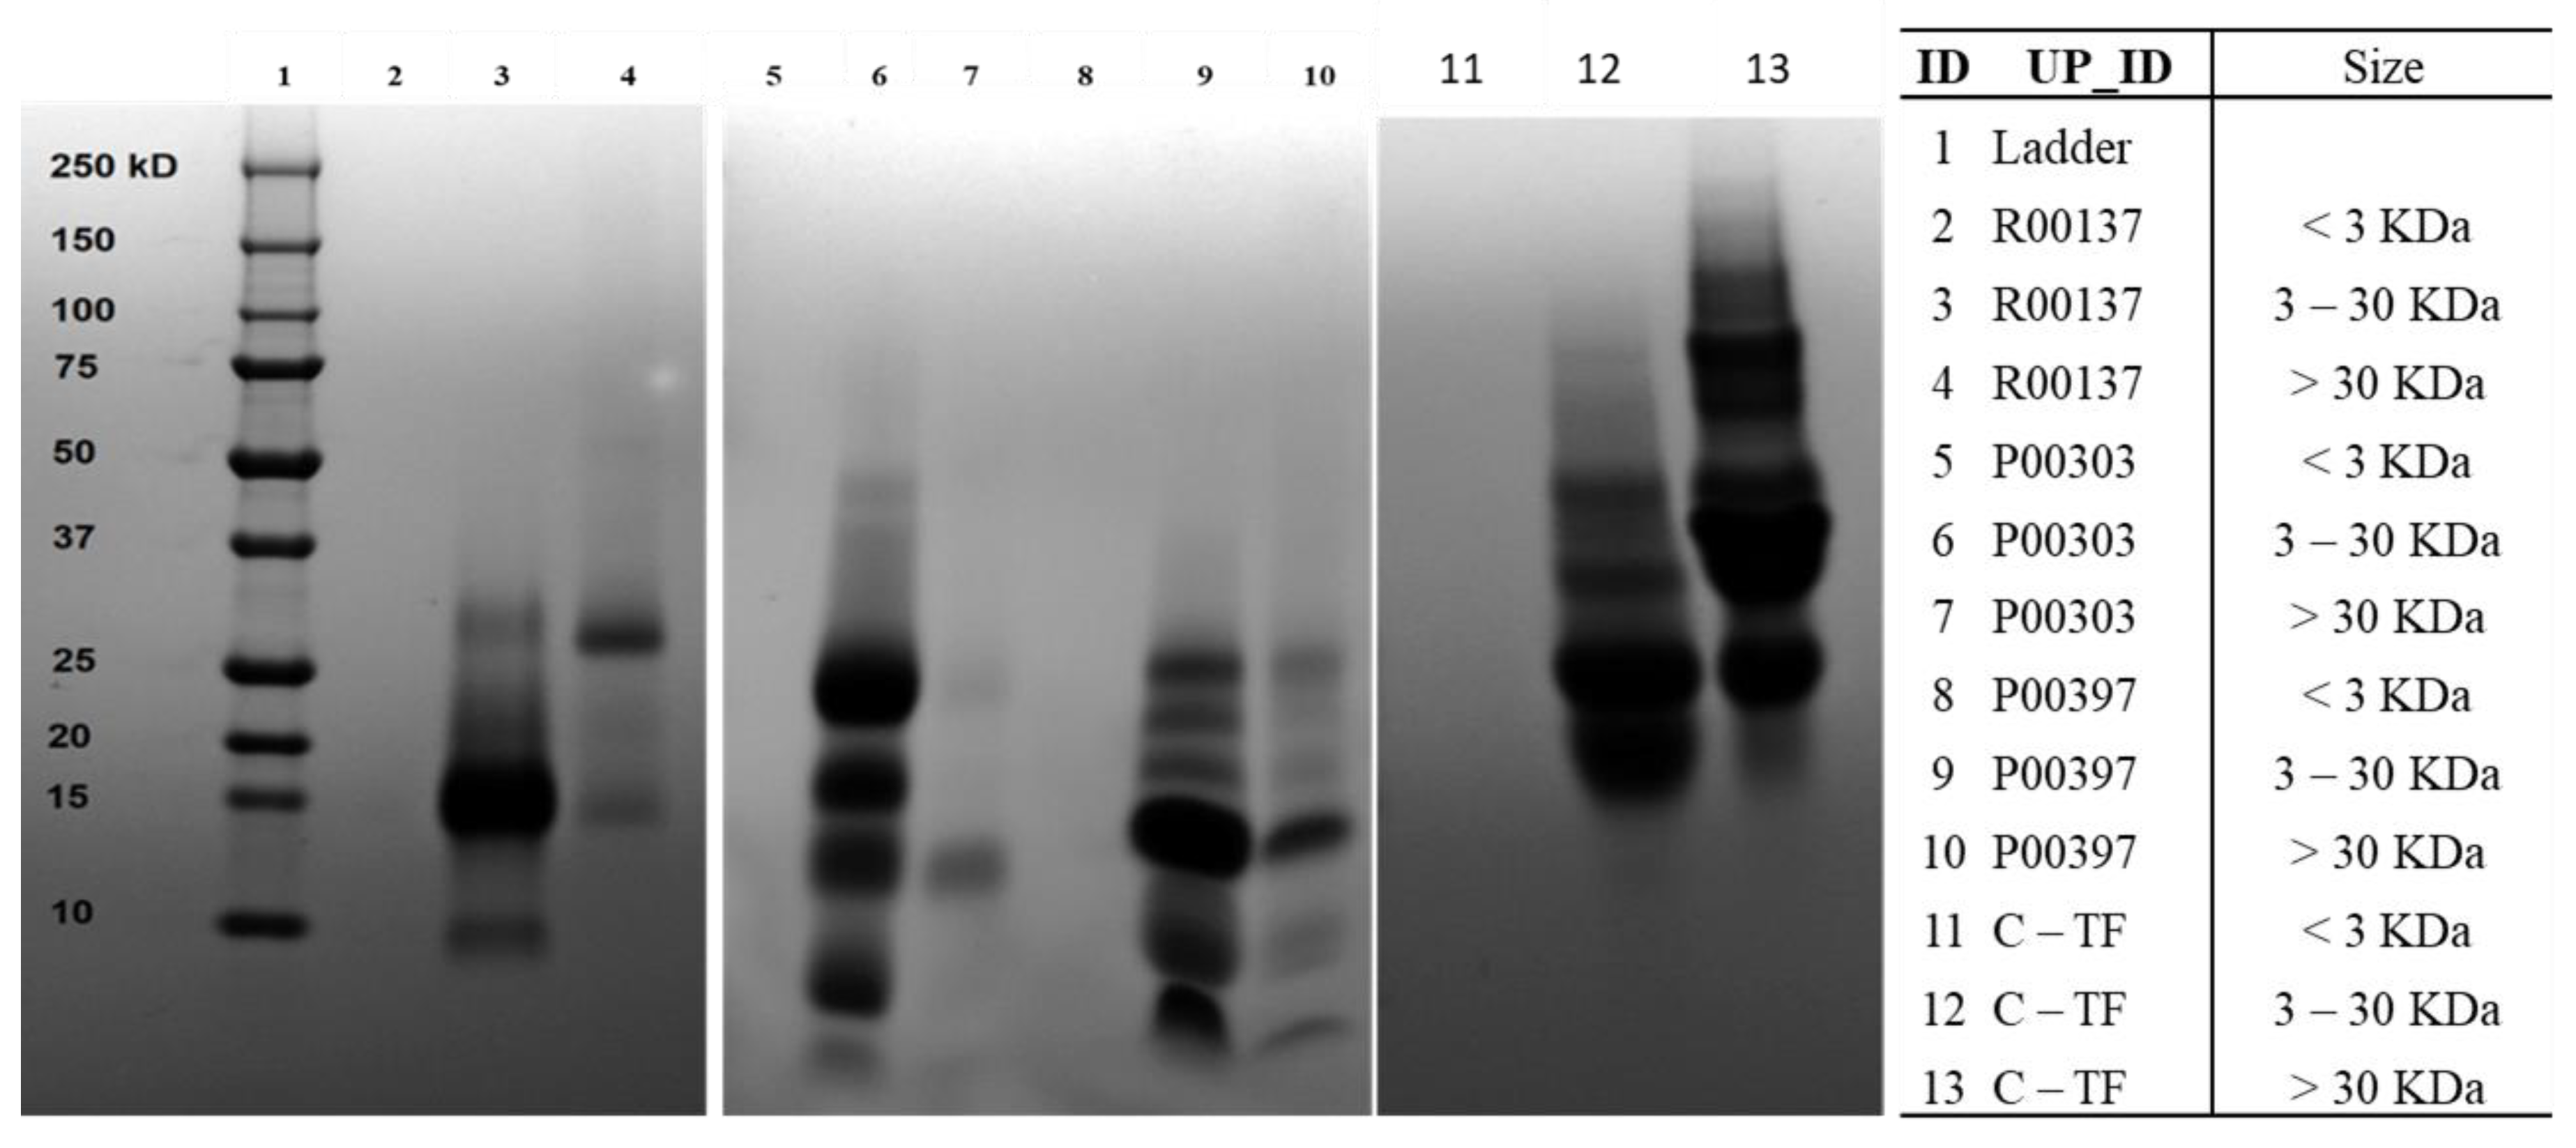
2.6. Ultrafiltration of High-Protein Hits
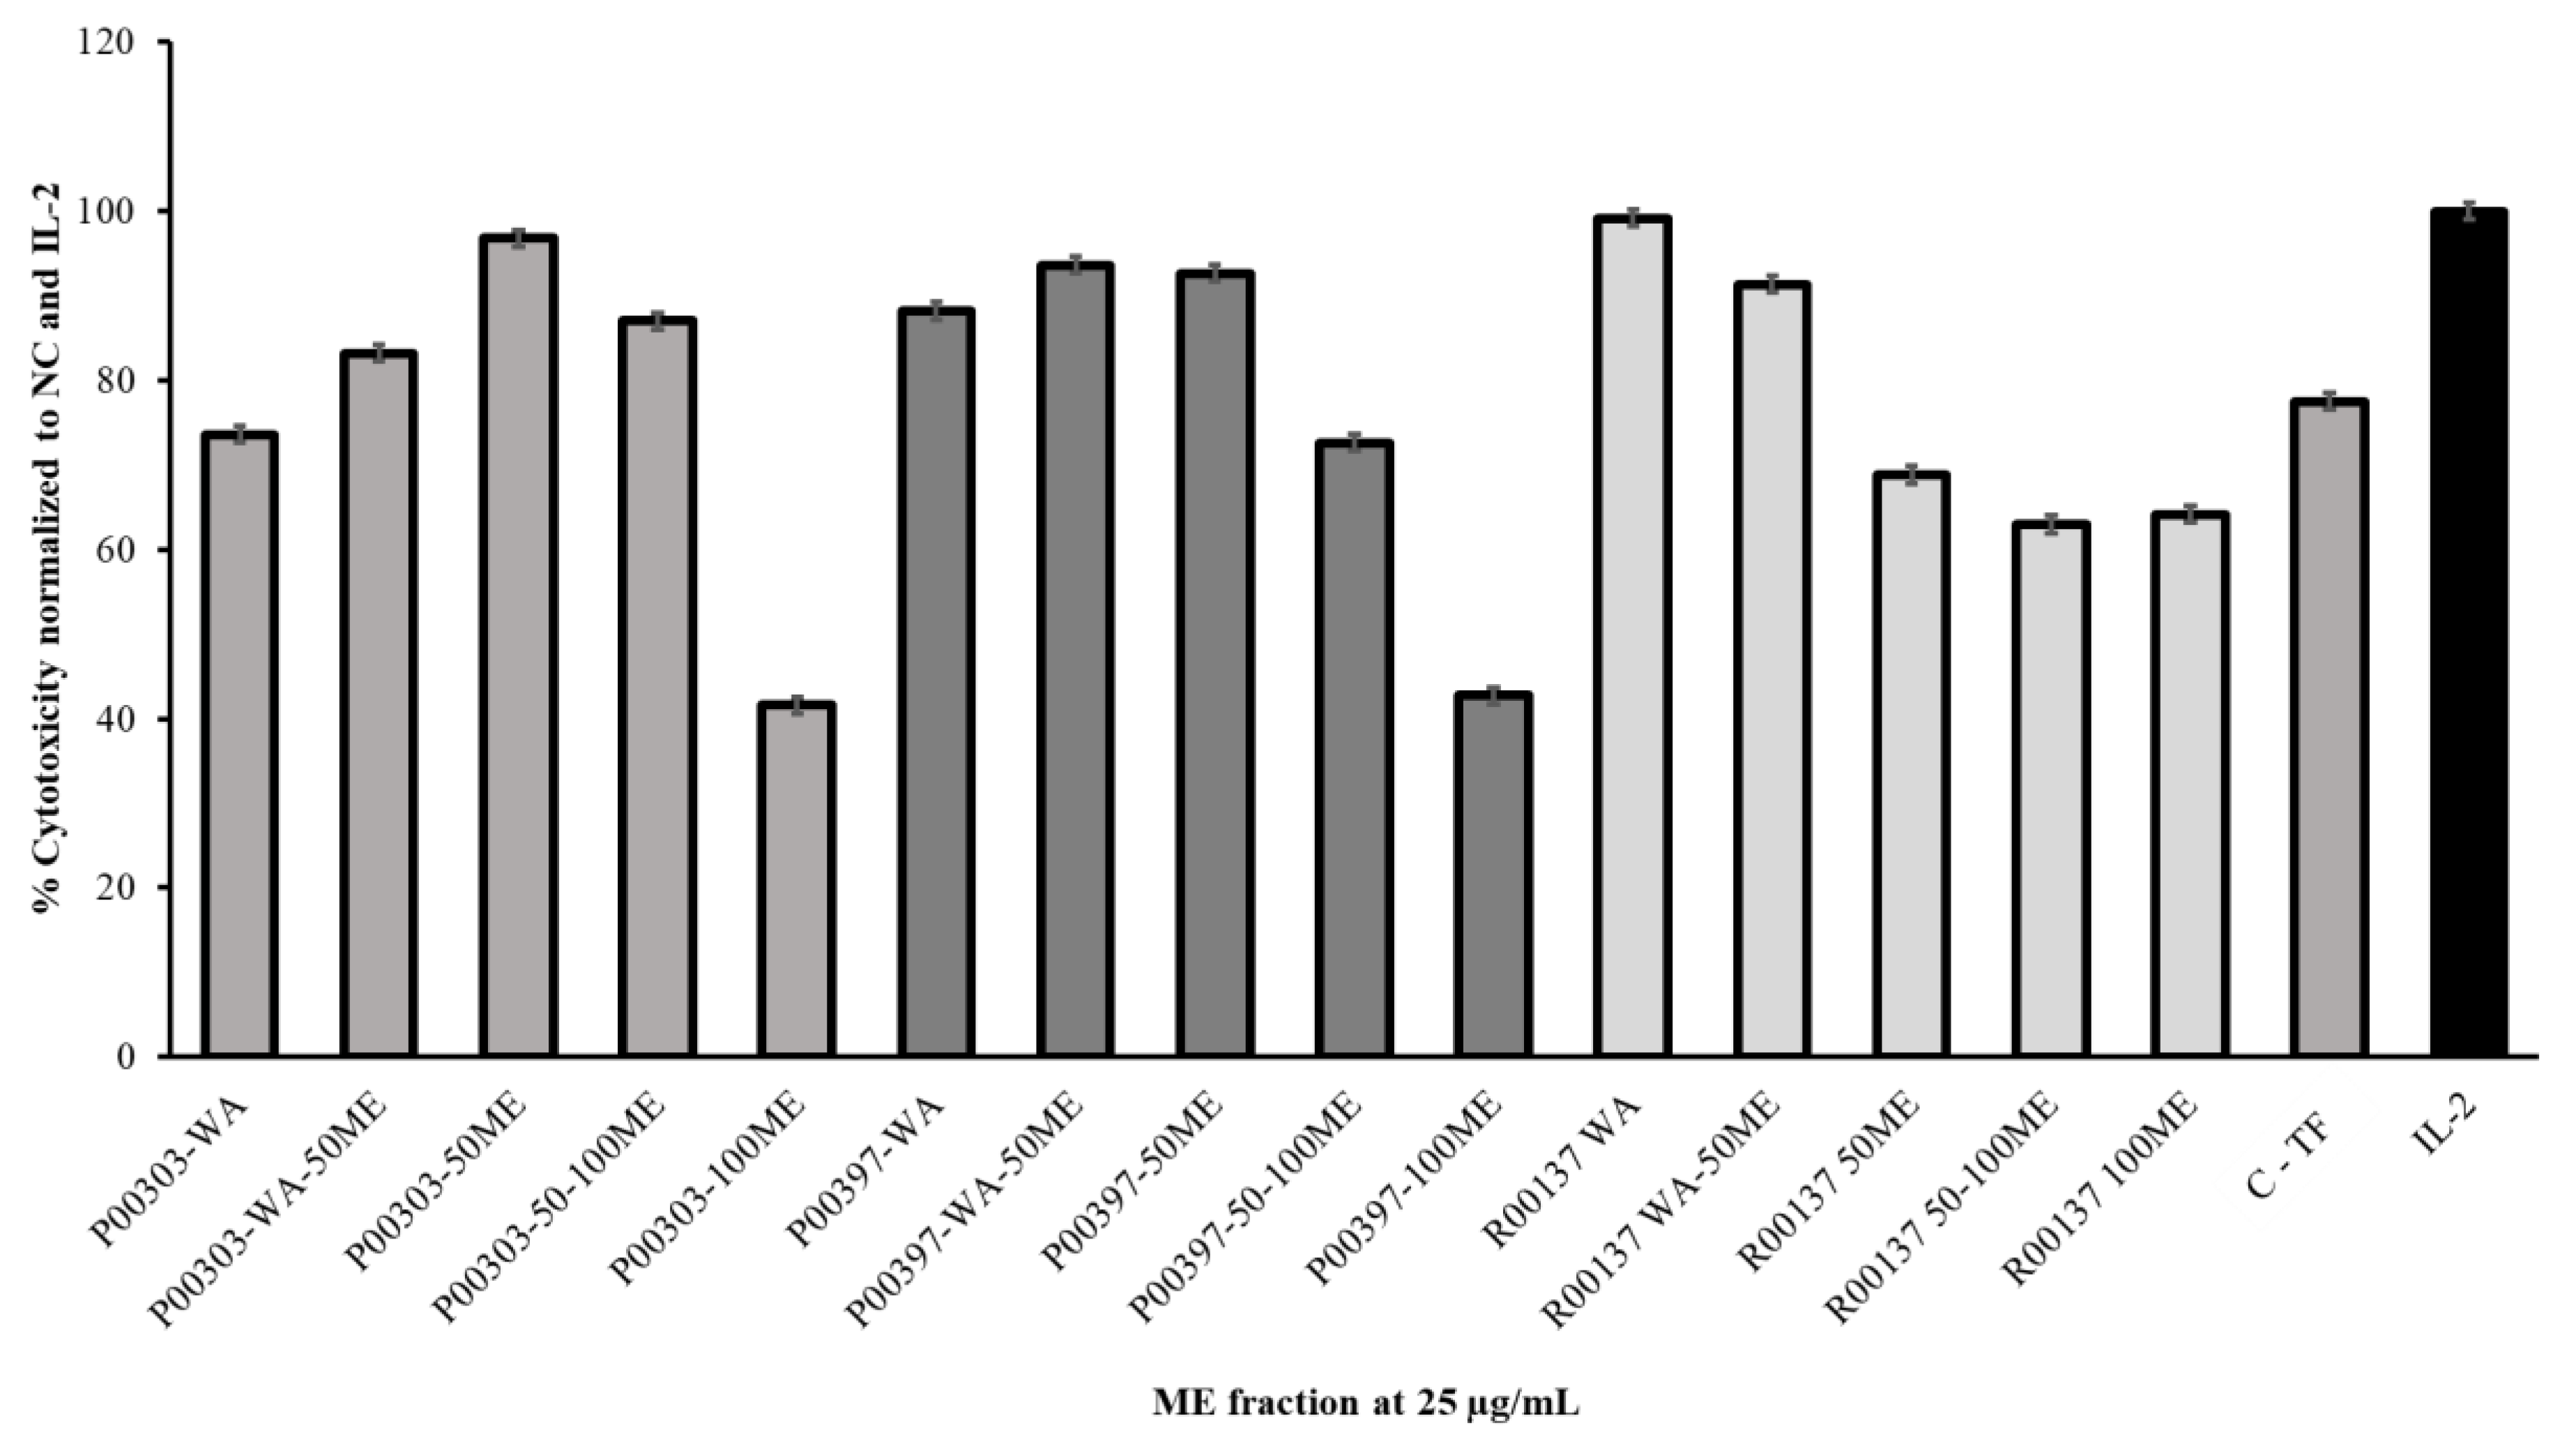
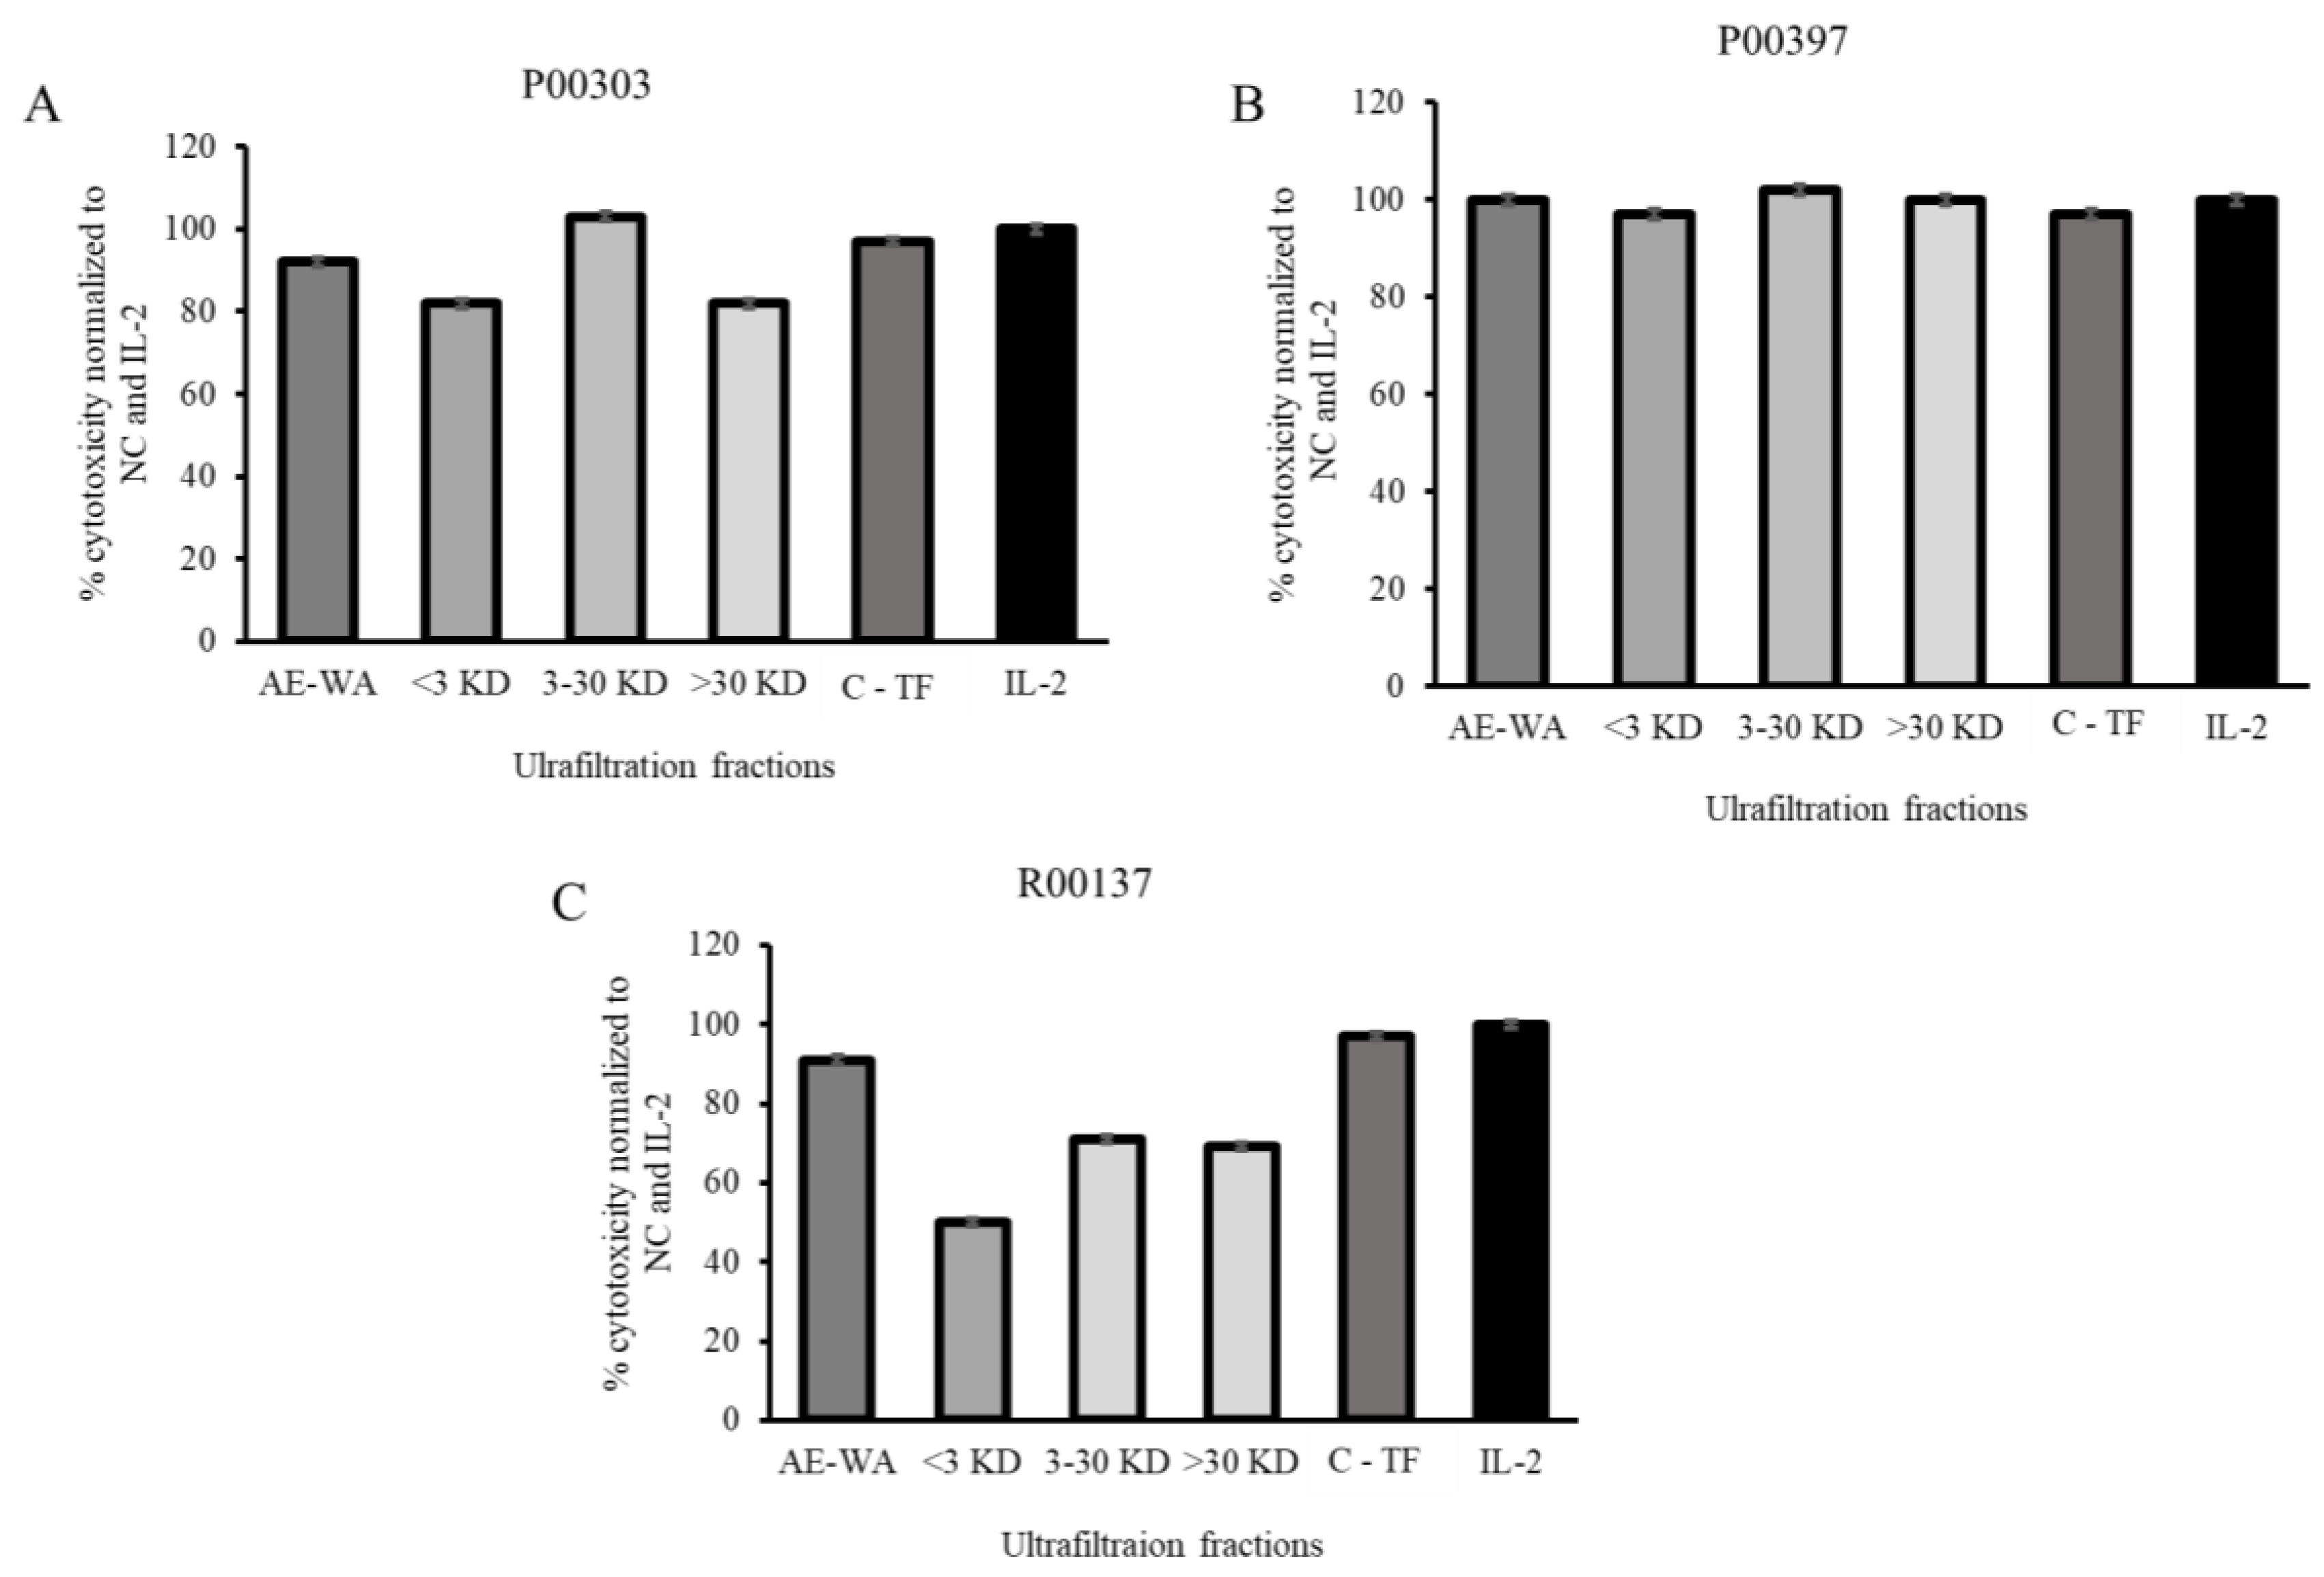
2.7. Activity of Ultrafiltrates
2.8. PBMC Cytotoxic Activity Confirmation
2.9. Protein Identification
3. Discussion
4. Materials and Methods
4.1. Plant Selection
4.2. Preparation of Aqueous Extracts
4.3. C18 Fractionation
4.4. Ultrafiltration
4.5. Bradford Assay
4.6. SDS-PAGE
4.7. Protein Identification
4.8. PBMC Cytotoxicity Assay
5. Patents
Supplementary Materials
Author Contributions
Funding
Institutional Review Board Statement
Informed Consent Statement
Data Availability Statement
Acknowledgments
Conflicts of Interest
References
- Hasselquist, D.; Nilsson, J.A. Maternal transfer of antibodies in vertebrates: Trans-generational effects on offspring immunity. Philos. Trans. R. Soc. Lond. B Biol. Sci. 2009, 364, 51–60. [Google Scholar] [CrossRef] [PubMed]
- Lawrence, H.S. The transfer in humans of delayed skin sensitivity to streptococcal M substance and to tuberculin with disrupted leukocytes. J. Clin. Investig. 1955, 34, 219–230. [Google Scholar] [CrossRef]
- Macias, A.E.; Guaní-Guerra, E. Transfer Factor: Myths and Facts. Arch. Med. Res. 2020, 51, 613–622. [Google Scholar] [CrossRef] [PubMed]
- Bloom, B.R. Does transfer factor act specifically or as an immunologic adjuvant? N. Engl. J. Med. 1973, 288, 908–909. [Google Scholar] [CrossRef] [PubMed]
- Medina-Rivero, E.; Vallejo-Castillo, L.; Vazquez-Leyva, S.; Pérez-Sánchez, G.; Favari, L.; Velasco-Velázquez, M.; Estrada-Parra, S.; Pavón, L.; Pérez-Tapia, S.M. Physicochemical Characteristics of TransferonTM Batches. Biomed. Res. Int. 2016, 2016, 7935181. [Google Scholar] [CrossRef] [PubMed]
- Lawrence, H.S.; Borkowsky, W. A new basis for the immunoregulatory activities of transfer factor An arcane dialect in the language of cells. Cell. Immunol. 1983, 82, 102–116. [Google Scholar] [CrossRef]
- Armides Franco-Molina, M.; Mendoza-Gamboa, E.; Castillo-Tello, P.; Tamez-Guerra, R.S.; Villarreal-Treviño, L.; Tijerina-Menchaca, R.; Castillo-León, L.; Zapata-Benavides, P.; Rodríguez-Padilla, C. In vitro antibacterial activity of bovine dialyzable leukocyte extract. Immunopharmacol. Immunotoxicol. 2006, 28, 471–483. [Google Scholar] [CrossRef]
- Vetvicka, V.; Fernandez-Botran, R. Non-specific immunostimulatory effects of transfer factor. Int. Clin. Pathol. J. 2020, 8, 1–6. [Google Scholar]
- Ngou, B.P.M.; Ding, P.; Jones, J.D.G. Thirty years of resistance: Zig-zag through the plant immune system. Plant Cell 2022, 34, 1447–1478. [Google Scholar] [CrossRef] [PubMed]
- Hu, Z.; Zhang, H.; Shi, K. Plant peptides in plant defense responses. Plant Signal. Behav. 2018, 13, e1475175. [Google Scholar] [CrossRef]
- Tavormina, P.; de Coninck, B.; Nikonorova, N.; de Smet, I.; Cammue, B.P.A. The plant peptidome: An expanding repertoire of structural features and biological functions. Plant Cell 2015, 27, 2095–2118. [Google Scholar] [CrossRef]
- De Bruyne, L.; Höfte, M.; De Vleesschauwer, D. Connecting growth and defense: The emerging roles of brassinosteroids and gibberellins in plant innate immunity. Mol. Plant 2014, 7, 943–959. [Google Scholar] [CrossRef] [PubMed]
- Othman, E.M.; Fathy, M.; Bekhit, A.A.; Abdel-Razik, A.H.; Jamal, A.; Nazzal, Y.; Shams, S.; Dandekar, T.; Naseem, M. Modulatory and Toxicological Perspectives on the Effects of the Small Molecule Kinetin. Molecules 2021, 26, 670. [Google Scholar] [CrossRef] [PubMed]
- Coppola, M.; Cascone, P.; Madonna, V.; Di Lelio, I.; Esposito, F.; Avitabile, C.; Romanelli, A.; Guerrieri, E.; Vitiello, A.; Pennacchio, F.; et al. Plant-to-plant communication triggered by systemin primes anti-herbivore resistance in tomato. Sci. Rep. 2017, 7, 15522. [Google Scholar] [CrossRef] [PubMed]
- Campos, M.L.; de Souza, C.M.; de Oliveira, K.B.S.; Dias, S.C.; Franco, O.L. The role of antimicrobial peptides in plant immunity. J. Exp. Bot. 2018, 69, 4997–5011. [Google Scholar] [CrossRef] [PubMed]
- de Souza Cândido, E.; e Silva Cardoso, M.H.; Sousa, D.A.; Viana, J.C.; de Oliveira-Júnior, N.G.; Miranda, V.; Franco, O.L. The use of versatile plant antimicrobial peptides in agribusiness and human health. Peptides 2014, 55, 65–78. [Google Scholar] [CrossRef] [PubMed]
- Mott, G.A.; Middleton, M.A.; Desveaux, D.; Guttman, D.S. Peptides and small molecules of the plant-pathogen apoplastic arena. Front. Plant Sci. 2014, 5, 677. [Google Scholar] [CrossRef] [PubMed]
- Barbosa Pelegrini, P.; Del Sarto, R.P.; Silva, O.N.; Franco, O.L.; Grossi-de-Sa, M.F. Antibacterial peptides from plants: What they are and how they probably work. Biochem. Res. Int. 2011, 2011, 250349. [Google Scholar] [CrossRef] [PubMed]
- Vivier, E.; Artis, D.; Colonna, M.; Diefenbach, A.; Di Santo, J.P.; Eberl, G.; Koyasu, S.; Locksley, R.M.; McKenzie, A.N.J.; Mebius, R.E.; et al. Innate Lymphoid Cells: 10 Years On. Cell 2018, 174, 1054–1066. [Google Scholar] [CrossRef]
- Becker, P.S.; Suck, G.; Nowakowska, P.; Ullrich, E.; Seifried, E.; Bader, P.; Tonn, T.; Seidl, C. Selection and expansion of natural killer cells for NK cell-based immunotherapy. Cancer Immunol. Immunother. 2016, 65, 477–484. [Google Scholar] [CrossRef] [PubMed]
- Pascal, V.; Schleinitz, N.; Brunet, C.; Ravet, S.; Bonnet, E.; Lafarge, X.; Touinssi, M.; Reviron, D.; Viallard, J.F.; Moreau, J.F.; et al. Comparative analysis of NK cell subset distribution in normal and lymphoproliferative disease of granular lymphocyte conditions. Eur. J. Immunol. 2004, 34, 2930–2940. [Google Scholar] [CrossRef] [PubMed]
- Owens, B. How plants and insects inherit immunity from their parents. Nature 2019, 575, S55–S56. [Google Scholar] [CrossRef] [PubMed]
- Kathiria, P.; Sidler, C.; Golubov, A.; Kalischuk, M.; Kawchuk, L.M.; Kovalchuk, I. Tobacco mosaic virus infection results in an increase in recombination frequency and resistance to viral, bacterial, and fungal pathogens in the progeny of infected tobacco plants. Plant Physiol. 2010, 153, 1859–1870. [Google Scholar] [CrossRef] [PubMed]
- Stotz, H.U.; Thomson, J.G.; Wang, Y. Plant defensins: Defense, development and application. Plant Signal. Behav. 2009, 4, 1010–1012. [Google Scholar] [CrossRef] [PubMed]
- Carvalho Ade, O.; Gomes, V.M. Plant defensins--prospects for the biological functions and biotechnological properties. Peptides 2009, 30, 1007–1020. [Google Scholar] [CrossRef] [PubMed]
- Lay, F.T.; Anderson, M.A. Defensins--components of the innate immune system in plants. Curr. Protein Pept. Sci. 2005, 6, 85–101. [Google Scholar] [CrossRef]
- Terras, F.R.G.; Eggermont, K.; Kovaleva, V.; Raikhel, N.V.; Osborn, R.W.; Kester, A.; Rees, S.B.; Torrekens, S.; Van Leuven, F.; Vanderleyden, J. Small cysteine-rich antifungal proteins from radish: Their role in host defense. Plant Cell 1995, 7, 573–588. [Google Scholar] [PubMed]
- Sagehashi, Y.; Oguro, Y.; Tochihara, T.; Oikawa, T.; Tanaka, H.; Kawata, M.; Takagi, M.; Yatou, O.; Takaku, H. Purification and cDNA cloning of a defensin in Brassica juncea, its functional expression in Escherichia coli, and assessment of its antifungal activity. J. Pestic. Sci. 2013, 38, 33–38. [Google Scholar] [CrossRef]
- Aerts, A.M.; Carmona-Gutierrez, D.; Lefevre, S.; Govaert, G.; François, I.; Madeo, F.; Santos, R.; Cammue, B.P.; Thevissen, K. The antifungal plant defensin RsAFP2 from radish induces apoptosis in a metacaspase independent way in Candida albicans. FEBS Lett. 2009, 15, 2513–2516. [Google Scholar] [CrossRef]
- Wong, J.H.; Ng, T.B. Sesquin, a potent defensin-like antimicrobial peptide from ground beans with inhibitory activities toward tumor cells and HIV-1 reverse transcriptase. Peptides 2005, 26, 1120–1126. [Google Scholar] [CrossRef]
- Aerts, A.M.; Thevissen, K.; Bresseleers, S.M.; Sels, J.; Wouters, P.; Cammue, B.P.; François, I.E. Arabidopsis thaliana plants expressing human beta-defensin-2 are more resistant to fungal attack: Functional homology between plant and human defensins. Plant Cell Rep. 2007, 26, 1391–1398. [Google Scholar] [CrossRef] [PubMed]
- Ishihama, Y.; Oda, Y.; Tabata, T.; Sato, T.; Nagasu, T.; Rappsilber, J.; Mann, M. Exponentially modified protein abundance index (emPAI) for estimation of absolute protein amount in proteomics by the number of sequenced peptides per protein. Mol. Cell. Proteom. 2005, 4, 1265–1272. [Google Scholar] [CrossRef] [PubMed]
- Somanchi, S.S.; McCulley, K.J.; Somanchi, A.; Chan, L.L.; Lee, D.A. A Novel Method for Assessment of Natural Killer Cell Cytotoxicity Using Image Cytometry. PLoS ONE 2015, 10, e0141074. [Google Scholar] [CrossRef] [PubMed]


| NO. | UP_ID | Species | Common Names | Part | Extract * |
|---|---|---|---|---|---|
| 1 | P00303 | Raphanus sativus | Radish | Seed | AE |
| 2 | P00397 | Brassica juncea | Mustard greens | Seed | AE |
| 3 | P00477 | Dendrocalamus strictus | Calcutta Bamboo | Seed | AE |
| 4 | P00703 | Alstonia scholaris | Blackboard tree | Bark | AE |
| 5 | P08435 | Sorghum bicolor | Great millet | Leaf-Stem | AE |
| 6 | P09153 | Solanum incanum | Bitter apple | Fruit | AE |
| 7 | P09495 | Zea mays | Corn | Corn silk | AE |
| 8 | R00137 | Cocos nucifera | Coconut | Fruit meat | AE |
| 9 | R00659 | Beta vulgaris | Beet | Root | AE |
| 10 | R00813 | Taraxacum officinale | Common dandelion | Leaf | AE |
| 11 | R00918 | Psoralea corylifolia | Babchi | Fruit | AE |
| ID | Species | Part | Extract (mg) | WA (mg) | WA-50ME | 50ME (mg) | 50–100ME | 100ME (mg) |
|---|---|---|---|---|---|---|---|---|
| C-TF | - | - | 1017.3 | 1342.0 | 57.7 | 21.2 | 7.4 | 8.2 |
| P00303 | Raphanus sativus | seed | 2657.0 | 2889.5 | 134.5 | 285.7 | 40.7 | 17.7 |
| P00397 | Brassica juncea | seed | 2083.7 | 2959.4 | 120.5 | 133.4 | 16.6 | 14.6 |
| R00137 | Cocos nucifera | endosperm | 894.4 | 468.7 | 54.6 | 29.6 | 6.5 | 7.6 |
| WA Fraction ID | <3 kDa (mg) (%) | 3–30 kDa (mg) (%) | >30 kDa (mg) (%) |
|---|---|---|---|
| P00303-AE-WA | 146.5 (93%) | 4.0 (2.5%) | 5.7 (3.6%) |
| P00397-AE-WA | 145.0 (86%) | 22.0 (13%) | 2.3 (1.4%) |
| R00137-AE-WA | 191.3 (95%) | 5.4 (2.7%) | 4.5 (2.2%) |
| C-TF-WA | 151.1 (85%) | 6.0 (3.4%) | 19.9 (11%) |
| Accession No. | Protein Name | emPAI | emPAI % | MW (kDa) | % Homology to R. sativus | Function |
|---|---|---|---|---|---|---|
| gi|75107016 | Napin-3 (Brassica napus) | 2.31 | 20.68% | 14 | 76% | Seed storage |
| gi|2440726951 | 2S seed storage protein 4 (Raphanus sativus) | 2.11 | 18.89% | 20 | … | Seed storage |
| gi|2440684703 | 2S seed storage protein 4 (Raphanus sativus) | 2.09 | 18.71% | 20 | … | Seed storage |
| gi|2440727854 | 2S seed storage protein 4 (Raphanus sativus) | 0.77 | 6.89% | 20 | … | Seed storage |
| gi|2440715477 | 2S seed storage protein 4 (Raphanus sativus) | 0.76 | 6.80% | 20 | … | Seed storage |
| gi|2334152968 | Bifunctional inhibitor/plant lipid transfer protein/seed storage helical domain-containing protein (Hirschfeldia incana) | 0.61 | 5.46% | 12 | 96% | Seed storage |
| gi|2440706739 | Defensin-like protein 192 (Raphanus sativus) | 0.34 | 3.04% | 19 | … | Plant defense |
| gi|2440694918 | 2S seed storage protein 4 (Raphanus sativus) | 0.33 | 2.95% | 20 | … | Seed storage |
| gi|2440692911 | kunitz trypsin inhibitor 1 (Raphanus sativus) | 0.30 | 2.69% | 22 | … | Plant defense |
| gi|2440724679 | Uncharacterized protein Rs2_04757 (Raphanus sativus) | 0.29 | 2.60% | 22 | … | Unknown |
| gi|2440690659 | hypothetical protein Rs2_41200 (Raphanus sativus) | 0.27 | 2.42% | 24 | … | Unknown |
| gi|2440695549 | hypothetical protein Rs2_38119 (Raphanus sativus) | 0.26 | 2.33% | 24 | … | Unknown |
| gi|2334151640 | Expansin (Hirschfeldia incana) | 0.23 | 2.06% | 28 | 28% | Cell wall adaptation |
| gi|2440696312 | Receptor-like serine/threonine-protein kinase SD1-8 (Raphanus sativus) | 0.15 | 1.34% | 41 | … | Cell signaling |
| gi|2440721862 | Putative F-box protein (Raphanus sativus) | 0.14 | 1.25% | 43 | … | Various |
| gi|2440686810 | hypothetical protein Rs2_45685 (Raphanus sativus) | 0.11 | 0.98% | 56 | … | Unknown |
| gi|2440688317 | Octicosapeptide/Phox/Bem1p (PB1) domain-containing protein/TPR-containing protein (Raphanus sativus) | 0.10 | 0.90% | 65 | Various |
| Accession No. | Protein Name | emPAI | emPAI % | MW (kDa) | % Homology to B. juncea | Function |
|---|---|---|---|---|---|---|
| gi|75107016 | Napin-3 (Brassica napus) | 6.90 | 19.76% | 14.04 | 79% | storage |
| gi|32363444 | Allergen Bra j 1-E (Brassica juncea) | 6.21 | 17.78% | 14.65 | … | storage |
| gi|2440684703 | 2S seed storage protein 4 (Raphanus sativus) | 4.44 | 12.71% | 20.14 | 84% | storage |
| gi|2440727853 | 2S seed storage protein 4 (Raphanus sativus) | 2.23 | 6.39% | 20.83 | 85% | storage |
| gi|112747 | Napin embryo-specific (Brassica napus) | 2.19 | 6.27% | 21.02 | 82% | storage |
| gi|2440727854 | 2S seed storage protein 4 (Raphanus sativus) | 1.66 | 4.75% | 19.94 | 85% | storage |
| gi|2440715477 | 2S seed storage protein 4 (Raphanus sativus) | 1.65 | 4.73% | 19.97 | 82% | storage |
| gi|32363456 | Chitin-binding allergen Bra r 2 (Brassica rapa) | 1.59 | 4.55% | 10.05 | 54% | Plant defense |
| gi|2334156319 | Em-like protein GEA6 (Hirschfeldia incana) | 0.64 | 1.83% | 9.62 | 98% | Seed desiccation |
| gi|2440698549 | Protein kinase superfamily protein (Raphanus sativus) | 0.49 | 1.40% | 12.02 | None | Various |
| gi|2334145742 | Uncharacterized protein HA466_0114050 (Hirschfeldia incana) | 0.46 | 1.32% | 12.65 | None | Unknown |
| gi|2334145261 | Ubiquitin-like domain-containing protein (Hirschfeldia incana) | 0.39 | 1.12% | 14.68 | 99% | Protein degradation |
| gi|2440705679 | hypothetical protein Rs2_30933 (Raphanus sativus) | 0.33 | 0.95% | 16.65 | None | Unknown |
| gi|2334150478 | Protein C2-DOMAIN ABA-RELATED 6 (Hirschfeldia incana) | 0.31 | 0.89% | 18.16 | None | Stress response |
| gi|2440696237 | Uncharacterized protein Rs2_38807 (Raphanus sativus) | 0.30 | 0.86% | 18.46 | None | Unknown |
| gi|2334153535 | Superoxide dismutase (Hirschfeldia incana) | 0.25 | 0.72% | 21.67 | 64% | Antioxidation |
| gi|2440703857 | Protein kinase domain protein (Raphanus sativus) | 0.25 | 0.72% | 21.60 | 42% | Various |
| gi|2334159199 | hypothetical protein HA466_0029400 (Hirschfeldia incana) | 0.22 | 0.63% | 24.38 | 44% | Unknown |
| gi|2440688376 | hypothetical protein Rs2_44277 (Raphanus sativus) | 0.21 | 0.60% | 25.27 | None | Unknown |
| gi|2440705714 | Pathogenesis-related thaumatin superfamily protein (Raphanus sativus) | 0.20 | 0.57% | 27.09 | 34% | Plant defense |
| gi|2440692471 | PHD finger protein ALFIN-LIKE 6 (Raphanus sativus) | 0.19 | 0.54% | 27.77 | None | Stress response |
| gi|2334151640 | Expansin (Hirschfeldia incana) | 0.18 | 0.52% | 27.91 | 30% | Cell wall adaptation |
| gi|2440685386 | Myrosinase 2 (Raphanus sativus) | 0.17 | 0.49% | 30.84 | 93% | Plant defense |
| gi|2440689373 | Helitron-like N domain-containing protein (Raphanus sativus) | 0.16 | 0.46% | 32.31 | 94% | Gene transposase |
| gi|2440719378 | Mitochondrial uncoupling protein 1 (Raphanus sativus) | 0.16 | 0.46% | 32.47 | None | Antioxidation |
| gi|2334151314 | E3 ubiquitin-protein ligase RHC1A (Hirschfeldia incana) | 0.15 | 0.43% | 35.83 | None | Protein degradation |
| gi|2440695821 | hypothetical protein Rs2_38391 (Raphanus sativus) | 0.14 | 0.40% | 38.70 | None | Unknown |
| gi|2440678052 | FAD-dependent oxidoreductase family protein (Raphanus sativus) | 0.13 | 0.37% | 39.62 | None | Amino acid biology |
| gi|2440680072 | Tubby-like F-box protein 10 (Raphanus sativus) | 0.13 | 0.37% | 41.35 | 33% | Stress response |
| gi|2440692001 | Lipase class 3-related protein (Raphanus sativus) | 0.13 | 0.37% | 40.28 | None | Lipid metabolism |
| gi|2440700075 | Protein kinase superfamily protein (Raphanus sativus) | 0.13 | 0.37% | 40.87 | None | Various |
| gi|2440705359 | DNAJ heat shock N-terminal domain-containing protein (Raphanus sativus) | 0.13 | 0.37% | 41.18 | 52% | Stress response |
| gi|2440681029 | FAD/NAD(P)-binding oxidoreductase family protein (Raphanus sativus) | 0.12 | 0.34% | 44.88 | None | Amino acid biology |
| gi|2440697078 | hypothetical protein Rs2_32681 (Raphanus sativus) | 0.12 | 0.34% | 43.46 | None | Unknown |
| gi|2440697973 | Protein RESTRICTED TEV MOVEMENT 2 (Raphanus sativus) | 0.12 | 0.34% | 43.38 | None | Stress response |
| gi|2440691863 | Mitochondrial transcription termination factor family protein (Raphanus sativus) | 0.11 | 0.32% | 47.22 | None | Gene regulation |
| gi|2440701438 | hypothetical protein Rs2_26692 (Raphanus sativus) | 0.11 | 0.32% | 49.30 | None | Unknown |
| gi|2440680808 | RNA-binding (RRM/RBD/RNP motifs) family protein (Raphanus sativus) | 0.10 | 0.29% | 51.49 | 27% | Transcription/ translation |
| gi|2440716970 | Pectin lyase-like superfamily protein (Raphanus sativus) | 0.10 | 0.29% | 50.06 | None | Cell wall adaptation |
| gi|2440719117 | IQ-domain 3 (Raphanus sativus) | 0.10 | 0.29% | 49.60 | None | Calcium signaling |
| gi|2440724245 | putative F-box protein (Raphanus sativus) | 0.10 | 0.29% | 52.44 | 36% | Various |
| gi|2440686810 | hypothetical protein Rs2_45685 (Raphanus sativus) | 0.09 | 0.26% | 56.45 | None | Unknown |
| gi|2334150521 | Uncharacterized protein HA466_0085320 (Hirschfeldia incana) | 0.09 | 0.26% | 55.38 | 44% | Unknown |
| gi|2440685993 | Ypt/Rab-GAP domain of gyp1p superfamily protein (Raphanus sativus) | 0.09 | 0.26% | 58.83 | None | Vesicle trafficking |
| gi|2440688005 | Aldehyde dehydrogenase family 2 member C4 (Raphanus sativus) | 0.09 | 0.26% | 54.28 | None | Stress response |
| gi|2440731844 | Uncharacterized protein Rs2_02820 (Raphanus sativus) | 0.08 | 0.23% | 61.32 | None | Unknown |
| gi|2440693227 | Sulfate transporter 1.2 (Raphanus sativus) | 0.07 | 0.20% | 71.79 | 96% | Mineral uptake |
| gi|2440700872 | hypothetical protein Rs2_26126 (Raphanus sativus) | 0.07 | 0.20% | 74.34 | None | Unknown |
| gi|2440678058 | DNA polymerase alpha catalytic subunit (Raphanus sativus) | 0.06 | 0.17% | 87.06 | None | DNA replication |
| gi|2440685990 | Phosphatidylinositol 4-phosphate 5-kinase 6 (Raphanus sativus) | 0.06 | 0.17% | 81.50 | None | Endocytosis |
| gi|2440706207 | hypothetical protein Rs2_31461 (Raphanus sativus) | 0.06 | 0.17% | 84.60 | None | Unknown |
| gi|2440732392 | tRNAse Z3 (Raphanus sativus) | 0.06 | 0.17% | 89.65 | None | tRNA synthesis |
| gi|2334151474 | ENTH domain-containing protein (Hirschfeldia incana) | 0.05 | 0.14% | 98.92 | None | Vesicle transport |
| gi|2334153854 | Protein NETWORKED 2D (Hirschfeldia incana) | 0.05 | 0.14% | 107.60 | 36% | Cytoskeleton |
| gi|2334157830 | Leucine-rich repeat receptor-like serine/threonine-protein kinase BAM3 (Hirschfeldia incana) | 0.05 | 0.14% | 109.52 | None | Root and leaf growth |
| gi|2440683401 | Lon protease-like protein 1 (Raphanus sativus) | 0.05 | 0.14% | 109.31 | None | Protein degradation |
| gi|2440684207 | Villin-5 (Raphanus sativus) | 0.05 | 0.14% | 94.83 | None | Cytoskeleton |
| gi|2440702903 | hypothetical protein Rs2_28157 (Raphanus sativus) | 0.05 | 0.14% | 100.50 | 79% | Unknown |
| gi|2334154967 | PHD-type domain-containing protein (Hirschfeldia incana) | 0.04 | 0.11% | 136.74 | 38% | Various |
| gi|2440711253 | Leucine-rich repeat transmembrane protein kinase (Raphanus sativus) | 0.04 | 0.11% | 114.72 | None | Stress response |
| gi|2440696774 | E3 ubiquitin-protein ligase PRT6 (Raphanus sativus) | 0.02 | 0.06% | 221.34 | None | Protein degradation |
Disclaimer/Publisher’s Note: The statements, opinions and data contained in all publications are solely those of the individual author(s) and contributor(s) and not of MDPI and/or the editor(s). MDPI and/or the editor(s) disclaim responsibility for any injury to people or property resulting from any ideas, methods, instructions or products referred to in the content. |
© 2023 by the authors. Licensee MDPI, Basel, Switzerland. This article is an open access article distributed under the terms and conditions of the Creative Commons Attribution (CC BY) license (https://creativecommons.org/licenses/by/4.0/).
Share and Cite
Yimam, M.; Horm, T.; Cai, S.; O’Neal, A.; Jiao, P.; Hong, M.; Tea, T.; Jia, Q. Discovery of Transfer Factors in Plant-Derived Proteins and an In Vitro Assessment of Their Immunological Activities. Molecules 2023, 28, 7961. https://doi.org/10.3390/molecules28247961
Yimam M, Horm T, Cai S, O’Neal A, Jiao P, Hong M, Tea T, Jia Q. Discovery of Transfer Factors in Plant-Derived Proteins and an In Vitro Assessment of Their Immunological Activities. Molecules. 2023; 28(24):7961. https://doi.org/10.3390/molecules28247961
Chicago/Turabian StyleYimam, Mesfin, Teresa Horm, Shengxin Cai, Alexandria O’Neal, Ping Jiao, Mei Hong, Thida Tea, and Qi Jia. 2023. "Discovery of Transfer Factors in Plant-Derived Proteins and an In Vitro Assessment of Their Immunological Activities" Molecules 28, no. 24: 7961. https://doi.org/10.3390/molecules28247961