Article

Excitation-Controlled Host–Guest Multicolor Luminescence in Lanthanide-Doped Calcium Zirconate for Information Encryption

1
School of Materials Science and Engineering, Liaocheng University, Liaocheng 252059, China
2
College of Science, Civil Aviation University of China, Tianjin 300300, China
*
Authors to whom correspondence should be addressed.
Molecules 2023, 28(22), 7623; https://doi.org/10.3390/molecules28227623
Submission received: 1 October 2023 / Revised: 5 November 2023 / Accepted: 13 November 2023 / Published: 16 November 2023

Abstract

:
Efficient control over lanthanide luminescence by regulating excitations offers a real-time and reversible luminescence-managing strategy, which is of great importance and highly desirable for various applications, including multicolor display and information encryption. Herein, we studied the crystal structure, luminescence properties, and mechanisms of undoped and Tb3+/Eu3+-doped CaZrO3 in detail. The intrinsic purple-blue luminescence from host CaZrO3 and the introduced green/red luminescence from guest dopants Tb3+/Eu3+ were found to have different excitation mechanisms and, therefore, different excitation wavelength ranges. This enables the regulation of luminescent color through controlling the excitation wavelengths of Tb3+/Eu3+-doped CaZrO3. Furthermore, preliminary applications for information encryption with these materials were demonstrated using portable UV lamps of 254 and 302 nm. This study not only promotes the development of multicolor luminescence regulation in fixed-composition materials, but also advances the practical applications of lanthanide luminescent materials in visually readable, high-level anti-counterfeiting and information encryption.

1. Introduction

Luminescent materials that emit various colors of light under different excitation conditions provide a simple and common means of multicolor display, imaging, security, and information encryption [1,2]. Among the various luminescent materials, lanthanide-based materials are one of the most attractive classes for researchers aiming to acquire excitation-dependent luminescence due to their unique and extensive advantages, such as rich and tunable emission bands (covering the near-infrared, visible and ultraviolet regions), narrow excitation and emission bands (for the major 4f–4f transitions), large Stokes or anti-Stokes shift, and high photostability [3,4].
A widely used strategy is integrating downconversion luminescence with upconversion luminescence. For example, NaGdF4:Yb,Tm@NaYF4:Tb@EuSe nanocomposites emit blue and purple light under 365 nm UV and 980 nm NIR irradiation, respectively [5]; NaYF4:Yb/Er@NaTbF4:Eu microcrystals show green and red light under 980 nm laser and 365 nm UV excitation, respectively [6]. Many similar systems, such as lanthanide-doped NaLuF4/Y2O3 composites [7], NaGdF4:Yb/Tm@NaGdF4:Ce/Mn@NaYF4 nanoparticles [8], CaSc2O4:Yb/Tb phosphors [9], and LiYbF4:Y@LiGdF4:Yb/Tm@LiYF4:Eu nanoparticles [10], also generate principally similar upconversion/downconversion emissions by altering excitation wavelengths. Furthermore, designing orthogonal upconversion processes in multilayer nanocrystals [11,12,13,14] or nanoclusters [15] can also provide varied colors of luminescence under different excitation wavelengths. For example, NaYF4:Yb/Tm@NaYF4@NaYF4:Er/Ho@NaYF4 nanocrystals have blue and yellow emissions upon 980 and 1532 nm laser excitation, respectively [16], and LiREF4-based core/sextuple-shell Yb,Tm/Gd/Yb,Er/Nd/Gd/Er,Tm/Gd nanocrystals emit blue, green, and red light under 980, 800, and 1532 nm excitation, respectively [12]. Although incorporating excitation-dependent upconversion has proven to be a robust method, it is obvious that the elaborate construction of a material structure is often necessary in order to prevent cross-relaxation-induced loss of excitation energy, and that excitation lasers of limited wavelengths, such as 808, 980, and 1532 nm, can be selected for upconversion luminescence. In addition, in upconversion-only luminescent systems, modulating the pulse duration or repetition frequency of the excitation laser can tailor the luminescent color efficiently and almost continuously [17,18], but this method undoubtedly relies on a complex excitation light source system.
Another major class of current luminescent materials possessing excitation-dependent luminescence usually incorporates different luminous ions with different excitation wavelengths [19], such as by co-doping Er3+ (shows green emission under 360–380 nm excitations) and Eu2+ (shows red emission under 250–320 nm excitations) in La4GeO8 [20], co-doping Er3+ (shows green emission under 362–380 nm excitations) and Pr3+ (shows red emission under 200–400 nm excitations) in NaNbO3 and Ca2Nb2O7 [21,22], and co-doping Tb3+ and Eu3+ for a tunable color from yellow to pink when increasing the excitation wavelength from 254 to 365 nm [23]. This type of luminescence modulation, independent of upconversion, supports a continuous color control when applying a continuous change in excitation wavelengths. Except for the management of luminous ions, the luminescence of host materials may offer new opportunities to achieve excitation-dependent luminescence. However, this has not attracted much attention to date, and there are very few examples: Cs3TbCl6 nanocrystals produce blue luminescence of the host under 365 nm excitation, while the green luminescence of Tb3+ is produced under 254 nm excitation, enabling colorful luminescence from green to blue under 260–360 nm excitations [24]. KLu3F10:Tb crystals emit blue light from defects in KLu3F10 under 365 nm excitation and green light from Tb3+ under 254 nm excitation, with the luminescence tuning from green to blue under 250–370 nm excitations [25]. Combining the self-trapped exciton luminescence of the matrix and the luminescence of doped lanthanide ions, Cs2Ag0.3Na0.7InCl6:Yb3+/Eu3+/Ho3+ microcrystals display yellow, red, and green light under 300, 394, and 980 nm excitations, respectively [26], and a similar phenomenon has been found in ZrO2:Gd3+ nanoparticles [27]. It is obvious that more effort is needed in order to explore host-luminescence-assisted robust luminescence modulation under varied excitation wavelengths.
Previous reports have shown that CaZrO3, one ABO3-type perovskite oxide, can emit an intense purple-blue light with a broad emission band ranging from about 350 to 550 nm under excitations of 200–300 nm, where the excitation is derived from the host absorption and the emission derives from the oxygen-defect-related radiative transitions [28,29]. Importantly, the distorted perovskite structure of CaZrO3 provides two kinds of lattice sites with different symmetries, eight-fold-coordinated Ca2+ sites and six-fold-coordinated Zr4+ sites to accommodate various trivalent lanthanide ions (Ln3+) for multimode and multicolor luminescence [30,31,32,33,34,35]. Great progress has been made in the research on doping chemistry and luminescence properties in CaZrO3 in the last decade or so. For example, Kunti et al. investigated the structural and luminescence properties of CaZrO3:Eu3+ phosphors and disclosed the role of oxygen vacancy in the origin of the host CaZrO3 emissions and the energy transfer mechanism through detailed experimental and theoretical research [36]. Zhang et al. achieved tunable, full-color luminescence by managing the composition and doping concentration in Tb3+/Eu3+-doped CaZrO3 phosphors [37]. Very recently, Ueda et al. revealed that doped Eu3+ ions occupy not only A sites, but also B sites, in CaZrO3, and that co-doping ions of different sizes can regulate the site-occupation proportions as well as the site-dependent Eu3+ luminescence [38]. However, it is clear that adjusting the dopant concentration [36,39] and introducing ions of different luminous colors, including different Ln3+ ions [37,40] and non-rare-earth ions [41,42], are still the principal strategies by which to achieve multicolor luminescence; therefore, multicolor luminescence is still absent in composition-fixed Ln3+-doped CaZrO3. In addition, for the recently studied Tb3+/Eu3+ co-doped colorful phosphors beyond CaZrO3, such as La4GeO8:Tb/Eu [43], K5Eu(MoO4)4:Tb [44], MgF2:Tb/Eu [45], K3Lu(PO4)2:Tb/Eu [46], Sr3MgSi2O8:Eu/Tb [47], and Gd2B2WO9:Eu/Tb [48], excitation-dependent multicolor luminescence is also very rare.
In this work, we achieved multicolor luminescence in Tb3+/Eu3+-doped CaZrO3 by managing not only the luminous ions, but also the excitation wavelengths. We introduced green and red luminescence in purple-blue-emitting CaZrO3 polycrystalline powders by doping Tb3+ and Eu3+, respectively. We investigated the doping chemistry of Tb3+/Eu3+ in CaZrO3 and the luminescence properties, as well as the mechanism. The results revealed that the luminescence from the host CaZrO3 and from guest dopants Tb3+ and Eu3+ go through completely different energy paths and require excitation light in different wavelength regions. This allows us to control the luminescent color of these materials by succinctly modulating excitation wavelengths. In addition, we demonstrated a group of prototypes to be utilized for anti-counterfeiting and information encryption using undoped and Tb3+/Eu3+-doped CaZrO3.

2. Results and Discussion

2.1. Structural and Compositional Analysis of Undoped and Tb3+/Eu3+-Doped CaZrO3

The CaZrO3 crystal adopted a distorted perovskite GdFeO3-type structure (Figure 1a), wherein the array of ZrO6 octahedra constituted the crystal structure network and Ca2+ ions were interspersed among ZrO6 octahedra [41,49]. The rotation of the ZrO6 octahedra led to a decrease in the coordination number (CN) of Ca2+ from 12 to 8 [39]; thus, the dopants Tb3+/Eu3+ would theoretically prefer to be located at the asymmetric 8-fold-coordinated Ca2+ sites because of a lower degree of mismatch in effective ionic radii (1.18/1.206 Å of Tb3+/Eu3+ and 1.26 Å of Ca2+ when CN = 8) compared with the symmetric 6-fold-coordinated Zr4+ sites (1.063/1.087 Å of Tb3+/Eu3+ and 0.86 Å of Zr4+ when CN = 6) [50].
Powder X-ray diffraction (XRD) patterns of as-synthesized pristine CaZrO3, CaZrO3:Tb3+, CaZrO3:Eu3+, and CaZrO3:Tb3+/Eu3+ powders are shown in Figure 1b and Figure S1a, and all the diffraction peaks of samples with Tb3+/Eu3+ concentrations lower than 6% can be well-indexed to the standard diffraction peaks of orthorhombic CaZrO3 (PDF card No. 35–0645), suggesting the successful integration of Tb3+/Eu3+ into the CaZrO3 matrix. A close observation of the XRD patterns revealed a few negligible impurity peaks at 28.5°–30.2° when the Tb3+/Eu3+ concentrations were larger than 6%, which was most likely due to the formation of trace amounts of Tb2O3/Eu2O3 impurities. The diffraction peak positions of the (202) planes slightly shifted toward the large-angle side after Tb3+/Eu3+ doping (Figure S1b), implying a shrinking of the crystal lattice owing to the substitution of big Ca2+ by small Tb3+/Eu3+. A reverse shift to the small-angle side was also observed at high Tb3+/Eu3+ doping concentrations, which suggests that Tb3+/Eu3+ ions occupy not only Ca2+ sites, but also Zr4+ sites. Partial substitution for Zr4+ sites is reasoned as a self-compensation for the charge imbalance caused by substituting Ca2+ sites, being described as: Ln Ca + Ln Zr (Ln = Tb, Eu). This has been definitively verified in recent research [38], and will also be reflected in the latter spectra of CaZrO3:Eu3+.
We conducted Rietveld refinement to evaluate the change in crystal structure induced by Tb3+/Eu3+ doping. Relevant results for undoped CaZrO3 and representative CaZrO3:4%Tb3+/0.5%Eu3+ are given in Figure 1c,d and Table S2. Based on the reliable refinement and the good agreement between the calculated and measured patterns, both samples possessed pure orthorhombic structures with the Pnma space group. It is worth noting that the values of lattice cell parameters, including a, b, c, and V, showed only an extremely negligible reduction after Tb3+/Eu3+ doping. For example, the cell volume V shrank very slightly, from 258.39 to 258.08 Å3. This result further confirms the speculation that a fair fraction of Tb3+/Eu3+ ions substitute smaller Zr4+ ions to offset the lattice shrinkage caused by substituting bigger Ca2+ ions. In the meanwhile, the deviation of lattice cell parameters between doped and undoped samples was less than 1%, implying no second-phase emergence and the successful doping of Tb3+/Eu3+. The slightly high Rp values for both undoped and Tb3+/Eu3+-doped samples may have been due to the relatively strong background signal in the XRD patterns, which was likely due to the slightly low crystallinity. However, due to the consistent measurement conditions as well as the refinement results for both the undoped and doped samples, it probably had no effect on the comparison of their crystal structure data.
The representative SEM image of CaZrO3:4%Tb3+/0.5%Eu3+ shows agglomerates of irregular nanoparticles with sizes about 150–350 nm (Figure 1e), which may indicate slightly low crystallinity of the obtained samples. The two-dimensional elemental mapping results in Figure 1f indicate the existence of Tb and Eu elements in the CaZrO3 crystals, which was also proven by the clearly identified peaks from Zr, Ca, Tb, and Eu in the EDS spectrum in Figure 1g. This EDS analysis further verified the successful doping of Tb3+/Eu3+ ions in CaZrO3. XPS spectra of the representative CaZrO3:4%Tb3+/0.5%Eu3+ sample show the peaks of not only the Ca, Zr and O elements from the host, but also Tb and Eu elements from the dopants (Figure 1h). Two peaks, around 1242.1 and 1277.0 eV, were the typical XPS peaks of Tb3+ 3d5/2 and Tb3+ 3d3/2, and two around 1134.7 and 1164.2 eV were the characteristic peaks of Eu3+ 3d5/2 and Eu3+ 3d3/2 [51], respectively, suggesting the successful introduction of Tb3+/Eu3+ into CaZrO3.

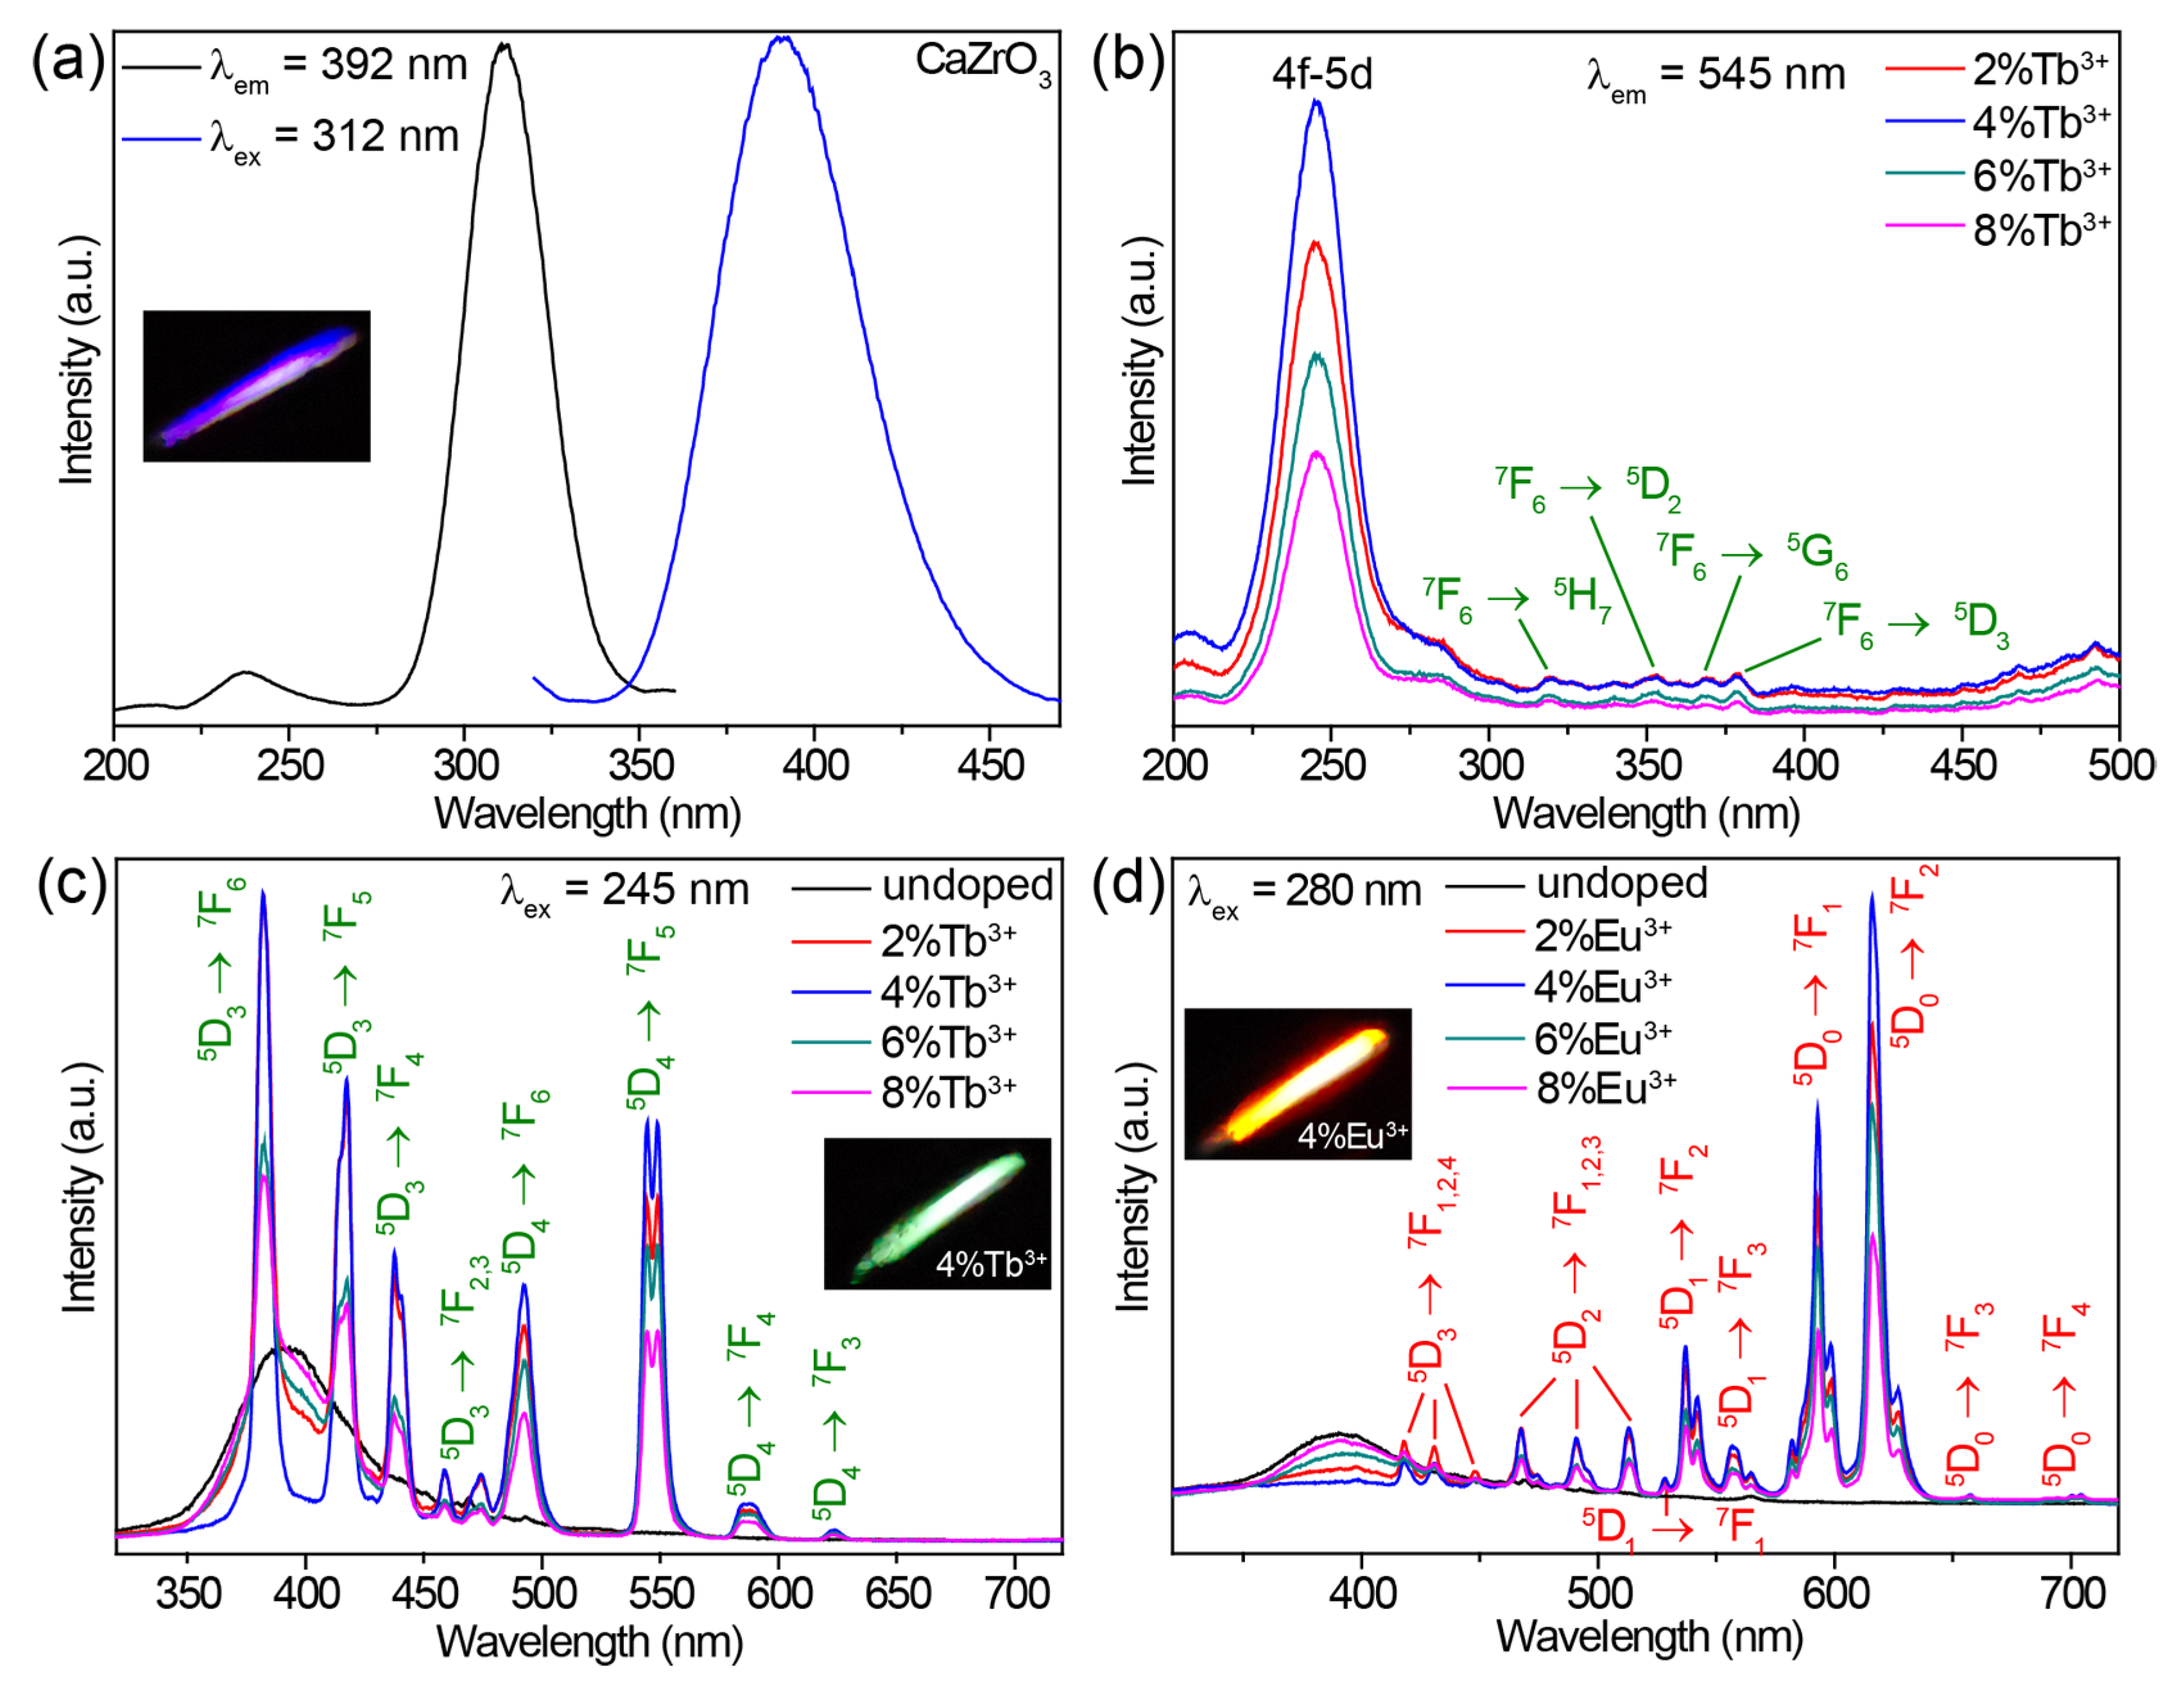
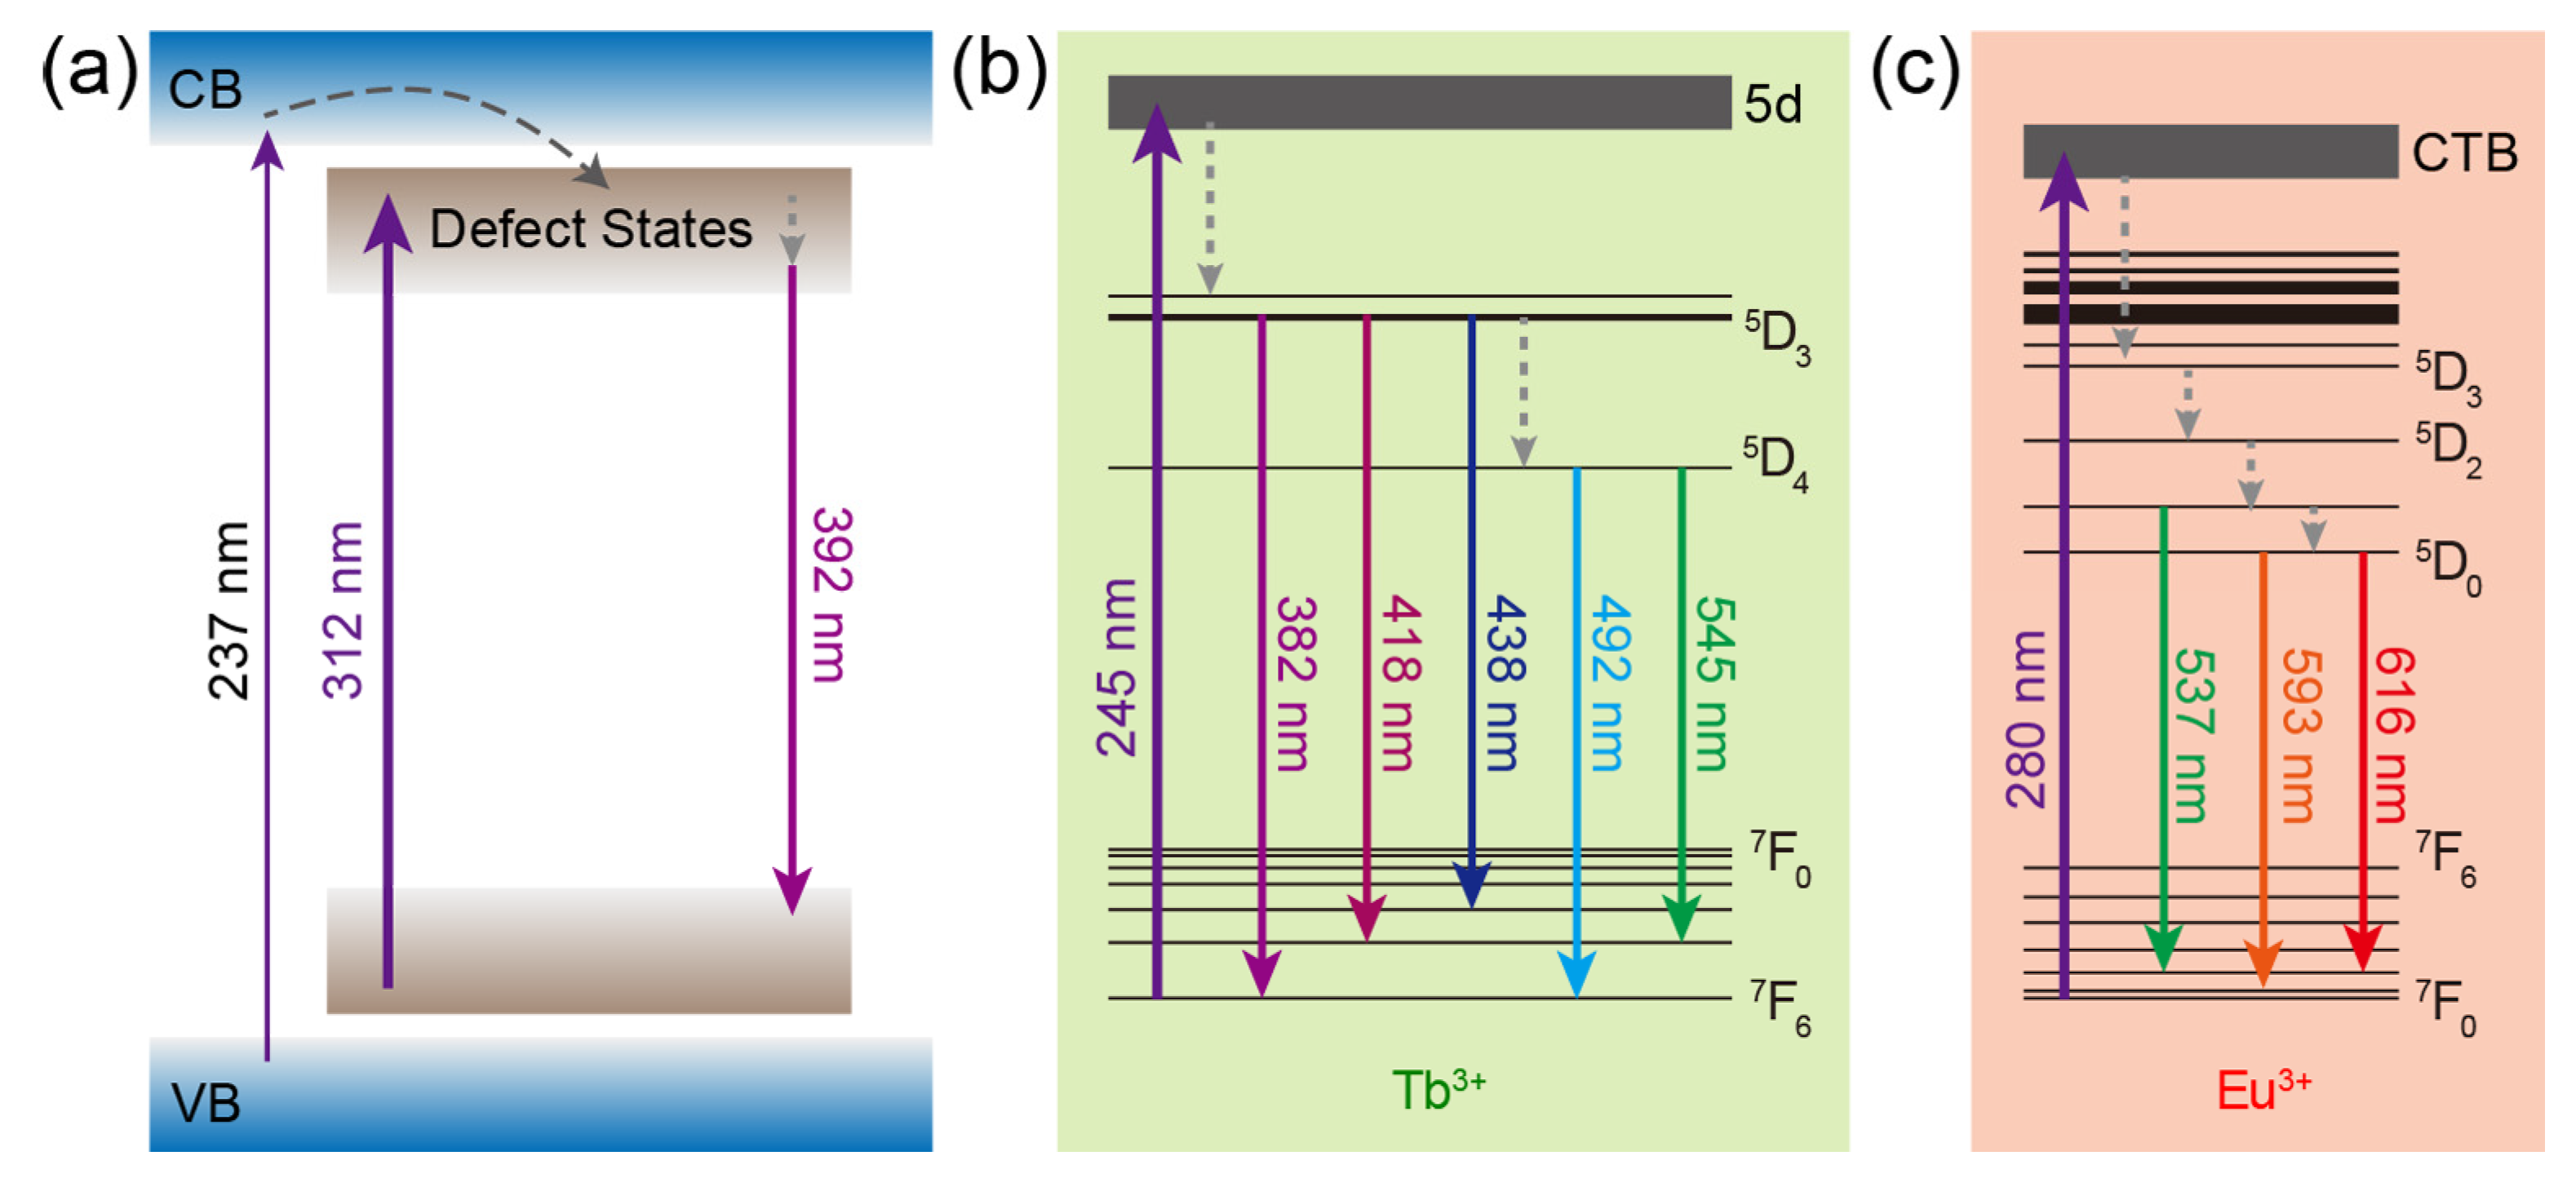
2.2. Luminescent Properties and Mechanisms of Undoped CaZrO3, CaZrO3:Tb3+, and CaZrO3:Eu3+

The undoped CaZrO3 sample exhibited a broad emission band centered at 392 nm under 312 nm excitation (Figure 2a). A bright purple-blue luminescence is shown in the inset of Figure 2a. When monitoring the 392 nm emission, an excitation spectrum comprising a strong band of around 312 nm, along with a weak band of around 237 nm, was obtained (Figure 2a). The excitation and emission mechanisms of undoped CaZrO3 have been thoroughly explored, both theoretically and experimentally, in previous research. The weak excitation band at 237 nm (5.23 eV) can be attributed to the absorption of CaZrO3 (that is, the band-gap transition) as a result of O2− → Zr4+ electron transfer in ZrO6 octahedra, according to previous reports [28,29]. The similar value of the band gap energy (5.55 eV, 223 nm) obtained from the absorption spectrum of CaZrO3 verified this definitively (Figure S2). The intense excitation band around 312 nm may have been due to the absorption of oxygen vacancies, which generated defect states in the bandgap of CaZrO3 [52]. These oxygen vacancies were a singly ionized oxygen vacancy ( V O ) and doubly ionized one ( V O ), and occurred in the form of complex [CaO7· V O ], [CaO7· V O ], [ZrO5· V O ], and [ZrO5· V O ] clusters generated during the high temperature synthesis processes [29,36]. The emission band stemmed from the radiative transitions of deep oxygen vacancy states.
Doping Tb3+ or Eu3+ ions into CaZrO3 changed the luminescent properties significantly. The excitation spectra of CaZrO3:Tb3+ (2–8%) monitoring Tb3+ emission at 545 nm are presented in Figure 2b. All excitation spectra showed strong and broad excitation bands centered at 245 nm and several weak and narrow excitation peaks in the range of 310–380 nm. These weak and narrow excitation peaks matched a series of Tb3+ 4f–4f transitions well. The intense and broad excitation band could be attributed to the characteristic absorption from the 4f–5d transitions of Tb3+ [53,54]. The completely different excitation band position around 245 nm compared with the main excitation band around 312 nm of undoped CaZrO3 could exclude the host’s absorption of CaZrO3. This was further confirmed by the emission spectra under 312 nm excitation (Figure S3a). Obviously, the intense excitation at 312 nm of undoped CaZrO3 was unable to trigger the luminescence of Tb3+ at all. Furthermore, the almost identical excitation band positions at 245 nm for samples with varied Tb3+ concentrations also opposed the possible Tb3+-doping-induced shift of the host absorption band. Figure 2c compares the emission spectra of CaZrO3:Tb3+ (0–8%) under 245 nm excitation, showing that CaZrO3:Tb3+ (2–8%) presented a series of strong and narrow emission peaks originating from the characteristic 4f–4f transitions of Tb3+. The broad emission bands around 392 nm from the host CaZrO3 still appeared, although the intensity was reduced. This is because the excitation wavelength of 245 nm overlapped with the tail of the excitation band for host emission. The Tb3+ luminescence reached the highest intensity in CaZrO3:4%Tb3+, and concentrations greater than 4% led to a decline in intensity due to concentration quenching. Digital photographs display the bright green luminescence of CaZrO3:Tb3+ (2–8%) (the inset in Figure 2c and Figure S3b).
The excitation spectra of CaZrO3:Eu3+ (2–8%) in Figure S4a show a broad band around 280 nm and several narrow peaks. These narrow excitation peaks are all from the 4f–4f transitions of Eu3+ as marked. The broad excitation band around 280 nm is ascribed to the charge transfer (CT) transitions from O 2p states to Eu 4f states [38,39,55]. Similarly, the significant difference (about 32 nm) in the excitation band positions between CaZrO3:Eu3+ and undoped CaZrO3, together with the almost identical excitation band positions at 280 nm for samples with varied Eu3+ concentrations, also rule out the possibility of host absorption from CaZrO3. When excited by 280 nm UV light, CaZrO3:Eu3+ (2–8%) samples showed a series of sharp emissions from Eu3+ 4f–4f transitions in the visible region, as well as a weak and wide emission band around 392 nm from the host CaZrO3 (Figure 2d). The obviously stronger emissions at 593 and 616 nm made the overall luminescence bright red for CaZrO3:Eu3+ (the inset in Figure 2d and Figure S4b). As is known, the local symmetry of Eu3+ ions determines the relative intensity between the 616 nm emission from 5D07F2 electric dipole transitions and the 593 nm emission from 5D07F1 magnetic dipole transitions [56]. The emission at 616 nm dominated in the emission spectrum for Eu3+ ions in asymmetric lattice sites, while the 593 nm emission was dominant for Eu3+ ions in symmetric sites. Herein, the slightly weaker emission intensity at 593 nm compared with 616 nm revealed that a fair amount of Eu3+ ions were located at the symmetric centers of the ZrO6 octahedra. This is consistent with the negligible changes in crystal structure parameters after doping Tb3+/Eu3+. A concentration quenching causing a drop in luminescence intensity was also observed when the Eu3+ concentration was greater than 4%. In addition, Eu3+ ions could also be efficiently excited by their own 4f–4f transitions, but we did not focus on this in the present research because the sharp excitation peak did not lead to a continuous change in luminescence color when tuning excitation wavelengths.
We explored the mechanism of the concentration-quenching phenomenon in CaZrO3:Tb3+ and CaZrO3:Eu3+. As is well known to us, increasing the doping concentration of activators causes decreased interionic distance and promotes non-radiative energy transfer among activators [57]. We first estimated the critical distance (Rc) among Tb3+/Eu3+ ions in CaZrO3 using the Blasse formula [58]:
R c = 2 ( 3 V 4 π X c Z ) 1 / 3
where V is the unit cell volume (258.3 Å3 for CaZrO3), Xc is the critical doping concentration (0.04 for Tb3+/Eu3+ herein), and Z is the number of lattice sites available for Tb3+ or Eu3+ occupation per unit cell (Z = 4 for CaZrO3). The calculated Rc was about 14.56 Å; thus, the exchange interaction could be excluded from the possible mechanism of concentration quenching because it mainly occurred when Rc was less than 5 Å. Therefore, we reasoned that the multipole–multipole interaction was principally responsible for the concentration quenching. We further determined the mode of multipole–multipole interaction to be dipole–dipole interaction (find details in the Supporting Information and Figure S5). Therefore, the concentration quenching in CaZrO3:Tb3+ and CaZrO3:Eu3+ can be attributed to electric dipole–dipole interaction.
The mechanisms of luminescence from CaZrO3, CaZrO3:Tb3+, and CaZrO3:Eu3+ are summarized and depicted in Figure 3. For CaZrO3, the excitation of electrons from the ground levels to the excited levels of defect states, the subsequent non-radiative transitions to deep defect states, and the following radiative recombinations were the main energy paths, meanwhile weak excitation could also be accessed by the band-gap transitions and the subsequent energy transfer to the defect states (Figure 3a). In CaZrO3:Tb3+, the main mechanism for Tb3+ luminescence was the self-excitation of Tb3+ through 4f–5d transitions followed by the radiative 4f–4f transitions, accompanied by some non-radiative transitions (Figure 3b). As for CaZrO3:Eu3+, the main luminescent mechanism was the excitation by the O2− → Eu3+ charge transfer transitions, which led to the described radiative 4f–4f transitions of Eu3+ (Figure 3c). It is obvious that the main excitation channels for the luminescence from host CaZrO3 and dopants Tb3+ and Eu3+ were completely different, as were the excitation wavelengths.

2.3. Luminescent Properties and Mechanisms of CaZrO3:Tb3+/Eu3+

When co-doping Tb3+ and Eu3+ ions into CaZrO3, we obtained the emissions of Tb3+ and Eu3+ simultaneously in a single material. The excitation spectra of CaZrO3:4%Tb3+/0.5%Eu3+ monitoring the 545 nm emission of Tb3+ and the 616 nm emission of Eu3+ show two broad excitation bands centered at 245 and 273 nm, respectively (Figure 4a). These two bands were almost identical to the excitation bands in Tb3+-singly-doped and Eu3+-singly-doped CaZrO3; therefore, it is reasonable to allocate them to the 4f–5d transitions of Tb3+ and the O2− → Eu3+ charge transfer transitions, respectively. The excitation band at 245 nm for Tb3+ 545 nm emissions showed no shift in peak position, but only a decrease in intensity when the concentration of Eu3+ was increased from 0.5% to 6% (Figure S6a), because doping Eu3+ induces the gradual weakening of Tb3+ luminescence. The increase in the excitation band, which was around 273 nm for Eu3+ 616 nm emissions, implies an opposite trend regarding Eu3+ emission intensity (Figure S6b). To obtain intensity-comparable luminescence from both Tb3+ and Eu3+, we selected 255 nm, approximately located at the intersection of the two excitation bands, as the excitation wavelength to obtain the emission spectra.
As shown in Figure 4b, when increasing the concentration of Eu3+ in CaZrO3:4%Tb3+/xEu3+ (x = 0–6%), the characteristic emissions of Eu3+ became gradually stronger, while the emission intensity of Tb3+ showed the opposite trend under the excitation of 255 nm. This fits well with the luminescent color change from green to red (Figure 4c). Additionally, the broad emission band around 392 nm in the host CaZrO3 maintained a low intensity in all Tb3+/Eu3+-doubly-doped CaZrO3 under the excitation of 255 nm. For a Tb3+ emission decline by adding Eu3+ content, the unchanged content of Tb3+ could exclude the possible effect of cross-relaxation (CR) processes (such as familiar CR: 5D3 + 7F65D4 + 7F0,1) between Tb3+ ions. Additional Eu3+ content could increase the CR processes between Tb3+ and Eu3+, as in Figure 4d, mainly including CR1: 5D3 (Tb3+) + 7FJ (Eu3+) → 7FJ (Tb3+) + 5D3 (Eu3+) and CR2: 5D4 (Tb3+) + 7FJ (Eu3+) → 7FJ (Tb3+) + 5D0,1 (Eu3+). These CR processes would promote the generation of Eu3+-emissive levels of 5D0 and 5D1 while dissipating Tb3+-emissive levels of 5D3 and 5D4, leading to the Tb3+ → Eu3+ energy transfer, which is widely considered to be the reason for decreasing Tb3+ emissions [59,60]. In addition, the Eu3+ emissions of CaZrO3:4%Tb3+/xEu3+ samples continue to enhance slightly when the Eu3+ concentration is 6%, which exceeds the optimal doping concentration of Eu3+ singly-doped samples, which is 4%. This could be attributed to possible compensation by the Tb3+ → Eu3+ energy transfer to increased concentration quenching between Eu3+ ions. Therefore, the main luminescent mechanism in CaZrO3:Tb3+/Eu3+ can be described as follows (Figure 4d): Being excited by the 4f–5d transitions, Tb3+ ions can not only emit light through radiative 4f–4f transitions, but also transfer partial excitation energy to Eu3+ through CR1 and CR2 processes. Then, excited Eu3+ ions emit light through radiative 4–4f transitions; Eu3+ ions can also be excited by O2− → Eu3+ charge transfer transitions.
The luminescence decay curves monitoring the 545 nm emissions of CaZrO3:4%Tb3+/xEu3+ (x = 0–6%) under 255 nm excitation are shown in Figure 5a. These decay curves show obvious non-exponential patterns, especially for Tb3+/Eu3+-co-doped samples, so the effective lifetime was adopted and calculated using the following equation:
τ eff = t I ( t ) d t I ( t ) d t
where I(t) is the luminescence intensity at time t. The calculated values of the effective lifetimes of the Tb3+ 545 nm emission decreased from 1.345 to 0.119 ms as the concentration of Eu3+ increased from 0 to 6% in CaZrO3:4%Tb3+/xEu3+ (Figure 5b). This downward trend in lifetime implies the gradually reduced probability of Tb3+ 5D47F5 radiative transitions being due to the energy transfer from Tb3+ to Eu3+. The efficiency of this energy transfer (ηET) was estimated based on the following equation:
ηET = (1 − τ/τ0) × 100%
where τ0 and τ are the lifetimes of Tb3+ 545 nm emissions without and with co-doped Eu3+, respectively. The calculated values of ηET were 26.39%, 42.90%, 73.38%, 85.58%, and 91.15% for 0.5%, 1%, 2%, 4%, and 6% Eu3+ in CaZrO3:4%Tb3+/xEu3+, respectively (Figure 5b).
To determine the energy transfer mechanism, the critical distance between Tb3+ and Eu3+ was calculated to be 14.00 Å using the Equation (1), indicating that the multipole–multipole interaction dominates the energy transfer processes. The following formula for the relationship between the lifetime and the doping concentration was used to further disclose the mode of multipole–multipole interaction [51]:
τ 0 τ C n / 3
where C is the total concentration of Tb3+ and Eu3+, and the values of n at 6, 8, and 10 correspond to dipole–dipole, dipole–quadrupole, and quadrupole–quadrupole interaction, respectively. The dependences of τ0/τ on Cn/3 were plotted and fitted linearly, as shown in Figure 5c–e. The optimal fitting coefficient R2 was obtained at n = 6, suggesting that the main energy transfer mechanism was a dipole–dipole interaction.
Luminescence decay analysis according to the Inokuti–Hirayama (I-H) model also revealed the multipole–multipole interaction mechanism between Tb3+ and Eu3+ [61]. The I-H model described the luminescence decay intensity I(t) at time t using the following equation:
  I ( t )   = I 0 exp [ ( t τ 0 )     Q ( t τ 0 ) 3 / s ]
where I0 is the intensity when t = 0; τ0 is the intrinsic lifetime of Tb3+ without Eu3+ (1.345 ms), and Q is the energy transfer parameter, defined as:
Q = 4 π 3 Γ ( 1     3 s ) N 0 R 0 3
where Γ is the Euler function, N0 is the Eu3+ concentration, and R0 is the critical distance. The values of S at 6, 8, and 10 correspond to dipole–dipole, dipole–quadrupole, and quadrupole–quadrupole interactions, respectively. As shown in Figure 5a, the decay curves of CaZrO3:4%Tb3+/xEu3+ (x = 0.5–6%) samples were fitted well by Equation (5) at S = 6. The energy transfer parameter Q, achieved from the fitting process, showed an almost linear dependence on Eu3+ concentration (Figure 5b), as reflected by Equation (6). This result further corroborates the notion that the dipole–dipole interaction was mainly responsible for the Tb3+ → Eu3+ energy transfer.

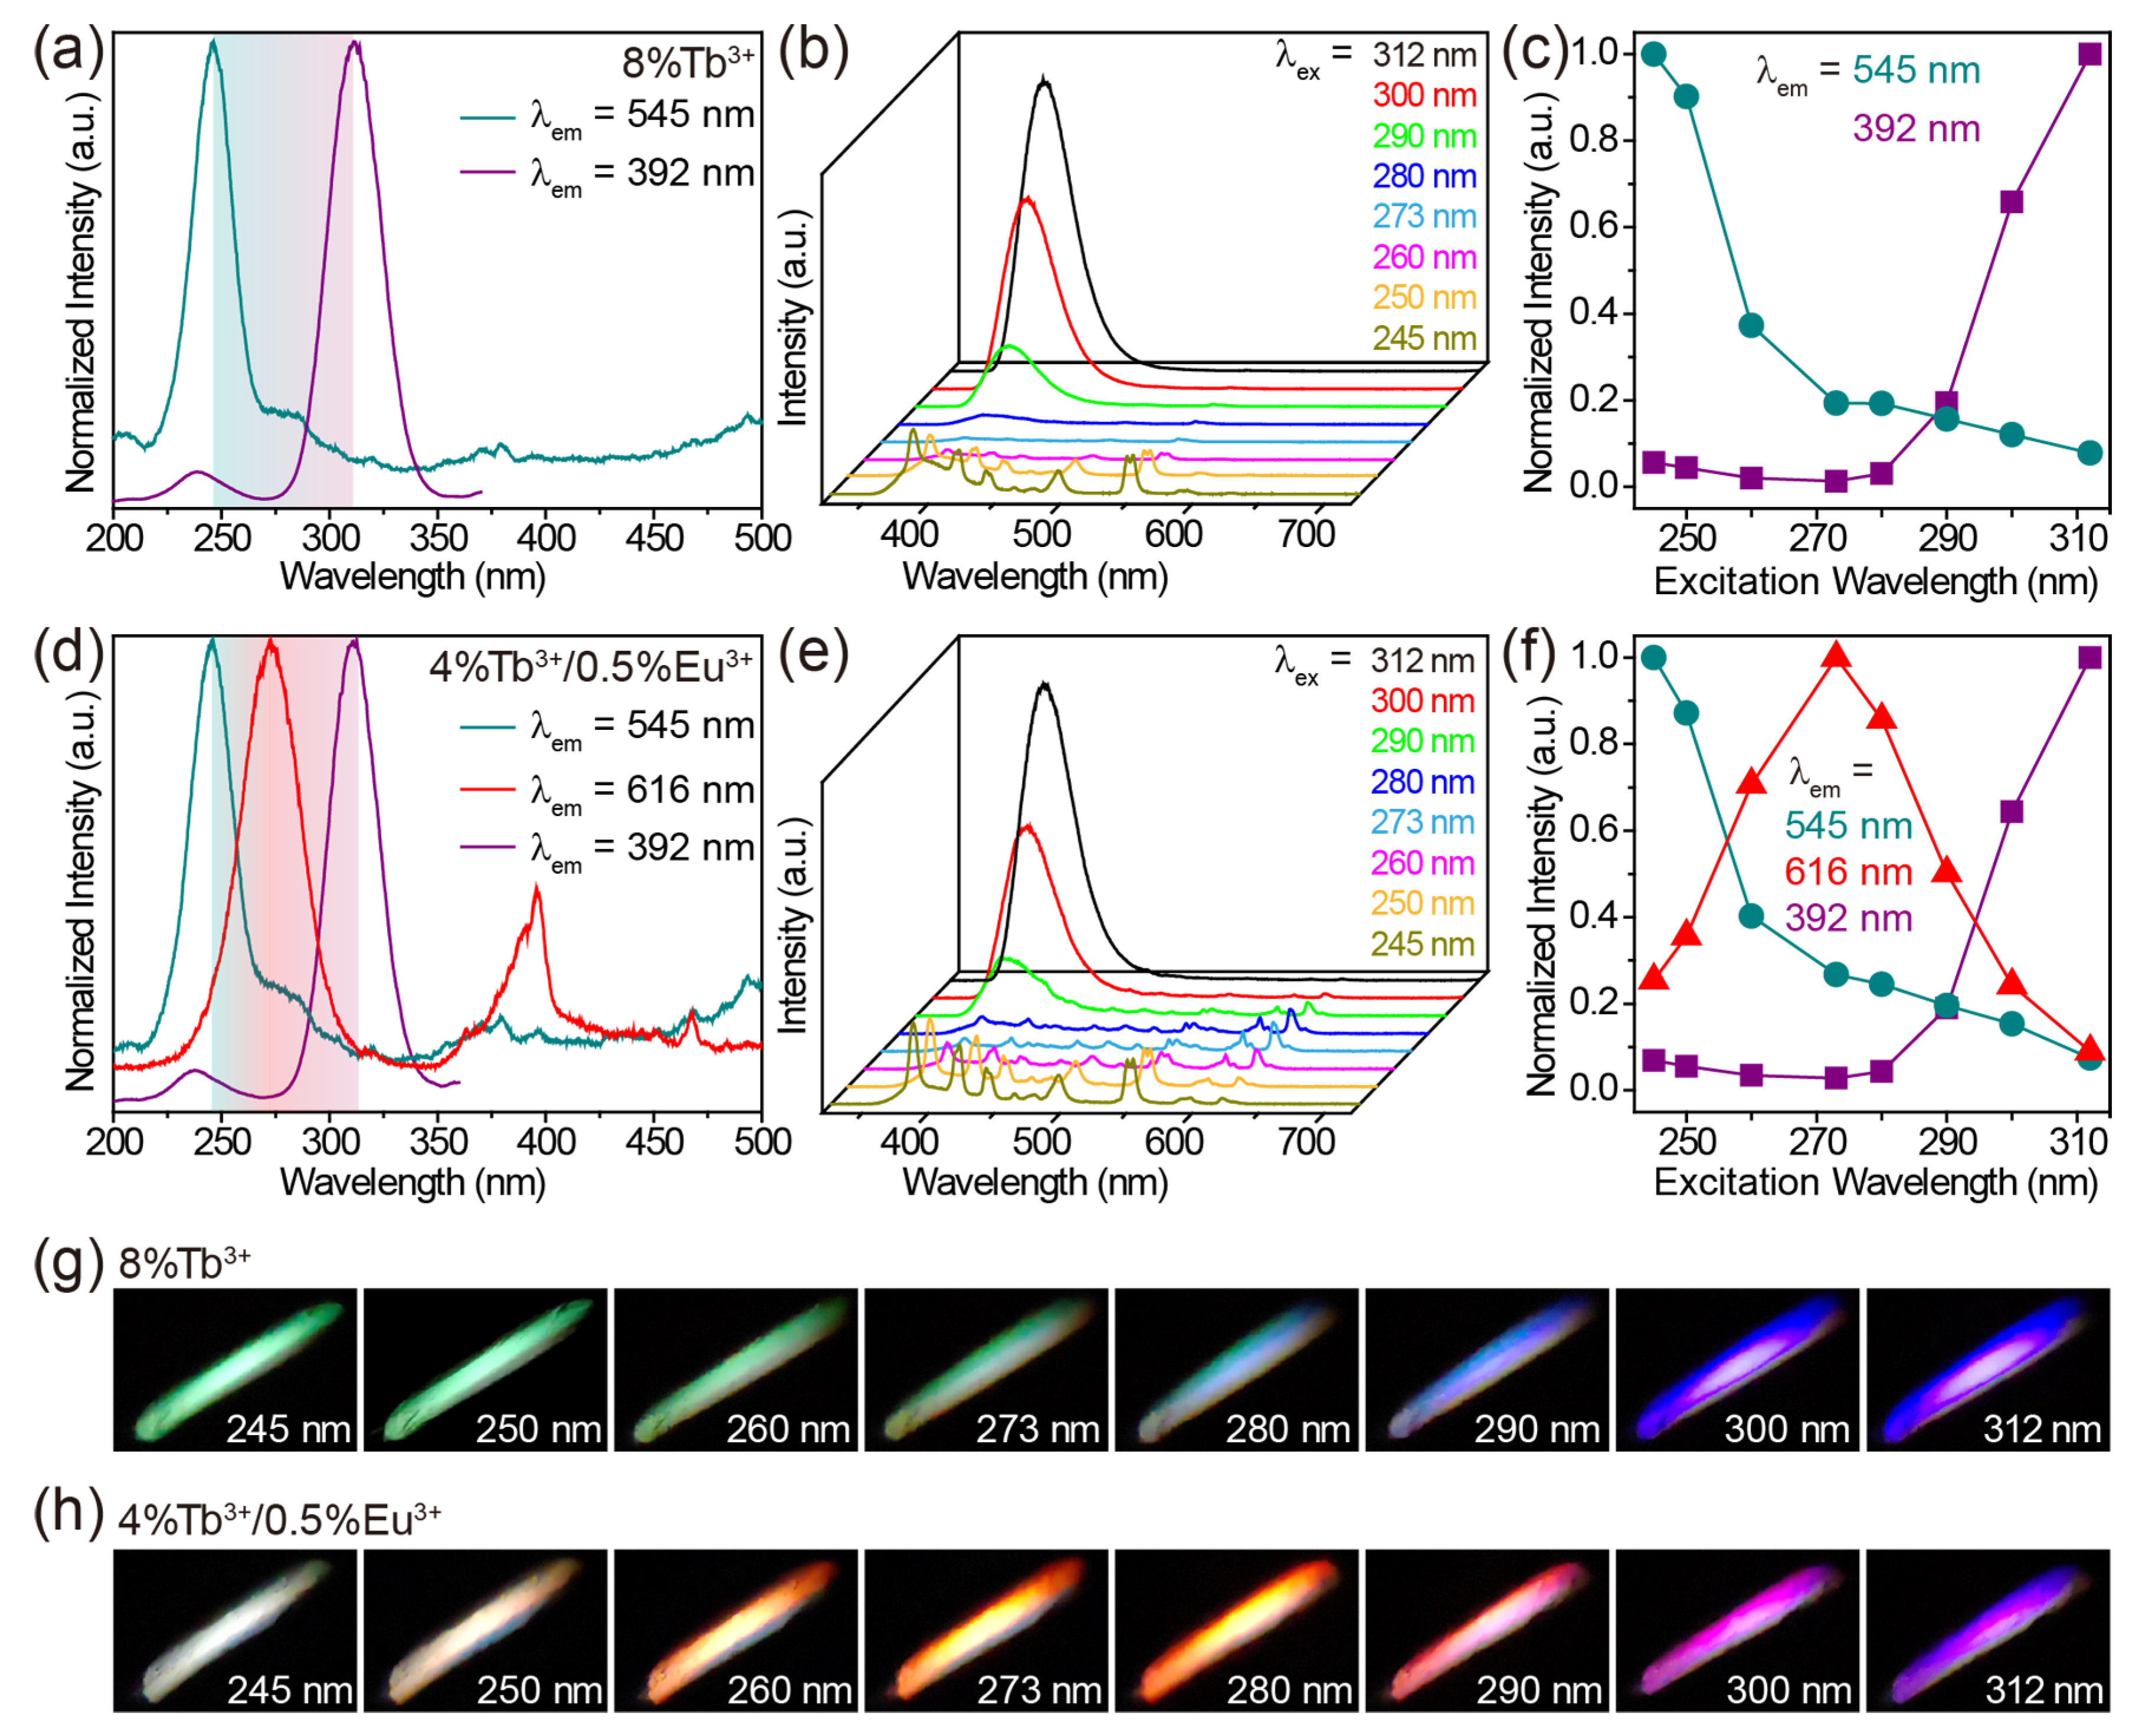
2.4. Excitation Controlled Multicolor Luminescence

On the basis of the above results, it is clear that the purple-blue luminescence of the host CaZrO3, the green luminescence of Tb3+ and the red luminescence of Eu3+ could be achieved under distinctly different excitation wavelengths in Tb3+/Eu3+-doped CaZrO3. This allows us to manipulate the luminescence color of these materials by simply controlling the excitation wavelengths, without the need to change the composition of the material. For Tb3+-singly-doped, Eu3+-singly-doped, and Tb3+/Eu3+-doubly-doped CaZrO3, we selected CaZrO3:8%Tb3+, CaZrO3:6%Eu3+, and CaZrO3:4%Tb3+/0.5%Eu3+, respectively, for excitation wavelength-dependent luminescence research as the strongest emissions from the host CaZrO3 at 392 nm in their respective groups (Figure S7). In CaZrO3:8%Tb3+, the optimal excitation wavelengths for 545 nm luminescence of Tb3+ and 392 nm luminescence of host CaZrO3 were 245 and 312 nm, respectively (Figure 6a). Thus, changing the excitation wavelength from 245 to 312 nm led to a gradual decrease in Tb3+ luminescence and a gradual increase in CaZrO3 luminescence (Figure 6b,c). The photographs show a luminescent color evolution from green to purple-blue under excitation at increased wavelengths (Figure 6g). For CaZrO3:6%Eu3+, we tuned the luminescent color from red to wine red by gradually increasing the excitation wavelength from 280 to 312 nm (Figure S8). Purple-blue emissions were not obtained due to the relatively large degree of overlap between the two excitation bands for the 616 and 392 nm emissions (Figure S8a). In CaZrO3:4%Tb3+/0.5%Eu3+, richer emission color variations were achieved. As shown in Figure 6d, the most effective excitation wavelengths for green emission at 545 nm, red emission at 616 nm, and purple-blue emission at 392 nm were 245, 273, and 312 nm, respectively. Therefore, when the excitation wavelengths were set to vary from 245 to 312 nm, the emissions of Tb3+ were gradually reduced. The emissions of host CaZrO3 were first slightly reduced, then significantly enhanced, while the emissions of Eu3+ experienced a significant rise and then a significant decline (Figure 6e,f). For the overall luminescence, the color varied from white to red, and to purple in the end (Figure 6h). A white, instead of green, luminescence was obtained under the 245 nm excitation, as it was a mixture of several intensity-comparable emissions in the range of 400–550 nm from both the CaZrO3 and Tb3+ hosts.

2.5. Cases of Information Encryption

The excitation-dependent multicolor luminescence of Tb3+/Eu3+-doped CaZrO3 suggests possible applications in the fields of optical anti-counterfeiting and information encryption. We established a series of luminescent patterns by selectively coating slurries of luminescent samples on PMMA plates engraved with designed patterns. As shown in Figure 7a, the “LCU” patterns, composed of CaZrO3:8%Tb3+, CaZrO3:6%Eu3+, and CaZrO3:4%Tb3+/0.5%Eu3+, were green, red, and light-red under 254 nm UV light, and blue, wine-red, and purple-blue under 302 nm UV light, respectively. This demonstrates the potential application of these materials in high-level anti-counterfeiting. In Figure 7b, it is shown that all signal points in a 3 × 8 dot matrix composed of both CaZrO3 and CaZrO3:8%Tb3+ emitted blue light under 302 nm UV light; however, the points of CaZrO3:8%Tb3+ turned to green, while the points of CaZrO3 remained blue under 254 nm UV light. This reveals latent optical information and can be decoded as a binary code using “1” and “0”; furthermore, the obtained 8-bit ASCII codes from the three rows of light signal can be read out as “LCU”. This preliminary experiment may provide great opportunities for optical information encryption and storage.

3. Materials and Methods

3.1. Materials and Synthesis

The reagents used in the synthesis of undoped CaZrO3, CaZrO3:Tb3+, CaZrO3:Eu3+, and CaZrO3:Tb3+/Eu3+ phosphors include CaCO3 (99.99%, Aladdin), ZrO2 (99.99%, Aladdin), Tb2O3 (99.99%, Aladdin), and Eu2O3 (99.99%, Aladdin). All reagents were used without further purification. The high temperature, solid-state reaction method was used for sample synthesis. The stoichiometric contents of CaCO3, ZrO2, Tb2O3, and Eu2O3 were weighed and ground completely for 30 min with an agate mortar (details of each doped sample can be found in Table S1 of the Supporting Information). Note that all of the doping percentages of lanthanide ions are atomic percentages in this work, and lanthanide ions were supposed to replace calcium ions. The mixture was transferred into an aluminum oxide crucible and sintered at 600 °C for 5 h. Then, the cooled mixture was ground again for 20 min using an agate mortar and heated to 1200 °C for 6 h. After cooling down to room temperature, the product was ground for another 10 min and collected for further use. All the sintering processes occurred under atmospheric conditions, and all heating and cooling rates were set to 5 °C/min.

3.2. Characterization

Powder X-ray diffraction patterns were recorded on a Bruker D8 Advance diffractometer with Cu Kα radiation as the incident beam. Scanning electron microscopy (SEM) measurements and the energy-dispersive X-ray spectroscopy (EDS) elemental analysis were conducted using a field emission scanning electron microscope (Thermo Fisher Scientific (Waltham, MA, USA) FIB-SEM GX4). X-ray photoelectron spectroscopy (XPS) analysis was carried out using an XPS Microprobe (Thermo SCIENTIFIC ESCALAB Xi+). The absorption spectra were collected with a UV-3600 UV-VIS-NIR spectrophotometer from Shimadzu (Kyoto, Japan). The excitation and emission spectra were measured by means of a Hitachi (Chiyoda City, Japan) F-7000 fluorescence spectrophotometer. The decay curves were obtained using an Edinburgh Instruments (Livingston, UK) FLS920 fluorescent spectrometer with a μs flash lamp as the excitation source.

3.3. Methods to Establish the Luminescent Patterns for Anti-Counterfeiting and Optical Information Encryption

Firstly, 2 g of as-prepared undoped CaZrO3, CaZrO3:8%Tb3+, CaZrO3:6%Eu3+, or CaZrO3:4%Tb3+/0.5%Eu3+ was mixed with 5 g of PVA aqueous solution, then underwent ultrasonic treatment to form a slurry. Then, the slurry was selectively coated on the patterned PMMA plate by dripping before being dried at 70 °C for 1 h. Photographs of the luminescent patterns were taken with a smartphone under 254 or 302 nm UV light in a dark box.

4. Conclusions

In summary, we synthesized undoped CaZrO3 with purple-blue luminescence and introduced green and red luminescence by doping lanthanide ions Tb3+ and Eu3+, respectively. In-depth research revealed the distinctly different excitation energy paths for luminescence from host CaZrO3 and dopants Tb3+ and Eu3+. This allowed the optimal excitation wavelengths to move away from each other to achieve luminescence in host CaZrO3 and dopants Tb3+ and Eu3+, which allowed us elaborative control of the luminescent color by modulating excitation wavelengths only in composition-fixed CaZrO3:Tb3+, CaZrO3:Eu3+ and CaZrO3:Tb3+/Eu3+. Thereafter, we demonstrated preliminary cases of applications for optical anti-counterfeiting and information encryption using this group of materials and common UV lamps. This study not only offers a generally applicable design strategy for multicolor luminescent regulation without the need to change the composition of the material, but will also help to develop advanced luminescent multi-functional rare-earth materials.

Supplementary Materials

The following supporting information can be downloaded at https://www.mdpi.com/article/10.3390/molecules28227623/s1: Figure S1: Powder XRD patterns; Figure S2: Absorption spectrum and plot of (αhν)2 versus photo energy of CaZrO3; Figure S3: Emission spectra of CaZrO3:Tb3+ under 312 nm excitation, photographs of CaZrO3:Tb3+ under 245 nm excitation; Figure S4: Excitation spectra of CaZrO3:Eu3+ (2–8%), photographs of CaZrO3:Eu3+ (0–8%) under 280 nm excitation; Figure S5: Dependences of Log (I/x) against Log (x) for CaZrO3:Tb3+ (2–8%) and CaZrO3:Eu3+ (2–8%); Figure S6: Excitation spectra of CaZrO3:4%Tb3+/xEu3+ (x = 0.5–6%); Figure S7: Emission spectra of CaZrO3:Tb3+, CaZrO3:Eu3+ and CaZrO3:4%Tb3+/xEu3+ under 312 nm excitation; Figure S8: Excitation spectra, emission spectra, emission intensity variation, and luminescent photographs of CaZrO3:6%Eu3+; Table S1: Products and the detailed dosages of precursors for their synthesis; Table S2: Rietveld refinement results.

Author Contributions

Conceptualization, Y.W.; methodology, Y.W., Y.H., R.L. and C.D.; validation, Y.W.; formal analysis, Y.H.; investigation, R.L. and C.D.; resources, Y.W.; data curation, Y.W., R.L. and C.D.; writing—original draft preparation, Y.W.; writing—review and editing, Y.W., Y.H. and H.L.; supervision, Y.W.; project administration, Y.W. and H.L.; funding acquisition, Y.W. All authors have read and agreed to the published version of the manuscript.

Funding

This research was funded by the Natural Science Foundation of Shandong Province (grant number ZR2021QA057) and the Research Fund for the Doctoral Program of Liaocheng University (grant number 318051832).

Institutional Review Board Statement

Not applicable.

Informed Consent Statement

Not applicable.

Data Availability Statement

Data are contained within the article and Supplementary Materials.

Conflicts of Interest

The authors declare no conflict of interest.

References

  1. Zhang, Z.; Zhang, Y. Orthogonal emissive upconversion nanoparticles: Material design and applications. Small 2021, 17, e2004552. [Google Scholar] [CrossRef] [PubMed]
  2. Liu, S.; Yan, L.; Huang, J.; Zhang, Q.; Zhou, B. Controlling upconversion in emerging multilayer core-shell nanostructures: From fundamentals to frontier applications. Chem. Soc. Rev. 2022, 51, 1729–1765. [Google Scholar] [CrossRef] [PubMed]
  3. Luo, Y.; Chen, Z.; Wen, S.; Han, Q.; Fu, L.; Yan, L.; Jin, D.; Bünzli, J.-C.G.; Bao, G. Magnetic regulation of the luminescence of hybrid lanthanide-doped nanoparticles. Coordin. Chem. Rev. 2022, 469, 214653. [Google Scholar] [CrossRef]
  4. Algar, W.R.; Massey, M.; Rees, K.; Higgins, R.; Krause, K.D.; Darwish, G.H.; Peveler, W.J.; Xiao, Z.; Tsai, H.Y.; Gupta, R.; et al. Photoluminescent nanoparticles for chemical and biological analysis and imaging. Chem. Rev. 2021, 121, 9243–9358. [Google Scholar] [CrossRef]
  5. Xie, Y.; Song, Y.; Sun, G.; Hu, P.; Bednarkiewicz, A.; Sun, L. Lanthanide-doped heterostructured nanocomposites toward advanced optical anti-counterfeiting and information storage. Light-Sci. Appl. 2022, 11, 150. [Google Scholar] [CrossRef] [PubMed]
  6. Han, Y.; Gao, C.; Wang, Y.; Ju, D.; Zhou, A.; Song, F.; Huang, L.; Huang, W. Spatially confined luminescence process in tip-modified heterogeneous-structured microrods for high-level anti-counterfeiting. Phys. Chem. Chem. Phys. 2018, 20, 9516–9522. [Google Scholar] [CrossRef]
  7. Chen, X.; Yao, W.; Wang, Q.; Wu, W. Designing multicolor dual-mode lanthanide-doped NaLuF4/Y2O3 composites for advanced anticounterfeiting. Adv. Opt. Mater. 2020, 8, 1901209. [Google Scholar] [CrossRef]
  8. Liu, X.; Ji, Q.; Hu, Q.; Li, C.; Chen, M.; Sun, J.; Wang, Y.; Sun, Q.; Geng, B. Dual-mode long-lived luminescence of Mn2+-doped nanoparticles for multilevel anticounterfeiting. ACS Appl. Mater. Interfaces 2019, 11, 30146–30153. [Google Scholar] [CrossRef]
  9. Wei, T.; Han, Y.; Wei, Y.; Gao, C.; Ma, H.; Zhang, F.; Bao, S.; Jing, S.; Huang, L. CaSc2O4 hosted upconversion and downshifting luminescence. J. Mater. Chem. C 2021, 9, 3800–3805. [Google Scholar] [CrossRef]
  10. Liu, S.; Yan, L.; Li, Q.; Huang, J.; Tao, L.; Zhou, B. Tri-channel photon emission of lanthanides in lithium-sublattice core-shell nanostructures for multiple anti-counterfeiting. Chem. Eng. J. 2020, 397, 125451. [Google Scholar] [CrossRef]
  11. Mei, Q.; Bansal, A.; Jayakumar, M.K.G.; Zhang, Z.; Zhang, J.; Huang, H.; Yu, D.; Ramachandra, C.J.A.; Hausenloy, D.J.; Soong, T.W.; et al. Manipulating energy migration within single lanthanide activator for switchable upconversion emissions towards bidirectional photoactivation. Nat. Commun. 2019, 10, 4416. [Google Scholar] [CrossRef] [PubMed]
  12. Hong, A.R.; Kyhm, J.H.; Kang, G.; Jang, H.S. Orthogonal R/G/B upconversion luminescence-based full-color tunable upconversion nanophosphors for transparent displays. Nano Lett. 2021, 21, 4838–4844. [Google Scholar] [CrossRef] [PubMed]
  13. Huang, K.; Qiu, H.; Zhang, X.; Luo, W.; Chen, Y.; Zhang, J.; Chen, Y.; Wang, G.; Zheng, K. Orthogonal trichromatic upconversion with high color purity in core-shell nanoparticles for a full-color display. Angew. Chem. Int. Ed. 2023, 62, e202218491. [Google Scholar] [CrossRef] [PubMed]
  14. Cheng, X.; Zhou, J.; Yue, J.; Wei, Y.; Gao, C.; Xie, X.; Huang, L. Recent development in sensitizers for lanthanide-doped upconversion luminescence. Chem. Rev. 2022, 122, 15998–16050. [Google Scholar] [CrossRef] [PubMed]
  15. Zhang, Z.; Jayakumar, M.K.G.; Zheng, X.; Shikha, S.; Zhang, Y.; Bansal, A.; Poon, D.J.J.; Chu, P.L.; Yeo, E.L.L.; Chua, M.L.K.; et al. Upconversion superballs for programmable photoactivation of therapeutics. Nat. Commun. 2019, 10, 4586. [Google Scholar] [CrossRef] [PubMed]
  16. Cheng, X.; Pan, Y.; Yuan, Z.; Wang, X.; Su, W.; Yin, L.; Xie, X.; Huang, L. Er3+ sensitized photon upconversion nanocrystals. Adv. Funct. Mater. 2018, 28, 1800208. [Google Scholar] [CrossRef]
  17. Han, Y.; Gao, C.; Wei, T.; Zhang, K.; Jiang, Z.; Zhou, J.; Xu, M.; Yin, L.; Song, F.; Huang, L. Modulating the rise and decay dynamics of upconversion luminescence through controlling excitations. Angew. Chem. Int. Ed. 2022, 61, e202212089. [Google Scholar] [CrossRef]
  18. Li, Y.; You, W.; Zhao, J.; Zhang, X.; Pan, G.; Liu, P.; Mao, Y. Unique excitation power density and pulse width-dependent multicolor upconversion emissions of Y2Mo4O15:Yb3+,Ho3+ for anti-counterfeiting and information encryption applications. J. Mater. Chem. C 2023, 11, 546–553. [Google Scholar] [CrossRef]
  19. Sun, H.; Li, X.; Zhu, Y.; Wang, X.; Zhang, Q.; Hao, X. Achieving multicolor emission readout and tunable photoswitching via multiplexing of dual lanthanides in ferroelectric oxides. J. Mater. Chem. C 2019, 7, 5782–5791. [Google Scholar] [CrossRef]
  20. Pei, P.; Wei, R.; Wang, B.; Su, J.; Zhang, Z.; Liu, W. An advanced tunable multimodal luminescent La4GeO8:Eu2+, Er3+ phosphor for multicolor anticounterfeiting. Adv. Funct. Mater. 2021, 31, 2102479. [Google Scholar] [CrossRef]
  21. Zhang, J.C.; Pan, C.; Zhu, Y.F.; Zhao, L.Z.; He, H.W.; Liu, X.; Qiu, J. Achieving thermo-mechano-opto-responsive bitemporal colorful luminescence via multiplexing of dual lanthanides in piezoelectric particles and its multidimensional anticounterfeiting. Adv. Mater. 2018, 30, e1804644. [Google Scholar] [CrossRef] [PubMed]
  22. Yan, W.; Su, Z.; Ye, R.; Chen, L.; Lu, Z.; Bai, G.; Xu, S. Creating dual-mode luminescence in piezoelectric calcium niobates through lanthanide-doped for anti-counterfeiting and temperature sensing. J. Alloys Compd. 2021, 856, 158188. [Google Scholar] [CrossRef]
  23. Lei, L.; Zhang, S.; Xia, H.; Tian, Y.; Zhang, J.; Xu, S. Controlled synthesis of lanthanide-doped Gd2O2S nanocrystals with novel excitation-dependent multicolor emissions. Nanoscale 2017, 9, 5718–5724. [Google Scholar] [CrossRef] [PubMed]
  24. Lee, M.; Chung, H.; Hong, S.V.; Woo, H.Y.; Chae, J.Y.; Yoon, T.Y.; Diroll, B.T.; Paik, T. Dynamically tunable multicolor emissions from zero-dimensional Cs3LnCl6 (Ln: Europium and terbium) nanocrystals with wide color gamut. Nanoscale 2023, 15, 1513–1521. [Google Scholar] [CrossRef] [PubMed]
  25. Yang, J.; Ping, Y.; Ma, H.; Lei, L. Defect-assisted dynamic multicolor modulation in KLu3F10:Tb crystals for anti-counterfeiting. Nanoscale 2023, 15, 4361–4366. [Google Scholar] [CrossRef]
  26. Chen, Q.; Jiang, J.; Zhang, H.; Fu, H.; Liu, W.; Zheng, J. Yb3+/Eu3+/Ho3+ tridoped Cs2Ag0.3Na0.7InCl6 double perovskite with excitation-wavelength-dependent triple emission for anti-counterfeiting application. Crystals 2023, 13, 13. [Google Scholar] [CrossRef]
  27. Zhou, J.; Li, C.; Lei, R.; Wang, H.; Li, M.; Li, D.; Yang, Q.; Hua, Y.; Xu, S. Novel optical thermometry strategy based on Gd3+ and defect-related luminescence of ZrO2:Gd3+ nanoparticles. J. Phys. Chem. C 2020, 124, 21664–21673. [Google Scholar] [CrossRef]
  28. Gupta, S.K.; Ghosh, P.S.; Pathak, N.; Tewari, R. Nature of defects in blue light emitting CaZrO3: Spectroscopic and theoretical study. RSC Adv. 2015, 5, 56526–56533. [Google Scholar] [CrossRef]
  29. Liu, X.; Zhang, J.; Ma, X.; Sheng, H.; Feng, P.; Shi, L.; Hu, R.; Wang, Y. Violet–blue up conversion photostimulated luminescence properties and first principles calculations of a novel un-doped CaZrO3 phosphor for application in optical storage. J. Alloys Compd. 2013, 550, 451–458. [Google Scholar] [CrossRef]
  30. Orihashi, T.; Nakamura, T.; Adachi, S. Resonant energy transfer in (Eu3+, Bi3+)-codoped CaZrO3 red-emitting phosphor. RSC Adv. 2016, 6, 66130–66139. [Google Scholar] [CrossRef]
  31. Oliveira, M.C.; Ribeiro, R.A.P.; Gracia, L.; de Lazaro, S.R.; de Assis, M.; Oliva, M.; Rosa, I.L.V.; Gurgel, M.F.d.C.; Longo, E.; Andrés, J. Experimental and theoretical study of the energetic, morphological, and photoluminescence properties of CaZrO3:Eu3+. CrystEngComm 2018, 20, 5519–5530. [Google Scholar] [CrossRef]
  32. Khan, A.; Song, F.; Zhou, A.; Gao, X.; Feng, M.; Ikram, M.; Hu, H.; Sang, X.; Liu, L. Tuning white light upconversion emission from Yb3+/Er3+/Tm3+ triply doped CaZrO3 by altering Tm3+ concentration and excitation power. J. Alloys Compd. 2020, 835, 155286. [Google Scholar] [CrossRef]
  33. Khan, A.; Song, F.; Gao, X.; Chen, Z.; Sang, X.; Feng, M.; Liu, L. Introduction of molybdenum into the lattice of single-host CaZrO3:Dy3+/Eu3+ to enhance luminescence intensity of the phosphor for white light emission. J. Alloys Compd. 2021, 881, 160652. [Google Scholar] [CrossRef]
  34. Navami, D.; Darshan, G.P.; Lavanya, D.R.; Premkumar, H.B.; Sharma, S.C.; Adarsha, H.; Prameela, H.C.; Nagabhushana, H. Design of green emitting CaZrO3:Tb3+ nanophosphor: Luminescence based platform for real-time ultrasensitive detection of latent fingerprints and anti-counterfeiting applications. Opt. Mater. 2021, 122, 111474. [Google Scholar] [CrossRef]
  35. Drag-Jarzabek, A.; John, L.; Petrus, R.; Kosinska-Klahn, M.; Sobota, P. Alkaline earth metal zirconate perovskites MZrO3 (M = Ba2+, Sr2+, Ca2+) derived from molecular precursors and doped with Eu3+ ions. Chem. Eur. J. 2016, 22, 4780–4788. [Google Scholar] [CrossRef]
  36. Kunti, A.K.; Patra, N.; Harris, R.A.; Sharma, S.K.; Bhattacharyya, D.; Jha, S.N.; Swart, H.C. Structural properties and luminescence dynamics of CaZrO3:Eu3+ phosphors. Inorg. Chem. Front. 2021, 8, 821–836. [Google Scholar] [CrossRef]
  37. Zhang, X.; Li, J.; Shu, Y.; Luo, K.; Liu, H.; Zhang, P.; Huang, Y.; Liu, G.; Fan, Y. Photoluminescence properties of tunable full-color-emitting CaZrO3: Ln (Ln = Tb3+, Eu3+, Tb3+/Eu3+) phosphors for white LEDs. J. Lumin. 2022, 252, 119305. [Google Scholar] [CrossRef]
  38. Ueda, K.; Ogata, T.; Honma, T. Effects of codoping on site-dependent Eu3+ luminescence in perovskite-type calcium zirconate and hafnate. Inorg. Chem. 2023, 62, 2146–2152. [Google Scholar] [CrossRef]
  39. Jang, S.; Lee, J.; Wi, S.W.; Lim, H.; Jeong, Y.J.; Chung, J.S.; Kang, W.K.; Lee, Y.S. Investigation on photoluminescence and Judd–Ofelt parameters in Eu ion-doped CaZrO3 in relation to the local structural property. J. Lumin. 2021, 240, 118433. [Google Scholar] [CrossRef]
  40. Katyayan, S.; Agrawal, S. Study of optical behaviour of Eu3+ and Tb3+ doped zirconate perovskite phosphors prepared by molten salt technique. Opt. Quant. Electron. 2020, 52, 18. [Google Scholar] [CrossRef]
  41. Tian, X.; Wang, C.; Dou, H.; Wu, L. Photoluminescence origin and non-contact thermometric properties in Pb2+-activated CaZrO3 perovskite phosphor. J. Alloys Compd. 2021, 892, 162250. [Google Scholar] [CrossRef]
  42. Cao, R.; Han, P.; Luo, W.; Fu, T.; Luo, Z.; Liu, P.; Chen, Z.; Yu, X. Synthesis, luminescence properties and energy transfer of CaZrO3:Sm3+, Bi3+ phosphor. J. Electron. Mater. 2016, 45, 3361–3366. [Google Scholar] [CrossRef]
  43. Chi, F.; Pan, L.; Jiang, B.; Ji, Z.; Cheng, J.; Wang, B.; Wei, X.; Liu, S. Luminescence properties of multicolor emitting La4GeO8:Tb3+, Eu3+ phosphors. Ceram. Int. 2023, 49, 2522–2530. [Google Scholar] [CrossRef]
  44. Posokhova, S.M.; Morozov, V.A.; Deyneko, D.V.; Nikiforov, I.V.; Redkin, B.S.; Spassky, D.A.; Belik, A.A.; Pavlova, E.T.; Lazoryak, B.I. K5Eu1-xTbx(MoO4)4 phosphors for solid-state lighting applications: Aperiodic structures and the Tb3+ → Eu3+ energy transfer. Inorg. Chem. 2022, 61, 7910–7921. [Google Scholar] [CrossRef] [PubMed]
  45. Mukherjee, S.; Pathak, N.; Ali, K.; Das, D.; Dutta, D. Tailoring defect structure and dopant composition and the generation of various color characteristics in Eu3+ and Tb3+ doped MgF2 phosphors. Phys. Chem. Chem. Phys. 2022, 24, 10915–10927. [Google Scholar] [CrossRef]
  46. Bu, X.; Liu, Y.-g.; Chen, J. Band structure, photoluminescent properties, and energy transfer behavior of a multicolor tunable phosphor K3Lu(PO4)2: Tb3+, Eu3+ for warm white light-emitting diodes. J. Lumin. 2022, 251, 119133. [Google Scholar] [CrossRef]
  47. Chen, X.; Shu, Q.; He, J. Luminescent properties and energy transfer mechanism from Tb3+ to Eu3+ in single-phase color-adjustable Sr3MgSi2O8:Eu3+,Tb3+ phosphor prepared by the sol-gel method. J. Alloys Compd. 2022, 891, 161878. [Google Scholar] [CrossRef]
  48. Xing, L.; Sun, Y.; Hu, C.; Wei, D.; Wang, Y.; Hao, J.; Li, W.; Gao, X.; Wang, W.; Li, H. Lanthanide ions-activated Gd2B2WO9: Multicolor tunable phosphors under single-wavelength excitation. J. Alloys Compd. 2021, 867, 159026. [Google Scholar] [CrossRef]
  49. Back, M.; Ueda, J.; Xu, J.; Asami, K.; Amidani, L.; Trave, E.; Tanabe, S. Uncovering the origin of the emitting states in Bi3+-activated CaMO3 (M = Zr, Sn, Ti) perovskites: Metal-to-metal charge transfer versus s–p transitions. J. Phys. Chem. C 2019, 123, 14677–14688. [Google Scholar] [CrossRef]
  50. Shannon, R.D. Revised effective ionic radii and systematic studies of interatomie distances in halides and chaleogenides. Acta Cryst. 1976, 32, 751–767. [Google Scholar] [CrossRef]
  51. Li, A.; Luo, L.; Du, P.; Li, W.; Runowski, M.; Zhou, J. Tailoring of polychromatic emissions in Tb3+/Eu3+ codoped NaYbF4 nanoparticles via energy transfer strategy for white light-emitting diodes. Mater. Today Chem. 2022, 24, 100916. [Google Scholar] [CrossRef]
  52. Kunti, A.K.; Patra, N.; Harris, R.A.; Sharma, S.K.; Bhattacharyya, D.; Jha, S.N.; Swart, H.C. Local structure and spectroscopic properties of Eu3+-doped BaZrO3. Inorg. Chem. 2019, 58, 3073–3089. [Google Scholar] [CrossRef] [PubMed]
  53. Ueda, K.; Shimizu, Y.; Takashima, H.; Massuyeau, F.; Jobic, S. Photo- and cathodoluminescence of Eu3+ or Tb3+ doped CaZrO3 films prepared by pulsed laser deposition. Opt. Mater. 2017, 73, 504–508. [Google Scholar] [CrossRef]
  54. Shimizu, Y.; Sakagami, S.; Goto, K.; Nakachi, Y.; Ueda, K. Tricolor luminescence in rare earth doped CaZrO3 perovskite oxides. Mater. Sci. Eng. B 2009, 161, 100–103. [Google Scholar] [CrossRef]
  55. Manjunatha, S.; Manjunatha, H.C.; Vidya, Y.S.; Sridhar, K.N.; Seenappa, L.; Chinnappa Reddy, B.; Santhosh, A.N.; Munirathnam, R.; Damodara Gupta, P.S.; Dharmaprakash, M.S. Microwave assisted synthesis, photoluminescence and X-ray/gamma ray absoprtion properties of red CaZrO3:Eu3+ perovskite. J. Solid State Chem. 2022, 313, 123245. [Google Scholar] [CrossRef]
  56. Dong, H.; Sun, L.D.; Wang, Y.F.; Ke, J.; Si, R.; Xiao, J.W.; Lyu, G.M.; Shi, S.; Yan, C.H. Efficient tailoring of upconversion selectivity by engineering local structure of lanthanides in NaxREF3+x nanocrystals. J. Am. Chem. Soc. 2015, 137, 6569–6576. [Google Scholar] [CrossRef]
  57. Dexter, D.L.; Schulman, J.H. Theory of concentration quenching in inorganic phosphors. J. Chem. Phys. 1954, 22, 1063–1070. [Google Scholar] [CrossRef]
  58. Blasse, G. Energy transfer in oxidic phosphors. Phys. Lett. 1968, 28, 444–445. [Google Scholar] [CrossRef]
  59. Li, J.; Lin, L.; Jiang, W.; Zhang, Z.; Zhang, X.; Kuang, M.; Zhuang, J.; Zhang, Q.; Ni, H.; Shi, J. A terbium-sensitized Eu3+-activated deep-red-emitting phosphor for plant growth LED application. J. Alloys Compd. 2021, 885, 160966. [Google Scholar] [CrossRef]
  60. Li, X.; Zhang, Y.; Geng, D.; Lian, J.; Zhang, G.; Hou, Z.; Lin, J. CaGdAlO4:Tb3+/Eu3+ as promising phosphors for full-color field emission displays. J. Mater. Chem. C 2014, 2, 9924–9933. [Google Scholar] [CrossRef]
  61. Rathaiah, M.; Haritha, P.; Lozano-Gorrín, A.D.; Babu, P.; Jayasankar, C.K.; Rodríguez-Mendoza, U.R.; Lavín, V.; Venkatramu, V. Stokes and anti-Stokes luminescence in Tm3+/Yb3+-doped Lu3Ga5O12 nano-garnets: A study of multipolar interactions and energy transfer dynamics. Phys. Chem. Chem. Phys. 2016, 18, 14720–14729. [Google Scholar] [CrossRef] [PubMed]
Figure 1. (a) Crystal structure diagram of CaZrO3. (b) Powder XRD patterns of representative undoped CaZrO3, CaZrO3:4%Tb3+, CaZrO3:4%Eu3+, and CaZrO3:4%Tb3+/0.5%Eu3+. The bars at the bottom are the reference standard patterns of CaZrO3 (PDF card No. 35–0645). Rietveld refinement results of (c) undoped CaZrO3 and (d) CaZrO3:4%Tb3+/0.5%Eu3+. (e) SEM image and (f) elemental mapping of CaZrO3:4%Tb3+/0.5%Eu3+. (g) EDS spectrum of CaZrO3:4%Tb3+/0.5%Eu3+. (h) XPS spectra of CaZrO3:4%Tb3+/0.5%Eu3+: the overall spectrum, high resolution spectra of Eu 3d and Tb 3d.
Molecules 28 07623 g001
Figure 2. (a) Excitation and emission spectra of undoped CaZrO3. (b) Excitation spectra of CaZrO3:Tb3+ (2–8%), obtained by monitoring the emission at 545 nm. (c) Emission spectra of CaZrO3:Tb3+ (0–8%) under 245 nm excitation. (d) Emission spectra of CaZrO3:Eu3+ (0–8%) under 280 nm excitation. The insets in (a,c,d) are photographs of the corresponding samples.
Molecules 28 07623 g002
Figure 3. Schematics of the main luminescence mechanism in (a) CaZrO3, (b) CaZrO3:Tb3+, and (c) CaZrO3:Eu3+. Some of the energy levels of Tb3+ and Eu3+ are shown and marked. The upward/downward full arrows represent the excitation/emission processes. The curved and straight dash arrows represent the energy transfer and non-radiative transition processes, respectively. CTB: charge transfer band.
Molecules 28 07623 g003
Figure 4. (a) Excitation and emission spectra of CaZrO3:4%Tb3+/0.5%Eu3+. (b) Emission spectra and (c) photographs of CaZrO3:4%Tb3+/xEu3+ (x = 0–6%) under 255 nm excitation. (d) Schematic of the main luminescence mechanism of CaZrO3:4%Tb3+/xEu3+. Some energy levels of Tb3+ and Eu3+ are shown and marked.
Molecules 28 07623 g004
Figure 5. (a) The decay curves monitoring the 545 nm emissions of CaZrO3:4%Tb3+/xEu3+ (x = 0–6%) under 255 nm excitation. I-H fitting results of the corresponding samples at S = 6 are shown as grey lines. (b) The calculated lifetime values of Tb3+ 5D47F5 transition, energy transfer parameter Q, and efficiency (ηET) from Tb3+ to Eu3+ in CaZrO3:4%Tb3+/xEu3+ (x = 0–6%) as a function of Eu3+ concentration. The relationship of τ0/τ of Tb3+ to (c) C6/3, (d) C8/3 and (e) C10/3 in CaZrO3:4%Tb3+/xEu3+ (x = 0.5–6%).
Molecules 28 07623 g005
Figure 6. (a) Excitation spectra of CaZrO3:8%Tb3+, obtained by monitoring emissions at 545 and 392 nm. (b) Emission spectra and (c) intensity variation of CaZrO3:8%Tb3+ under 245–312 nm excitations. (d) Excitation spectra of CaZrO3:4%Tb3+/0.5%Eu3+, obtained by monitoring emissions at 545, 616 and 392 nm. (e) Emission spectra and (f) intensity variation of CaZrO3:4%Tb3+/0.5%Eu3+ under 245–312 nm excitations. Digital photographs show the color evolution of (g) CaZrO3:8%Tb3+ and (h) CaZrO3:4%Tb3+/0.5%Eu3+ under different excitation wavelengths.
Molecules 28 07623 g006
Figure 7. (a) Photographs of “LCU” patterns composed of CaZrO3:8%Tb3+, CaZrO3:6%Eu3+, and CaZrO3:4%Tb3+/0.5%Eu3+ under 254 and 302 nm UV light. (b) Photographs of array patterns composed of CaZrO3 and CaZrO3:8%Tb3+ under 302 and 254 nm UV light; ASCII codes revealed by the luminescent color, and cryptographic information of “LCU”.
Molecules 28 07623 g007
Disclaimer/Publisher’s Note: The statements, opinions and data contained in all publications are solely those of the individual author(s) and contributor(s) and not of MDPI and/or the editor(s). MDPI and/or the editor(s) disclaim responsibility for any injury to people or property resulting from any ideas, methods, instructions or products referred to in the content.

