

A Study of Gentianae Radix et Rhizoma Class Differences Based on Chemical Composition and Core Efficacy
Abstract
:
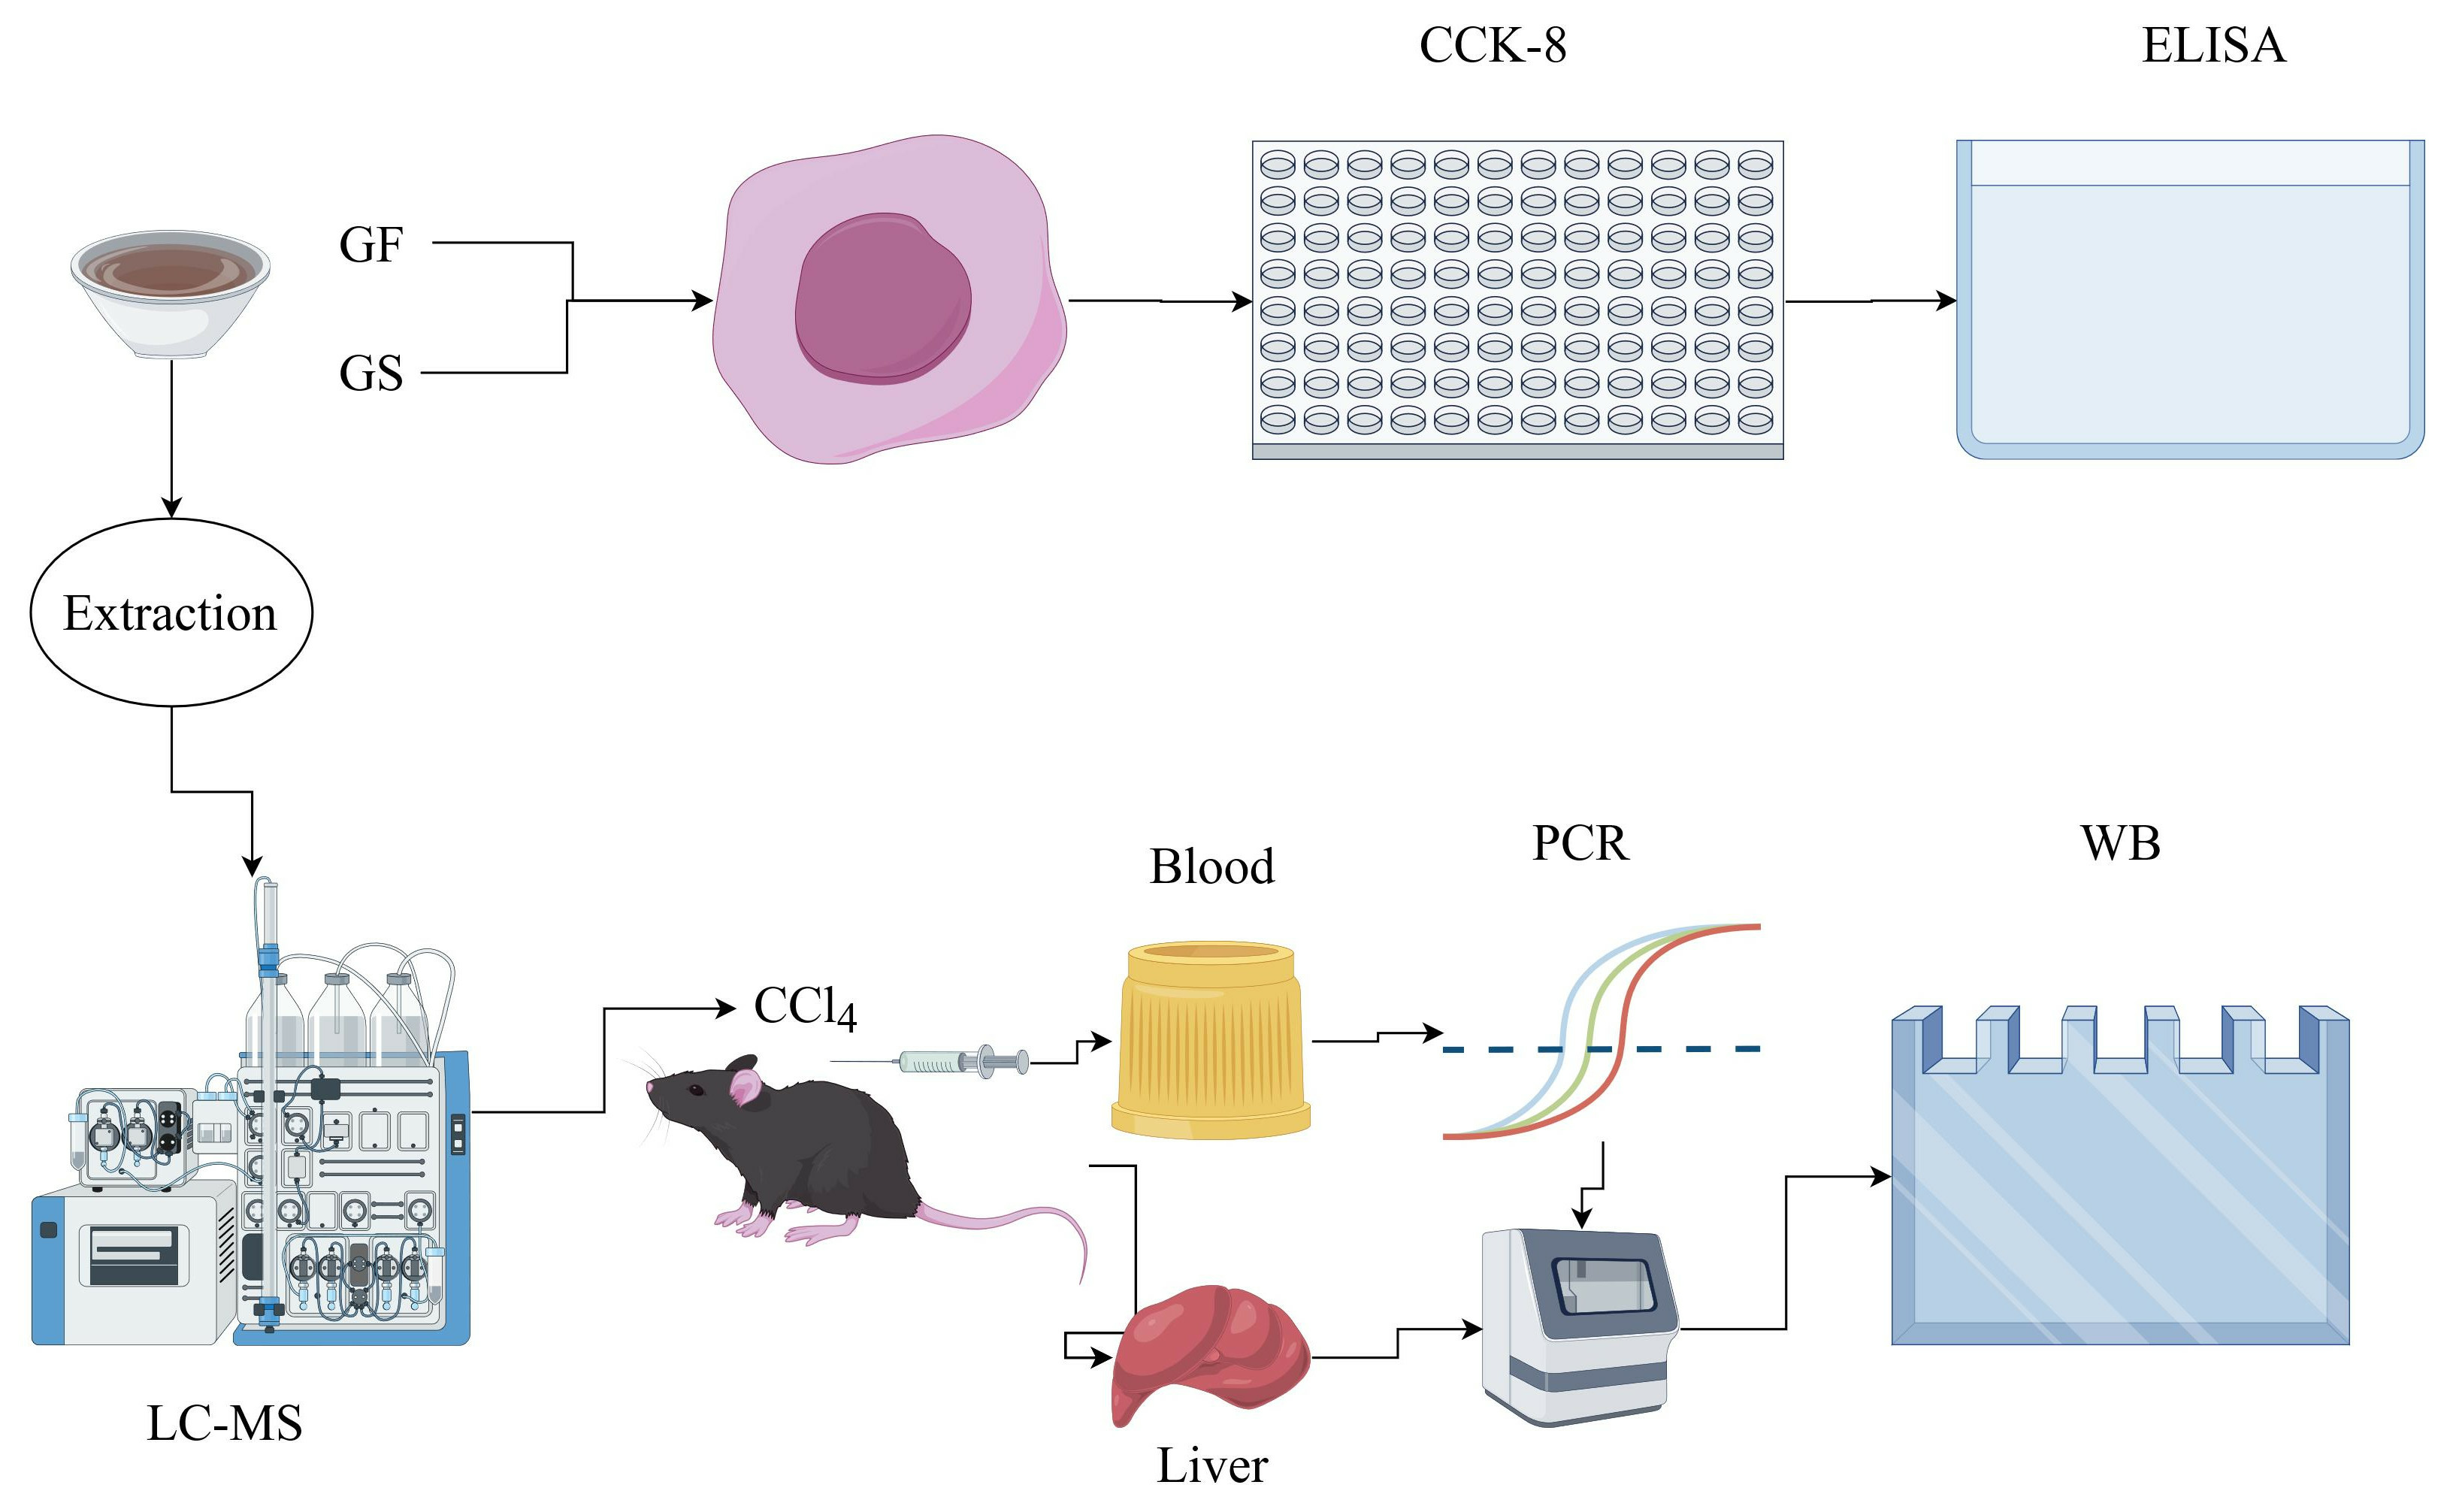
1. Introduction
2. Results
2.1. Differences in Composition between GF and GS
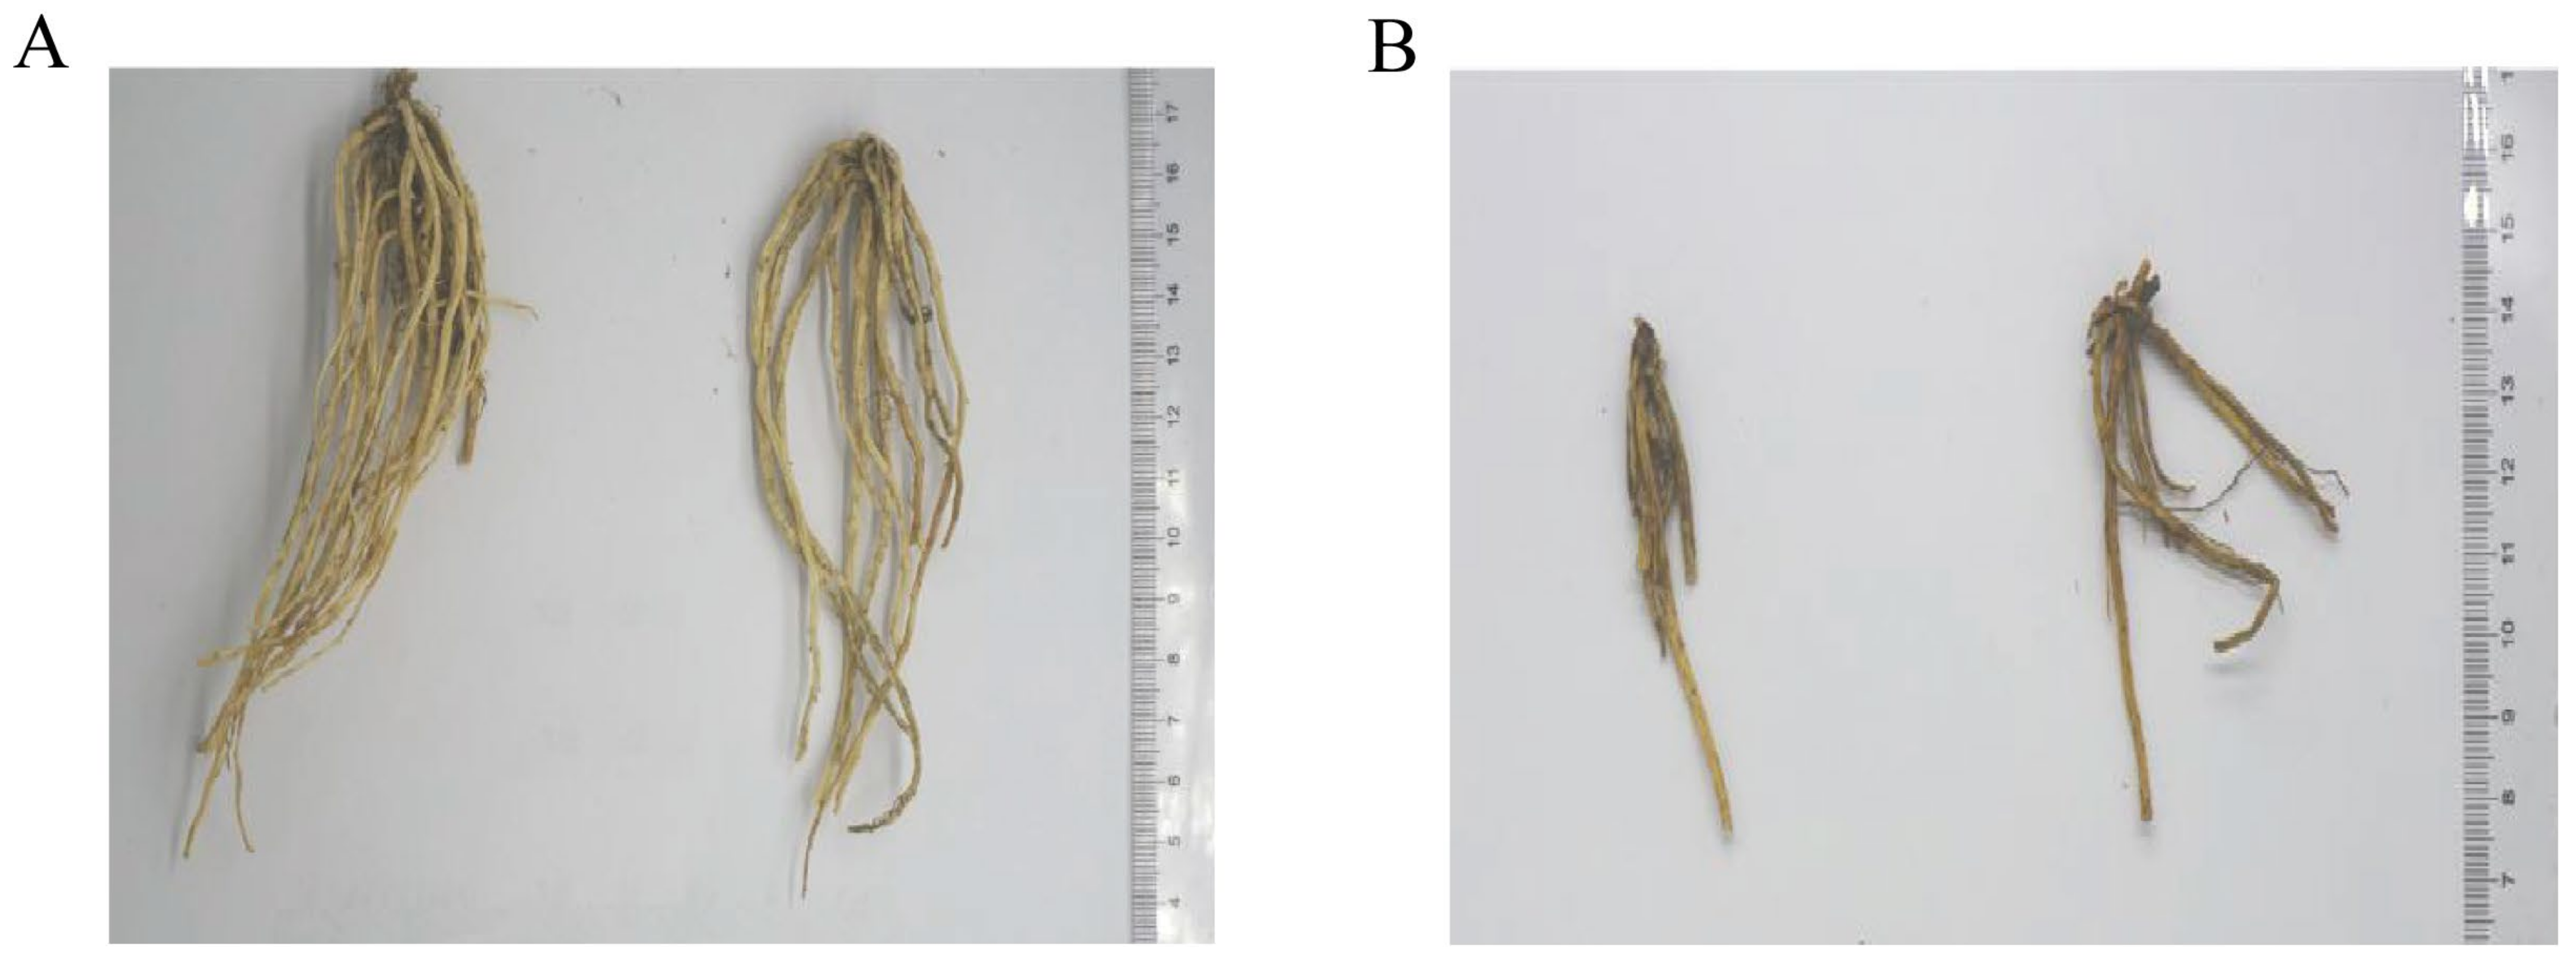
2.1.1. Differences in Traits between GF and GS
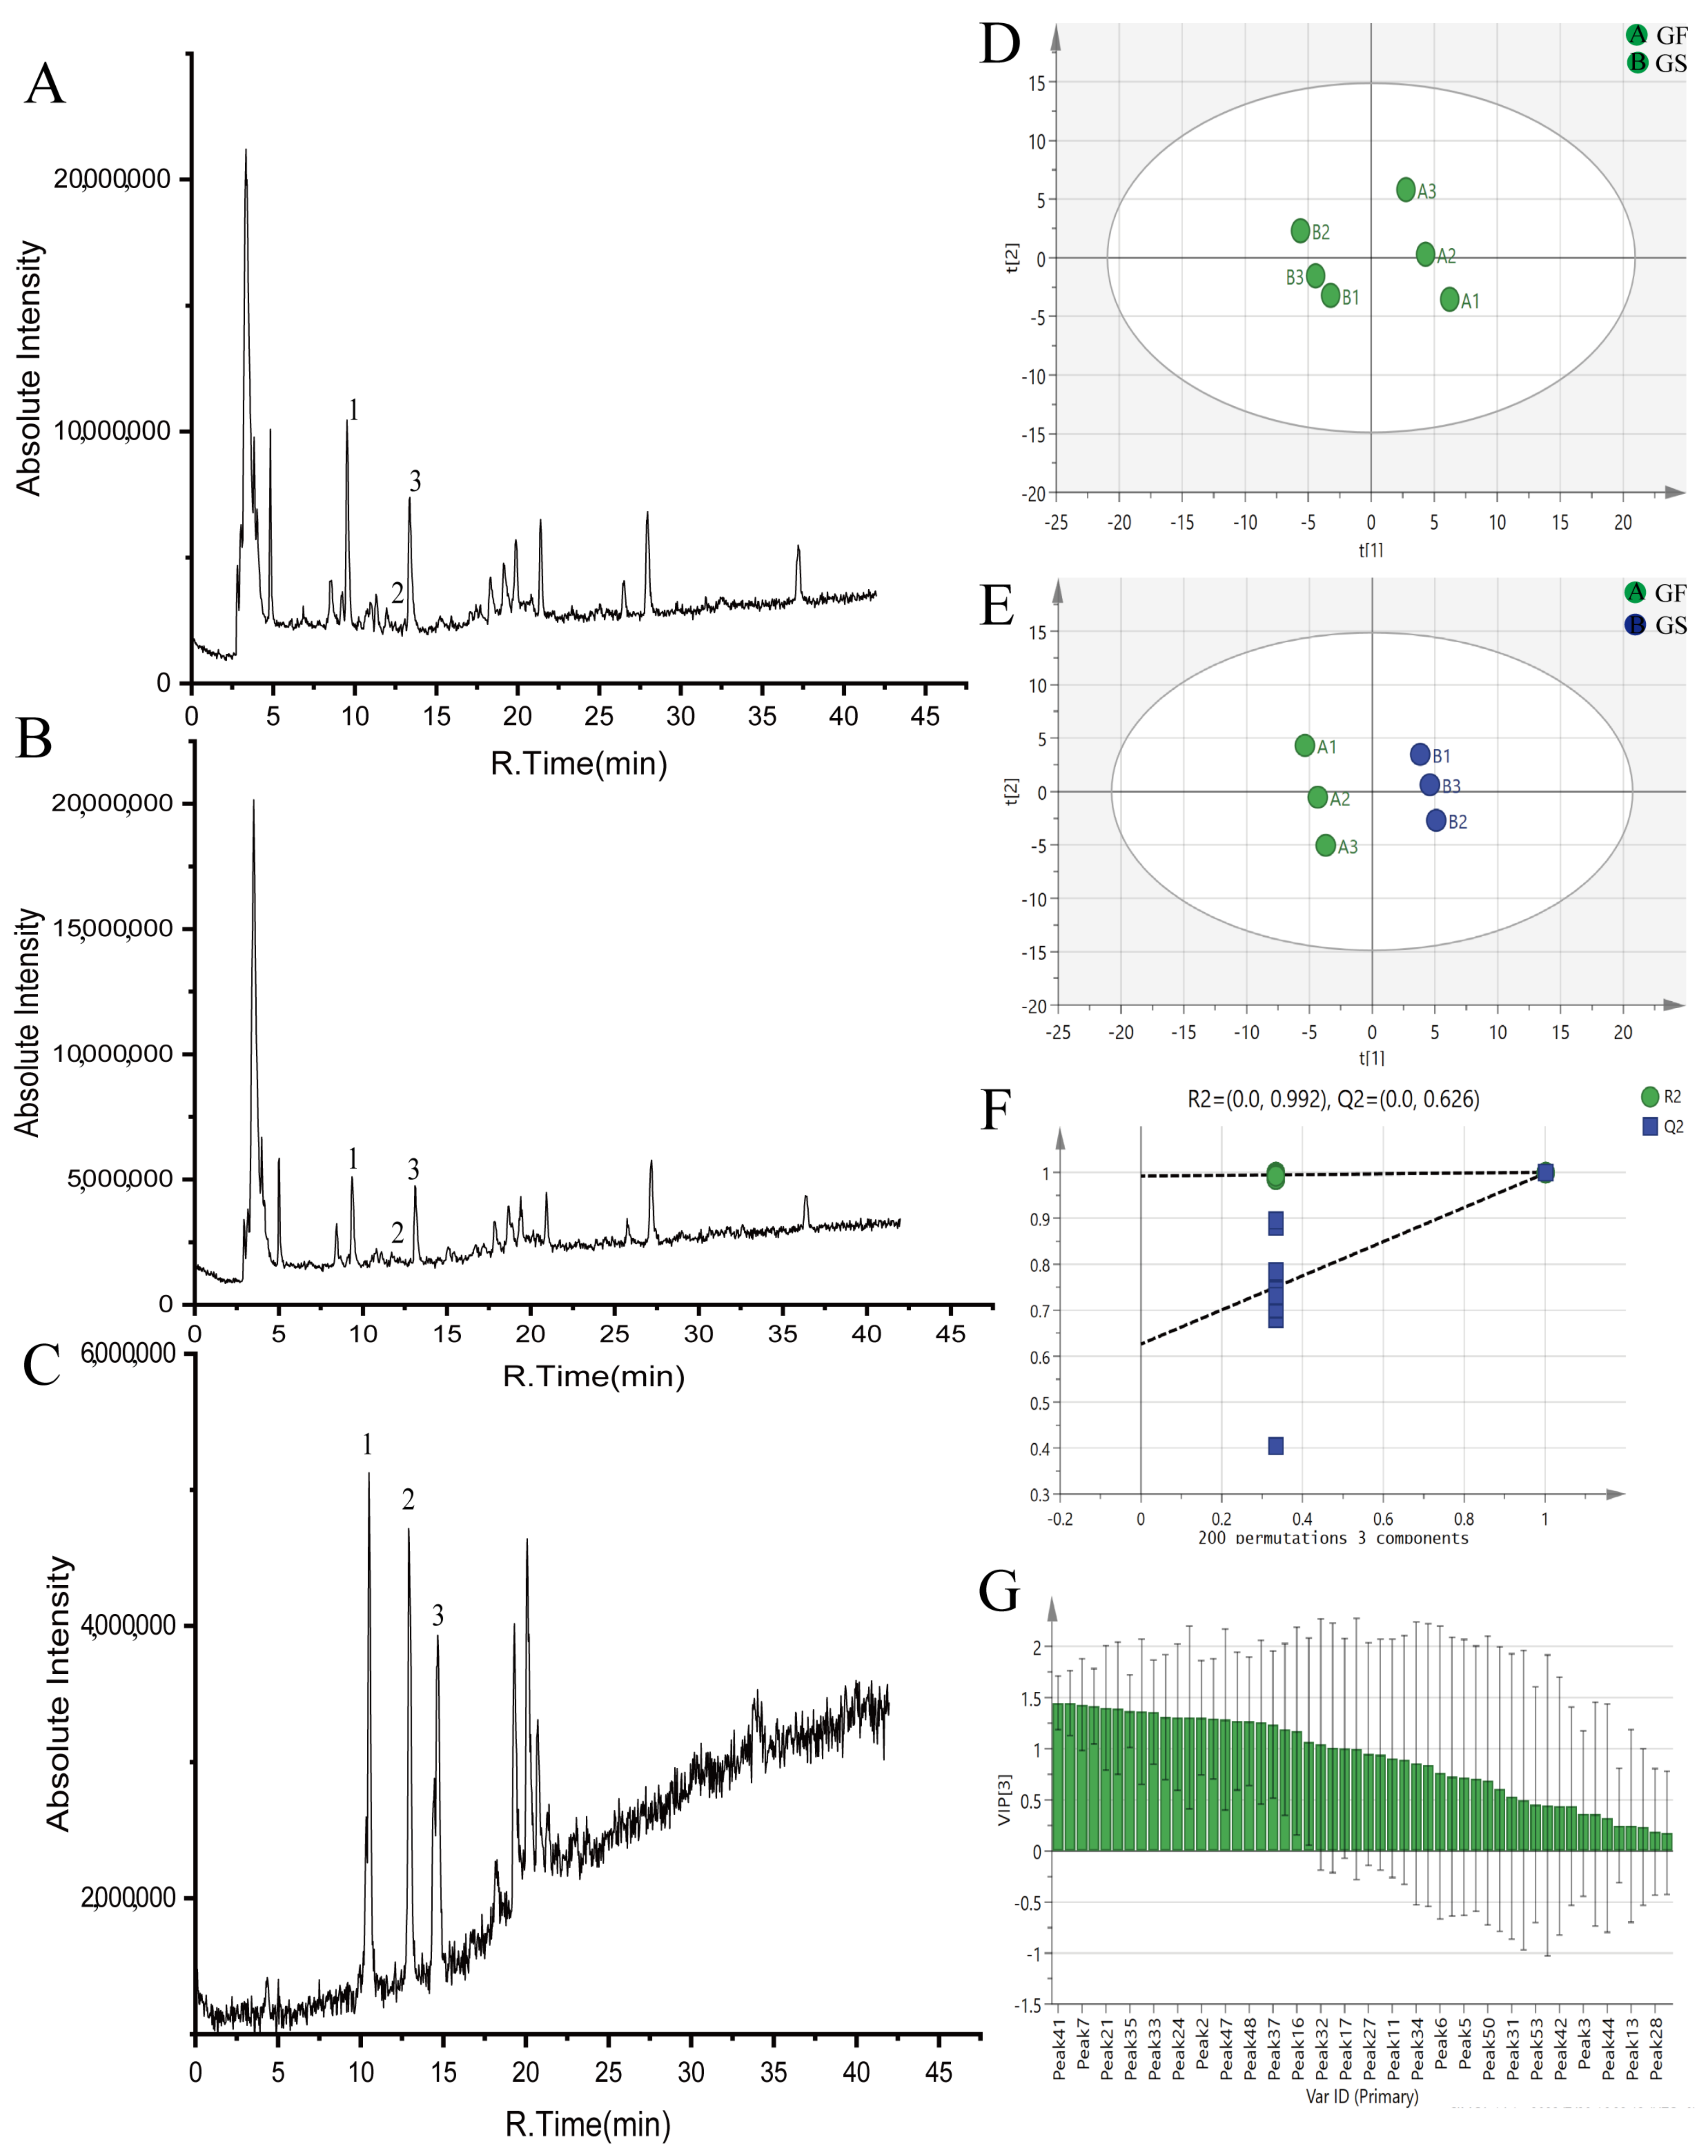
2.1.2. Compound Analysis and Identification
2.1.3. Principal Component Analysis (PCA) of GF and GS
2.1.4. Orthogonal Partial Least Squares-Discriminant Analysis (OPLS-DA) of GF and GS
2.2. Effect of GF and GS on Hydrogen Peroxide-Induced Oxidative Stress Model in HepG2 Cells
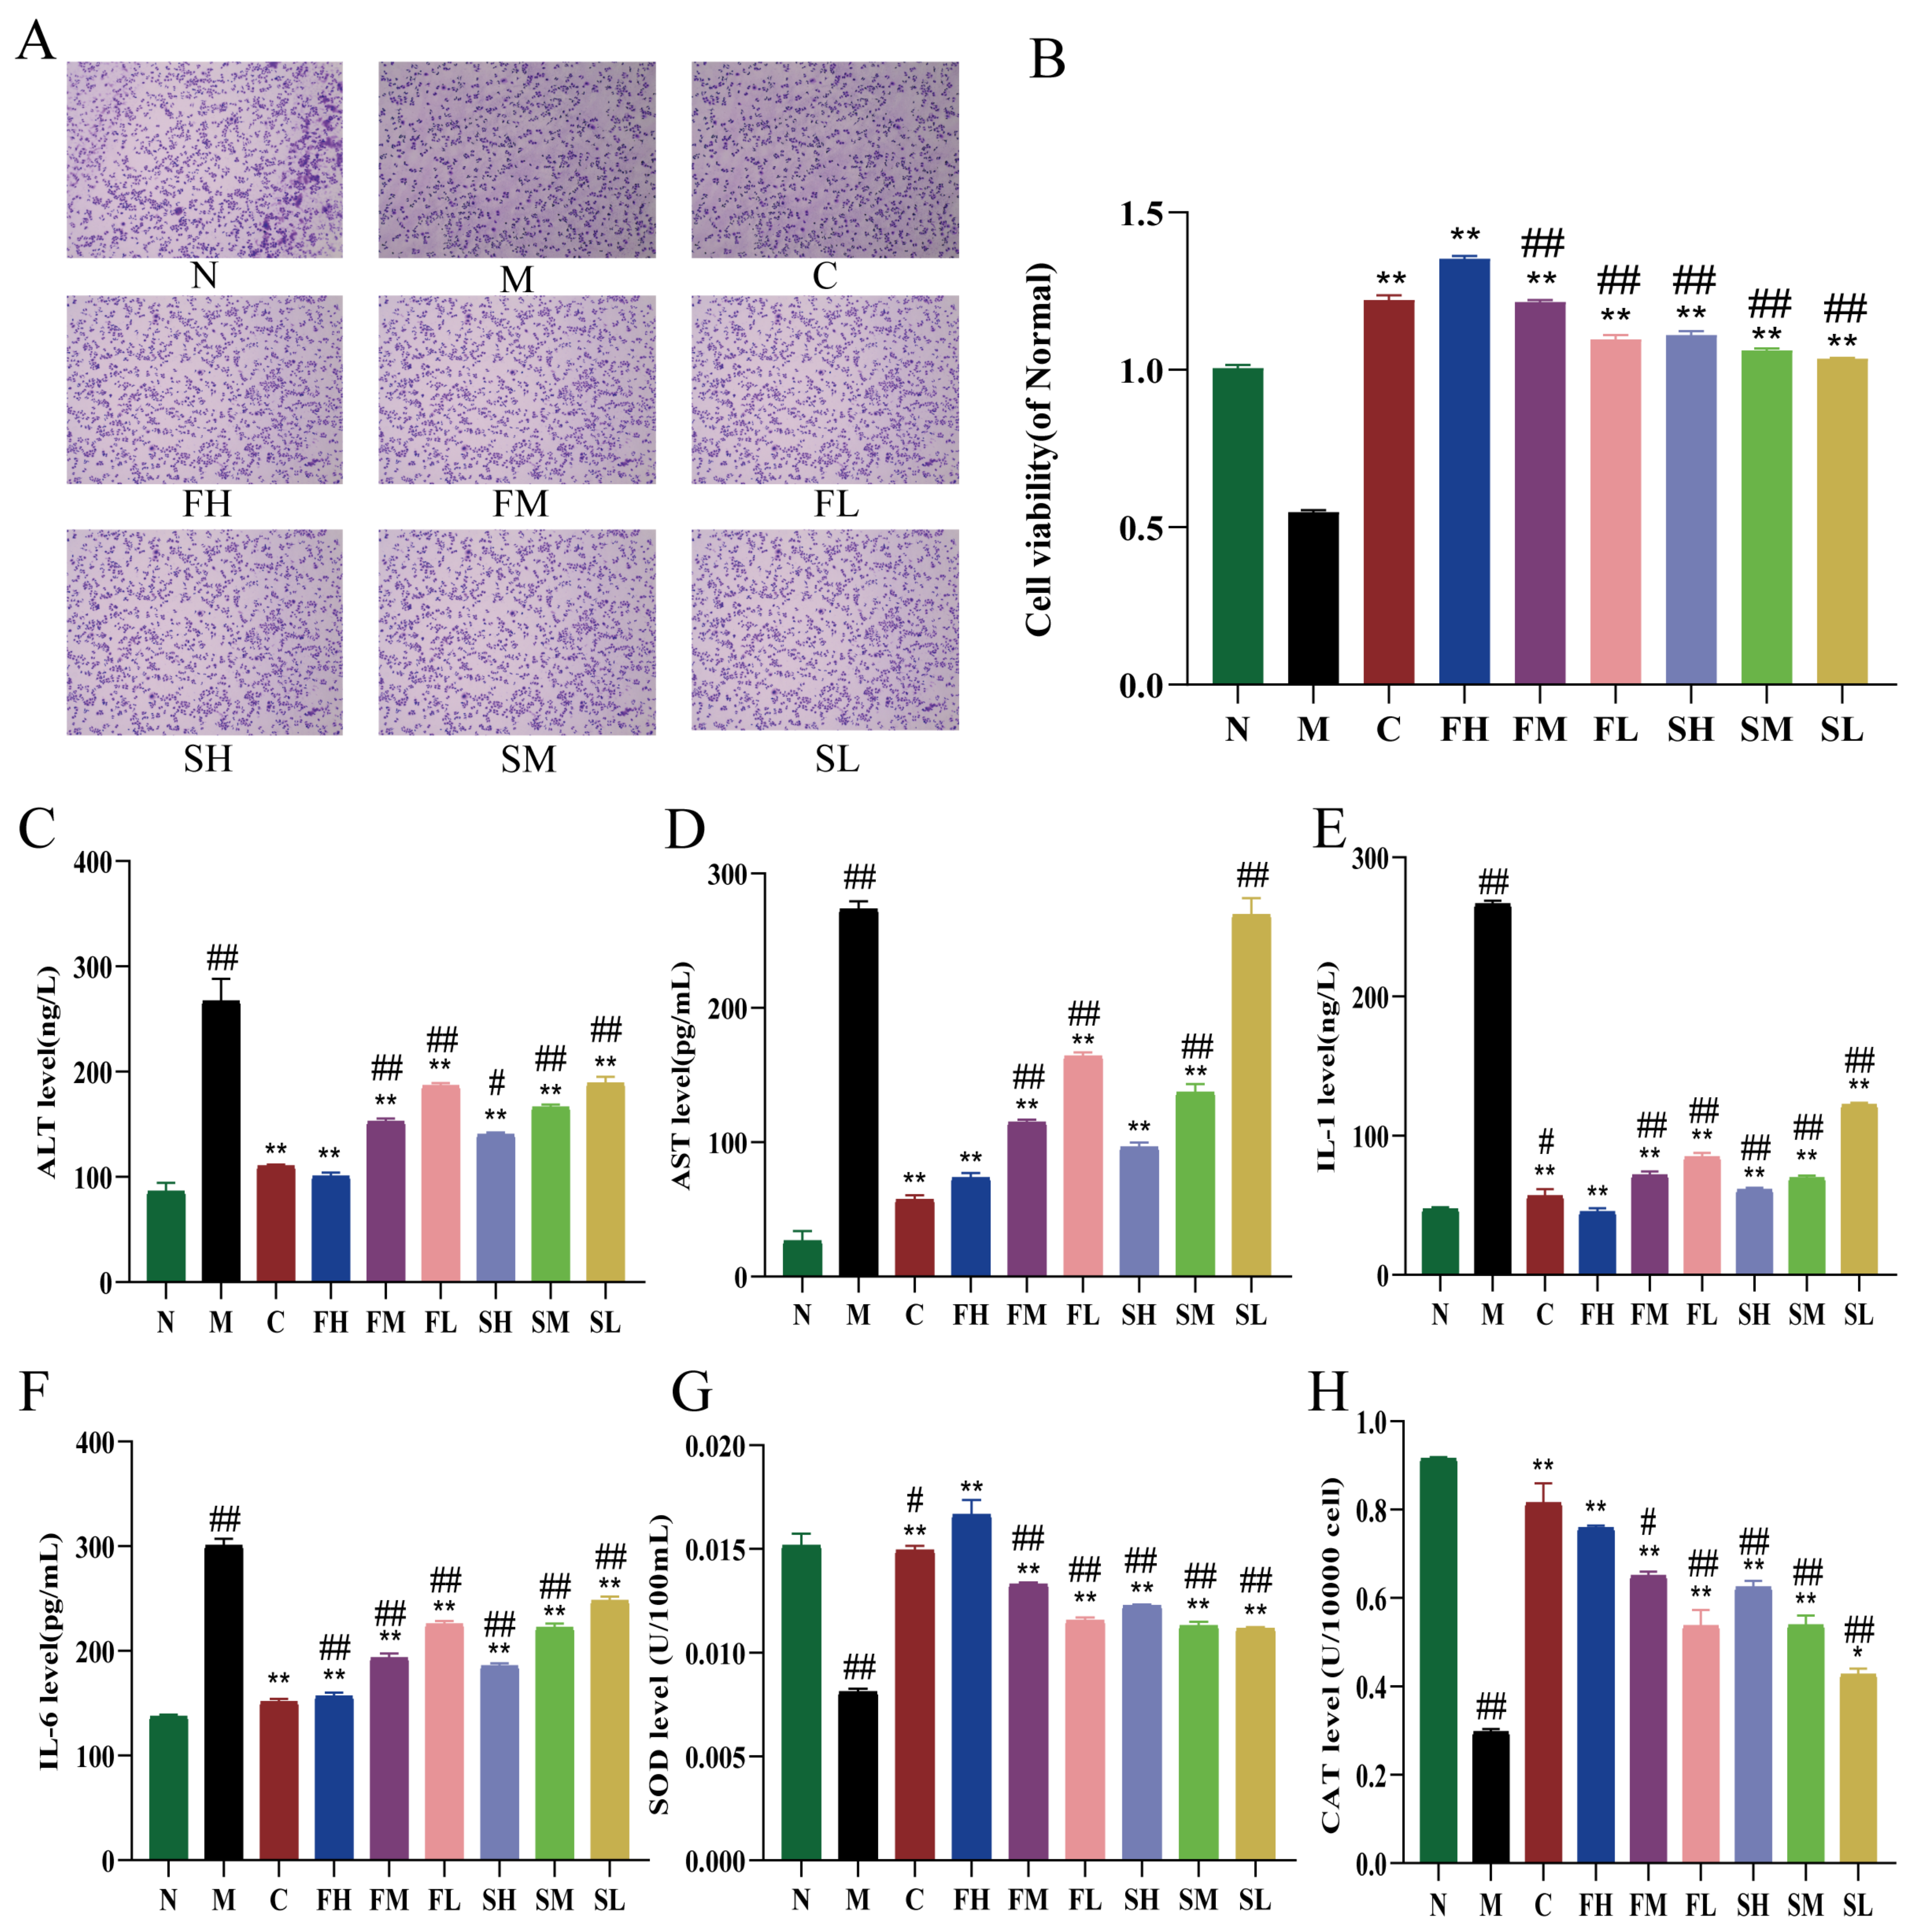
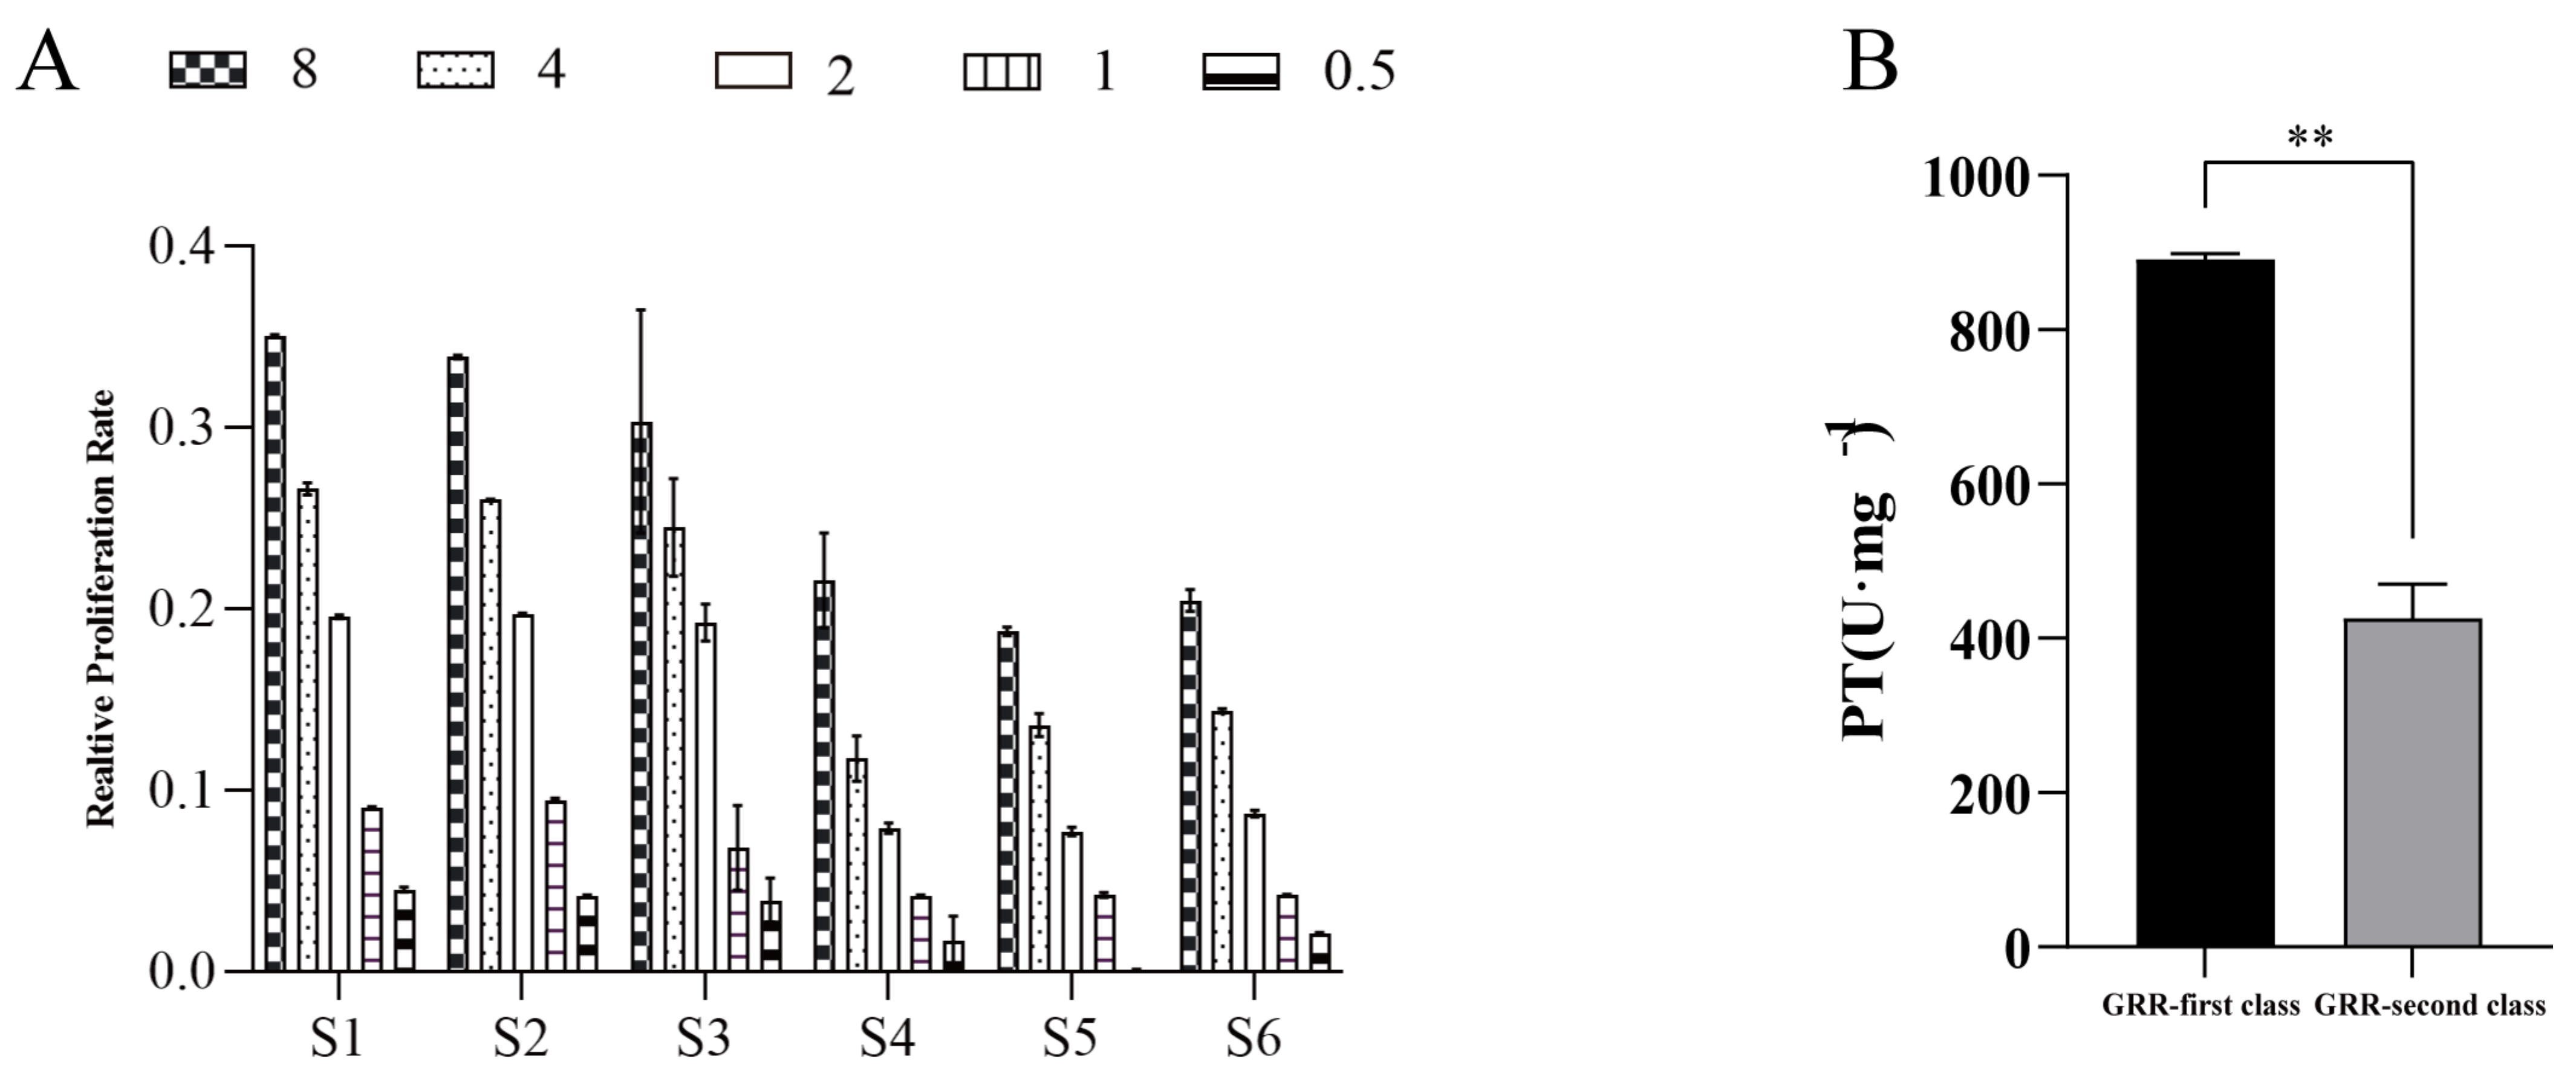
2.2.1. Effect of GF and GS on HepG2 Cells under the Effect of Hydrogen Peroxide
2.2.2. Effects of GF and GS on Liver Function Indexes, Inflammatory Factors and Oxidative Stress Indexes of HepG2 Cells under the Action of H2O2
2.2.3. Results of Bioavailability Testing of GF and GS
2.3. Protective Effects of GF and GS on Mice with ALI
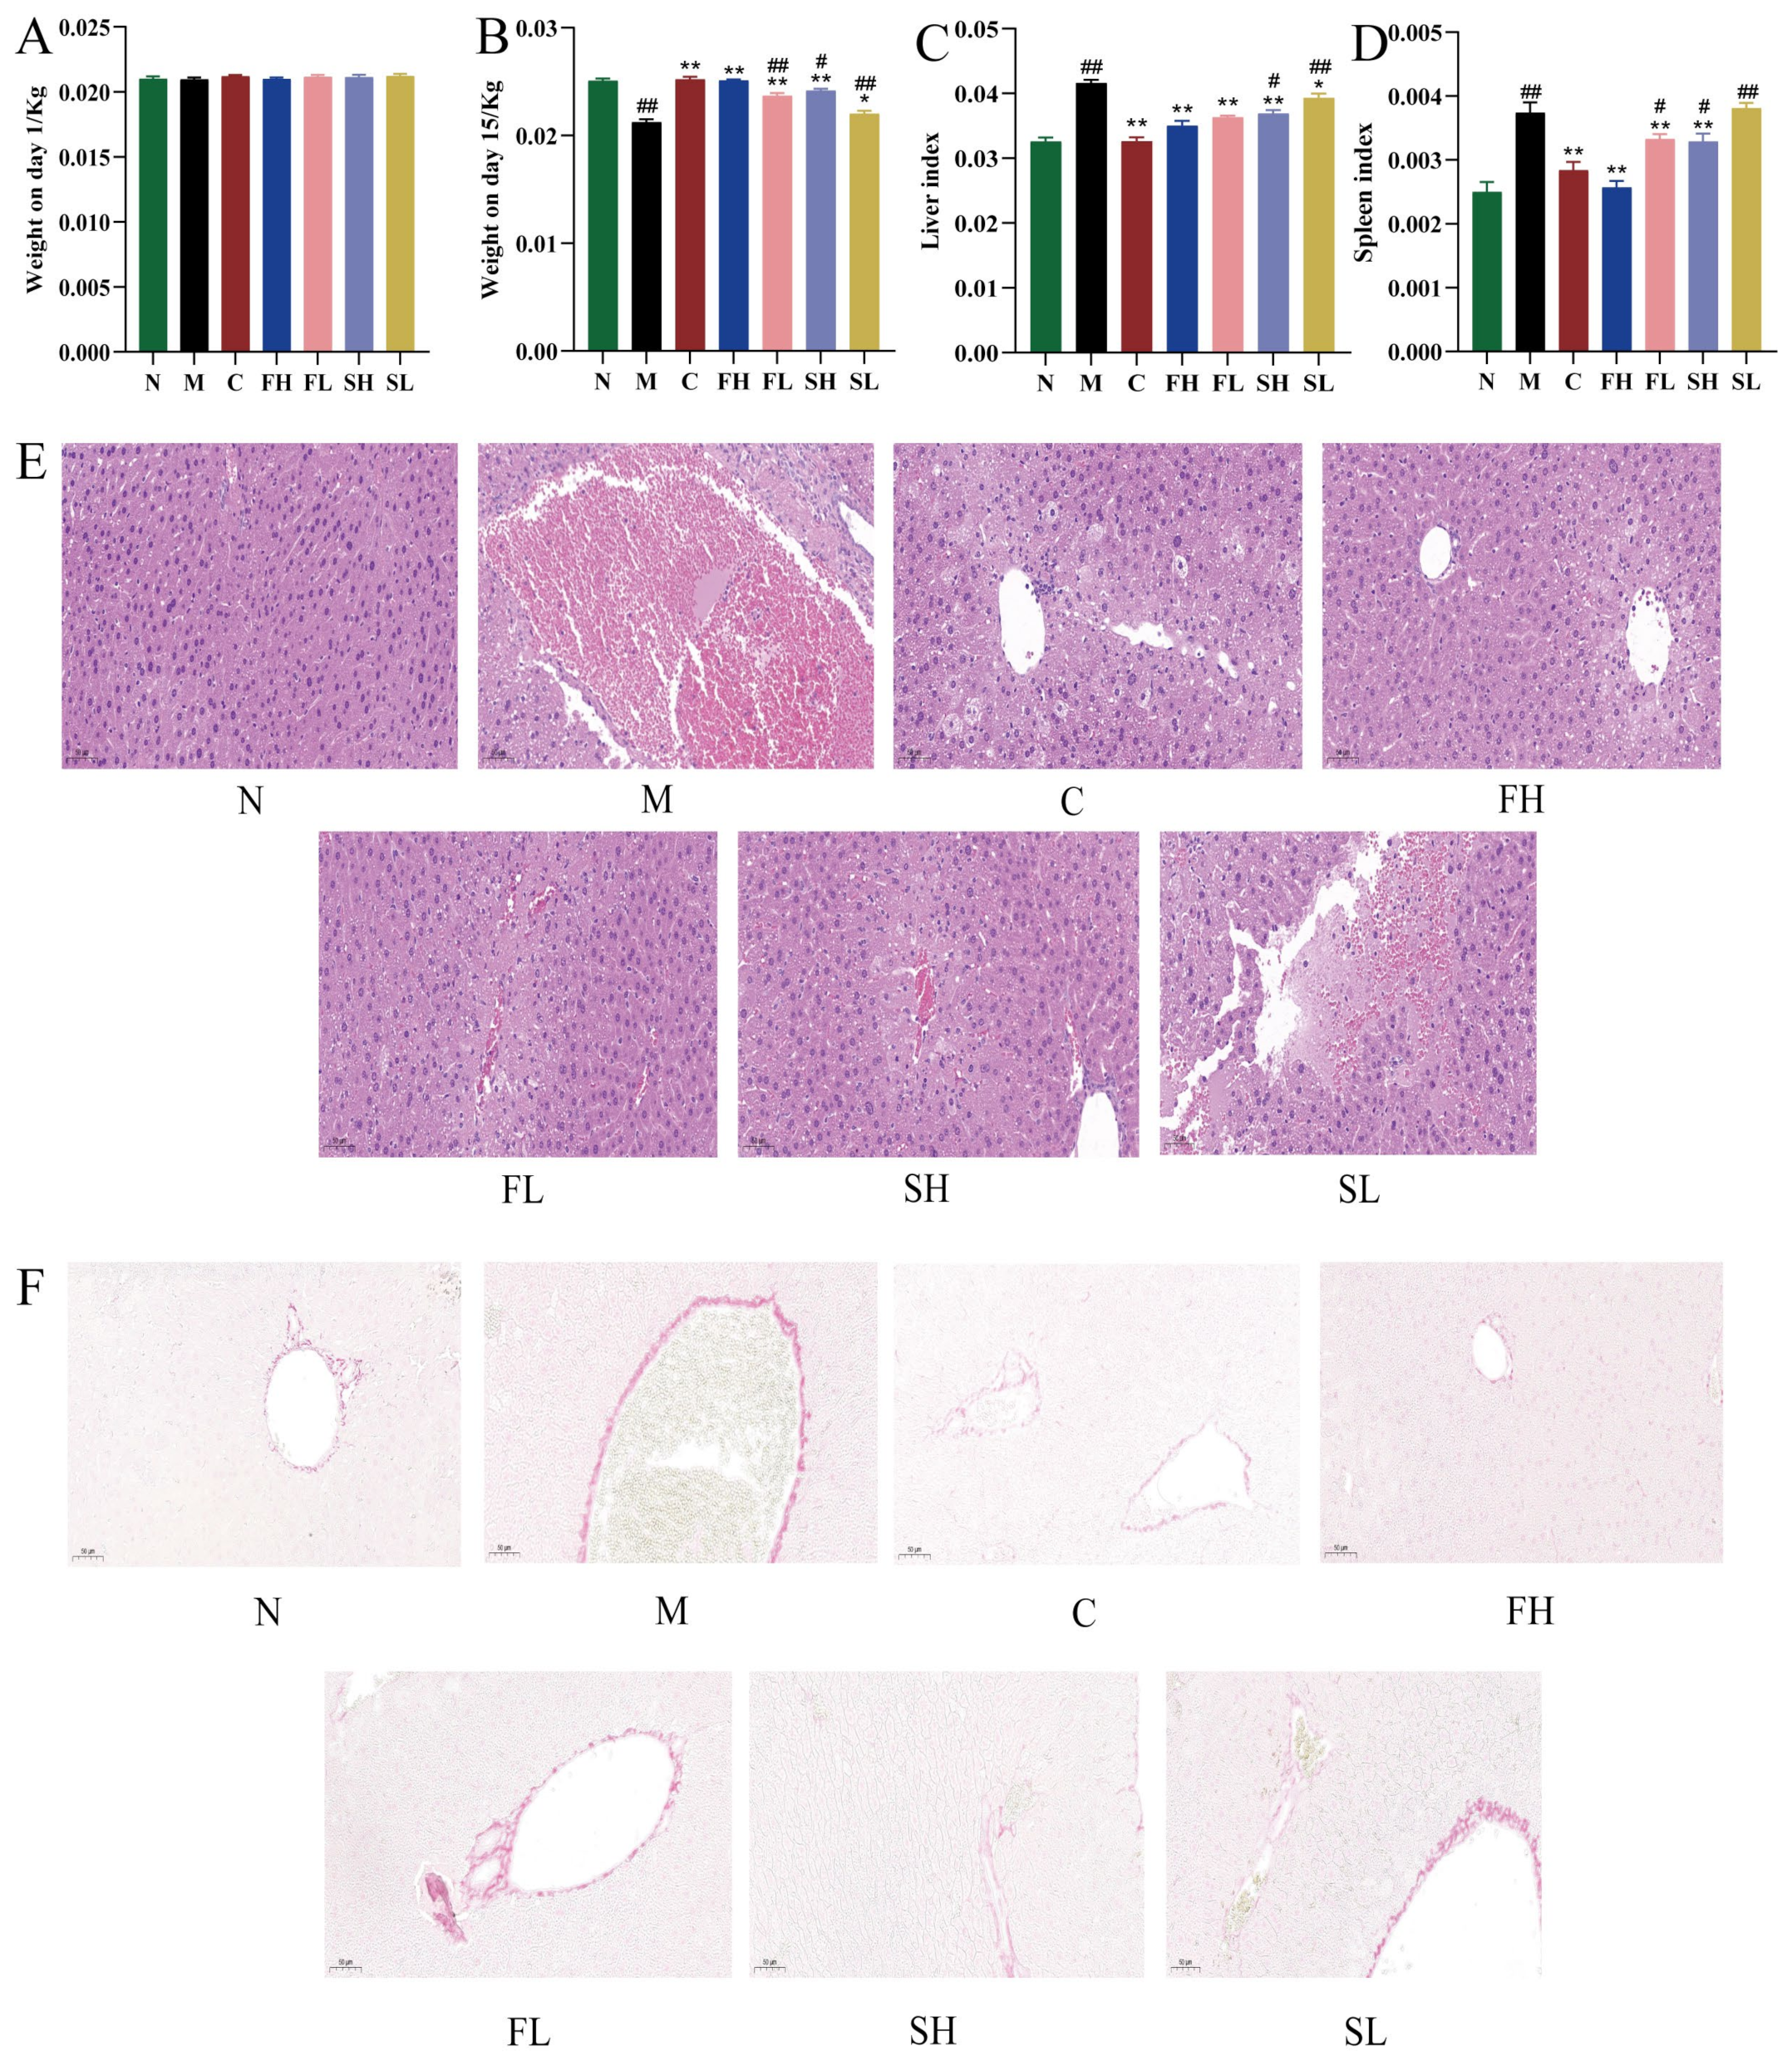
2.3.1. Effects of GF and GS on Body Weight of Mice with ALI
2.3.2. Effects of Gentian GF and GS on Liver and Spleen Indexes in Mice with ALI
2.3.3. Histopathologic Examination of the Liver
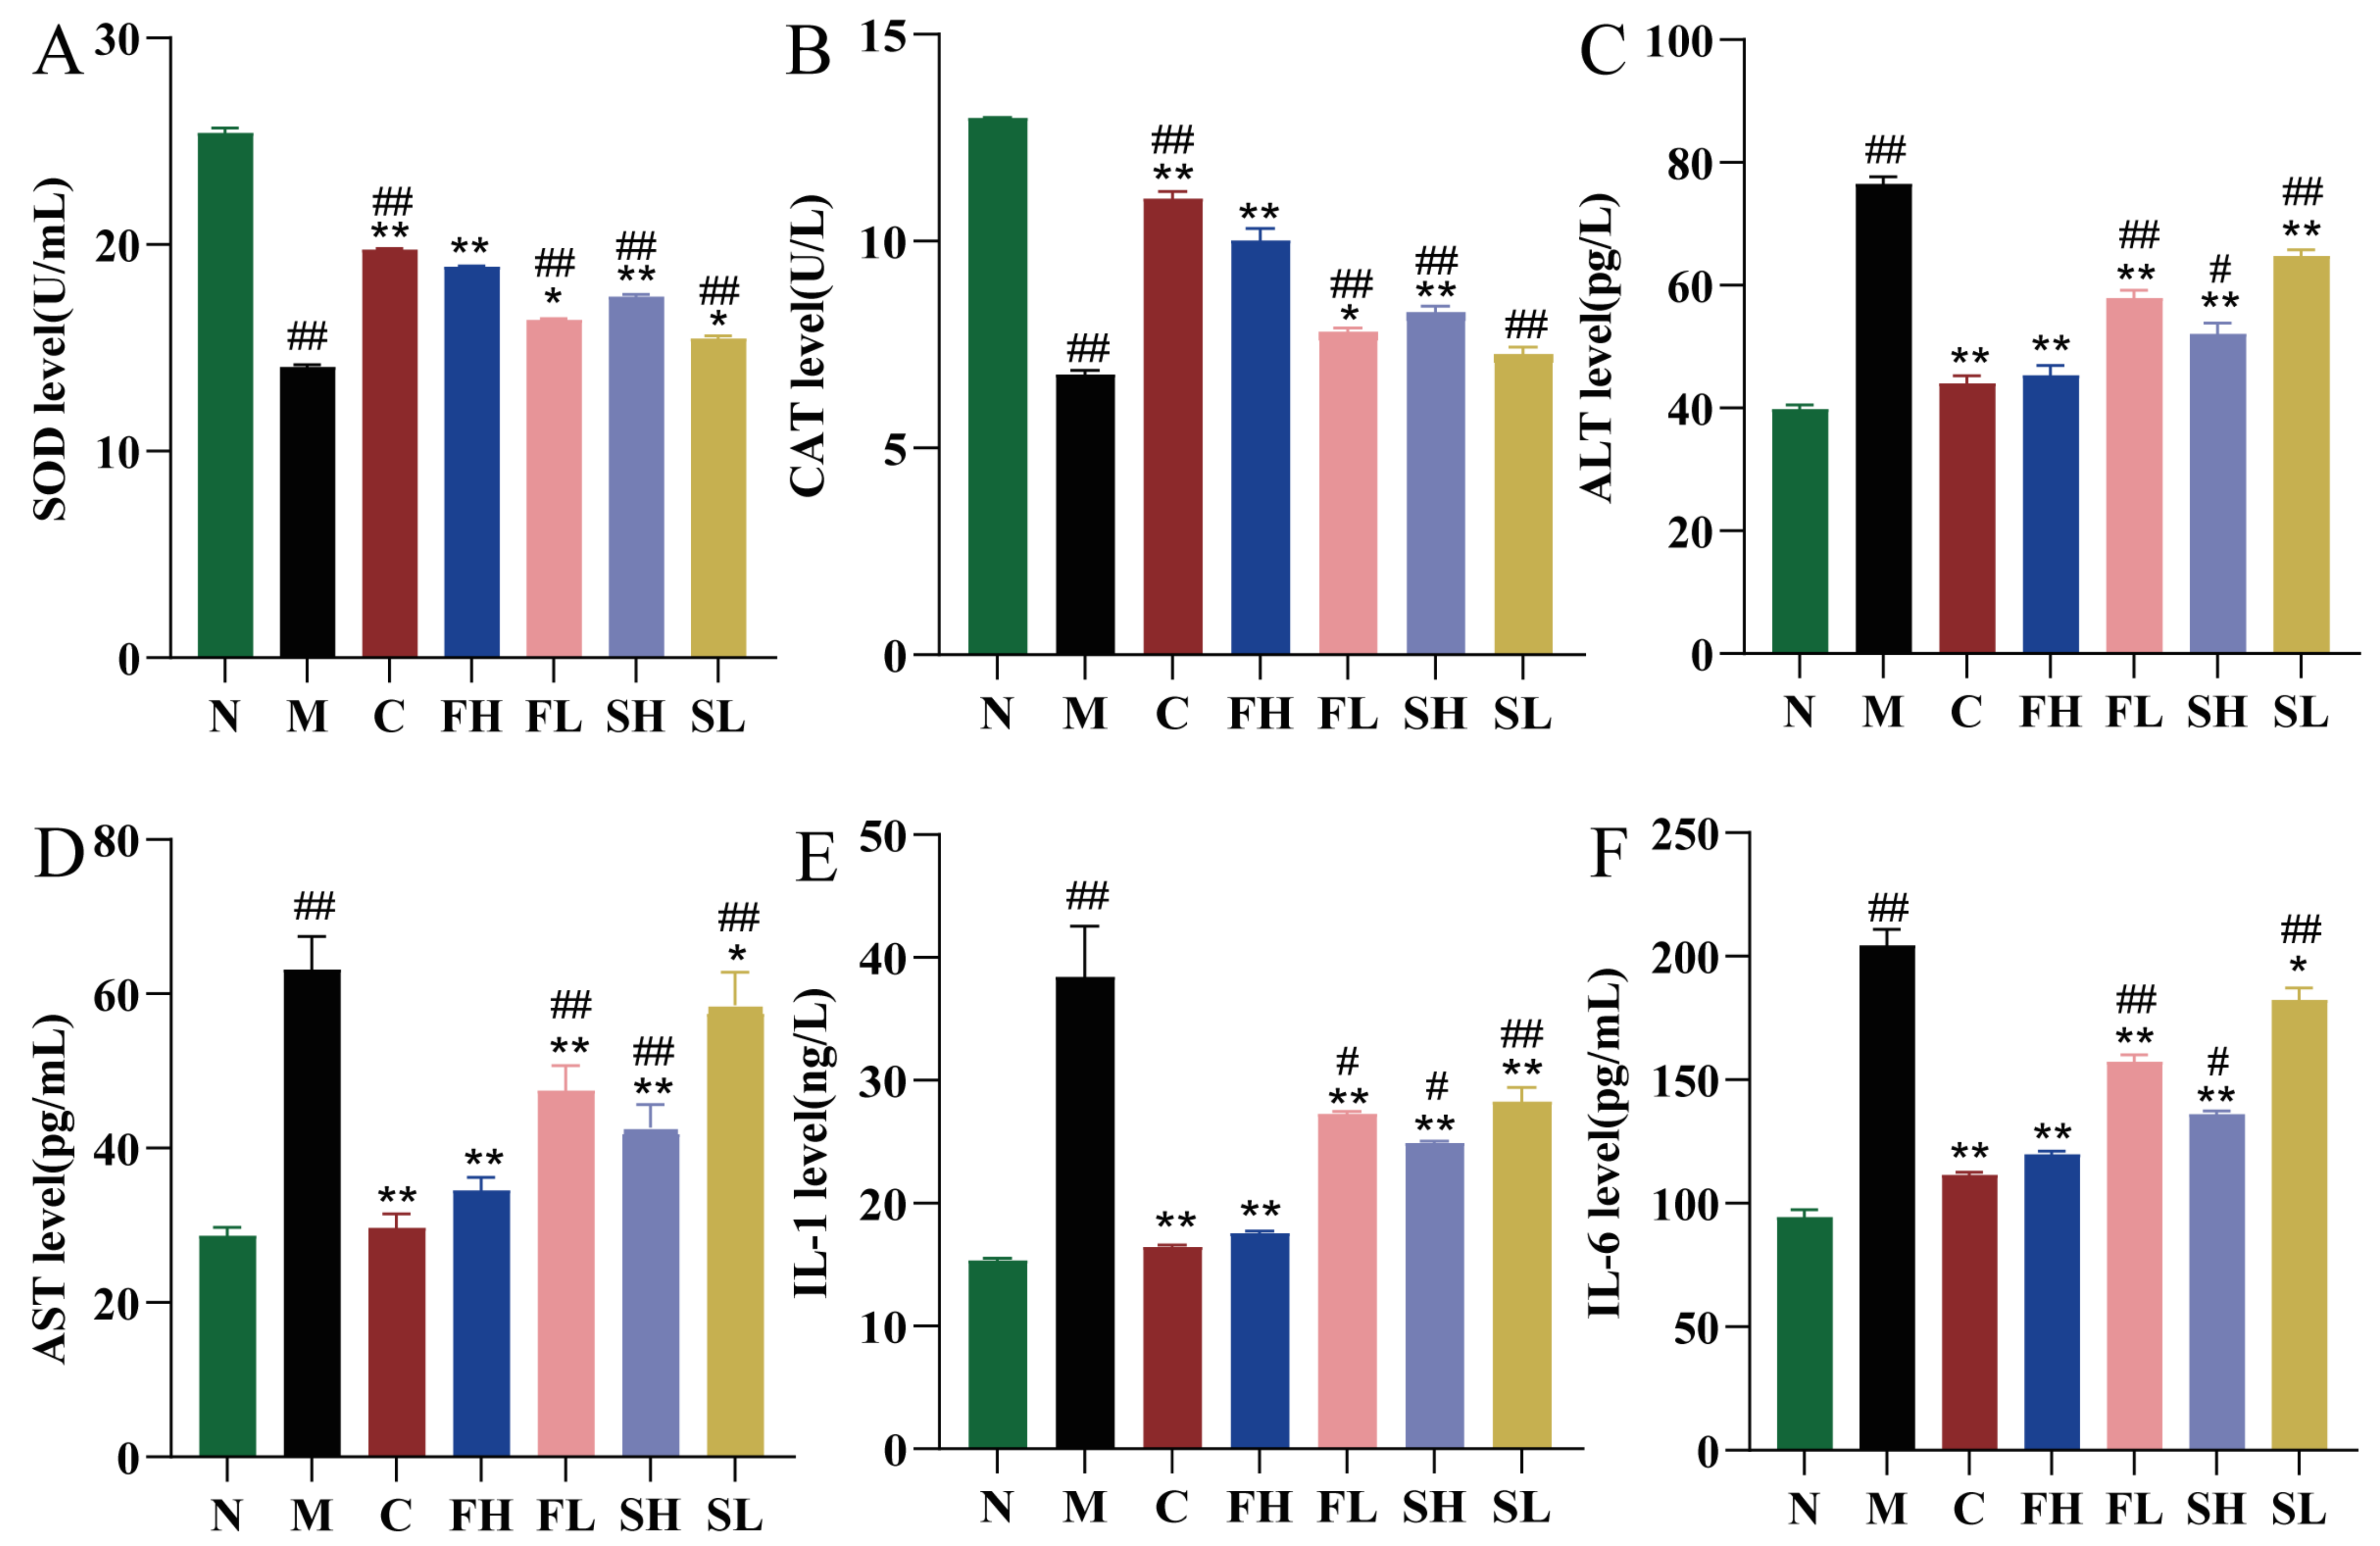
2.3.4. Effects of GF and GS on SOD, CAT, ALT, AST, IL-1, and IL-6 Levels in Mice with ALI
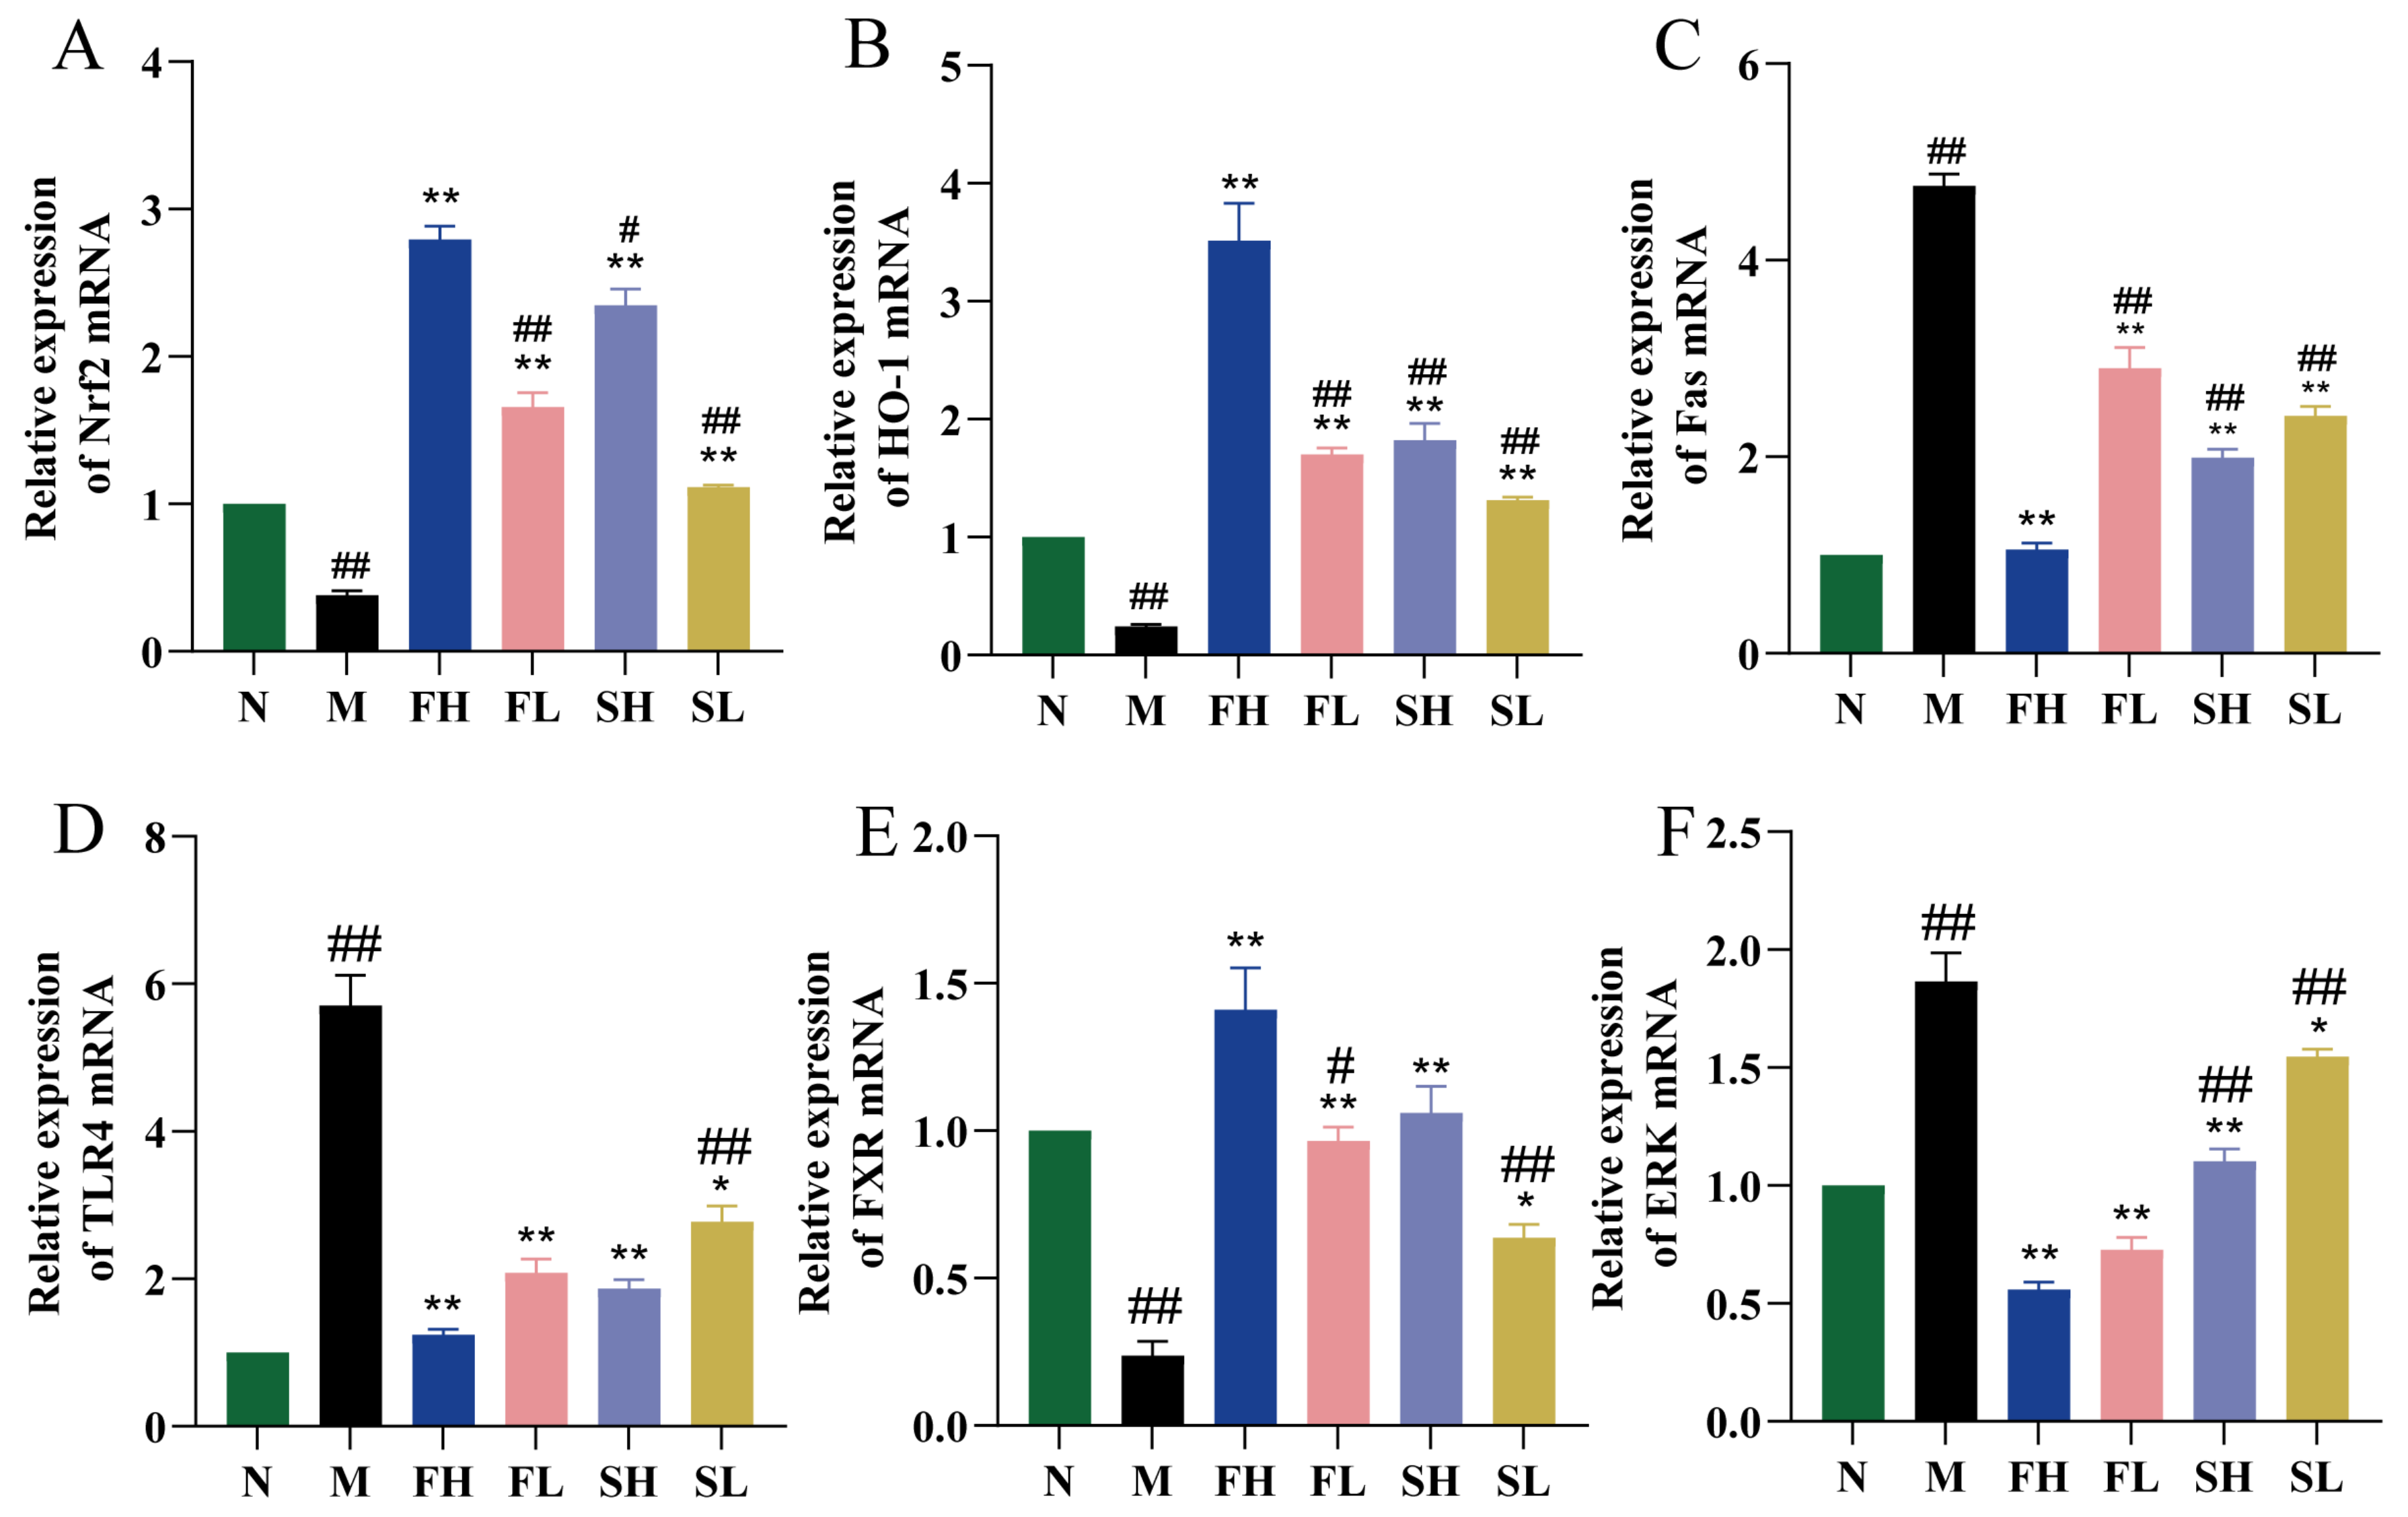
2.3.5. Effects of GF and GS on the Expression Levels of Nrf2, HO-1, TLR4, FAS, ERK, and FXR mRNA in Mice with ALI
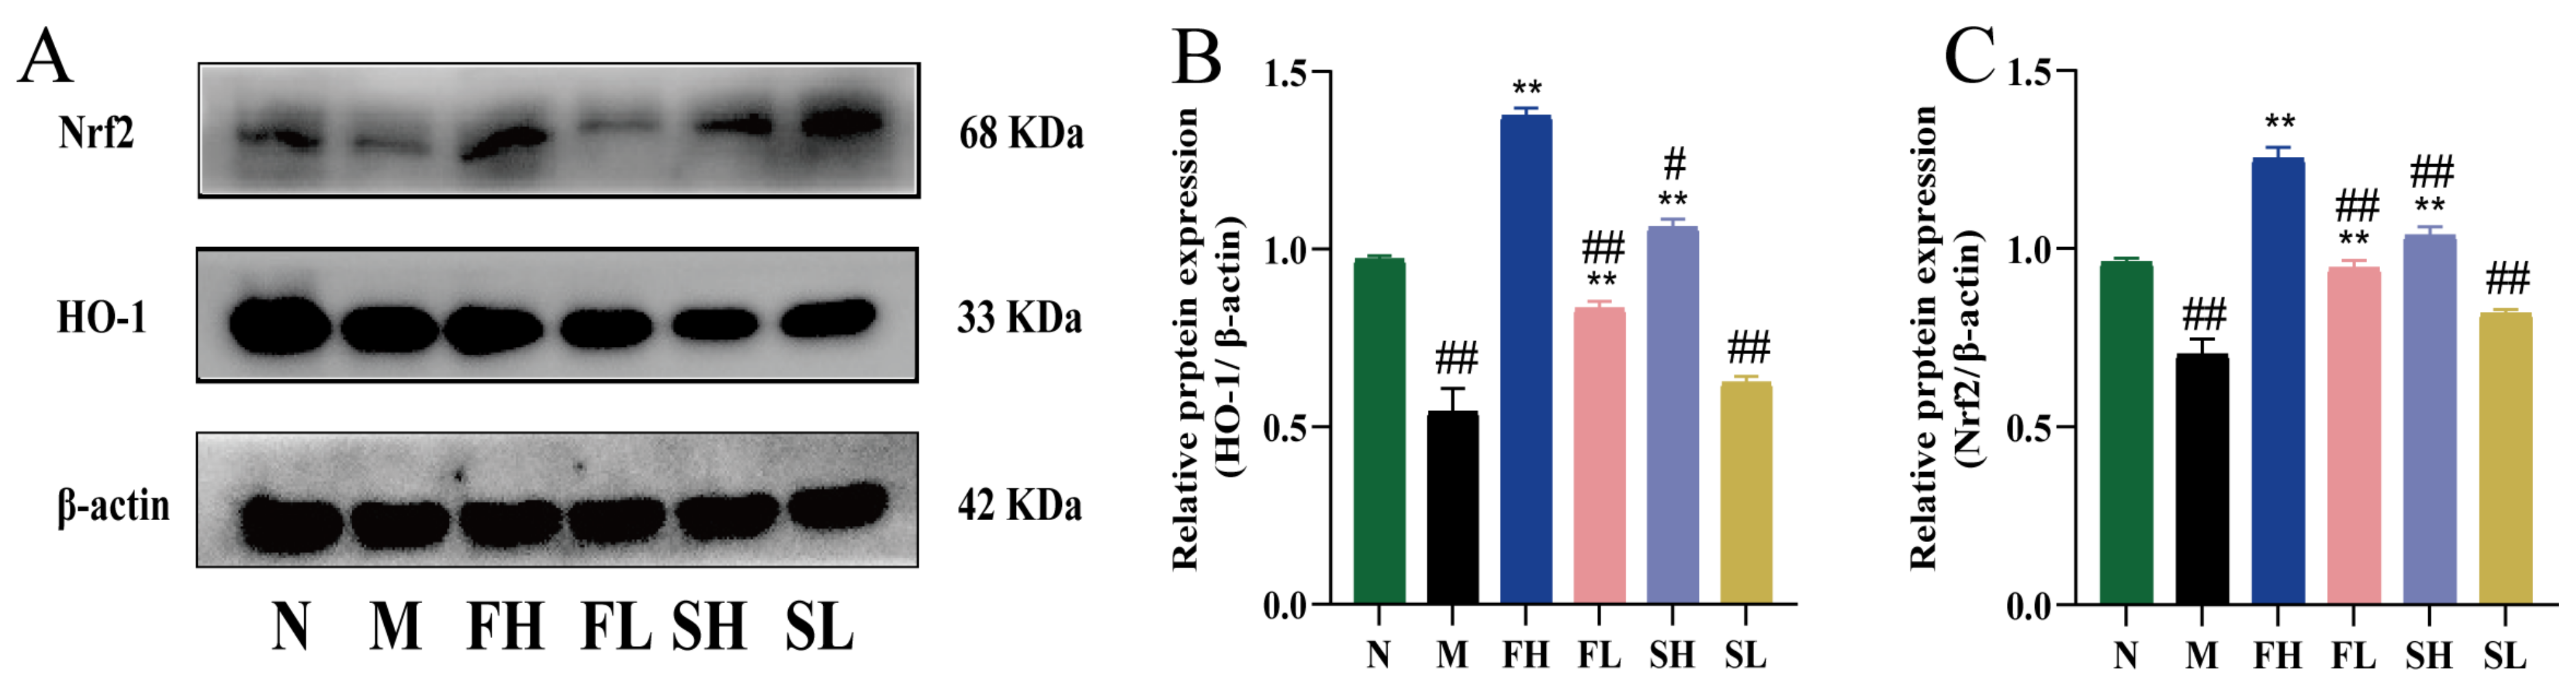
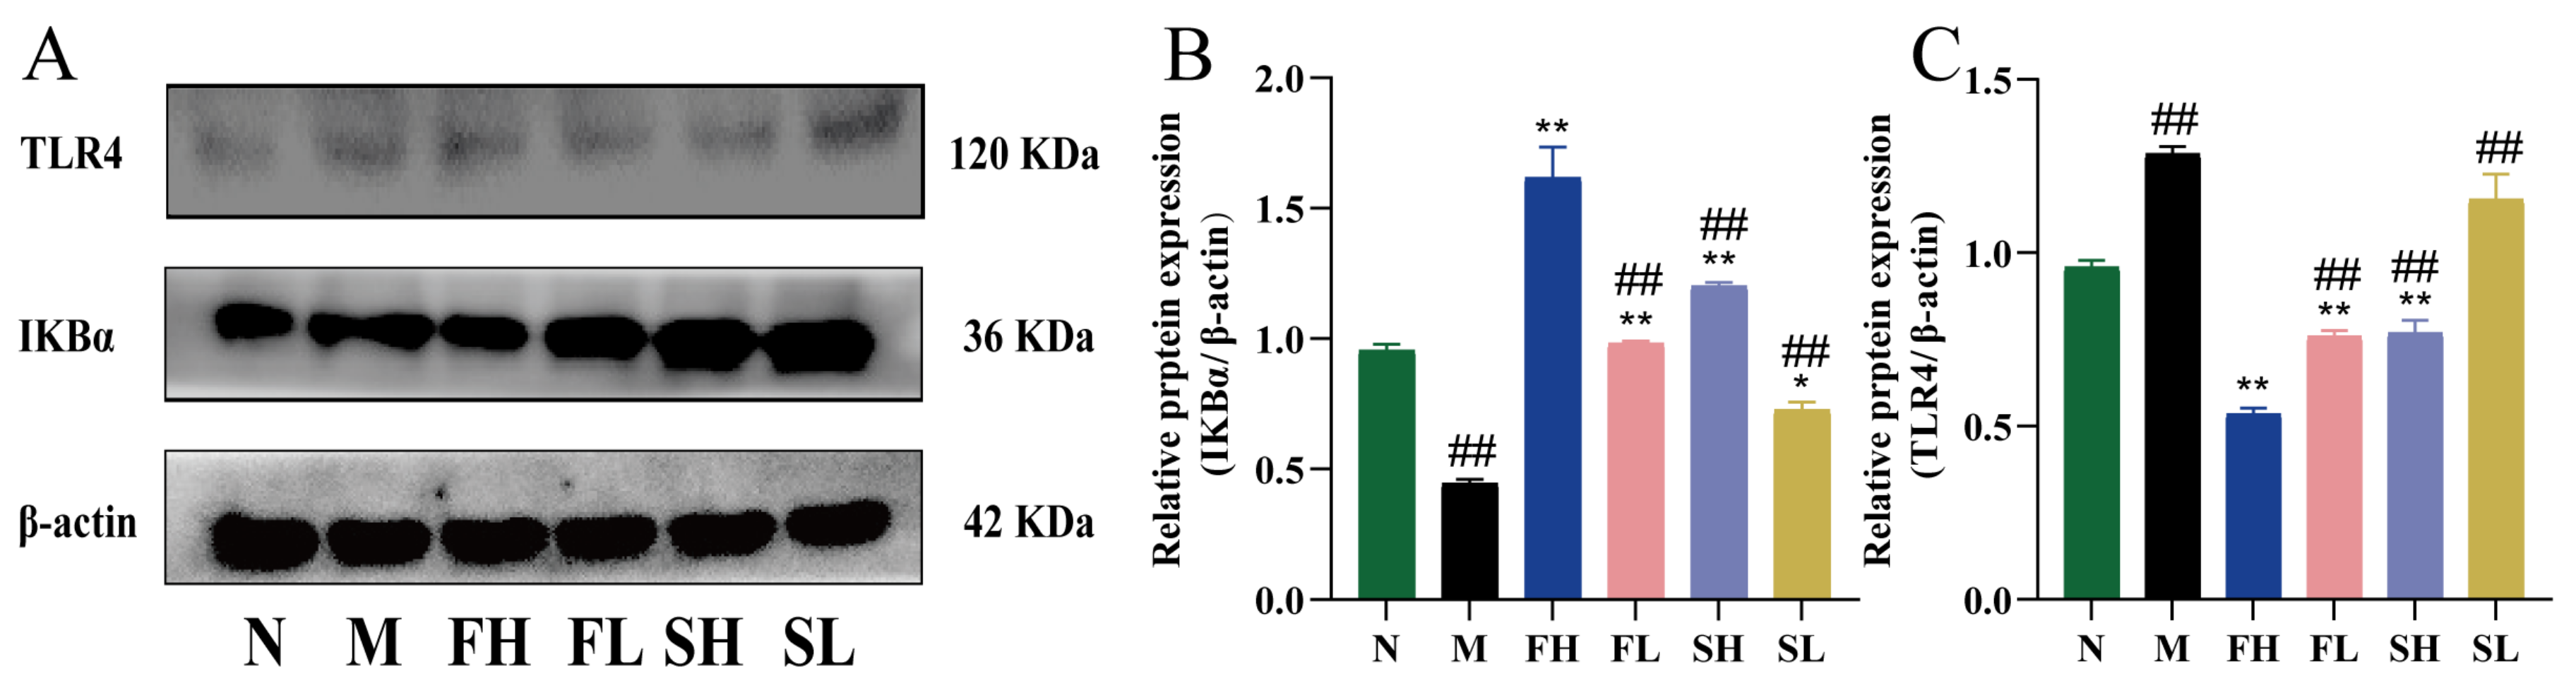
2.3.6. Effects of GF and GS on Protein Expression of HO-1, Nrf2, IκBα and TLR4 in Mice with ALI
3. Discussion
4. Materials and Methods
4.1. Reagents
4.2. Chinese Medicinal Herbs
4.3. Sample Preparation
4.3.1. Preparation of Aqueous Extract of GRR
4.3.2. Preparation of Test Solution
4.3.3. Preparation of Control Solution
4.4. Determination of Chemical Composition of Different Classes of GRR by LC-MS/MS
4.4.1. Chromatographic Conditions
4.4.2. Mass Spectrometry Conditions
4.4.3. Compound Identification Method
4.5. Cellular Experiments
4.5.1. CCK-8 Method to Detect the Protective Effect of GF and GS on Cells
4.5.2. Crystalline Violet Staining
4.5.3. Effects of GF and GS on Liver Function Indexes, Inflammatory Factors, and Oxidative Stress Indexes of HepG2 Cells under the Action of Hydrogen Peroxide
4.5.4. Determination of Antioxidant Potency of GF and GS
4.6. Animal Management
4.6.1. Modeling Drug Administration and Material Collection
4.6.2. Liver Histopathology
4.6.3. Serum Biochemistry to Determine SOD, CAT, AST, ALT, IL-1 and IL-6 Levels
4.6.4. Detection of HO-1, Nrf2, TLR4, Fas, ERK, and FXR mRNA Expression Levels in Mouse Liver Tissues
4.6.5. Detection of HO-1, Nrf2, IκBα, and TLR4 Protein Expression in Mouse Liver Tissue
4.7. Software
4.8. Data Analysis
5. Conclusions
Author Contributions
Funding
Institutional Review Board Statement
Data Availability Statement
Conflicts of Interest
Sample Availability
Abbreviations
| GRR | Gentianae Radix et Rhizoma |
| LC–MS | Liquid chromatography–mass spectrometry |
| GF | GRR-first class |
| GS | GRR-second class |
| RT-qPCR | real-time fluorescence quantitative polymerase chain reaction |
| WB | Western blot |
| ALI | Acute liver injury |
| CHMs | Chinese herbal medicines |
| TCM | Traditional Chinese medicine |
| CAT | Catalase |
| SOD | Superoxide dismutase |
| CCK-8 | Cell Counting Kit-8 |
| IL-1 | Interleukin-1 |
| IL-6 | Interleukin-6 |
| ALT | Alanine aminotransferase |
| AST | Aspartate transaminase |
| Nrf2 | Nuclear Factor erythroid 2-Related Factor 2 |
| HO-1 | Heme oxygenase 1 |
| IKBα | Inhibitory subunit of NF-κBα |
| TLR4 | Recombinant Toll-Like Receptor 4 |
| BW | Body weight |
| HE | Hematoxylin and eosin |
| PBS | Phosphate-buffered saline |
| BCA | Bicinchoninic acid |
| TBST | Tris-HCl buffer salt + Tween-20 |
| ECL | Electrochemiluminescence |
| PCA | Principal component analysis |
| OPLS-DA | Orthogonal partial least squares-discriminant analysis |
| ERK | Extracellular regulated protein kinases |
| Fas | Fatty acid synthetase |
| FXR | Farnesoid X Receptor |
| VIP | Variable importance for the project |
References
- Gao, H.; Wang, Z.; Li, Y.; Qian, Z. Overview of the quality standard research of traditional Chinese medicine. Front. Med. 2011, 5, 195–202. [Google Scholar] [CrossRef] [PubMed]
- Pan, Y.; Shen, T.; Zhang, J.; Zhao, Y.L.; Wang, Y.Z.; Li, W.Y. Simultaneous determination of six index constituents and comparative analysis of four ethnomedicines from genus Gentiana using a UPLC-UV-MS method. Biomed. Chromatogr. 2015, 29, 87–96. [Google Scholar] [CrossRef] [PubMed]
- Chuang, Y.K.; Yang, I.C.; Lo, Y.M.; Tsai, C.Y.; Chen, S. Integration of independent component analysis with near-infrared spectroscopy for analysis of bioactive components in the medicinal plant Gentiana scabra Bunge. J. Food Drug Anal. 2014, 22, 336–344. [Google Scholar] [CrossRef]
- Zhao, R.; Yin, S.; Xue, J.; Liu, C.; Xing, Y.; Yin, H.; Ren, X.; Chen, J.; Jia, D. Sequencing and comparative analysis of chloroplast genomes of three medicinal plants: Gentiana manshurica, G. scabra and G. triflora. Physiol. Mol. Biol. Plants 2022, 28, 1421–1435. [Google Scholar] [CrossRef] [PubMed]
- Tian-Rui, L.; Yan, J.; Hu-Biao, M.; Yu-Yang, Z.; Jun-Hui, Z.; Yuan, Y.; Lu-Qi, H. Biological research of color and quality evaluation in “quality discrimination by character” of Chinese medicine. Zhongguo Zhong Yao Za Zhi 2020, 45, 4545–4554. [Google Scholar]
- Yu, K.Z.; Liu, J.; Guo, B.L.; Zhao, Z.Z.; Hong, H.; Chen, H.B.; Cai, S.Q. Microscopic research on a multi-source traditional Chinese medicine, Astragali Radix. J. Nat. Med. 2014, 68, 340–350. [Google Scholar] [CrossRef]
- Ren, J.L.; Zhang, A.H.; Kong, L.; Han, Y.; Yan, G.L.; Sun, H.; Wang, X.J. Analytical strategies for the discovery and validation of quality-markers of traditional Chinese medicine. Phytomedicine 2020, 67, 153165. [Google Scholar] [CrossRef]
- Jiang, D.Q.; Wang, H.Y.; Kang, C.Z.; Jiang, J.Y.; Du, Y.X.; Zhang, Y.; Wang, S.; Guo, L.P. Influence and mechanism of stress combination on medicinal plants secondary metabolism. Zhongguo Zhong Yao Za Zhi 2020, 45, 2009–2016. [Google Scholar]
- Wang, Y.-M.; Xu, M.; Wang, D.; Zhu, H.-T.; Yang, C.-R.; Zhang, Y.-J. Review on “Long-Dan”, one of the traditional Chinese medicinal herbs recorded in Chinese Pharmacopoeia. Nat. Prod. Bioprospect. 2012, 2, 1–10. [Google Scholar] [CrossRef]
- He, Y.M.; Zhu, S.; Ge, Y.W.; Kazuma, K.; Zou, K.; Cai, S.Q.; Komatsu, K. The anti-inflammatory secoiridoid glycosides from gentianae scabrae radix: The root and rhizome of Gentiana scabra. J. Nat. Med. 2015, 69, 303–312. [Google Scholar] [CrossRef]
- Wu, X. Study on Gentian Grade Standard and near Infrared Quantitative Analysis; Changchun University of Traditional Chinese Medicine: Changchun, China, 2021. [Google Scholar]
- Cai, W.; Xu, H.; Xie, L.; Sun, J.; Sun, T.; Wu, X.; Fu, Q. Purification, characterization and in vitro anticoagulant activity of polysaccharides from Gentiana scabra Bunge roots. Carbohydr. Polym. 2016, 140, 308–313. [Google Scholar] [CrossRef] [PubMed]
- Kondo, Y.; Takano, F.; Hojo, H. Suppression of chemically and immunologically induced hepatic injuries by gentiopicroside in mice. Planta Med. 1994, 60, 414–416. [Google Scholar] [CrossRef] [PubMed]
- Wang, A.Y.; Lian, L.H.; Jiang, Y.Z.; Wu, Y.L.; Nan, J.X. Gentiana manshurica Kitagawa prevents acetaminophen-induced acute hepatic injury in mice via inhibiting JNK/ERK MAPK pathway. World J. Gastroenterol. 2010, 16, 384–391. [Google Scholar] [CrossRef] [PubMed]
- Chang-Liao, W.L.; Chien, C.F.; Lin, L.C.; Tsai, T.H. Isolation of gentiopicroside from Gentianae Radix and its pharmacokinetics on liver ischemia/reperfusion rats. J. Ethnopharmacol. 2012, 141, 668–673. [Google Scholar] [CrossRef]
- Tang, X.; Yang, Q.; Yang, F.; Gong, J.; Han, H.; Yang, L.; Wang, Z. Target profiling analyses of bile acids in the evaluation of hepatoprotective effect of gentiopicroside on ANIT-induced cholestatic liver injury in mice. J. Ethnopharmacol. 2016, 194, 63–71. [Google Scholar] [CrossRef]
- Li, X.; Zhang, Y.; Jin, Q.; Xia, K.L.; Jiang, M.; Cui, B.W.; Wu, Y.L.; Song, S.Z.; Lian, L.H.; Nan, J.X. Liver kinase B1/AMP-activated protein kinase-mediated regulation by gentiopicroside ameliorates P2X7 receptor-dependent alcoholic hepatosteatosis. Br. J. Pharmacol. 2018, 175, 1451–1470. [Google Scholar] [CrossRef]
- Dai, K.; Yi, X.J.; Huang, X.J.; Muhammad, A.; Li, M.; Li, J.; Yang, G.Z.; Gao, Y. Hepatoprotective activity of iridoids, seco-iridoids and analog glycosides from Gentianaceae on HepG2 cells via CYP3A4 induction and mitochondrial pathway. Food Funct. 2018, 9, 2673–2683. [Google Scholar] [CrossRef]
- Hudecová, A.; Hašplová, K.; Miadoková, E.; Magdolenová, Z.; Rinna, A.; Collins, A.R.; Gálová, E.; Vaculčíková, D.; Gregáň, F.; Dušinská, M. Gentiana asclepiadea protects human cells against oxidation DNA lesions. Cell Biochem. Funct. 2012, 30, 101–107. [Google Scholar] [CrossRef]
- Gao, S.; Zhan, Q.; Li, J.; Yang, Q.; Li, X.; Chen, W.; Sun, L. LC-MS/MS method for the simultaneous determination of ethyl gallate and its major metabolite in rat plasma. Biomed. Chromatogr. 2010, 24, 472–478. [Google Scholar] [CrossRef]
- Olennikov, D.N.; Gadimli, A.I.; Isaev, J.I.; Kashchenko, N.I.; Prokopyev, A.S.; Kataeva, T.N.; Chirikova, N.K.; Vennos, C. Caucasian Gentiana Species: Untargeted LC-MS Metabolic Profiling, Antioxidant and Digestive Enzyme Inhibiting Activity of Six Plants. Metabolites 2019, 9, 271. [Google Scholar] [CrossRef]
- Skinder, B.M.; Ganai, B.A.; Wani, A.H. Scientific Study of Gentiana kurroo Royle. Medicines 2017, 4, 74. [Google Scholar] [CrossRef] [PubMed]
- Garcia, J.; Chulia, A.J. 4′-p-Coumaroyl iridoid glucosides from Gentiana pedicellata. Planta Med. 1987, 53, 101–103. [Google Scholar] [CrossRef] [PubMed]
- Zhang, G.; Li, Y.; Wei, W.; Li, J.; Li, H.; Huang, Y.; Guo, D.A. Metabolomics Combined with Multivariate Statistical Analysis for Screening of Chemical Markers between Gentiana scabra and Gentiana rigescens. Molecules 2020, 25, 1228. [Google Scholar] [CrossRef]
- Tan, R.X.; Kong, L.D.; Wei, H.X. Secoiridoid glycosides and an antifungal anthranilate derivative from Gentiana tibetica. Phytochemistry 1998, 47, 1223–1226. [Google Scholar] [CrossRef] [PubMed]
- Chen, Y.; Wang, G.K.; Wu, C.; Qin, M.J. Chemical constituents of Gentiana rhodantha. Zhongguo Zhong Yao Za Zhi 2013, 38, 362–365. [Google Scholar]
- Pan, Y.; Zhang, J.; Zhao, Y.L.; Wang, Y.Z.; Jin, H. Chemotaxonomic Studies of Nine Gentianaceae Species from Western China Based on Liquid Chromatography Tandem Mass Spectrometry and Fourier Transform Infrared Spectroscopy. Phytochem. Anal. 2016, 27, 158–167. [Google Scholar] [CrossRef] [PubMed]
- Wen, C.; Wang, D.; Li, X.; Huang, T.; Huang, C.; Hu, K. Targeted isolation and identification of bioactive compounds lowering cholesterol in the crude extracts of crabapples using UPLC-DAD-MS-SPE/NMR based on pharmacology-guided PLS-DA. J. Pharm. Biomed. Anal. 2018, 150, 144–151. [Google Scholar] [CrossRef]
- Zhou, D.; Lv, D.; Zhang, H.; Cheng, T.; Wang, H.; Lin, P.; Shi, S.; Chen, S.; Shen, J. Quantitative analysis of the profiles of twelve major compounds in Gentiana straminea Maxim. Roots by LC-MS/MS in an extensive germplasm survey in the Qinghai-Tibetan plateau. J. Ethnopharmacol. 2021, 280, 114068. [Google Scholar] [CrossRef]
- Xu, M.; Zhang, M.; Zhang, Y.J.; Yang, C.R. New acylated secoiridoid glucosides from Gentiana straminea (Gentianaceae). Helv. Chim. Acta 2009, 92, 321–327. [Google Scholar] [CrossRef]
- Balijagić, J.; Janković, T.; Zdunić, G.; Bošković, J.; Šavikin, K.; Goćevac, D.; Stanojković, T.; Jovančević, M.; Menković, N. Chemical profile, radical scavenging and cytotoxic activity of yellow gentian leaves (Genitaneae luteae folium) grown in northern regions of Montenegro. Nat. Prod. Commun. 2012, 7, 1487–1490. [Google Scholar] [CrossRef]
- Serafim, V.; Tiugan, D.-A.; Andreescu, N.; Mihailescu, A.; Paul, C.; Velea, I.; Puiu, M.; Niculescu, M.D. Development and validation of a LC–MS/MS-based assay for quantification of free and total omega 3 and 6 fatty acids from human plasma. Molecules 2019, 24, 360. [Google Scholar] [CrossRef] [PubMed]
- Liu, Q.; Chou, G.X.; Wang, Z.T. New iridoid and secoiridoid glucosides from the roots of Gentiana manshurica. Helv. Chim. Acta 2012, 95, 1094–1101. [Google Scholar] [CrossRef]
- Xu, M.; Wang, D.; Zhang, Y.J.; Yang, C.R. Iridoidal glucosides from Gentiana rhodantha. J. Asian Nat. Prod. Res. 2008, 10, 491–498. [Google Scholar] [CrossRef] [PubMed]
- Han, D.E.; Yue, Z.S.; Li, H.W.; Liu, G.Z.; Cai, B.R.; Tian, P. Anti-depressant components and mechanism of Rehmanniae Radix based on UPLC-Q-Orbitrap HRMS and network pharmacology. Zhongguo Zhong Yao Za Zhi 2022, 47, 1051–1063. [Google Scholar]
- Kim, J.-A.; Son, N.S.; Son, J.K.; Jahng, Y.; Chang, H.W.; Jang, T.S.; Na, M.; Lee, S.-H. Two new secoiridoid glycosides from the rhizomes of Gentiana scabra Bunge. Arch. Pharmacal Res. 2009, 32, 863–867. [Google Scholar] [CrossRef]
- Suh, H.W.; Lee, K.B.; Kim, K.S.; Yang, H.J.; Choi, E.K.; Shin, M.H.; Park, Y.S.; Na, Y.C.; Ahn, K.S.; Jang, Y.P.; et al. A bitter herbal medicine Gentiana scabra root extract stimulates glucagon-like peptide-1 secretion and regulates blood glucose in db/db mouse. J. Ethnopharmacol. 2015, 172, 219–226. [Google Scholar] [CrossRef]
- Alarcón, A.B.; Cuesta-Rubio, O.; Pérez, J.C.; Piccinelli, A.L.; Rastrelli, L. Constituents of the Cuban endemic species Calophyllum pinetorum. J. Nat. Prod. 2008, 71, 1283–1286. [Google Scholar] [CrossRef]
- Xiang, J.M.; Zhong, G.Y.; Jiang, W.; Ren, G. Analysis of varieties and standards of Saxifragaceae medicinal plants used in Tibetan medicine. Zhongguo Zhong Yao Za Zhi 2021, 46, 488–493. [Google Scholar]
- Cuong, N.M.; Huong, T.T.; Son, N.T.; Cuong, T.D.; Van, D.T.; Khanh, P.N.; Ha, V.T.; Tram, N.C.; Long, P.Q.; Kim, Y.H. Morinlongosides A-C, Two New Naphthalene Glycoside and a New Iridoid Glycoside from the Roots of Morinda longissima. Chem. Pharm. Bull. 2016, 64, 1230–1234. [Google Scholar] [CrossRef]
- Shi, X.; Luo, S.; Zhong, K.; Hu, X.; Zhang, Z. Chemical profiling, quantitation, and bioactivities of Du-Zhong tea. Food Chem. 2022, 394, 133552. [Google Scholar] [CrossRef]
- Park, C.H.; Tanaka, T.; Kim, J.H.; Cho, E.J.; Park, J.C.; Shibahara, N.; Yokozawa, T. Hepato-protective effects of loganin, iridoid glycoside from Corni Fructus, against hyperglycemia-activated signaling pathway in liver of type 2 diabetic db/db mice. Toxicology 2011, 290, 14–21. [Google Scholar] [CrossRef]
- Zhang, Y.; Yang, X.; Wang, S.; Song, S.; Yang, X. Gentiopicroside prevents alcoholic liver damage by improving mitochondrial dysfunction in the rat model. Phytother. Res. 2021, 35, 2230–2251. [Google Scholar] [CrossRef]
- Yang, Y.; Li, J.; Wei, C.; He, Y.; Cao, Y.; Zhang, Y.; Sun, W.; Qiao, B.; He, J. Amelioration of nonalcoholic fatty liver disease by swertiamarin in fructose-fed mice. Phytomedicine 2019, 59, 152782. [Google Scholar] [CrossRef] [PubMed]
- Zhang, Z.F.; Liu, Y.; Lu, L.Y.; Luo, P. Hepatoprotective activity of Gentiana veitchiorum Hemsl. against carbon tetrachloride-induced hepatotoxicity in mice. Chin. J. Nat. Med. 2014, 12, 488–494. [Google Scholar] [CrossRef] [PubMed]
- Zhang, Q.; Liu, J.; Duan, H.; Li, R.; Peng, W.; Wu, C. Activation of Nrf2/HO-1 signaling: An important molecular mechanism of herbal medicine in the treatment of atherosclerosis via the protection of vascular endothelial cells from oxidative stress. J. Adv. Res. 2021, 34, 43–63. [Google Scholar] [CrossRef] [PubMed]
- Jiang, L.; Zhang, H.; Xiao, D.; Wei, H.; Chen, Y. Farnesoid X receptor (FXR): Structures and ligands. Comput. Struct. Biotechnol. J. 2021, 19, 2148–2159. [Google Scholar] [CrossRef] [PubMed]
- Fang, W.; Bi, D.; Zheng, R.; Cai, N.; Xu, H.; Zhou, R.; Lu, J.; Wan, M.; Xu, X. Identification and activation of TLR4-mediated signalling pathways by alginate-derived guluronate oligosaccharide in RAW264.7 macrophages. Sci. Rep. 2017, 7, 1663. [Google Scholar] [CrossRef] [PubMed]
- Jain, R.; Watson, U.; Vasudevan, L.; Saini, D.K. ERK Activation Pathways Downstream of GPCRs. Int. Rev. Cell Mol. Biol. 2018, 338, 79–109. [Google Scholar]
- Wang, S.; Xu, Y.; Chen, P.; Zhang, Y. Structural characterization of secoiridoid glycosides by highperformance liquid chromatography/electrospray ionization mass spectrometry. Rapid Commun. Mass. Spectrom. 2014, 28, 1569–1579. [Google Scholar] [CrossRef]
- Pan, Y.; Zhao, Y.L.; Zhang, J.; Li, W.Y.; Wang, Y.Z. Phytochemistry and Pharmacological Activities of the Genus gentiana (Gentianaceae). Chem. Biodivers. 2016, 13, 107–150. [Google Scholar] [CrossRef]
- Zeng, W.; Han, H.; Tao, Y.; Yang, L.; Wang, Z.; Chen, K. Identification of bio-active metabolites of gentiopicroside by UPLC/Q-TOF MS and NMR. Biomed. Chromatogr. 2013, 27, 1129–1136. [Google Scholar] [CrossRef] [PubMed]
- Theodoridis, G.A.; Gika, H.G.; Want, E.J.; Wilson, I.D. Liquid chromatography-mass spectrometry based global metabolite profiling: A review. Anal. Chim. Acta 2012, 711, 7–16. [Google Scholar] [CrossRef] [PubMed]
- Liu, Y.; Zhou, J.L.; Liu, P.; Sun, S.; Li, P. Chemical markers’ fishing and knockout for holistic activity and interaction evaluation of the components in herbal medicines. J. Chromatogr. A 2010, 1217, 5239–5245. [Google Scholar] [CrossRef] [PubMed]
- Jiang, R.W.; Wong, K.L.; Chan, Y.M.; Xu, H.X.; But, P.P.; Shaw, P.C. Isolation of iridoid and secoiridoid glycosides and comparative study on Radix gentianae and related adulterants by HPLC analysis. Phytochemistry 2005, 66, 2674–2680. [Google Scholar] [CrossRef] [PubMed]
- Zhou, C.; Liu, A.; Liu, G.; Yang, C.; Zhou, Q.; Li, H.; Yang, H.; Yang, M.; Li, G.; Si, H.; et al. Protective Effects of Sophorae tonkinensis Gagnep. (Fabaceae) Radix et Rhizoma Water Extract on Carbon Tetrachloride-Induced Acute Liver Injury. Molecules 2022, 27, 8650. [Google Scholar] [CrossRef]


| No. | t | Name | Molecular Formula | Ionization Mode | m/z | Fragmentation Ion | A1 1 | A2 1 | A1/A2 | Literature |
|---|---|---|---|---|---|---|---|---|---|---|
| 1 | 0.27 | ethyl gallate | C9H10O5 | [M + FA − H] | 242.900 | 197/98 | 27,202 | 24,505 | 1.11 | [20] |
| 2 | 2.90 | loganin | C11H16O5 | [M + FA − H] | 273.050 | 227/113 | 266,412 | 105,047 | 2.54 | [21] |
| 3 | 3.34 | 3-episwertiajaposide c | C17H24O10 | [M − H] | 387.250 | 193 | 1,178,076 | 1,043,432 | 1.13 | [22] |
| 4 | 3.37 | 2′-O-(p-Coumaroyl) loganin | C27H34O12 | [M − H] | 549.350 | 513/256 | 3,874,778 | 2,847,413 | 1.36 | [23] |
| 5 | 3.96 | 2′-O-(2,3-dihyben)-swertamairn | C23H26O13 | [M − H] | 509.300 | 254 | 562,969 | 312,224 | 1.80 | [24] |
| 6 | 6.45 | 10-Hydro-9-hydroxysweroside | C16H24O10 | [M + FA − H] | 421.400 | 375/187 | 111,956 | 49,269 | 2.27 | [25] |
| 7 | 7.04 | 1,3,7-Trihydroxy-4,8-dimethoxystigmasterone | C15H12O7 | [M + FA − H] | 349.200 | 303/151 | 39,312 | 13,895 | 2.83 | [26] |
| 8 | 7.19 | isovitexin | C21H20O10 | [M + FA − H] | 477.150 | 431/215 | 46,038 | 13,171 | 3.50 | [27] |
| 9 | 7.67 | tianmu dihuangoside a | C15H22O8 | [M + FA − H] | 375.300 | 327/163 | 35,038 | 25,641 | 1.37 | / |
| 10 | 7.77 | 8-Epiloganic acid | C16H24O10 | [M − H] | 375.200 | 187 | 49,097 | 16,812 | 2.92 | [28] |
| 11 | 7.91 | secologanoside | C16H22O11 | [M − H] | 389.250 | 194 | 40,310 | 20,481 | 1.97 | [24] |
| 12 | 8.01 | trilobatin | C21H24O10 | [M − H] | 435.300 | 217 | 30,176 | 18,759 | 1.61 | [29] |
| 13 | 8.14 | vanilloloside | C13H16O9 | [M − H] | 315.250 | 157 | 334,352 | 409,370 | 0.82 | [24] |
| 14 | 8.18 | mangiferin | C19H18O11 | [M − H] | 421.250 | 212/210 | 1,144,870 | 437,852 | 2.61 | [24] |
| 15 | 8.69 | 2′-(2,3-dihydroxybenzoyl)-gentiopicroside | C23H24O12 | [M + FA − H] | 537.350 | 491/245 | 159,081 | 69,087 | 2.30 | [30] |
| 16 | 8.99 | glu-caffeic acid | C15H18O9 | [M − H] | 341.350 | 170 | 59,945 | 39,519 | 1.52 | [24] |
| 17 | 9.07 | eustomorusside | C16H24O12 | [M − H] | 407.400 | 205 | 80,748 | 57,239 | 1.41 | [31] |
| 18 | 10.04 | 1-O-β-d-Glucopyranosyl-4-epiamplexine | C16H26O9 | [M + FA − H] | 407.300 | 203 | 195,450 | 69,172 | 2.83 | / |
| 19 | 10.43 | secoxyloganin | C19H16O10 | [M + FA − H] | 449.300 | 405/201 | 252,412 | 97,601 | 2.59 | [24] |
| 20 | 10.61 | morroniside | C17H26O11 | [M − H] | 451.350 | 407/204 | 275,463 | 141,987 | 1.94 | [24] |
| 21 | 10.78 | eustomoside | C16H22O11 | [M − H] | 389.250 | 389/194 | 500,658 | 164,340 | 3.05 | [31] |
| 22 | 11.01 | 6-O-d-glu gentiopicroside | C22H30O14 | [M − H] | 563.400 | 517/258 | 601,199 | 189,514 | 3.17 | [24] |
| 23 | 11.63 | swertiamarin | C16H22O10 | [M + FA − H] | 419.300 | 373/186 | 924,346 | 307,549 | 3.01 | [24] |
| 24 | 11.93 | 6-keto-8-acetyl-leptoside | C17H24O11 | [M + FA − H] | 449.350 | 403/201 | 235,341 | 112,837 | 2.09 | / |
| 25 | 12.14 | 6‴-O-β-d-glucopyranosyltrifloroside | C22H30O14 | [M + FA − H] | 563.250 | 517/258 | 51,399 | 39,543 | 1.30 | [32] |
| 26 | 12.27 | gentiopicroside | C16H20O9 | [M + FA − H] | 401.200 | 355/177 | 2,998,944 | 1,797,106 | 1.67 | [24] |
| 27 | 12.47 | 6′-O-vanilloyl-8-epikingiside | C25H30O14 | [M − H] | 553.500 | 276 | 50,572 | 30,357 | 1.67 | / |
| 28 | 12.71 | 3′-O-acetylsweroside | C18H24O10 | [M − H] | 399.200 | 199 | 64,698 | 63,471 | 1.02 | [33] |
| 29 | 13.97 | 7-O-glucose-isoorientin | C27H26O17 | [M + FA − H] | 639.400 | 621/310 | 23,688 | 52,604 | 0.45 | / |
| 30 | 14.23 | dangonin | C16H22O9 | [M + FA − H] | 403.350 | 357/178 | 92,849 | 61,409 | 1.51 | [24] |
| 31 | 14.53 | syringin | C17H24O9 | [M − H] | 371.250 | 185 | 46,683 | 33,030 | 1.41 | [24] |
| 32 | 15.28 | 6′-O-glu gentiopicroside | C22H30O14 | [M − H] | 497.600 | 258 | 3850 | 43,159 | 0.89 | [24] |
| 33 | 15.38 | gentrigeoside a | C36H60O12 | [M − H] | 683.450 | 341 | 288,876 | 83,816 | 3.45 | [24] |
| 34 | 15.62 | caryptoside | C17H26O11 | [M − H] | 405.450 | 404/202 | 57,483 | 25,322 | 2.27 | / |
| 35 | 16.23 | kogen glycol | C20H50O2 | [M + FA − H] | 487.450 | 321/160 | 82,442 | 32,002 | 2.58 | [24] |
| 36 | 16.41 | gentianidine | C9H6O4 | [M + FA − H] | 223.200 | 177/88 | 52,216 | 20,032 | 2.61 | / |
| 37 | 16.53 | 4″-O-β-d-Glucopyranosyl-6′-O-(4-O-β-d glucopyranosylcaffeoyl) linearoside | C46H56O25 | [M − H] | 1007.600 | 503 | 278,267 | 70,719 | 3.93 | / |
| 38 | 17.18 | erythricine | C10H9NO2 | [M + FA − H] | 220.100 | 174/86 | 50,212 | 47,581 | 1.06 | / |
| 39 | 17.24 | strychnic acid 11-O-β-glucopyranosyl ester | C22H34O15 | [M − H] | 539.400 | 537/268 | 140,303 | 77,311 | 1.81 | [34] |
| 40 | 17.38 | amaropanin | C29H30O12 | [M − H] | 569.300 | 284 | 58,034 | 56,590 | 1.03 | / |
| 41 | 17.61 | morinlongoside c | C22H32O15 | [M + FA − H] | 602.550 | 535/267 | 39,725 | 14,593 | 2.72 | / |
| 42 | 18.60 | trifloroside | C35H42O20 | [M + FA − H] | 826.800 | 781/390 | 223,134 | 265,386 | 0.84 | / |
| 43 | 19.21 | acremoxanthone d | C36H60O10 | [M + FA − H] | 697.350 | 651/325 | 70,327 | 41,369 | 1.70 | / |
| 44 | 20.75 | 6,7-dehydro-8-acetyl-rhamnoside | C17H24O10 | [M + FA − H] | 433.300 | 387/193 | 4230 | 36,541 | 1.16 | / |
| 45 | 21.30 | rehmannioside c | C30H42O17 | [M + FA − H] | 740.650 | 673/336 | 122,115 | 99,402 | 1.23 | [35] |
| 46 | 22.79 | dedihydroxybenzoate-macrophylloside | C33H40O19 | [M − H] | 739.100 | 369 | 138,156 | 142,501 | 0.97 | / |
| 47 | 24.18 | 6‴-O-β-d-Glucopyranosyltrifloroside | C41H52O25 | [M − H] | 943.550 | 471 | 37,499 | 24,574 | 1.53 | [36] |
| 48 | 26.24 | 2′-O-Caffeoylloganin | C27H34O13 | [M + FA − H] | 610.750 | 565/282 | 146,350 | 75,618 | 1.94 | / |
| 49 | 28.95 | 4‴-O-β-d-Glucopyranosylscabraside | C46H54O25 | [M − H] | 1005.550 | 502 | 267,168 | 112,441 | 2.38 | [36] |
| 50 | 30.65 | rindoside | C35H42O21 | [M + FA − H] | 843.400 | 797/398 | 70,154 | 49,064 | 1.43 | [37] |
| 51 | 32.54 | pinetoxanthone | C25H24N6O | [M + FA − H] | 424.500 | 412/205 | 111,474 | 73,624 | 1.51 | [38] |
| 52 | 32.64 | tianmu dihuangoside e | C15H22O8 | [M − H] | 329.400 | 164 | 347,026 | 598,268 | 0.58 | / |
| 53 | 36.30 | deglu-trifloroside | C29H32O15 | [M − H] | 619.350 | 309 | 45,047 | 49,987 | 0.90 | [24] |
| Gene | Forward Primer Sequence (5′ → 3′) | Reverse Primer Sequence (5′ → 3′) |
|---|---|---|
| β-actin | CATTGCTGACAGGATGCAGAAG | TGCTGGAAGGTGGACAGTGAGG |
| HO-1 | CAGAGTTTCTTCGCCAGAGG | TGAGTGTGAGGACCCATCG |
| Nrf2 | ATCCTTTGGAGGCAAGACAT | TCCTGTTCCTTCTGGAGTTG |
| TLR4 | TAAGTGCCGAGTCTGAGTGTAA | AACCCTTATTGTCATTCCCAG |
| Fas | ATGTCCGGGATCTGGGTTCACTTGT | TTAAACCAAGTTTTCACTTTCATT |
| ERK | ACCGTGACCTCAAGCCTTCC | GATGCAGCCCACAGACCAAA |
| FXR | AGGGGTGTAAAGGTTTCTTCAGGA | ACACTTTCTTCGCATGTACATATCCAT |
Disclaimer/Publisher’s Note: The statements, opinions and data contained in all publications are solely those of the individual author(s) and contributor(s) and not of MDPI and/or the editor(s). MDPI and/or the editor(s) disclaim responsibility for any injury to people or property resulting from any ideas, methods, instructions or products referred to in the content. |
© 2023 by the authors. Licensee MDPI, Basel, Switzerland. This article is an open access article distributed under the terms and conditions of the Creative Commons Attribution (CC BY) license (https://creativecommons.org/licenses/by/4.0/).
Share and Cite
Kou, B.; Jiang, Y.; Chen, Y.; Yang, J.; Sun, J.; Yan, Y.; Weng, L.; Xiao, C. A Study of Gentianae Radix et Rhizoma Class Differences Based on Chemical Composition and Core Efficacy. Molecules 2023, 28, 7132. https://doi.org/10.3390/molecules28207132
Kou B, Jiang Y, Chen Y, Yang J, Sun J, Yan Y, Weng L, Xiao C. A Study of Gentianae Radix et Rhizoma Class Differences Based on Chemical Composition and Core Efficacy. Molecules. 2023; 28(20):7132. https://doi.org/10.3390/molecules28207132
Chicago/Turabian StyleKou, Baixin, Yuxin Jiang, Yanan Chen, Jingrong Yang, Jin Sun, Yan Yan, Lili Weng, and Chunping Xiao. 2023. "A Study of Gentianae Radix et Rhizoma Class Differences Based on Chemical Composition and Core Efficacy" Molecules 28, no. 20: 7132. https://doi.org/10.3390/molecules28207132