

Comparative Analysis of the Wood Metabolites of Three Poplar Clones Using UPLC-Triple-TOF-MS
 , , ,
, , ,
Abstract
:
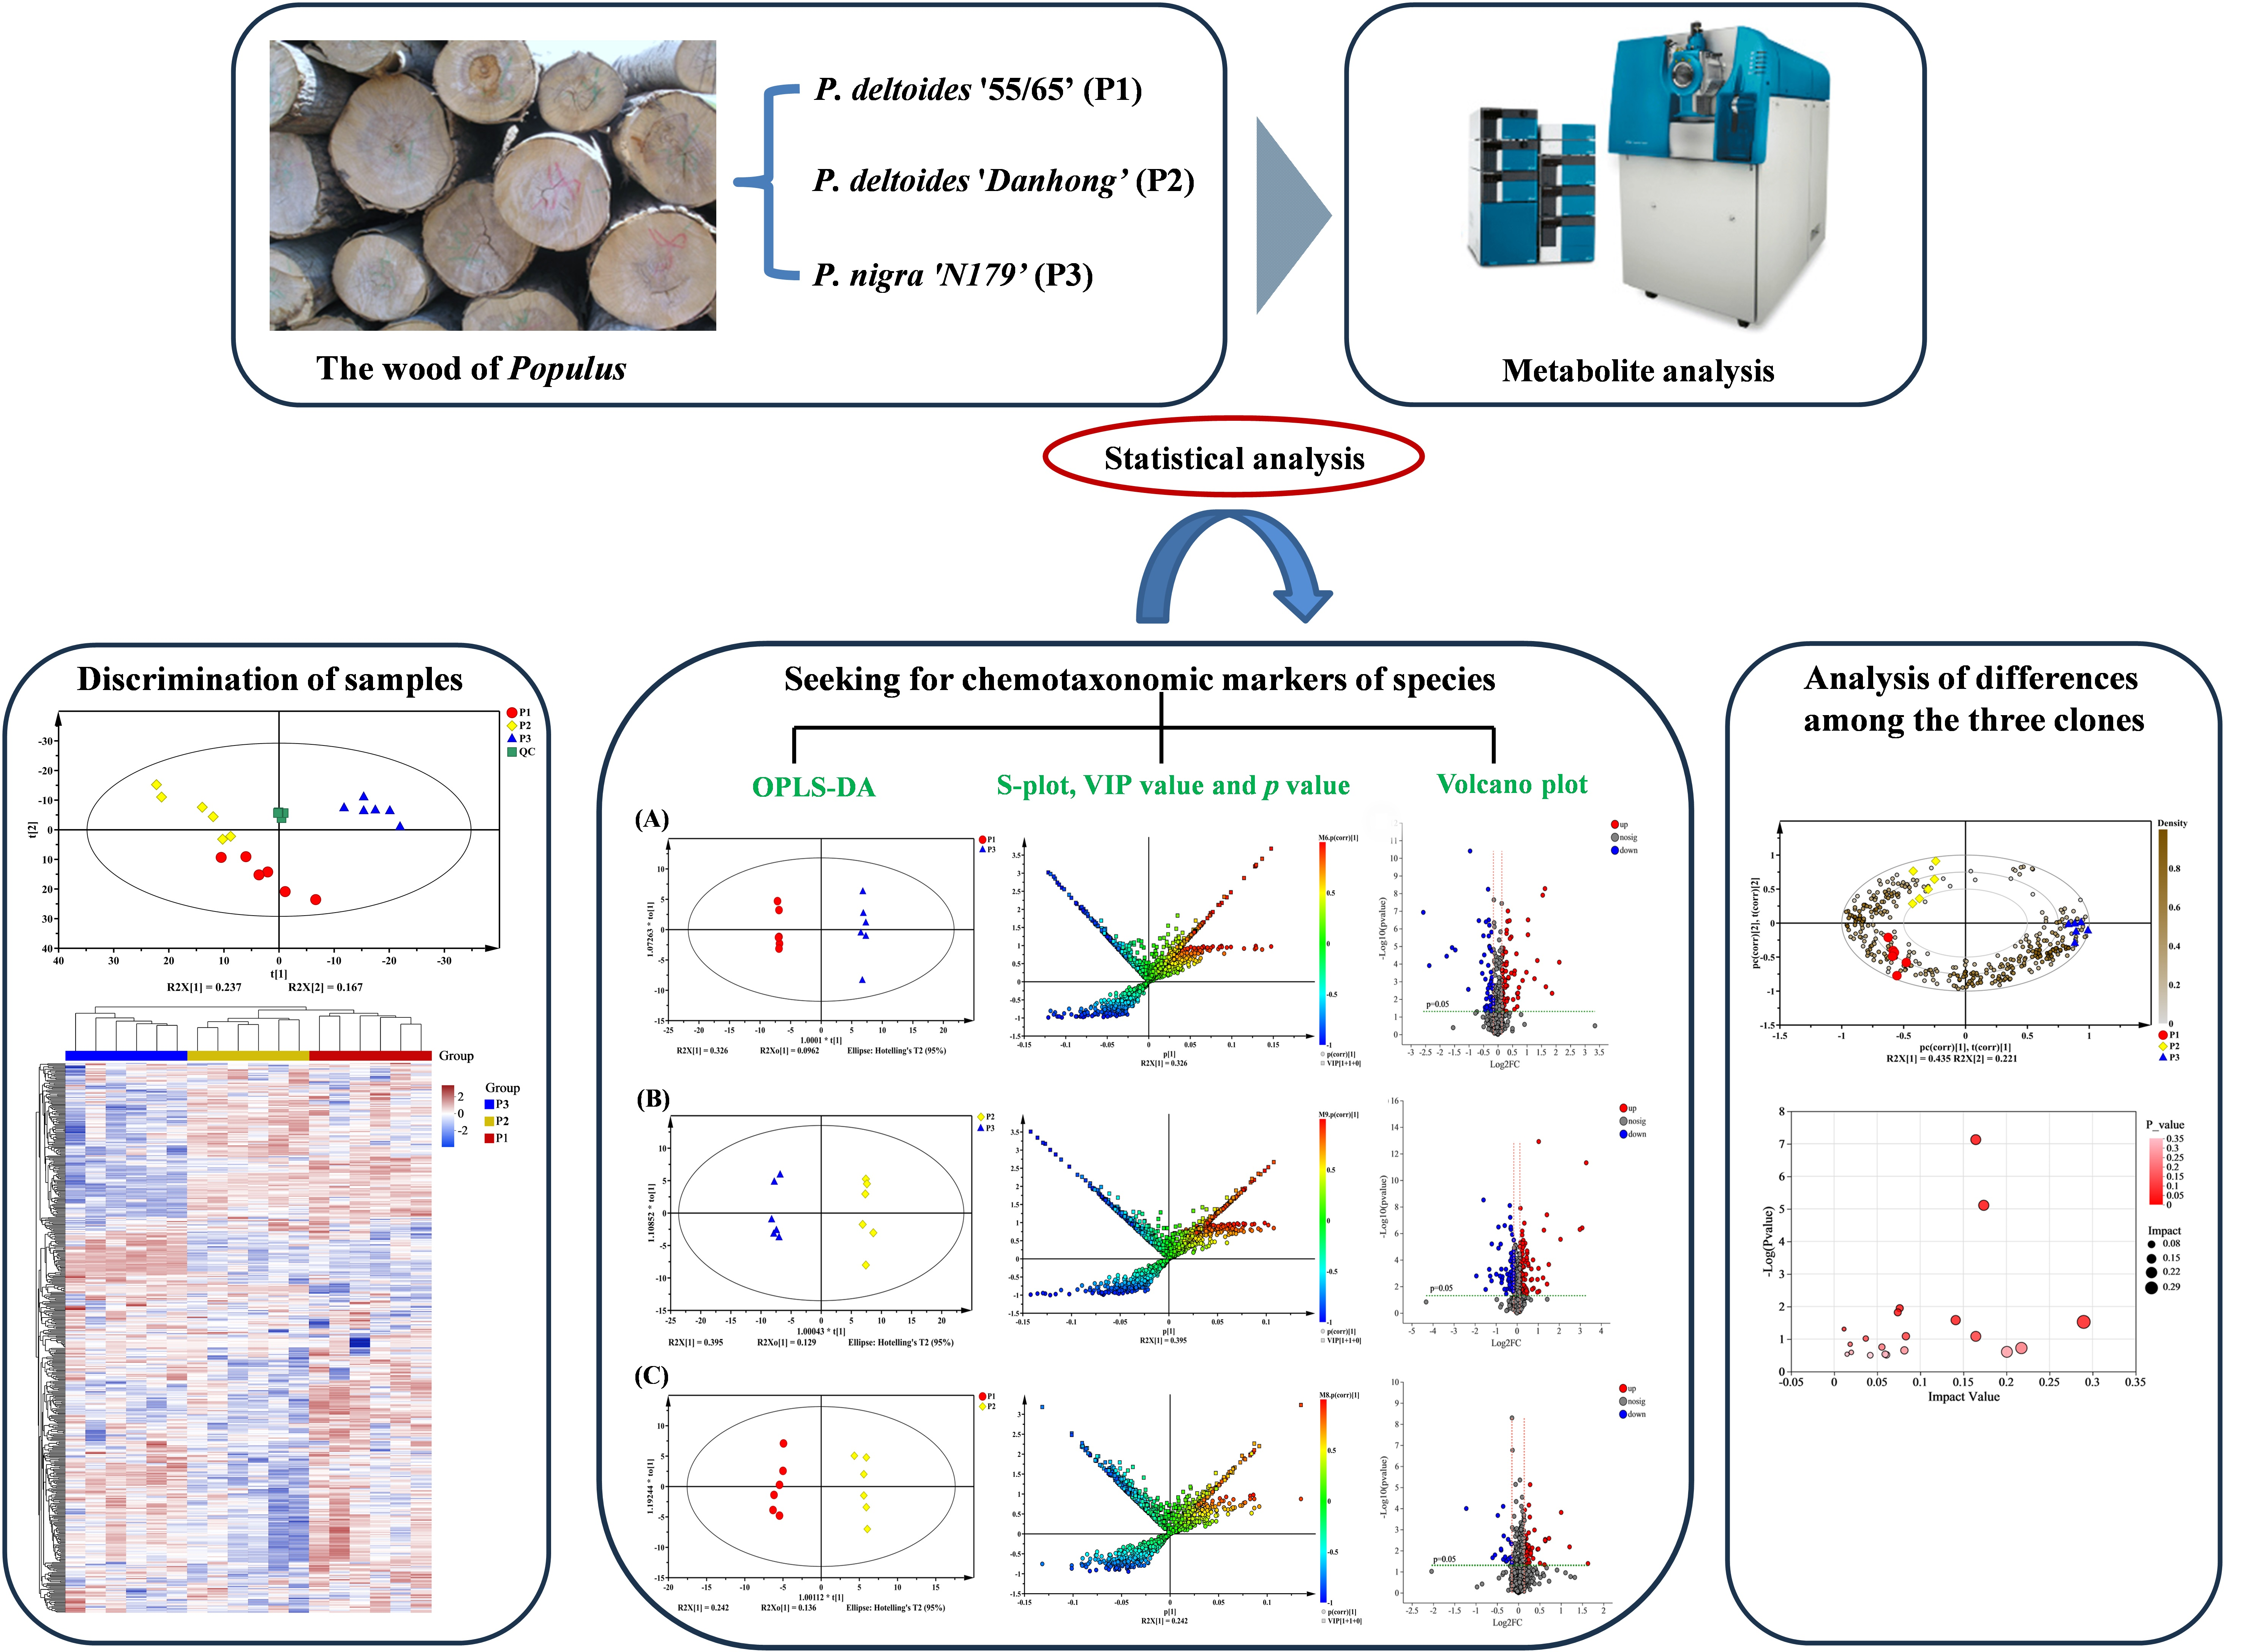
1. Introduction
2. Results
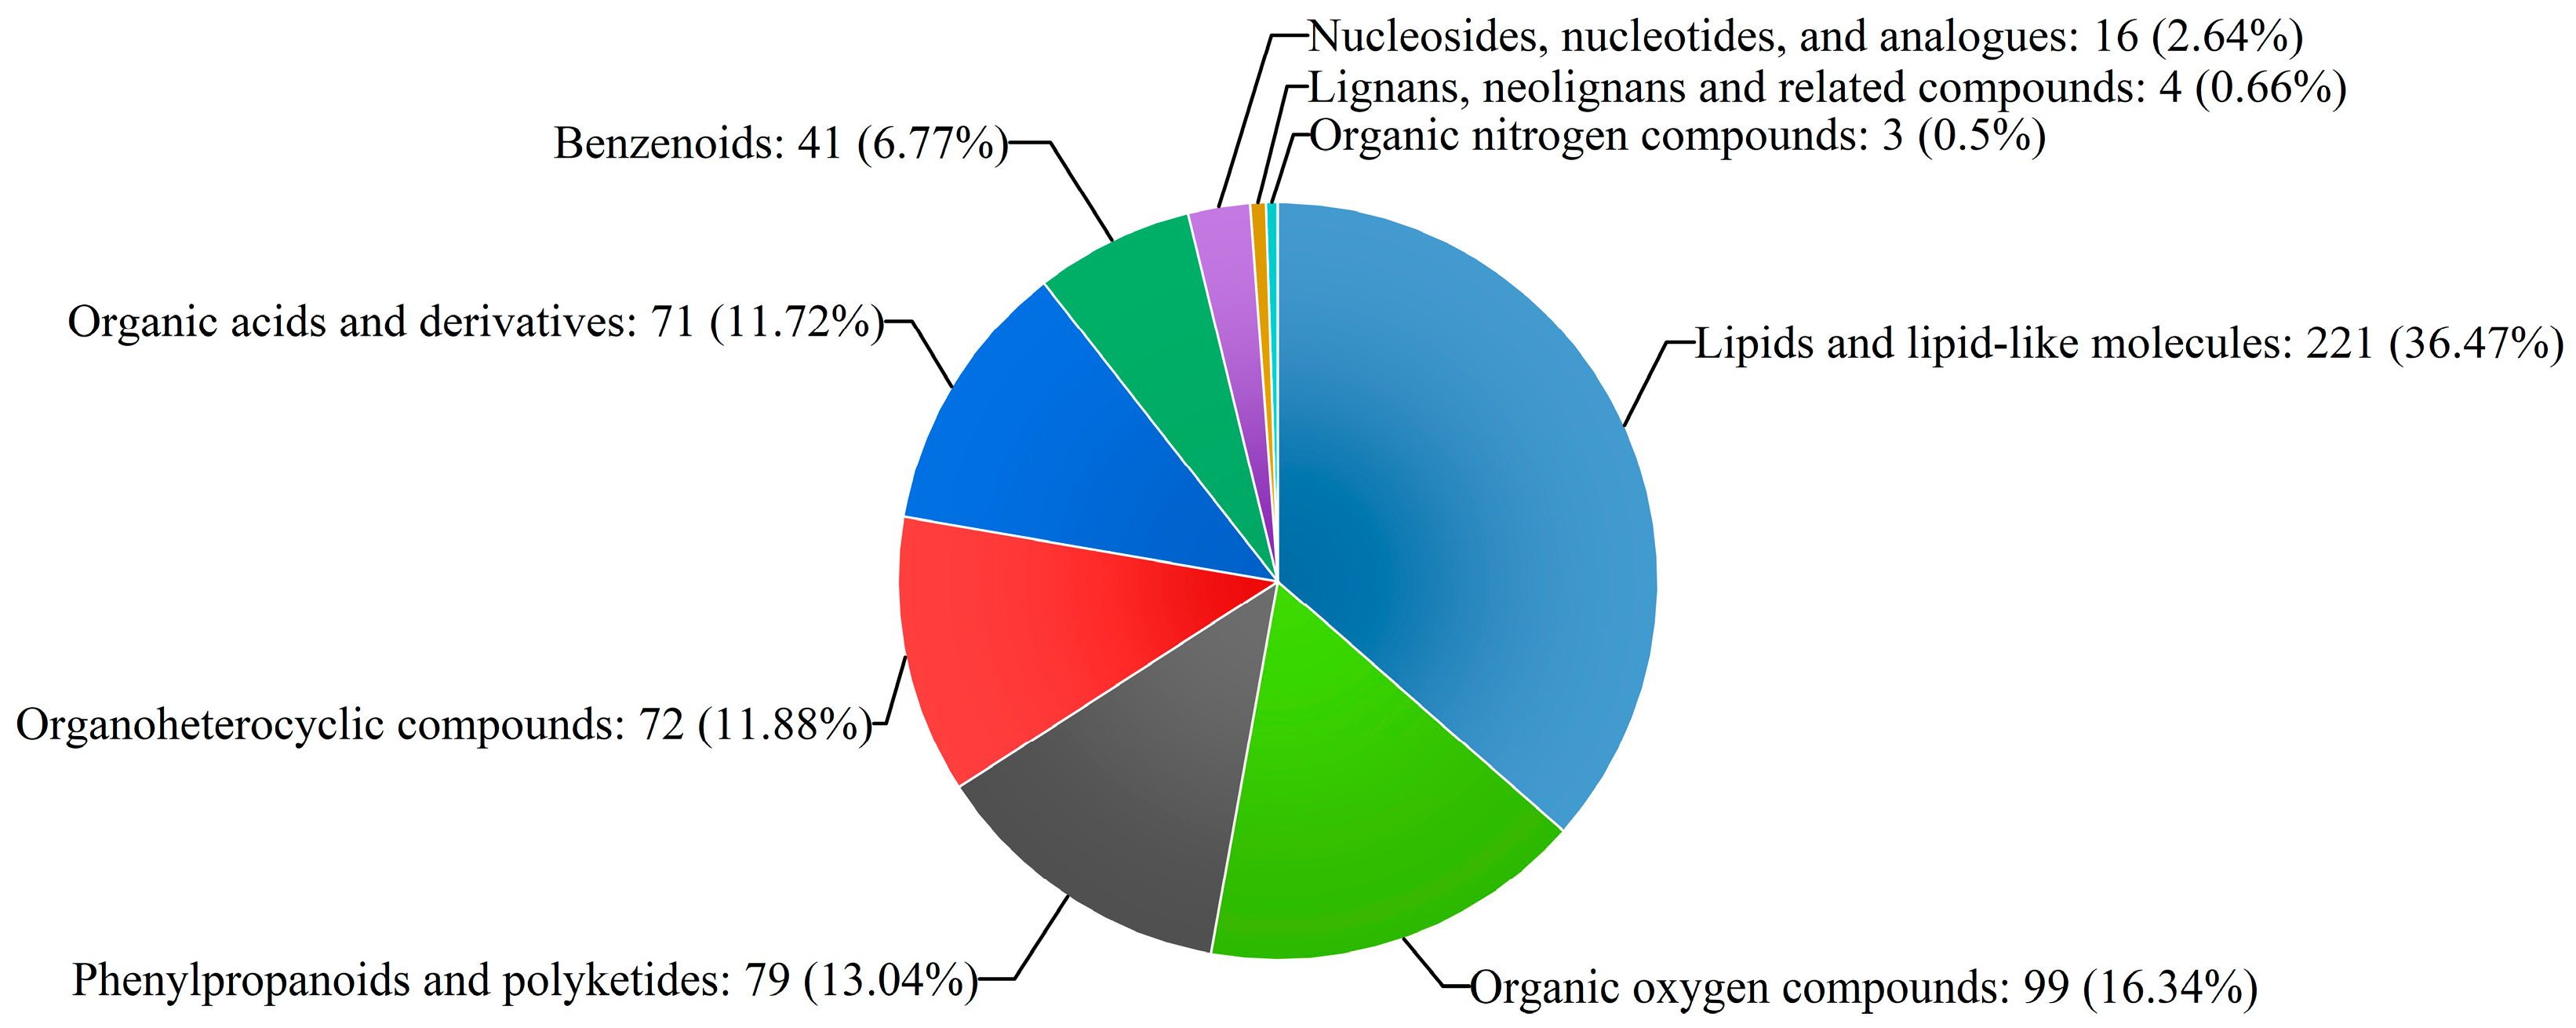
2.1. Metabolite Identification of Poplar Wood Based on UPLC-Triple-TOF-MS
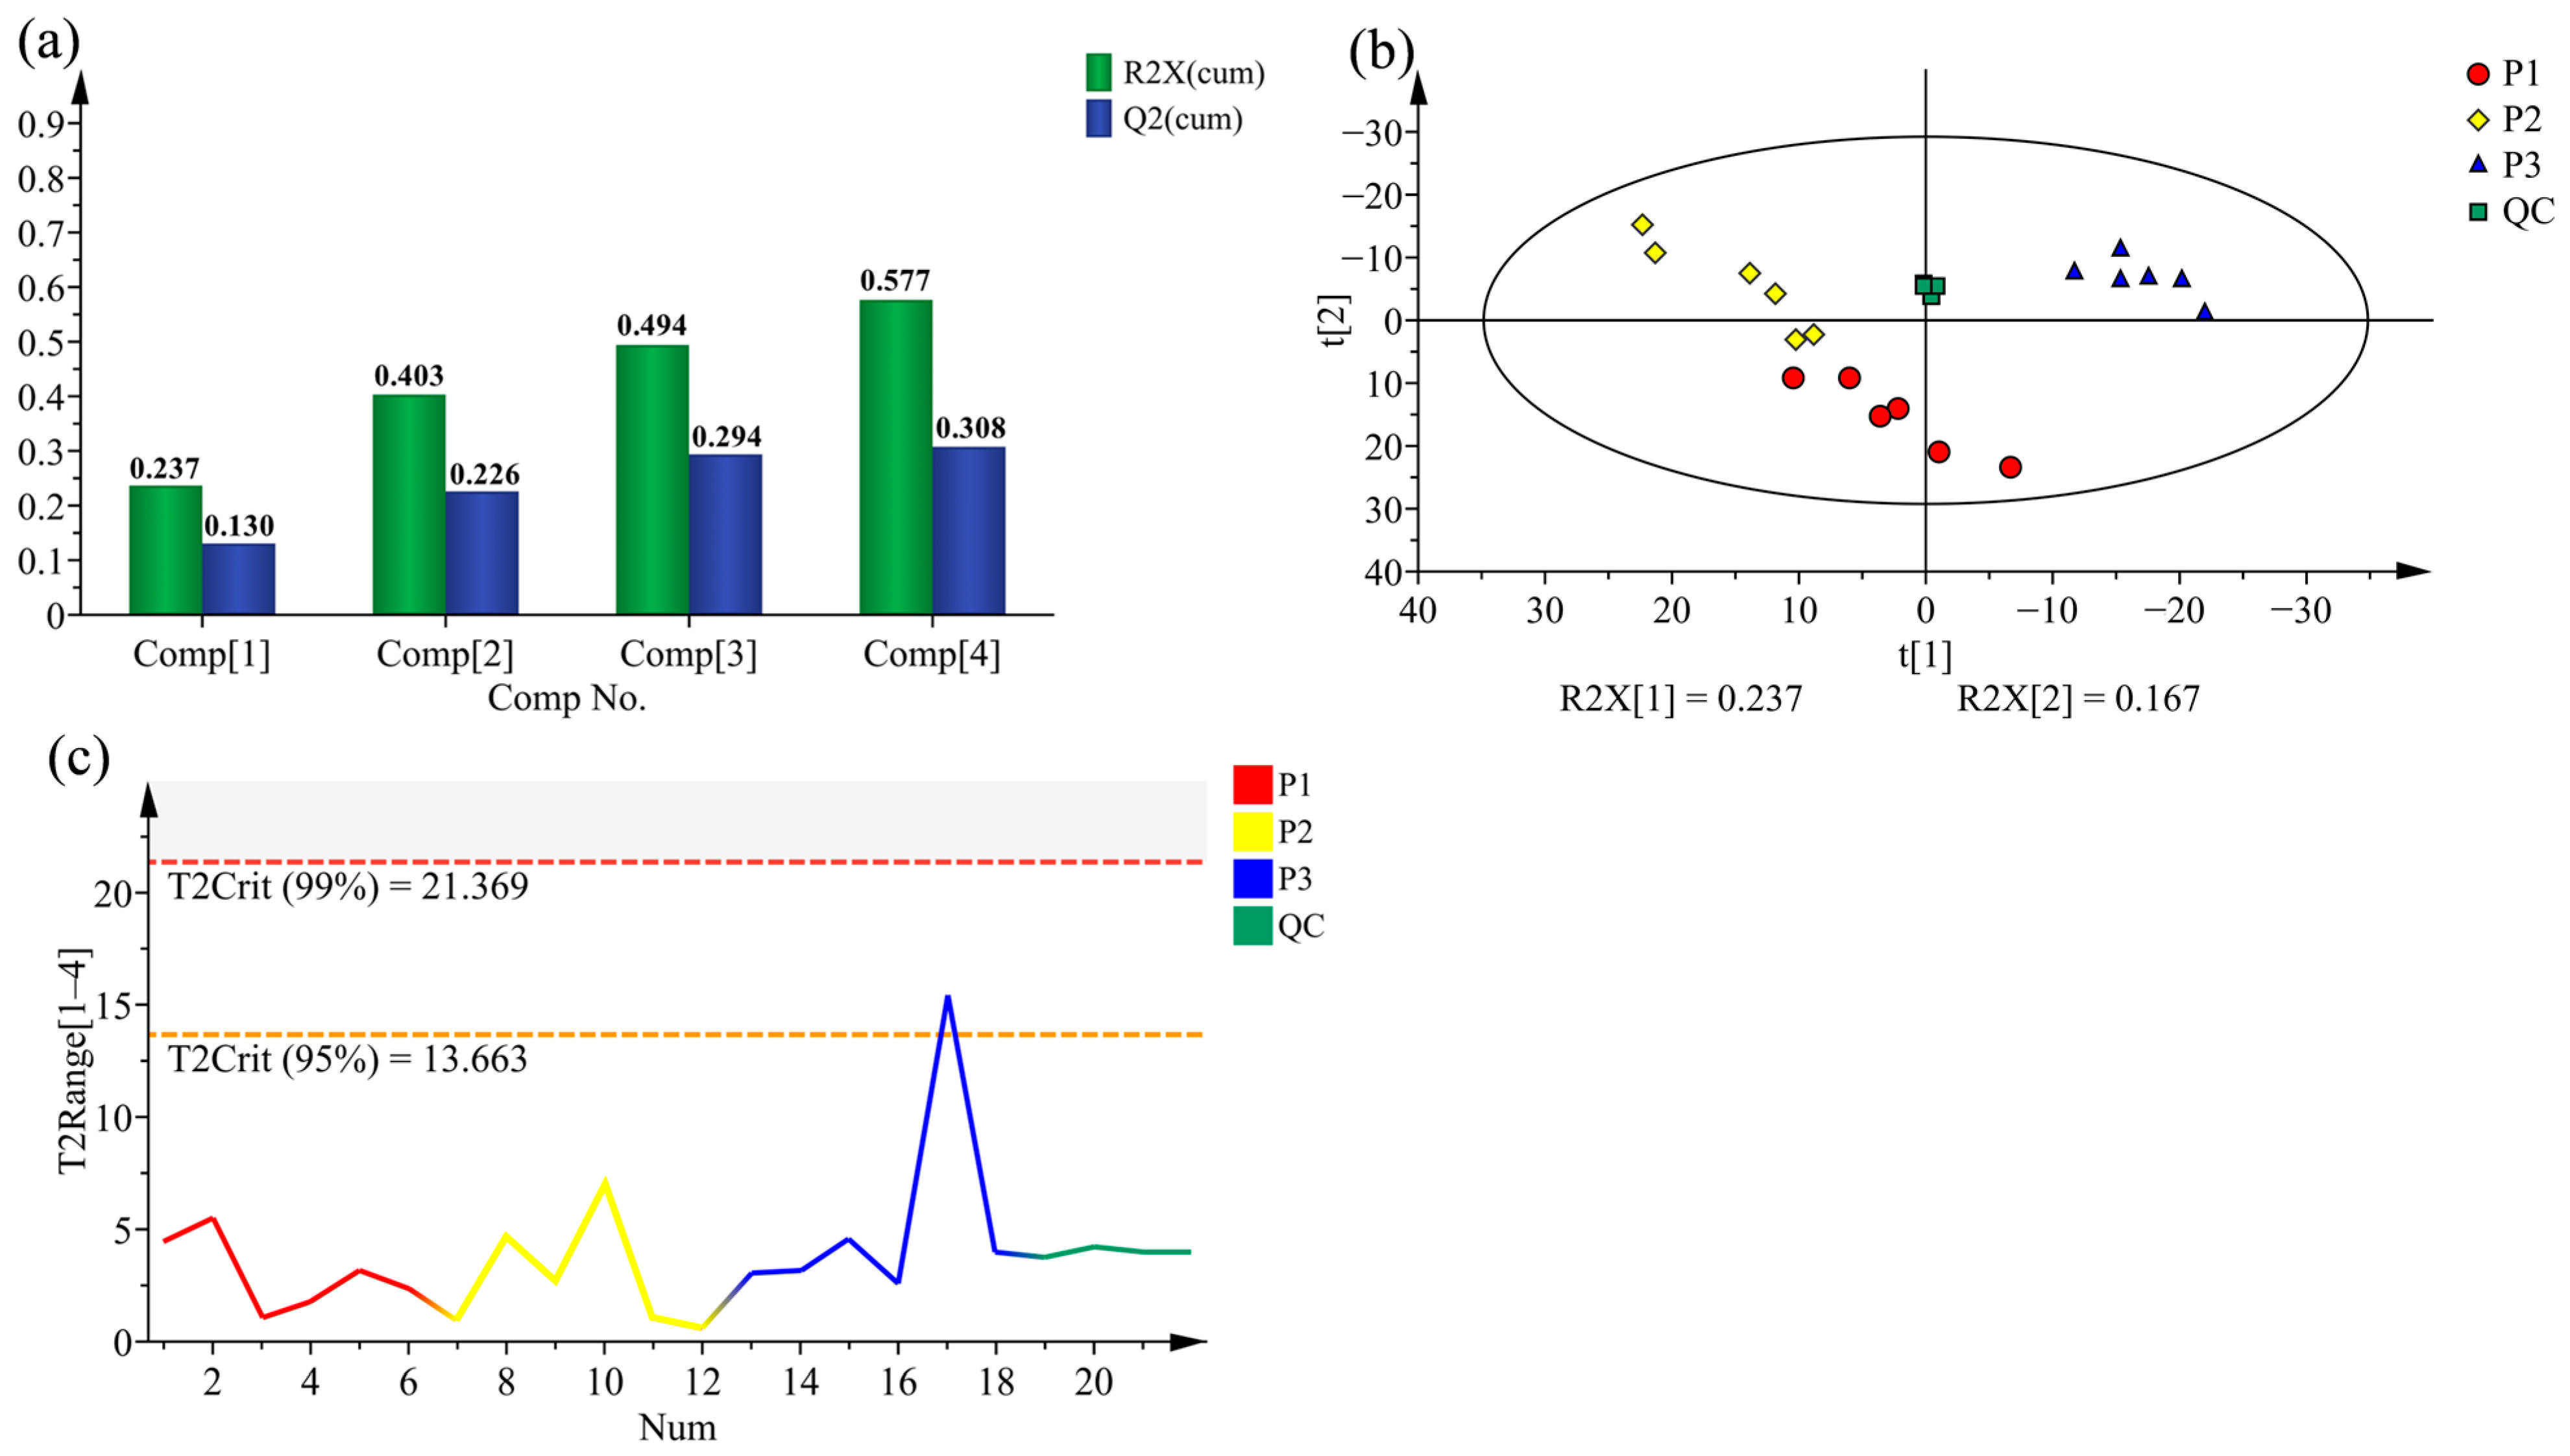
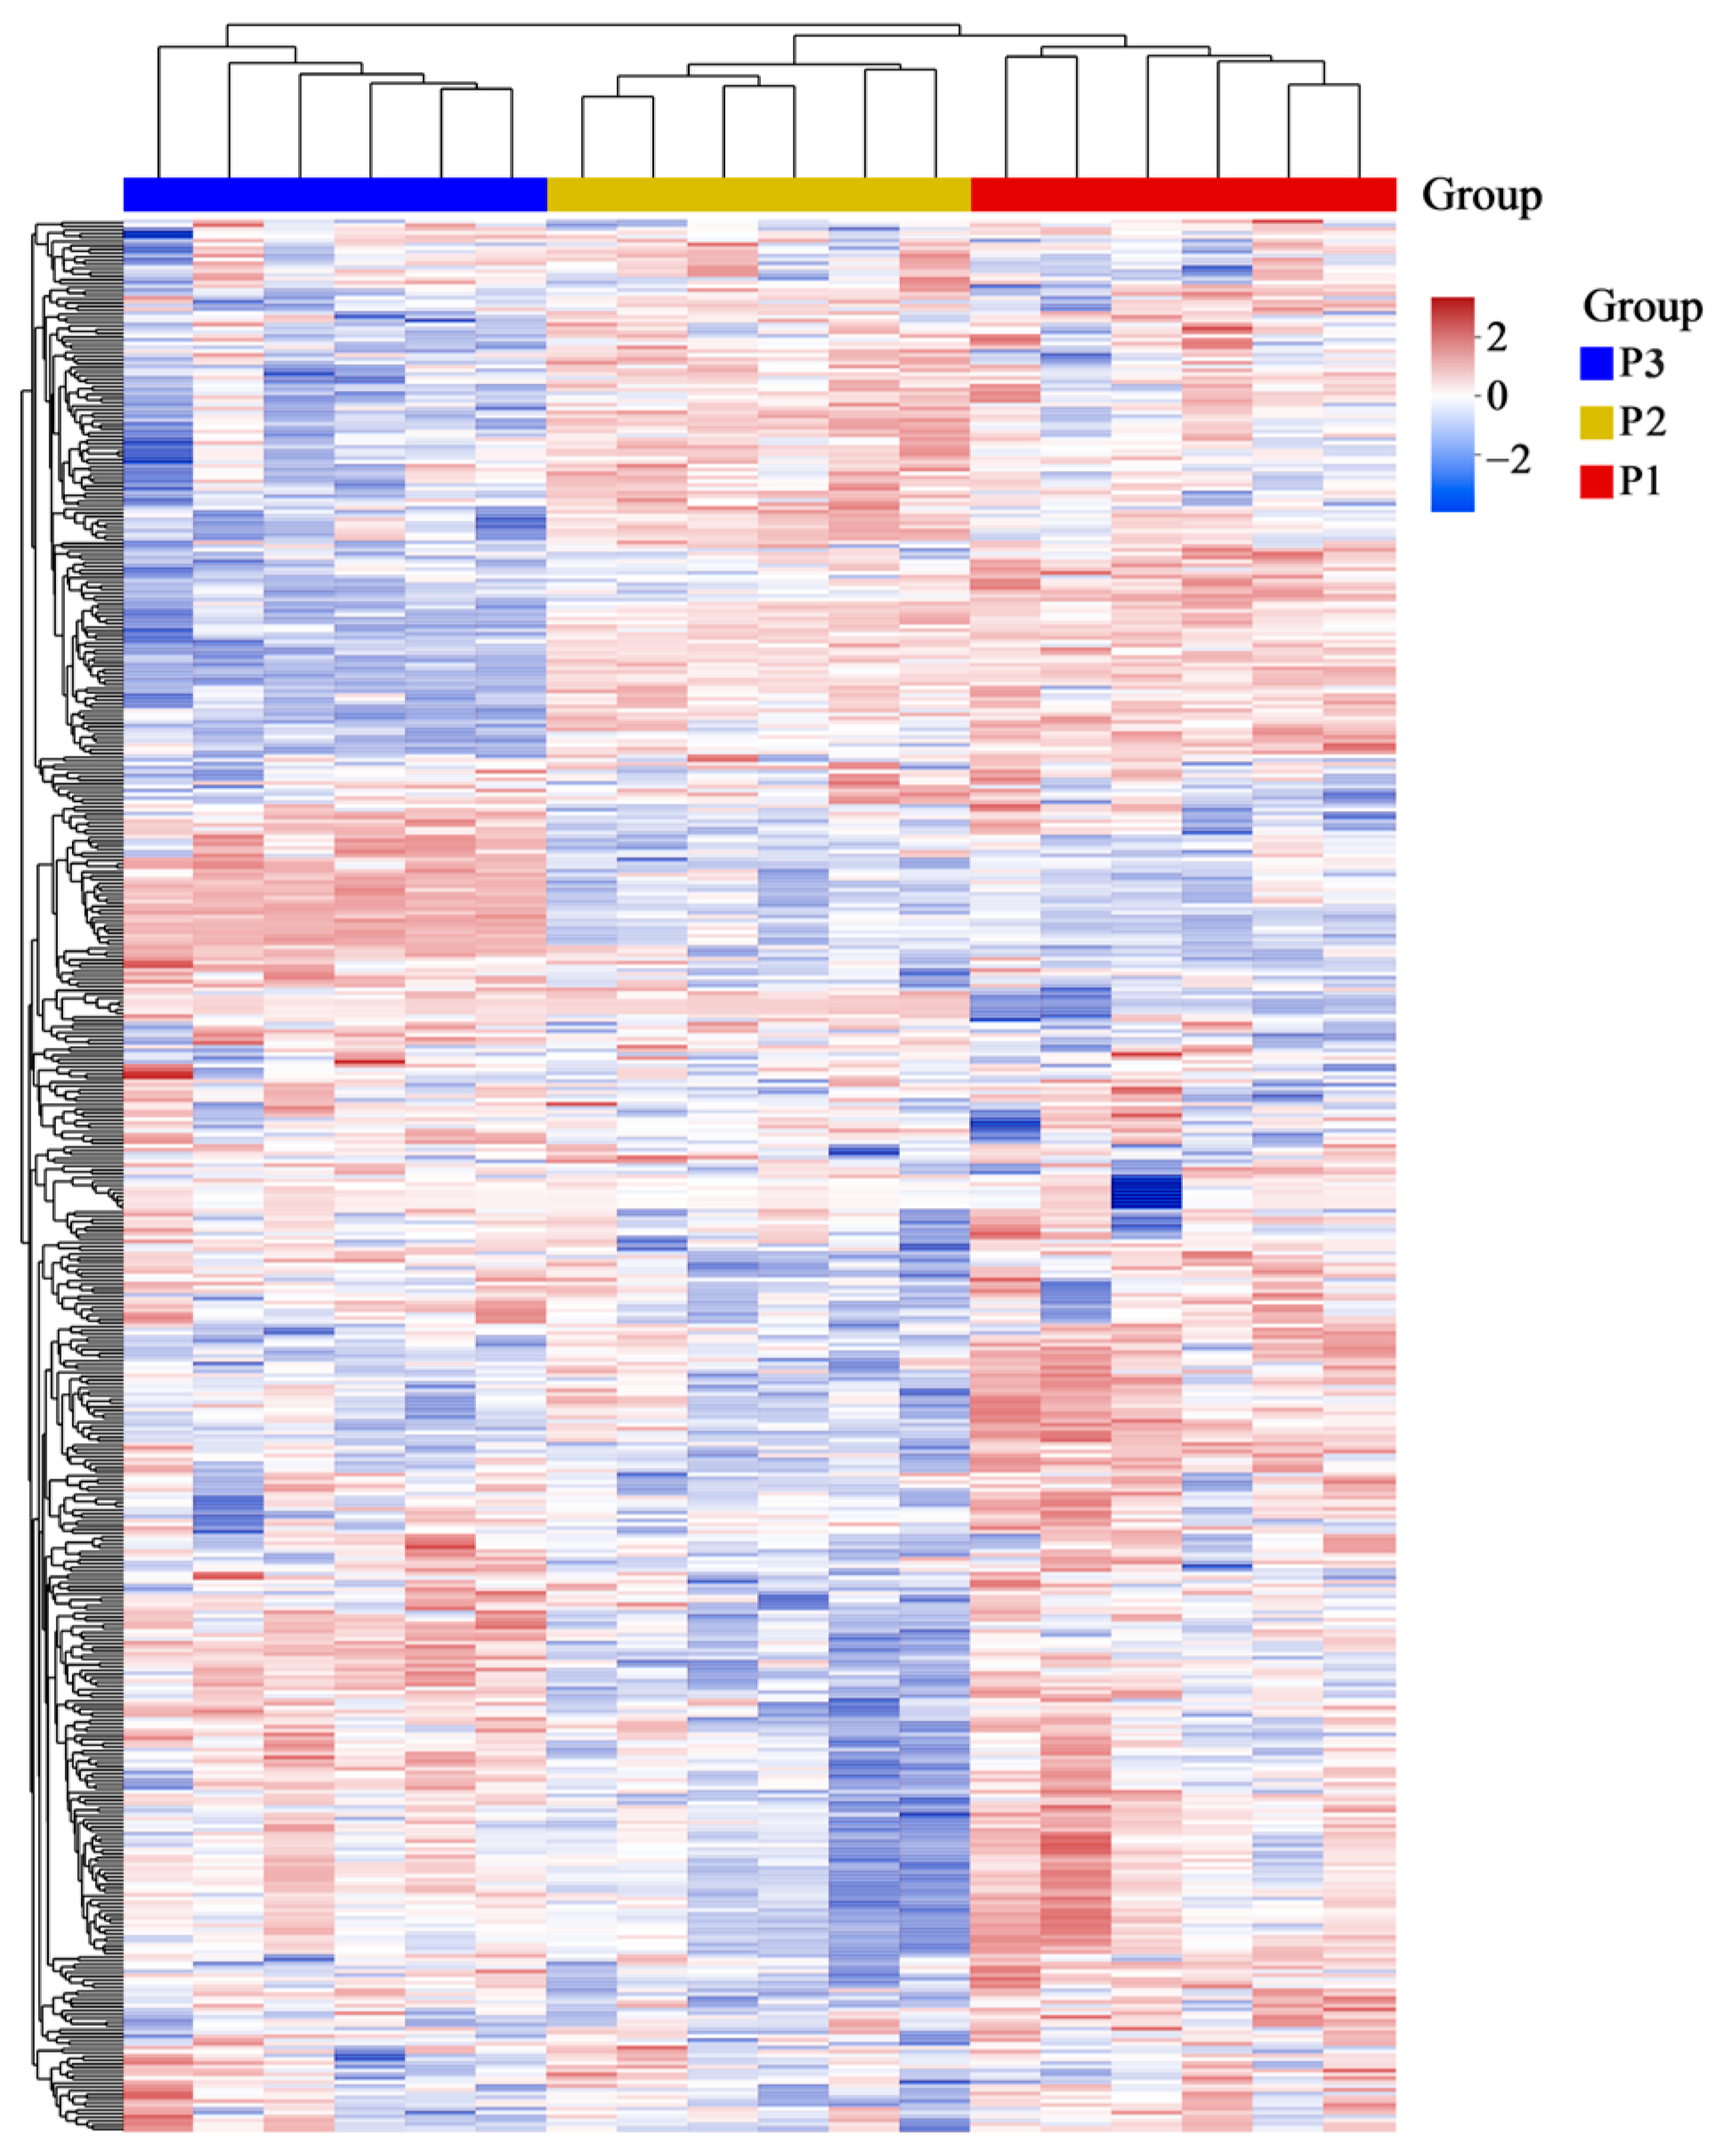
2.2. Principal Component Analysis (PCA) and Hierarchical Cluster Analysis (HCA) of Poplar Wood from Three Clones
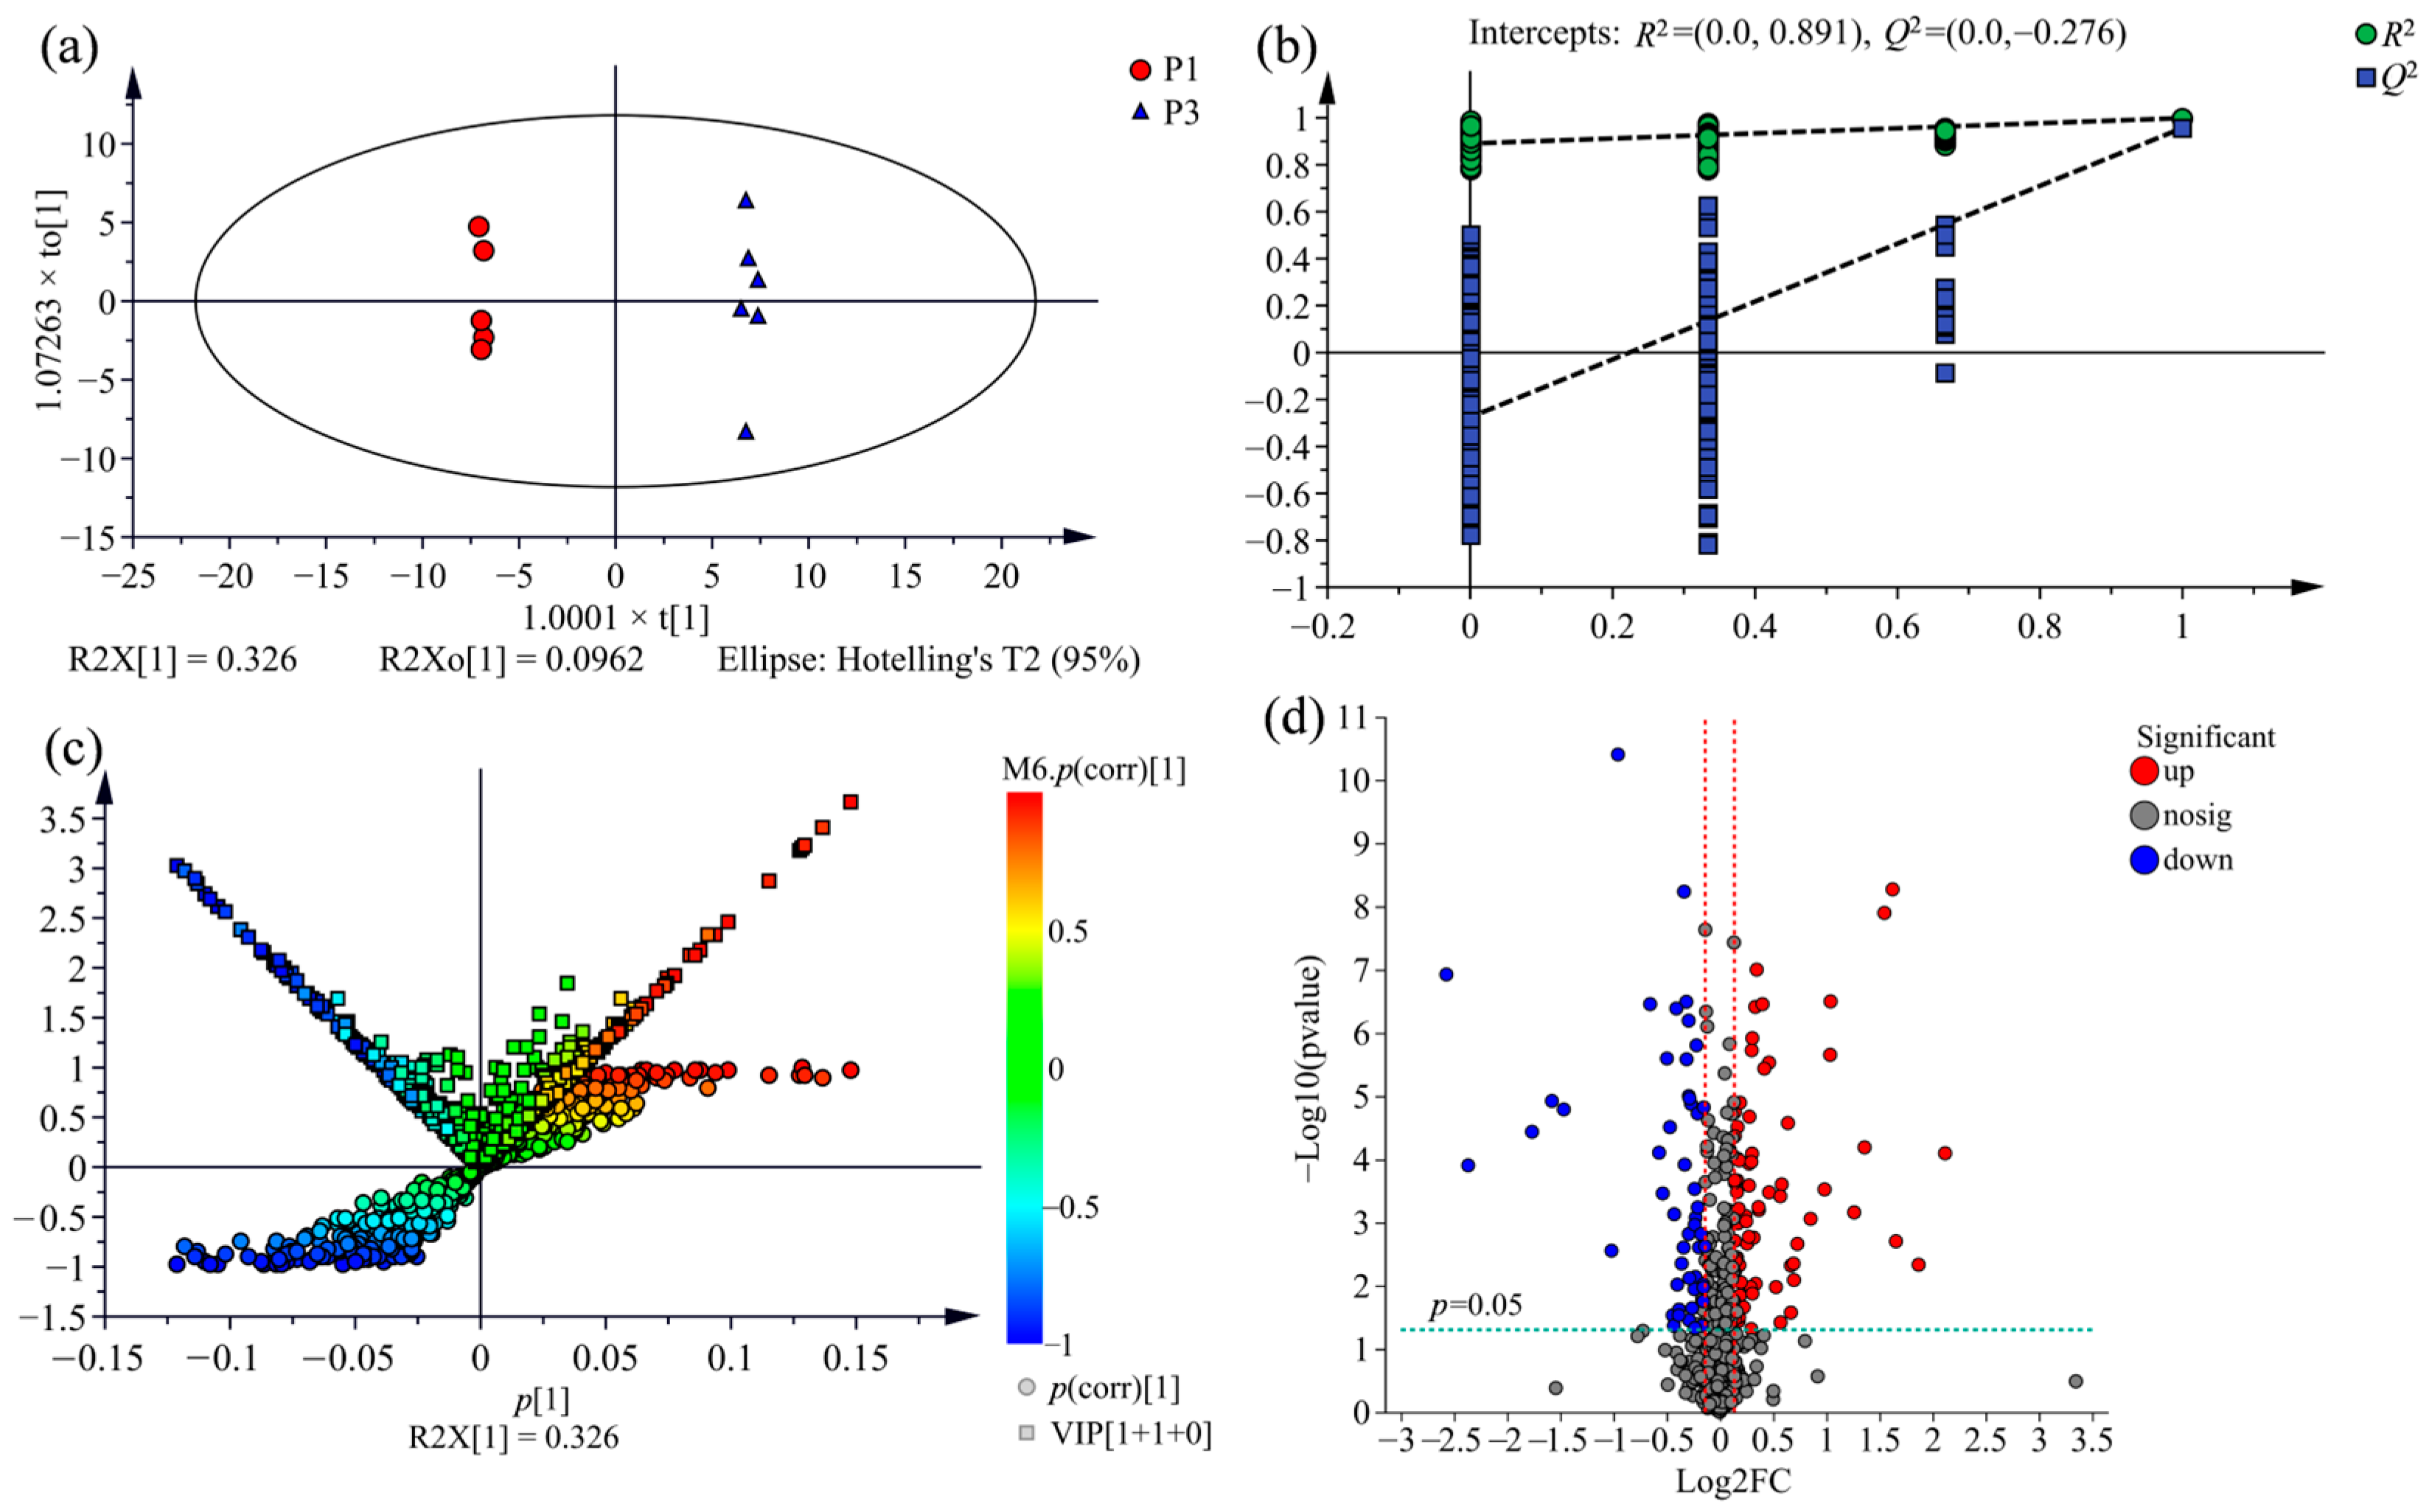
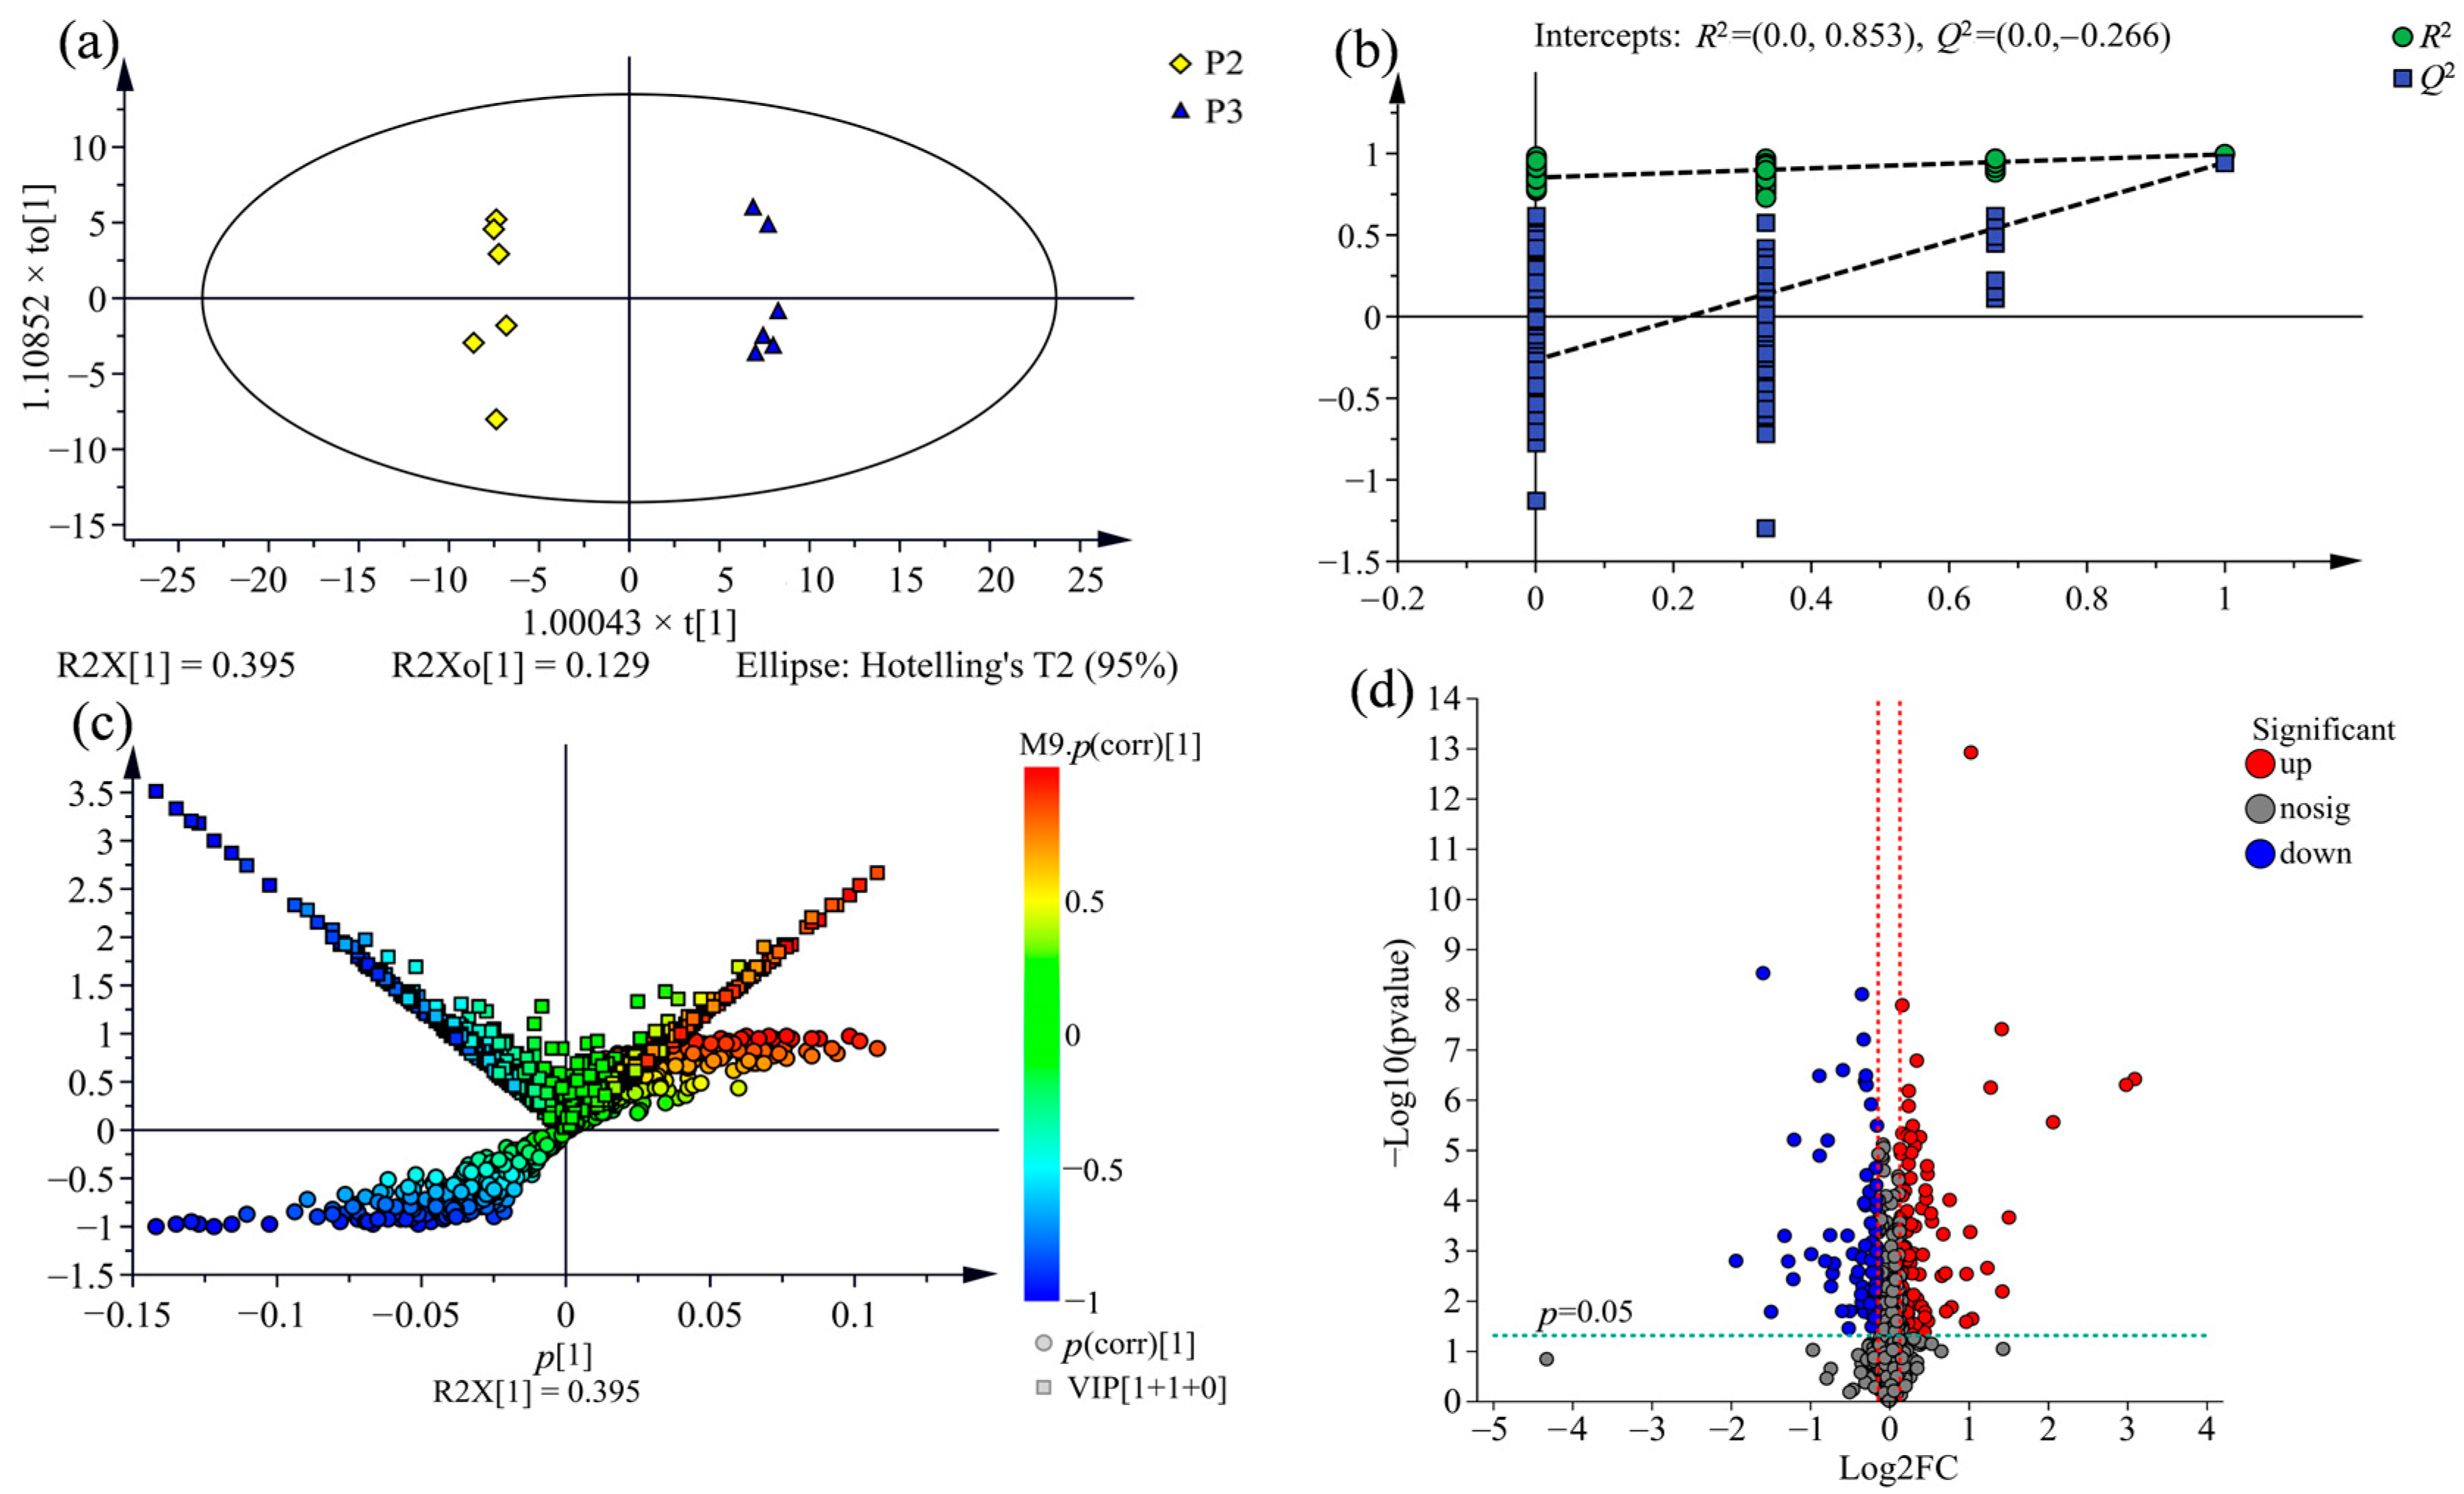
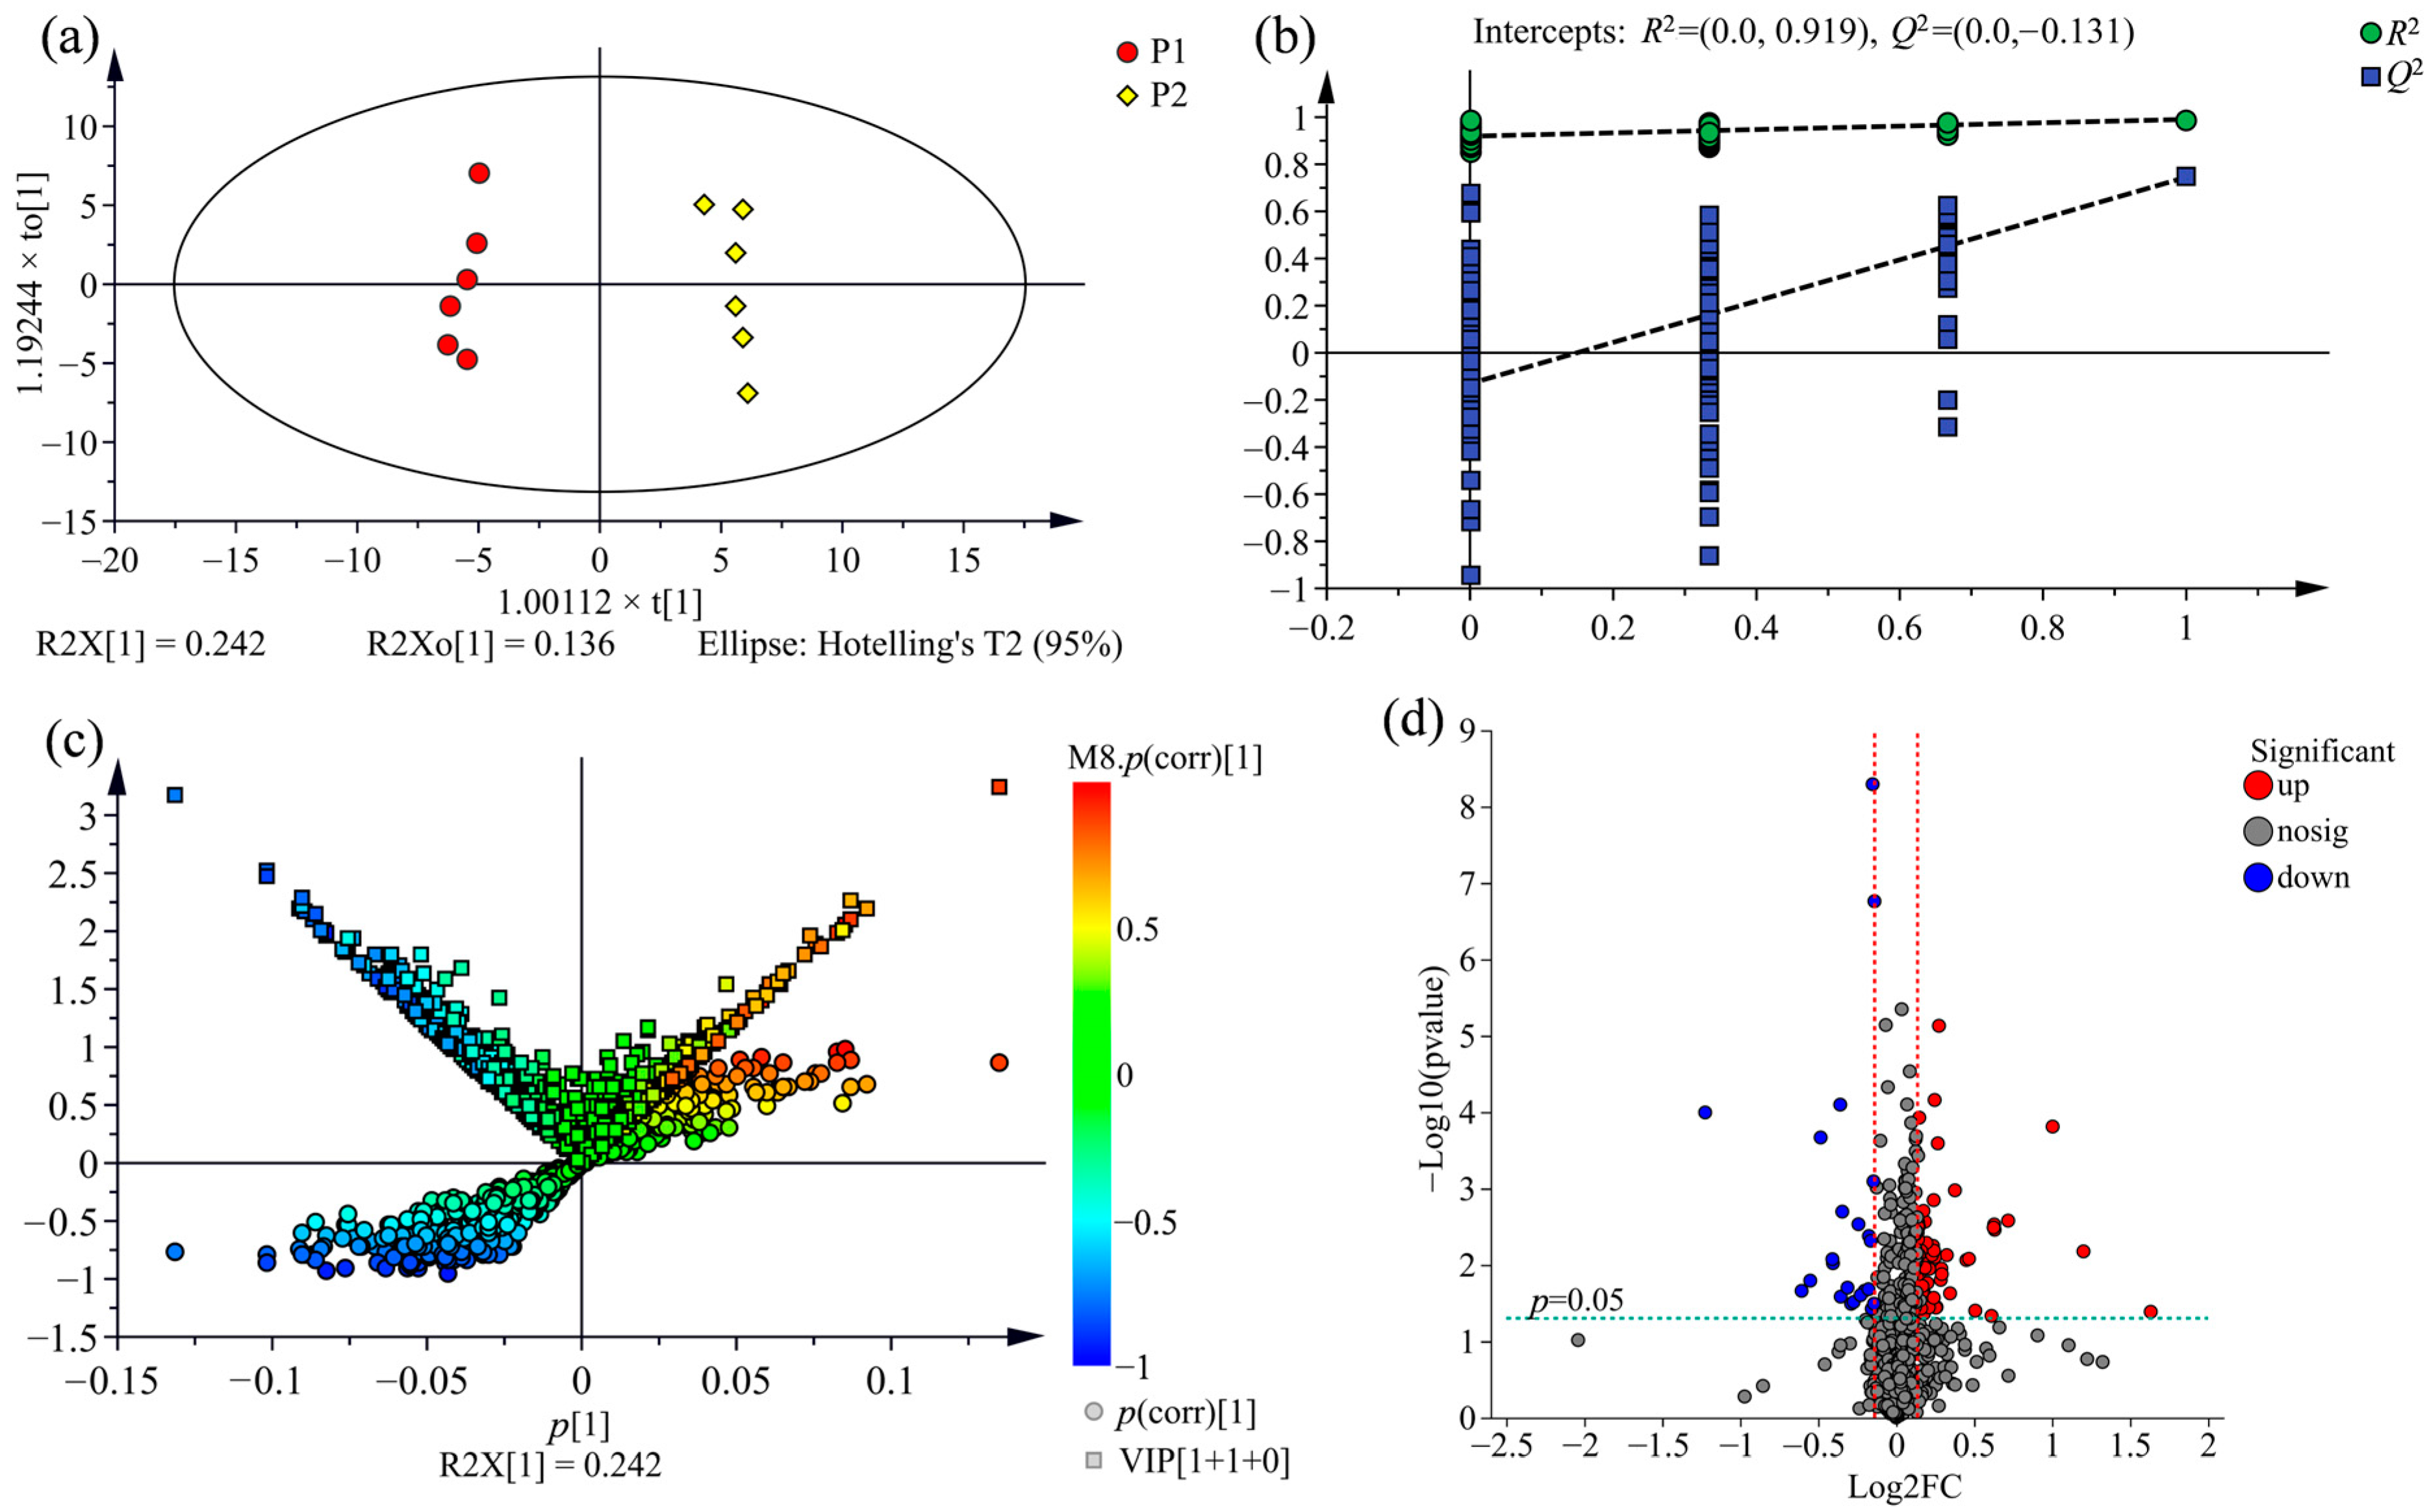
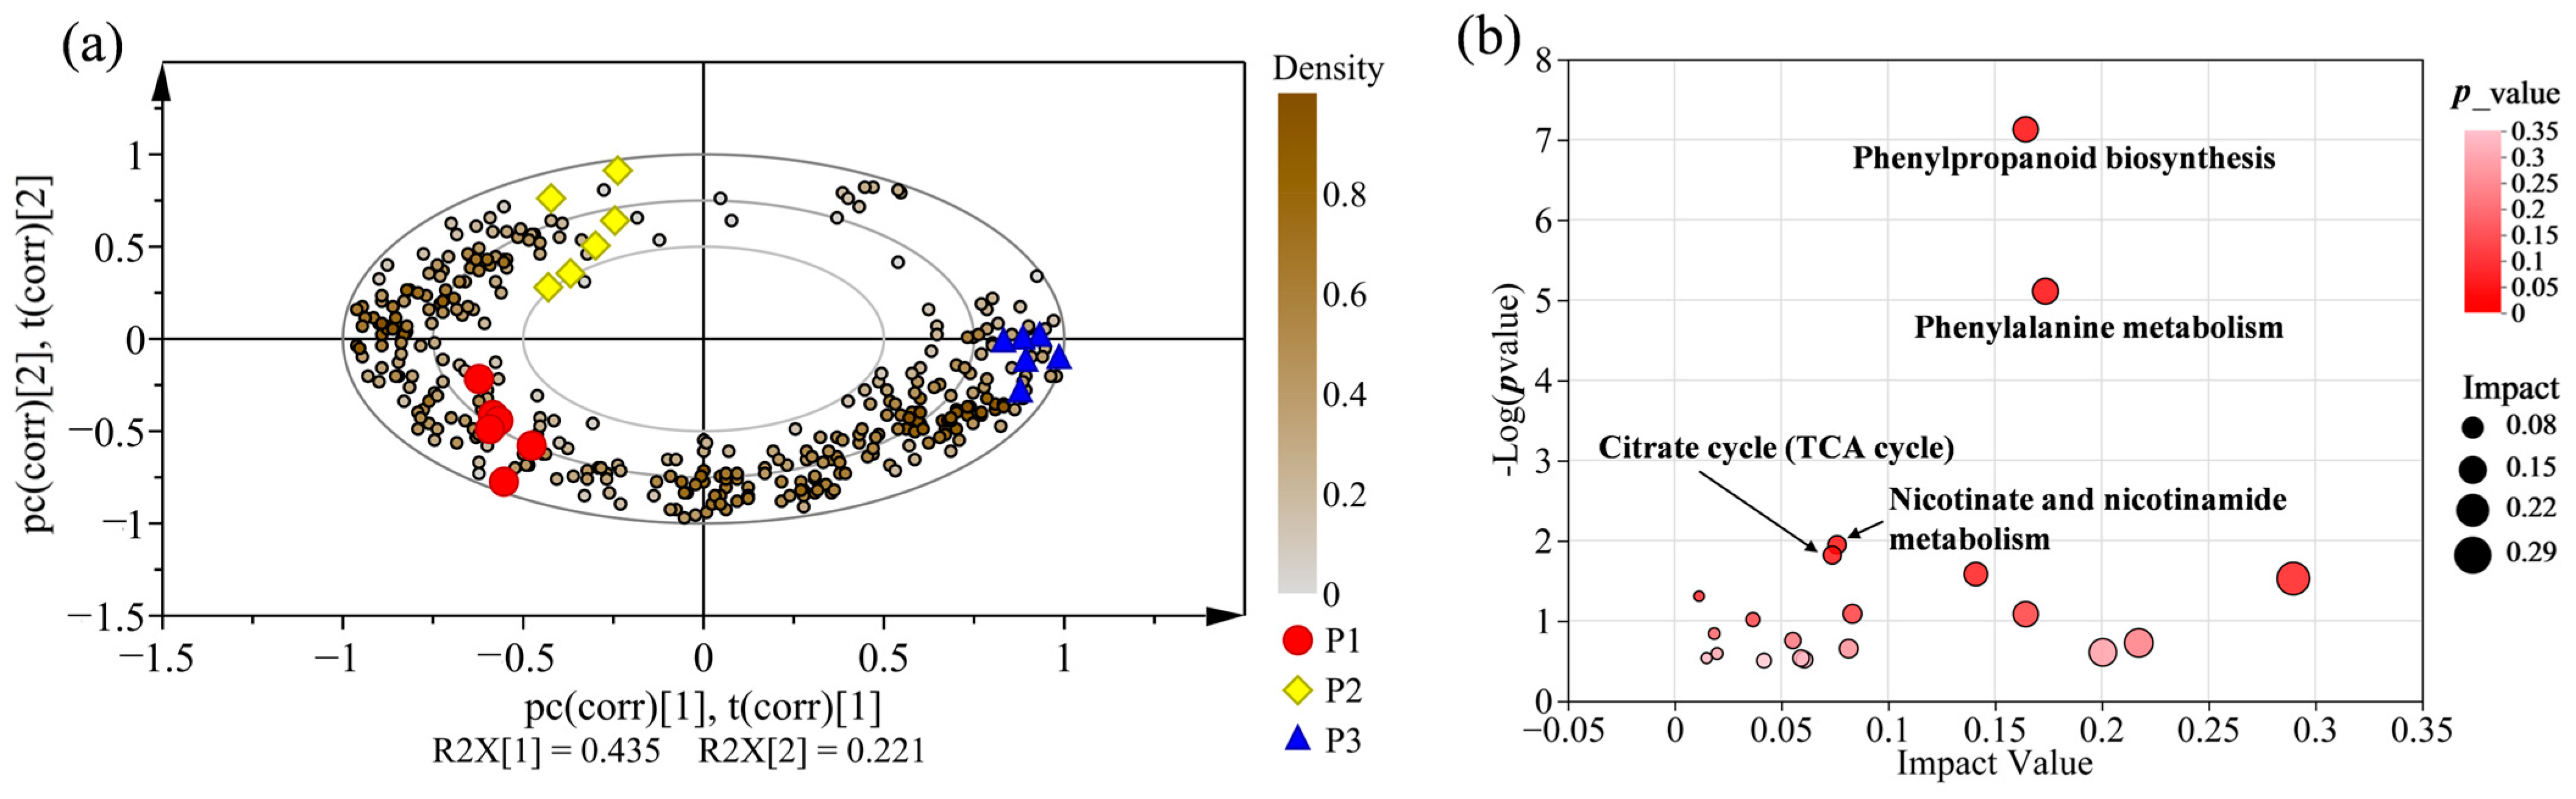
2.3. Supervised Orthogonal Partial Least Squares Discriminate Analysis (OPLS-DA) for All Samples
2.4. Comparison of Metabolic Variations between Three Clones
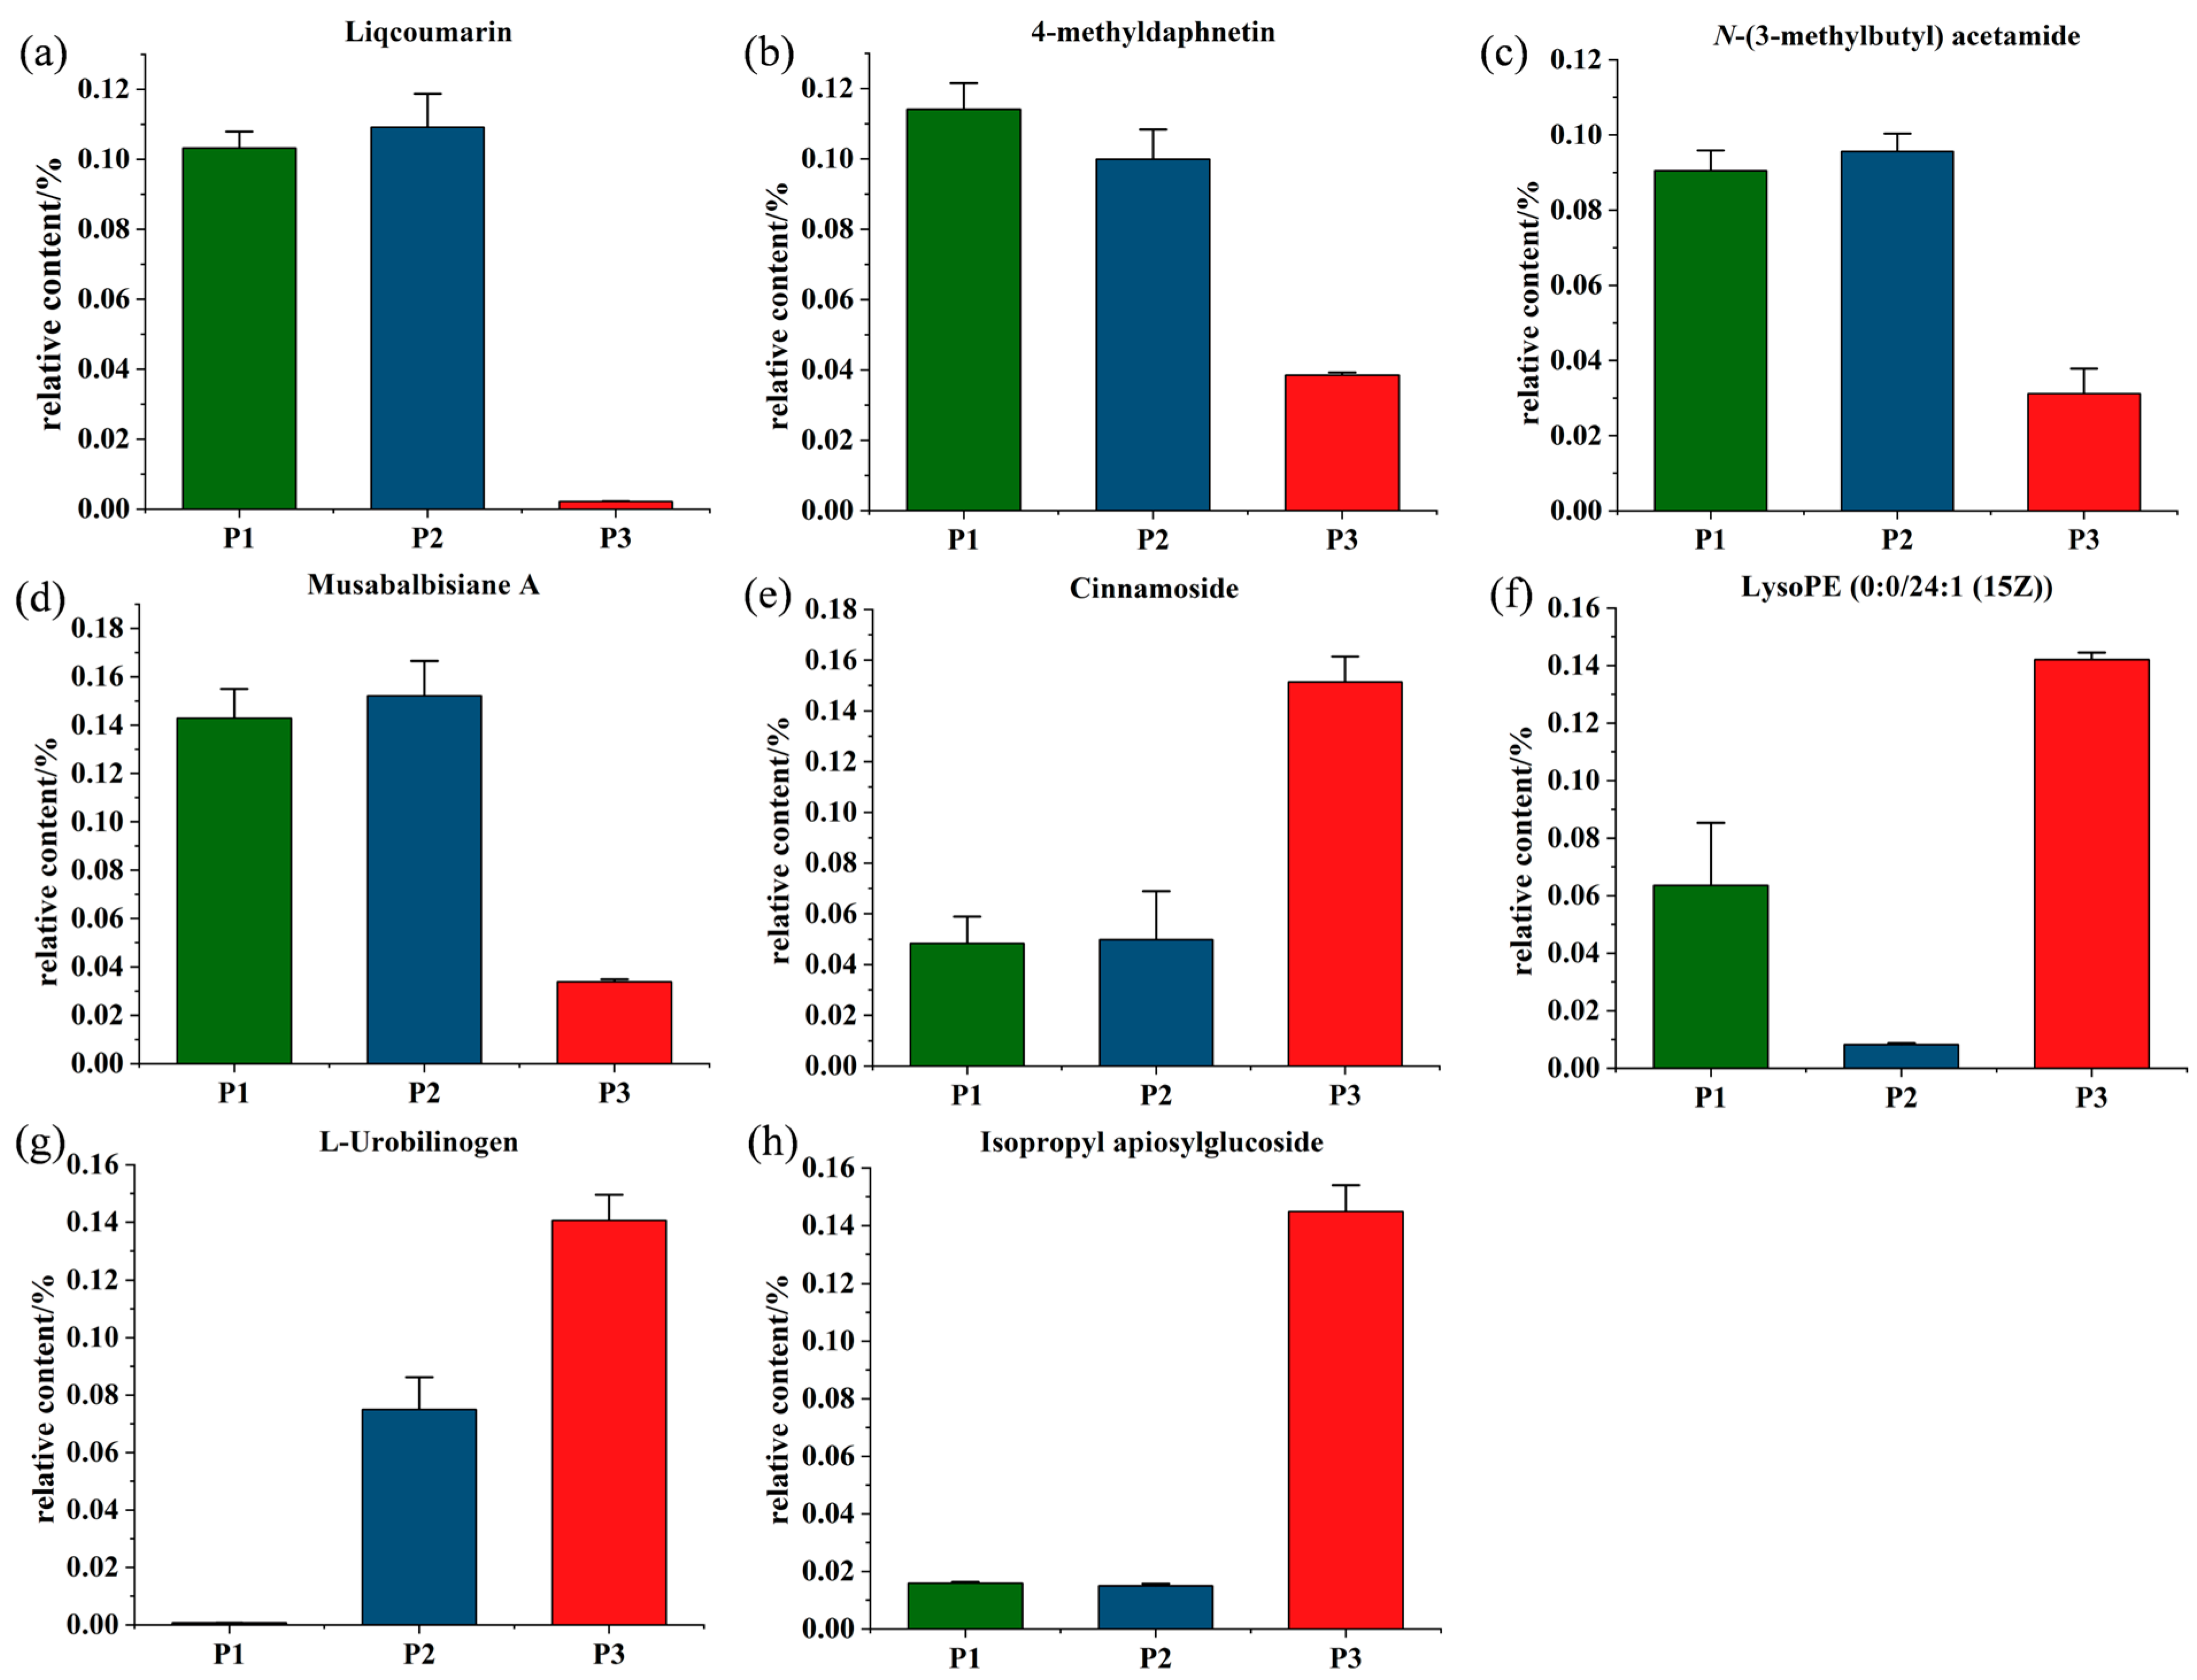
2.5. Screening of Potential Markers between P. nigra and P. deltoides
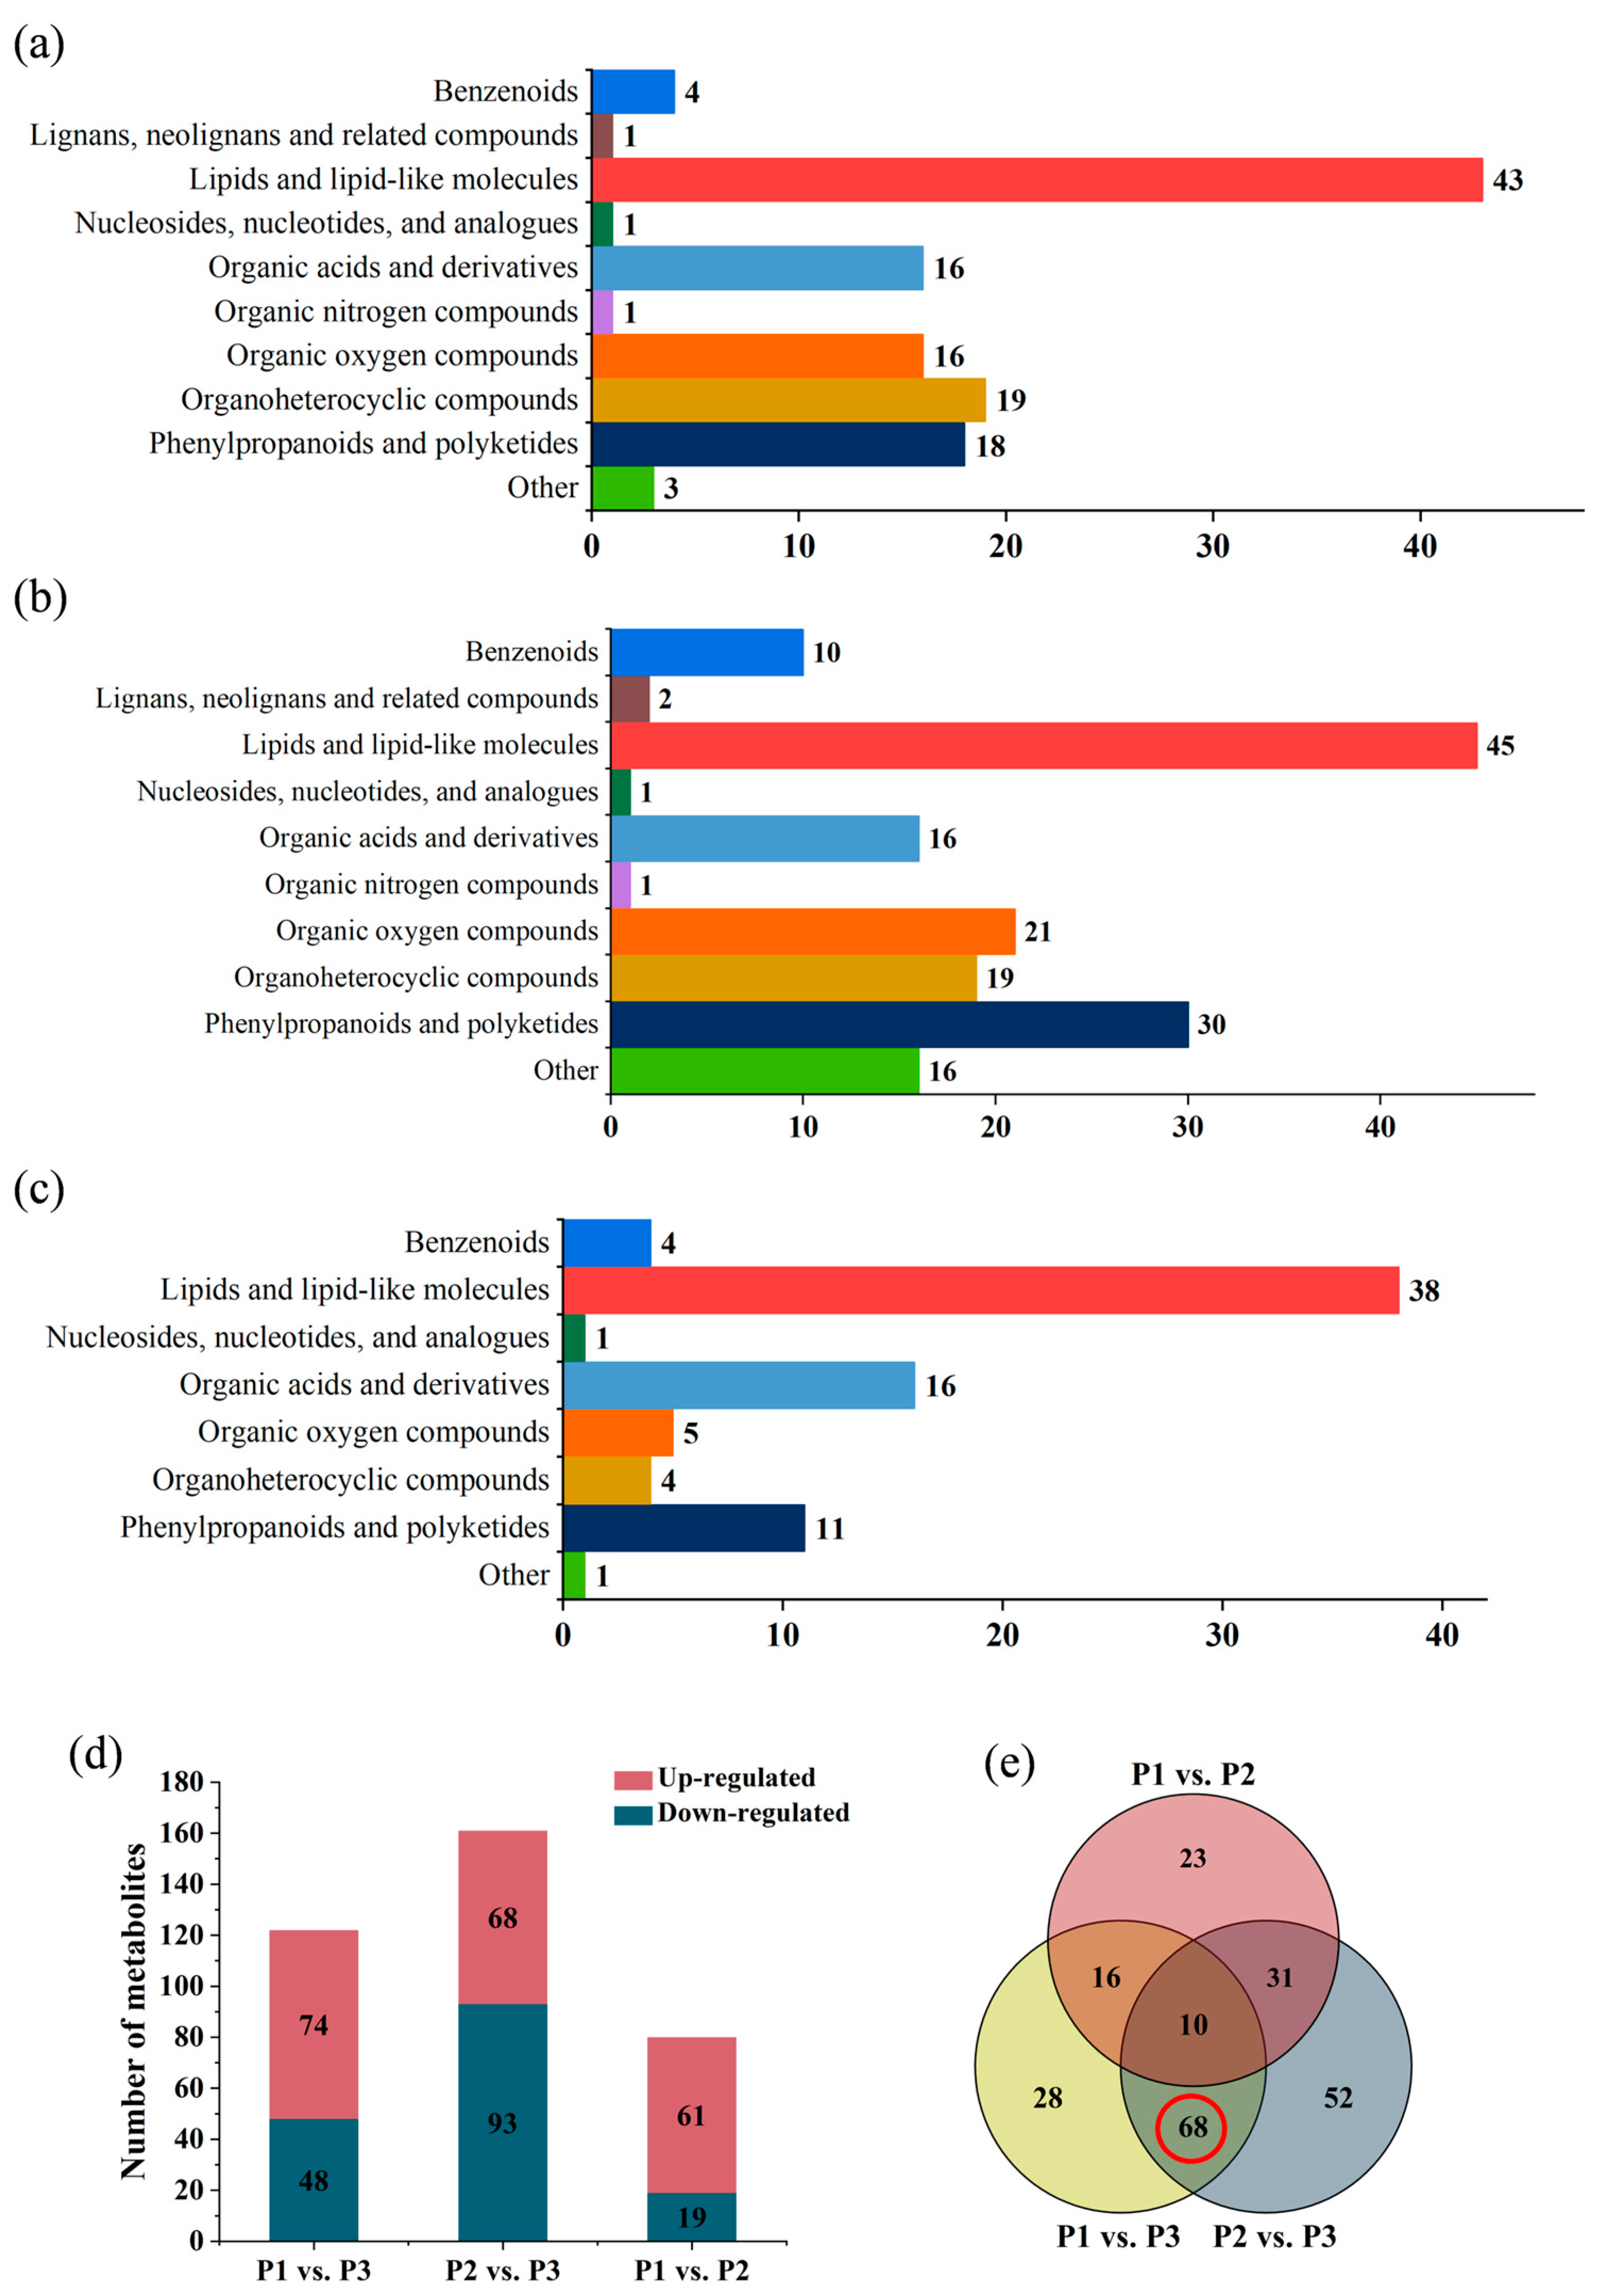
2.6. Screening for the Differential Metabolites in the Three Clones of Poplar
2.7. Metabolic Pathway Enrichment Analysis for Differential Metabolites
3. Discussion
4. Materials and Methods
4.1. Wood Material Collection
4.2. Metabolite Extraction
4.3. Quality Control Sample
4.4. Profiling of Metabolites by UPLC-Triple-TOF-MS
4.5. Metabolite Identification
4.6. Statistical Analysis
5. Conclusions
Supplementary Materials
Author Contributions
Funding
Institutional Review Board Statement
Informed Consent Statement
Data Availability Statement
Acknowledgments
Conflicts of Interest
Sample Availability
References
- Celedon, J.M.; Bohlmann, J. An Extended Model of Heartwood Secondary Metabolism Informed by Functional Genomics. Tree Physiol. 2018, 38, 311–319. [Google Scholar] [CrossRef] [PubMed]
- Wang, D.; Chen, Y.; Li, W.; Li, Q.; Lu, M.; Zhou, G.; Chai, G. Vascular Cambium: The Source of Wood Formation. Front. Plant Sci. 2021, 12, 700928. [Google Scholar] [CrossRef]
- Pichersky, E.; Lewinsohn, E. Convergent Evolution in Plant Specialized Metabolism. Annu. Rev. Plant Biol. 2011, 62, 549–566. [Google Scholar] [CrossRef] [PubMed]
- Zhang, S.; Jiang, H.; Zhao, H.; Korpelainen, H.; Li, C. Sexually Different Physiological Responses of Populus Cathayana to Nitrogen and Phosphorus Deficiencies. Tree Physiol. 2014, 34, 343–354. [Google Scholar] [CrossRef]
- Wu, Q.; Chen, M.; Zhou, H.; Zhou, X.; Wang, Y. Metabolite Profiles of Populus in Response to Pathogen Stress. Biochem. Biophys. Res. Commun. 2015, 465, 421–426. [Google Scholar] [CrossRef]
- De Miguel, M.; Guevara, M.Á.; Sánchez-Gómez, D.; De María, N.; Díaz, L.M.; Mancha, J.A.; Fernández De Simón, B.; Cadahía, E.; Desai, N.; Aranda, I.; et al. Organ-Specific Metabolic Responses to Drought in Pinus Pinaster Ait. Plant Physiol. Biochem. 2016, 102, 17–26. [Google Scholar] [CrossRef]
- Kang, J.; Lee, H.; Lim, H.; Lee, W. Identification of Potential Metabolic Markers for the Selection of a High-Yield Clone of Quercus Acutissima in Clonal Seed Orchard. Forests 2018, 9, 116. [Google Scholar] [CrossRef]
- Conrad, A.O.; McPherson, B.A.; Wood, D.L.; Madden, L.V.; Bonello, P. Constitutive Phenolic Biomarkers Identify Naïve Quercus Agrifolia Resistant to Phytophthora Ramorum, the Causal Agent of Sudden Oak Death. Tree Physiol. 2017, 37, 1686–1696. [Google Scholar] [CrossRef] [PubMed]
- Wang, L.; Qu, L.; Zhang, L.; Hu, J.; Tang, F.; Lu, M. Metabolic Responses of Poplar to Apripona Germari (Hope) as Revealed by Metabolite Profiling. Int. J. Mol. Sci. 2016, 17, 923. [Google Scholar] [CrossRef]
- Rodrigues, A.M.; Miguel, C.; Chaves, I.; António, C. Mass Spectrometry-based Forest Tree Metabolomics. Mass. Spectrom. Rev. 2021, 40, 126–157. [Google Scholar] [CrossRef]
- Zobel, B.J.; van Buijtenen, J.P. Wood Variation and Wood Properties. In Wood Variation; Springer Series in Wood Science; Timell, T.E., Ed.; Springer Publishing: Berlin/Heidelberg, Germany, 1989; pp. 1–32. [Google Scholar] [CrossRef]
- Guerriero, G.; Sergeant, K.; Hausman, J.-F. Wood Biosynthesis and Typologies: A Molecular Rhapsody. Tree Physiol. 2014, 34, 839–855. [Google Scholar] [CrossRef] [PubMed]
- Sarkanen, K.V. Renewable Resources for the Production of Fuels and Chemicals. Science 1976, 191, 773–776. [Google Scholar] [CrossRef] [PubMed]
- Ragauskas, A.J.; Williams, C.K.; Davison, B.H.; Britovsek, G.; Cairney, J.; Eckert, C.A.; Frederick, W.J.; Hallett, J.P.; Leak, D.J.; Liotta, C.L.; et al. The Path Forward for Biofuels and Biomaterials. Science 2006, 311, 484–489. [Google Scholar] [CrossRef] [PubMed]
- Yue, X.; Li, G.; Chen, X.; Li, Z.; Gu, H.; Chen, H.; Peng, W. Nano Catalysis of Biofuels and Biochemicals from Cotinus coggygria Scop. Wood for Bio-Oil Raw Material. Polymers 2022, 14, 4610. [Google Scholar] [CrossRef] [PubMed]
- Ge, S.; Liang, Y.; Zhou, C.; Sheng, Y.; Zhang, M.; Cai, L.; Zhou, Y.; Huang, Z.; Manzo, M.; Wu, C.; et al. The Potential of Pinus Armandii Franch for High-Grade Resource Utilization. Biomass Bioenergy 2022, 158, 106345. [Google Scholar] [CrossRef]
- Wang, X.; Wang, Q.; Xu, G.; Xu, L. Advances in the Research of Constituents and Pharmacology of Populus L. Nat. Prod. Res. 1999, 11, 65–74. [Google Scholar] [CrossRef]
- Broeck, A.V. EUFORGEN Technical Guidelines for Genetic Conservation and Use for European Black Poplar (Populus Nigra); International Plant Genetic Resources Institute: Rome, Italy, 2003. [Google Scholar]
- Hu, J.; Wang, L.; Yan, D.; Lu, M.Z. Research and Application of Transgenic Poplar in China. In Challenges and Opportunities for the World’s Forests in the 21st Century; Fenning, T., Ed.; Forestry Sciences; Springer Publishing: Dordrecht, The Netherlands, 2014; pp. 567–584. [Google Scholar] [CrossRef]
- Janz, D.; Behnke, K.; Schnitzler, J.P.; Kanawati, B.; Schmitt-Kopplin, P.; Polle, A. Pathway Analysis of the Transcriptome and Metabolome of Salt Sensitive and Tolerant Poplar Species Reveals Evolutionary Adaption of Stress Tolerance Mechanisms. BMC Plant Biol. 2010, 10, 150. [Google Scholar] [CrossRef]
- Guerra, F.P.; Richards, J.H.; Fiehn, O.; Famula, R.; Stanton, B.J.; Shuren, R.; Sykes, R.; Davis, M.F.; Neale, D.B. Analysis of the Genetic Variation in Growth, Ecophysiology, and Chemical and Metabolomic Composition of Wood of Populus trichocarpa Provenances. Tree Genet. Genom. 2016, 12, 6. [Google Scholar] [CrossRef]
- Ning, K.; Ding, C.; Zhu, W.; Zhang, W.; Dong, Y.; Shen, Y.; Su, X. Comparative Metabolomic Analysis of the Cambium Tissue of Non-Transgenic and Multi-Gene Transgenic Poplar (Populus × Euramericana ‘Guariento’). Front. Plant Sci. 2018, 9, 1201. [Google Scholar] [CrossRef]
- Obudulu, O.; Mähler, N.; Skotare, T.; Bygdell, J.; Abreu, I.N.; Ahnlund, M.; Latha Gandla, M.; Petterle, A.; Moritz, T.; Hvidsten, T.R.; et al. A Multi-Omics Approach Reveals Function of Secretory Carrier-Associated Membrane Proteins in Wood Formation of Populus Trees. BMC Genom. 2018, 19, 11. [Google Scholar] [CrossRef]
- Jia, H.; Wang, L.; Li, J.; Sun, P.; Lu, M.; Hu, J. Comparative Metabolomics Analysis Reveals Different Metabolic Responses to Drought in Tolerant and Susceptible Poplar Species. Physiol. Plant. 2020, 168, 531–546. [Google Scholar] [CrossRef] [PubMed]
- Huang, X.-Y.; Shang, J.; Zhong, Y.-H.; Li, D.-L.; Song, L.-J.; Wang, J. Disaggregation of Ploidy, Gender, and Genotype Effects on Wood and Fiber Traits in a Diploid and Triploid Hybrid Poplar Family. Front. Plant Sci. 2022, 13, 866296. [Google Scholar] [CrossRef] [PubMed]
- Lauriks, F.; Salomón, R.L.; De Roo, L.; Goossens, W.; Leroux, O.; Steppe, K. Limited Plasticity of Anatomical and Hydraulic Traits in Aspen Trees under Elevated CO2 and Seasonal Drought. Plant Physiol. 2022, 188, 268–284. [Google Scholar] [CrossRef] [PubMed]
- Gibbons, H.; O’Gorman, A.; Brennan, L. Metabolomics as a Tool in Nutritional Research. Curr. Opin. Lipidol. 2015, 26, 30–34. [Google Scholar] [CrossRef]
- Meijón, M.; Feito, I.; Oravec, M.; Delatorre, C.; Weckwerth, W.; Majada, J.; Valledor, L. Exploring Natural Variation of Pinus Pinaster Aiton Using Metabolomics: Is It Possible to Identify the Region of Origin of a Pine from Its Metabolites? Mol. Ecol. 2016, 25, 959–976. [Google Scholar] [CrossRef]
- Alseekh, S.; Fernie, A.R. Metabolomics 20 Years on: What Have We Learned and What Hurdles Remain? Plant J. 2018, 94, 933–942. [Google Scholar] [CrossRef]
- Naik, B.; Kumar, V.; Rizwanuddin, S.; Chauhan, M.; Choudhary, M.; Gupta, A.K.; Kumar, P.; Kumar, V.; Saris, P.E.J.; Rather, M.A.; et al. Genomics, Proteomics, and Metabolomics Approaches to Improve Abiotic Stress Tolerance in Tomato Plant. Int. J. Mol. Sci. 2023, 24, 3025. [Google Scholar] [CrossRef]
- Jorge, T.F.; Rodrigues, J.A.; Caldana, C.; Schmidt, R.; van Dongen, J.T.; Thomas-Oates, J.; António, C. Mass Spectrometry-Based Plant Metabolomics: Metabolite Responses to Abiotic Stress. Mass Spectrom. Rev. 2016, 35, 620–649. [Google Scholar] [CrossRef]
- Xu, L.; Liu, H.; Ma, Y.; Wu, C.; Li, R.; Chao, Z. Comparative Study of Volatile Components from Male and Female Flower Buds of Populus × Tomentosa by HS-SPME-GC-MS. Nat. Prod. Res. 2019, 33, 2105–2108. [Google Scholar] [CrossRef]
- Calumpang, C.L.F.; Saigo, T.; Watanabe, M.; Tohge, T. Cross-Species Comparison of Fruit-Metabolomics to Elucidate Metabolic Regulation of Fruit Polyphenolics among Solanaceous Crops. Metabolites 2020, 10, 209. [Google Scholar] [CrossRef]
- Barchet, G.L.H.; Dauwe, R.; Guy, R.D.; Schroeder, W.R.; Soolanayakanahally, R.Y.; Campbell, M.M.; Mansfield, S.D. Investigating the Drought-Stress Response of Hybrid Poplar Genotypes by Metabolite Profiling. Tree Physiol. 2014, 34, 1203–1219. [Google Scholar] [CrossRef] [PubMed]
- Wang, L.; Qu, L.; Hu, J.; Zhang, L.; Tang, F.; Lu, M. Metabolomics Reveals Constitutive Metabolites That Contribute Resistance to Fall Webworm (Hyphantria Cunea) in Populus deltoides. Environ. Exp. Bot. 2017, 136, 31–40. [Google Scholar] [CrossRef]
- Wang, Z.; Tian, L.; Xiao, Y.; Zhao, M.; Chang, Y.; Zhou, Y.; Liu, S.; Zhao, H.; Xiu, Y. Quantitative and Differential Analysis between Bupleurum chinense DC. and Bupleurum scorzonerifolium Willd. Using HPLC-MS and GC-MS Coupled with Multivariate Statistical Analysis. Molecules 2023, 28, 5630. [Google Scholar] [CrossRef] [PubMed]
- Plomion, C.; Leprovost, G.; Stokes, A. Wood Formation in Trees. Plant Physiol. 2001, 127, 1513–1523. [Google Scholar] [CrossRef]
- Zhang, J.; Song, X.; Zhang, L.; Jia, H.; Peng, X.; Zhao, Z.; Su, X.; Li, X.; Lu, M.; Hu, J. Agronomic Performance of 27 Populus Clones Evaluated after Two 3-Year Coppice Rotations in Henan, China. GCB Bioenergy 2020, 12, 168–181. [Google Scholar] [CrossRef]
- Robinson, A.R.; Mansfield, S.D. Metabolomics in Poplar. In Genetics, Genomics and Breeding of Poplar, 1st ed.; Joshi, C.P., Difazio, S., Kole, C., Eds.; CRC Publishing: Boca Raton, FL, USA, 2011; pp. 166–191. [Google Scholar] [CrossRef]
- Robinson, A.R.; Gheneim, R.; Kozak, R.A.; Ellis, D.D.; Mansfield, S.D. The Potential of Metabolite Profiling as a Selection Tool for Genotype Discrimination in Populus. J. Exp. Bot. 2005, 56, 2807–2819. [Google Scholar] [CrossRef]
- Zhang, L.; Liu, B.; Zhang, J.; Hu, J. Insights of Molecular Mechanism of Xylem Development in Five Black Poplar Cultivars. Front. Plant Sci. 2020, 11, 620. [Google Scholar] [CrossRef]
- Shen, H.; Xing, X.; Guan, Y.; Zhou, L.; Liu, S.; Gao, H. Radial Variation Studies on Wood Properties of Populus deltoides Parents and Their Hybrids. BioResources 2021, 16, 4905–4923. [Google Scholar] [CrossRef]
- Zhang, C.; Li, S.; Zhao, Z.; Hu, J.; Han, Y. A New Poplar Variety Populus deltoides CL. ‘Danhong’. Sci. Silvae Sin. 2008, 44, 169. [Google Scholar] [CrossRef]
- Yang, F.; Wang, Y.; Wang, J.; Deng, W.; Liao, L.; Li, M. Different Eco-Physiological Responses between Male and Female Populus deltoides Clones to Waterlogging Stress. For. Ecol. Manag. 2011, 262, 1963–1971. [Google Scholar] [CrossRef]
- Jia, R.; Wang, Y.; Wang, R.; Chen, X. Physical and Mechanical Properties of Poplar Clones and Rapid Prediction of the Properties by Near Infrared Spectroscopy. Forests 2021, 12, 206. [Google Scholar] [CrossRef]
- Eckenwalder, J.E. Systematics and Evolution of Populus. In Biology of Populus and Its Implications for Management and Conservation; Stettler, R.F., Bradshaw, H.D., Heilman, P.E., Hinckley, T.M., Eds.; NRC Research Publishing: Ottawa, ON, Canada, 1996; pp. 7–32. [Google Scholar]
- Huang, Z.R.; Zhang, H.; Ye, X.; Lai, N.W.; Yang, L.T.; Guo, J.X.; Chen, L.S. UHPLC-Q-TOF/MS-Based Metabolomics Reveals Altered Metabolic Profiles in Magnesium Deficient Leaves of Citrus sinensis. Sci. Hortic. 2021, 278, 109870. [Google Scholar] [CrossRef]
- Vogt, T. Phenylpropanoid Biosynthesis. Mol. Plant. 2010, 3, 2–20. [Google Scholar] [CrossRef] [PubMed]
- Dempsey, D.A.; Vlot, A.C.; Wildermuth, M.C.; Klessig, D.F. Salicylic Acid Biosynthesis and Metabolism. Arab. Book. 2011, 9, e0156. [Google Scholar] [CrossRef] [PubMed]
- Dempsey, D.A.; Klessig, D.F. How Does the Multifaceted Plant Hormone Salicylic Acid Combat Disease in Plants and Are Similar Mechanisms Utilized in Humans? BMC Biol. 2017, 15, 23. [Google Scholar] [CrossRef]
- Vlot, A.C.; Dempsey, D.A.; Klessig, D.F. Salicylic Acid, a Multifaceted Hormone to Combat Disease. Annu. Rev. Phytopathol. 2009, 47, 177–206. [Google Scholar] [CrossRef]
- Zhang, J.; Nieminen, K.; Serra, J.A.A.; Helariutta, Y. The Formation of Wood and Its Control. Curr. Opin. Plant Biol. 2014, 17, 56–63. [Google Scholar] [CrossRef]
- Yang, X.; Yu, X.; Liu, Y.; Shi, Z.; Li, L.; Xie, S.; Zhu, G.; Zhao, P. Comparative Metabolomics Analysis Reveals the Color Variation between Heartwood and Sapwood of Chinese Fir (Cunninghamia lanceolata (Lamb.) Hook. Ind. Crops Prod. 2021, 169, 113656. [Google Scholar] [CrossRef]
- Kanehisa, M.; Furumichi, M.; Tanabe, M.; Sato, Y.; Morishima, K. KEGG: New Perspectives on Genomes, Pathways, Diseases and Drugs. Nucleic Acids Res. 2017, 45, D353–D361. [Google Scholar] [CrossRef]


| Metabolite | p_Value | FDR | A | B | C | Superclass |
|---|---|---|---|---|---|---|
| cis-3-Hexenyl hexanoate | 6.85 × 10⁻⁵ | 1.58 × 10⁻³ | 1.888 | 1.841 | 2.277 | a |
| 3-hydroxy-3-methyl-Glutaric acid | 1.00 × 10⁻² | 3.46 × 10⁻² | 3.059 | 3.030 | 3.331 | a |
| (−)-11-Hydroxy-9,15,16-trioxooctadec-anoic acid | 4.03 × 10⁻³ | 1.93 × 10⁻² | 3.848 | 3.698 | 3.723 | a |
| Myristoleic acid | 1.28 × 10⁻⁴ | 2.24 × 10⁻³ | 3.026 | 3.079 | 3.265 | a |
| Alpha-Linolenic acid | 3.61 × 10⁻² | 6.68 × 10⁻² | 3.574 | 3.273 | 3.243 | a |
| 1,11-Undecanedicarboxylic acid | 4.20 × 10⁻⁴ | 4.64 × 10⁻³ | 2.931 | 2.976 | 3.182 | a |
| Capsidiol | 7.49 × 10⁻⁴ | 6.61 × 10⁻³ | 2.032 | 2.007 | 2.231 | a |
| Furanofukinin | 1.05 × 10⁻² | 3.56 × 10⁻² | 2.580 | 2.800 | 2.515 | a |
| Stachyoside A | 3.18 × 10⁻³ | 1.67 × 10⁻² | 3.474 | 3.434 | 3.636 | a |
| Sorbitan laurate | 4.19 × 10⁻² | 9.08 × 10⁻² | 2.687 | 2.604 | 2.562 | a |
| L-Phenylalanine | 3.99 × 10⁻⁴ | 3.44 × 10⁻³ | 0.059 | 0.056 | 0.108 | b |
| Neuromedin B (1-3) | 5.32 × 10⁻³ | 2.33 × 10⁻² | 3.406 | 3.579 | 3.343 | b |
| 6-Oxopiperidine-2-carboxylic acid | 3.36 × 10⁻² | 7.80 × 10⁻² | 1.957 | 2.159 | 1.976 | b |
| Glutamylglycine | 2.32 × 10⁻² | 4.82 × 10⁻² | 2.284 | 1.652 | 1.584 | b |
| 3-Hydroxy-L-proline | 7.23 × 10⁻³ | 2.15 × 10⁻² | 2.540 | 2.296 | 2.270 | b |
| Natamycin | 5.18 × 10⁻⁴ | 3.91 × 10⁻³ | 2.330 | 2.576 | 2.342 | c |
| Glucosylisomaltol | 1.24 × 10⁻³ | 6.98 × 10⁻³ | 2.177 | 2.106 | 2.513 | c |
| 6-(4-ethyl-3-hydroxyphenoxy)-3,4,5-trihydroxyoxane-2-carboxylic acid | 1.31 × 10⁻² | 4.12 × 10⁻² | 2.592 | 2.725 | 2.542 | c |
| Kinetin-7-N-glucoside | 2.95 × 10⁻³ | 1.19 × 10⁻² | 3.433 | 3.357 | 3.341 | c |
| 3-Hydroxy-1-(4-hydroxyphenyl)-1-propanone | 9.00 × 10⁻³ | 3.25 × 10⁻² | 2.510 | 2.653 | 2.496 | c |
| Tipranavir | 1.18 × 10⁻⁴ | 2.15 × 10⁻³ | 2.677 | 2.583 | 3.065 | d |
| Oxacyclotetradecan-2-one | 5.95 × 10⁻³ | 2.50 × 10⁻² | 1.759 | 1.841 | 2.226 | d |
| 6″-O-Acetylglycitin | 4.92 × 10⁻² | 8.43 × 10⁻² | 2.401 | 2.231 | 2.221 | d |
| Caffeic Acid | 4.64 × 10⁻² | 8.10 × 10⁻² | 2.856 | 2.641 | 2.662 | d |
| Hovenolactone | 1.98 × 10⁻³ | 1.24 × 10⁻² | 2.909 | 3.002 | 3.406 | e |
| Benzoic acid | 3.36 × 10⁻² | 6.32 × 10⁻² | 1.664 | 1.463 | 1.488 | e |
| 4-ethenyl-6-methoxybenzene-1,3-diol | 3.24 × 10⁻² | 7.58 × 10⁻² | 3.365 | 3.451 | 3.337 | e |
| 2′-Hydroxyacetophenone | 9.17 × 10⁻³ | 3.29 × 10⁻² | 1.854 | 2.075 | 1.805 | e |
| 1-(4-methoxy-1-benzofuran-5-yl) ethan-1-ol | 3.38 × 10⁻² | 6.34 × 10⁻² | 2.040 | 1.856 | 1.778 | f |
| 5-Methyldeoxycytidine | 5.76 × 10⁻⁵ | 9.70 × 10⁻⁴ | 3.910 | 3.627 | 4.415 | g |
Disclaimer/Publisher’s Note: The statements, opinions and data contained in all publications are solely those of the individual author(s) and contributor(s) and not of MDPI and/or the editor(s). MDPI and/or the editor(s) disclaim responsibility for any injury to people or property resulting from any ideas, methods, instructions or products referred to in the content. |
© 2023 by the authors. Licensee MDPI, Basel, Switzerland. This article is an open access article distributed under the terms and conditions of the Creative Commons Attribution (CC BY) license (https://creativecommons.org/licenses/by/4.0/).
Share and Cite
Li, L.; Liu, Y.; Yu, X.; Yang, X.; Xie, S.; Zhu, G.; Zhao, P. Comparative Analysis of the Wood Metabolites of Three Poplar Clones Using UPLC-Triple-TOF-MS. Molecules 2023, 28, 7024. https://doi.org/10.3390/molecules28207024
Li L, Liu Y, Yu X, Yang X, Xie S, Zhu G, Zhao P. Comparative Analysis of the Wood Metabolites of Three Poplar Clones Using UPLC-Triple-TOF-MS. Molecules. 2023; 28(20):7024. https://doi.org/10.3390/molecules28207024
Chicago/Turabian StyleLi, Liping, Yun Liu, Xiaorui Yu, Xiaoqin Yang, Sida Xie, Guolei Zhu, and Ping Zhao. 2023. "Comparative Analysis of the Wood Metabolites of Three Poplar Clones Using UPLC-Triple-TOF-MS" Molecules 28, no. 20: 7024. https://doi.org/10.3390/molecules28207024