

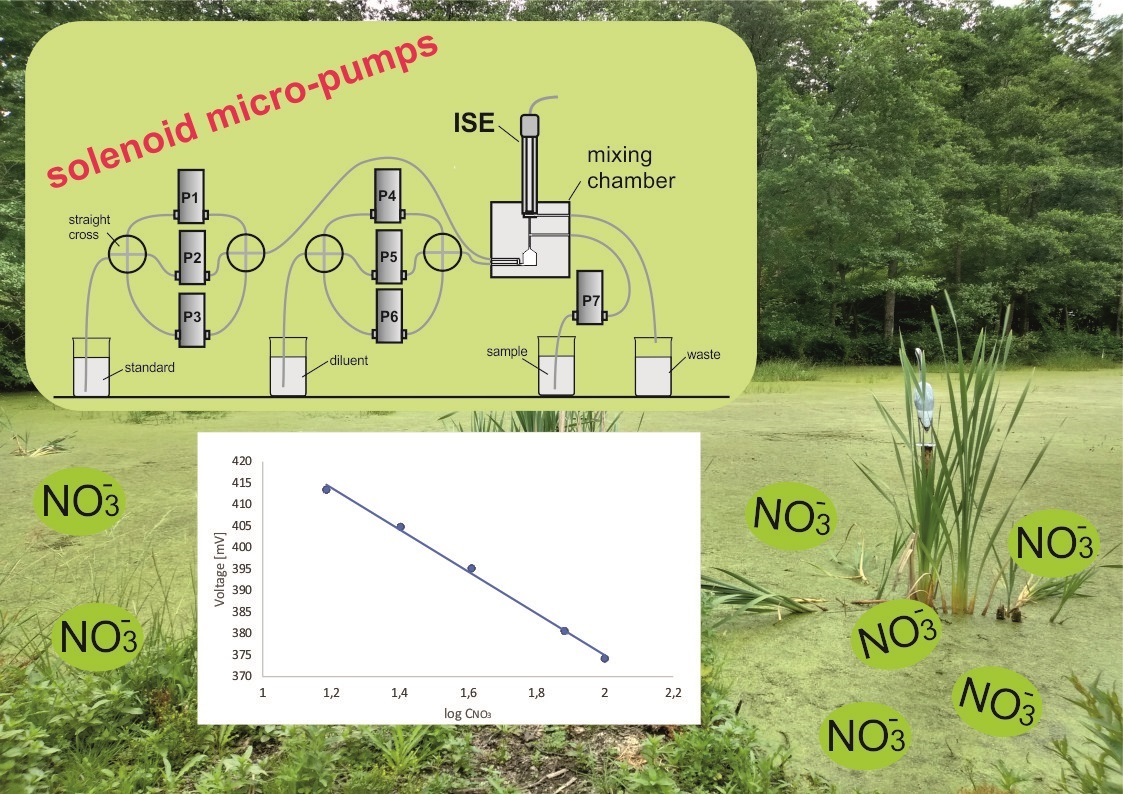
A Multi-Pumping Gradient Calibration Module for Potentiometric Determination of Nitrate in Surface Water

Abstract
:
1. Introduction
2. Results and Discussion
2.1. Re-Calibration of Micro-Pumps
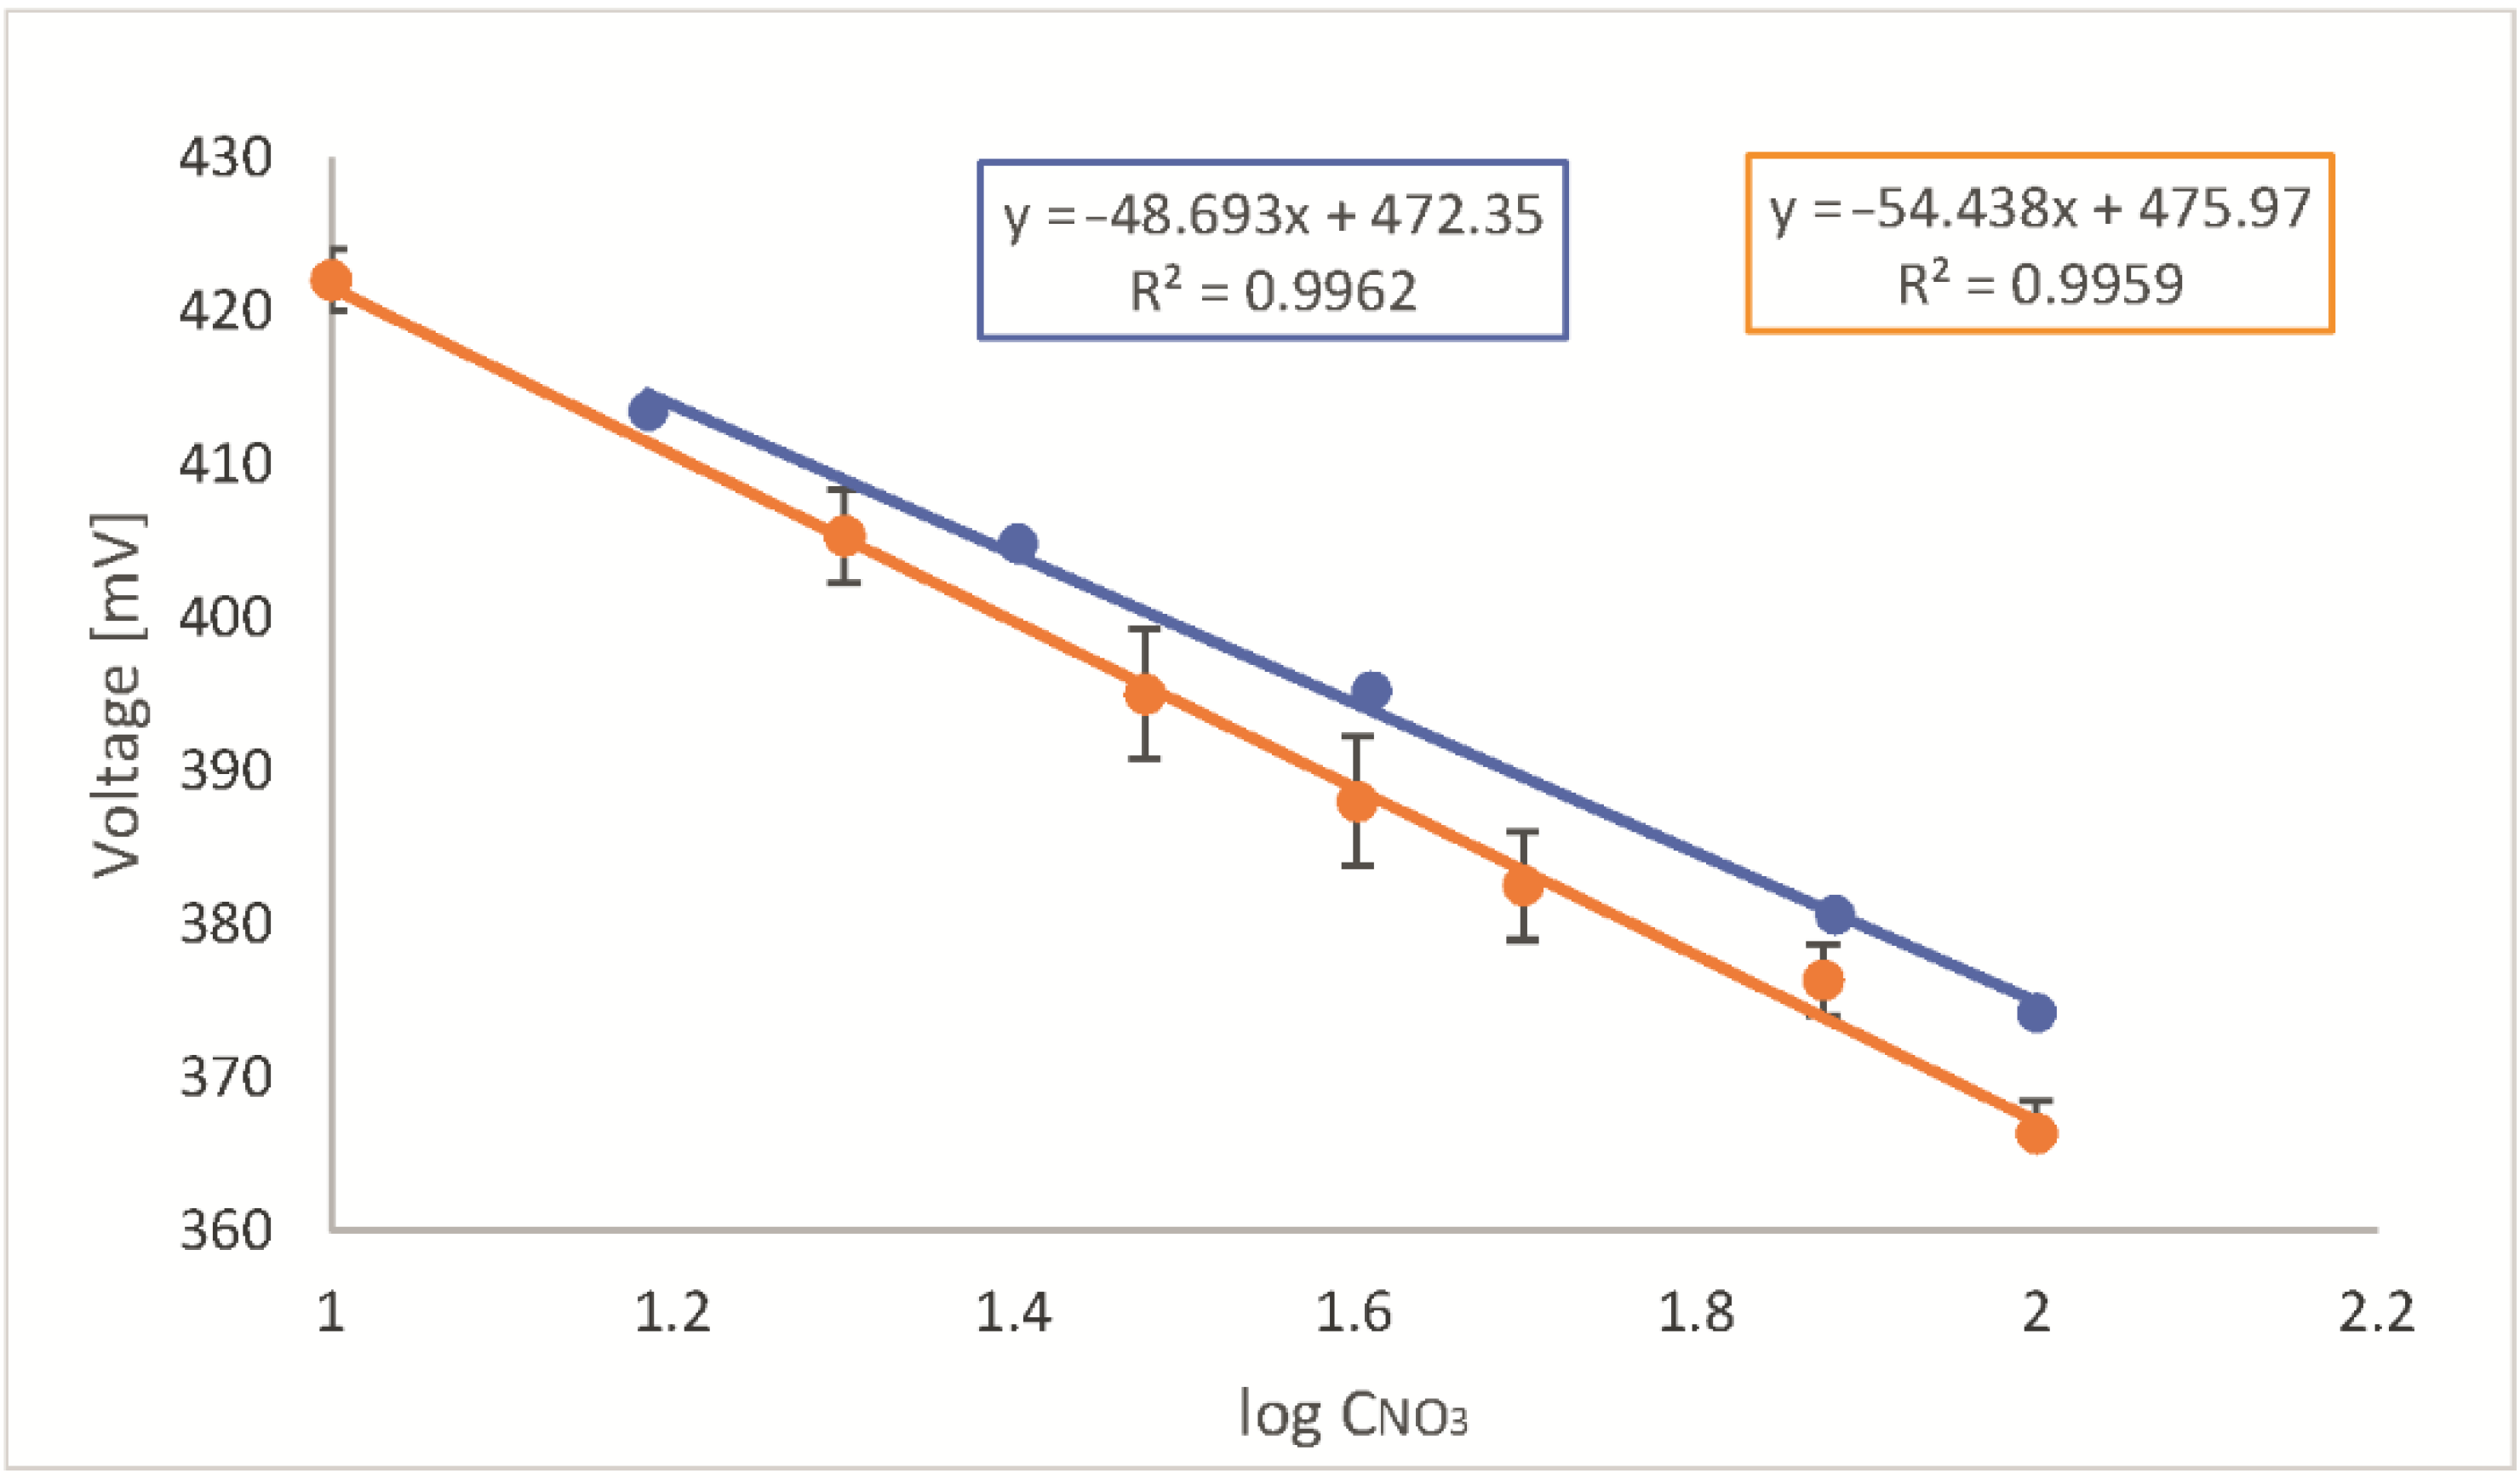
2.2. Calibration Graph
2.3. Application to the Real Sample
3. Materials and Methods
3.1. Chemicals and Reagents
3.2. Apparatus
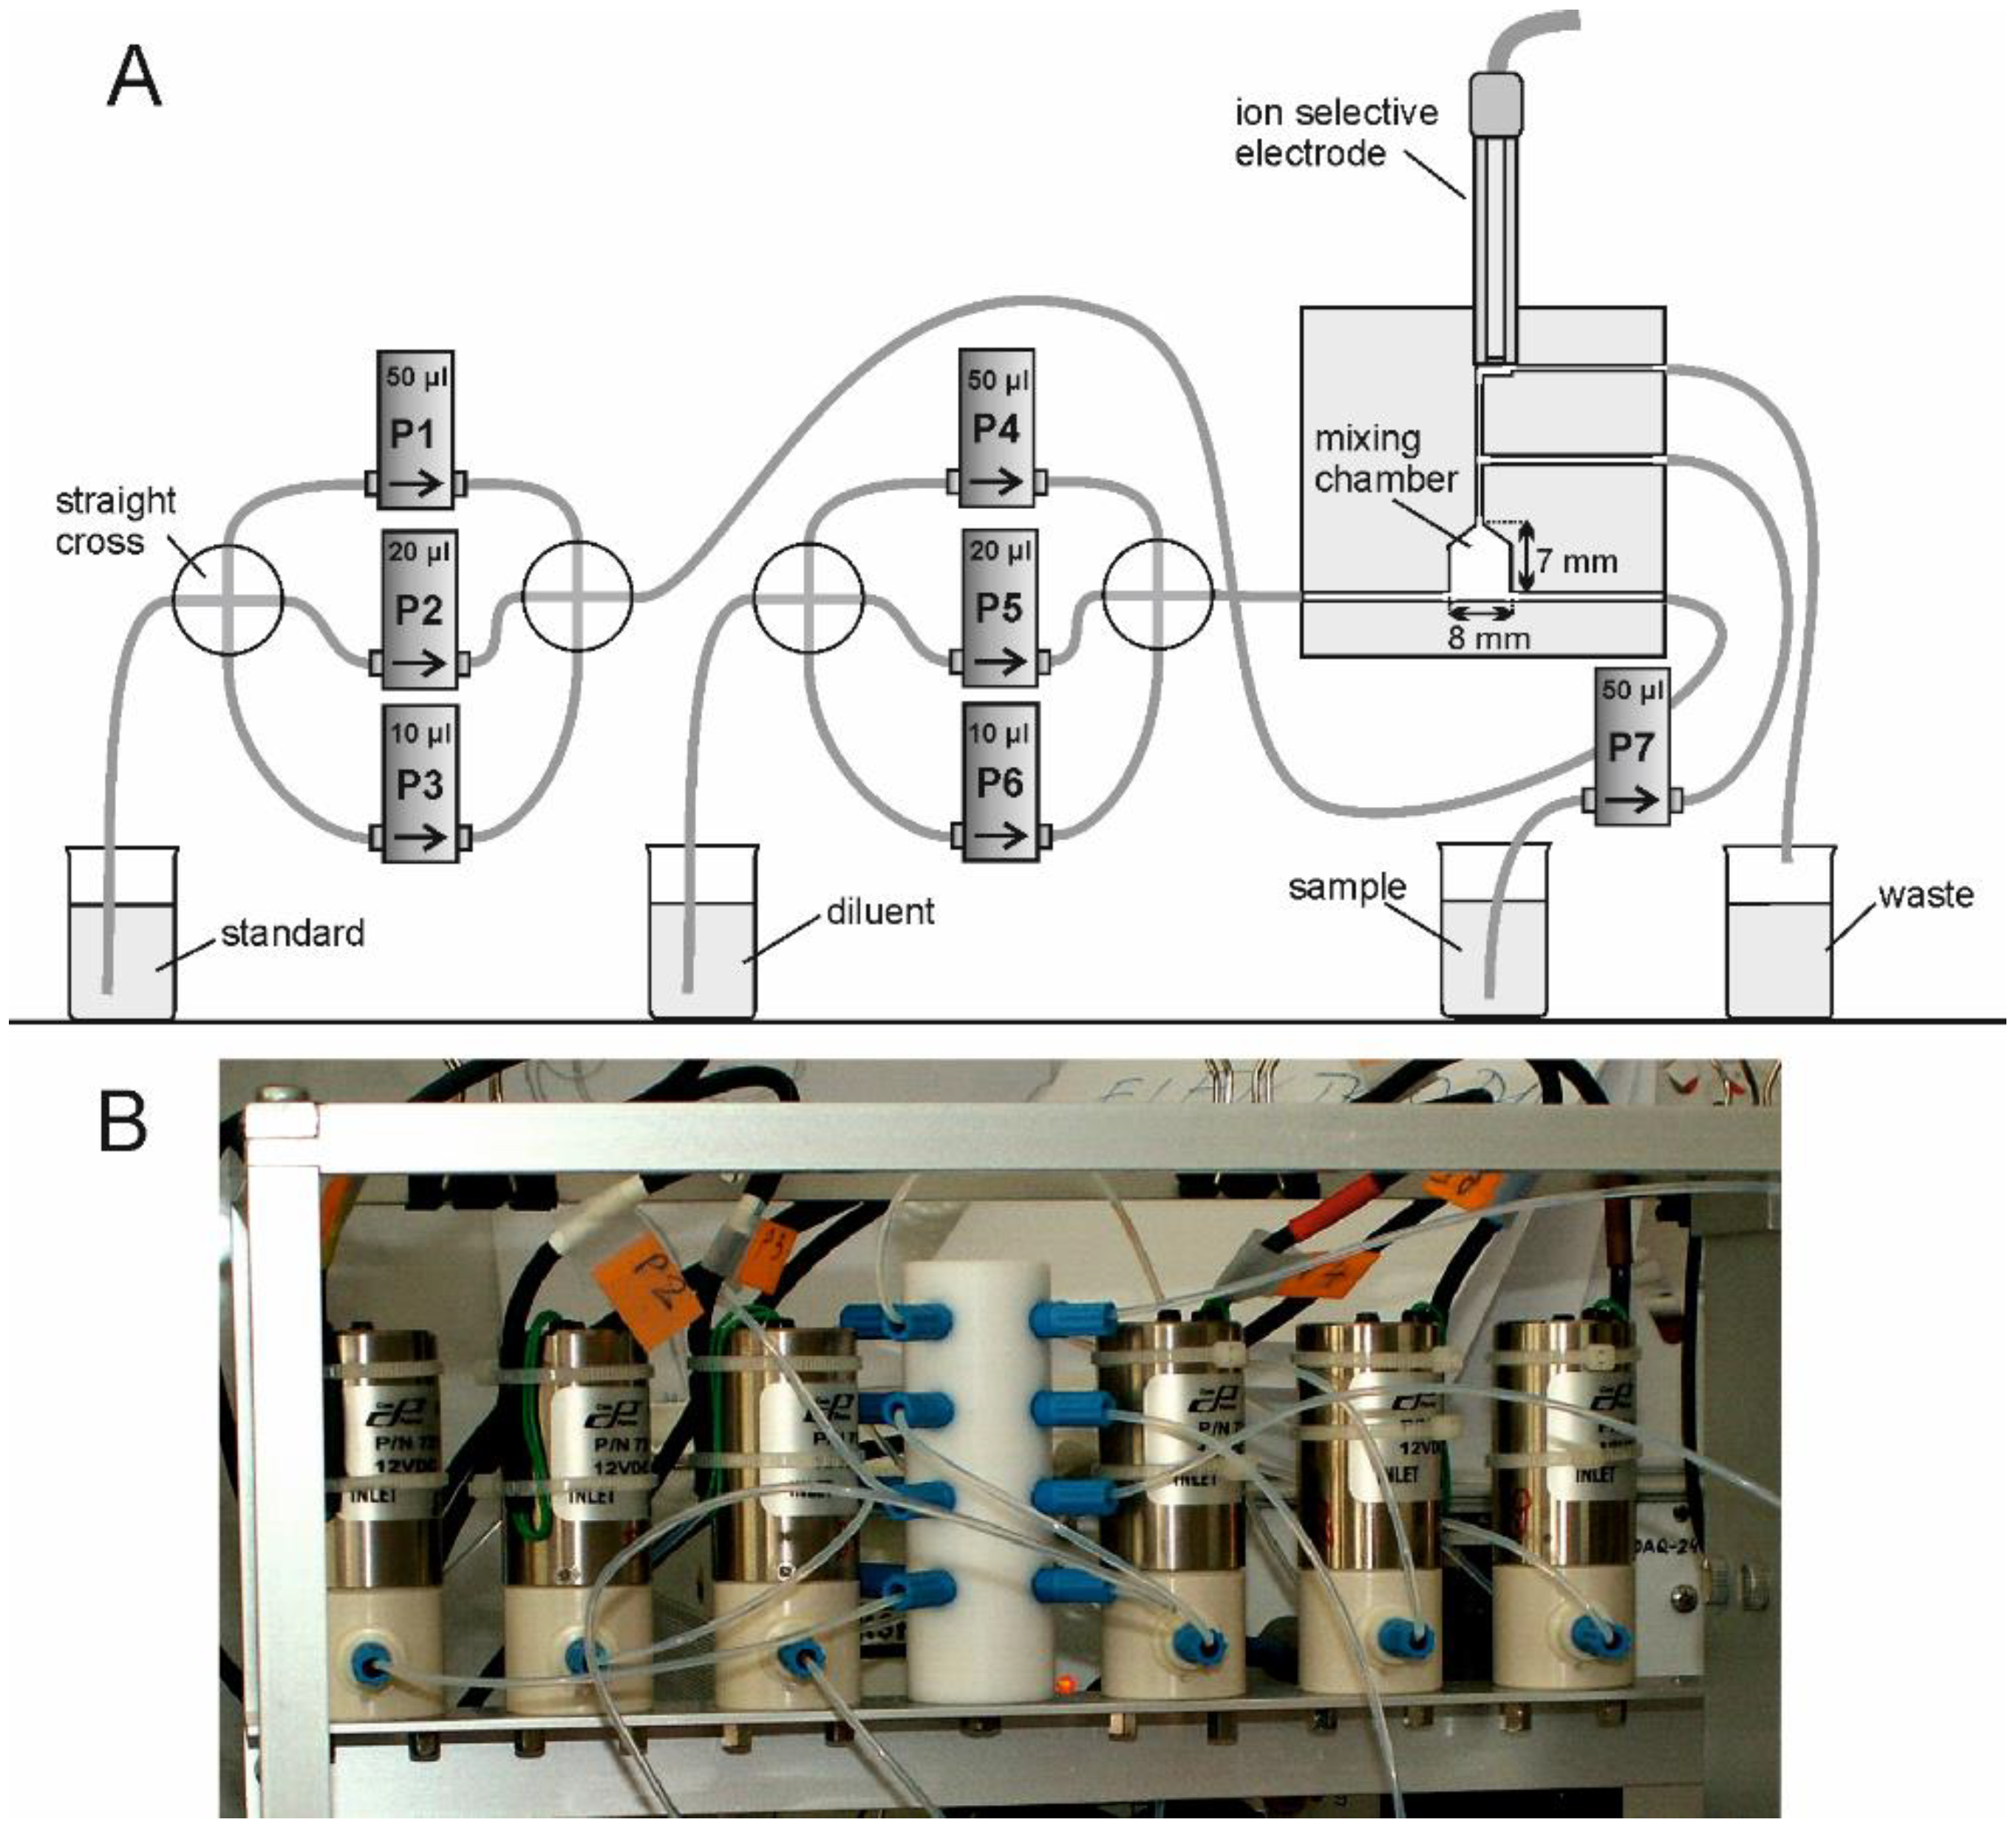
3.2.1. Flow System
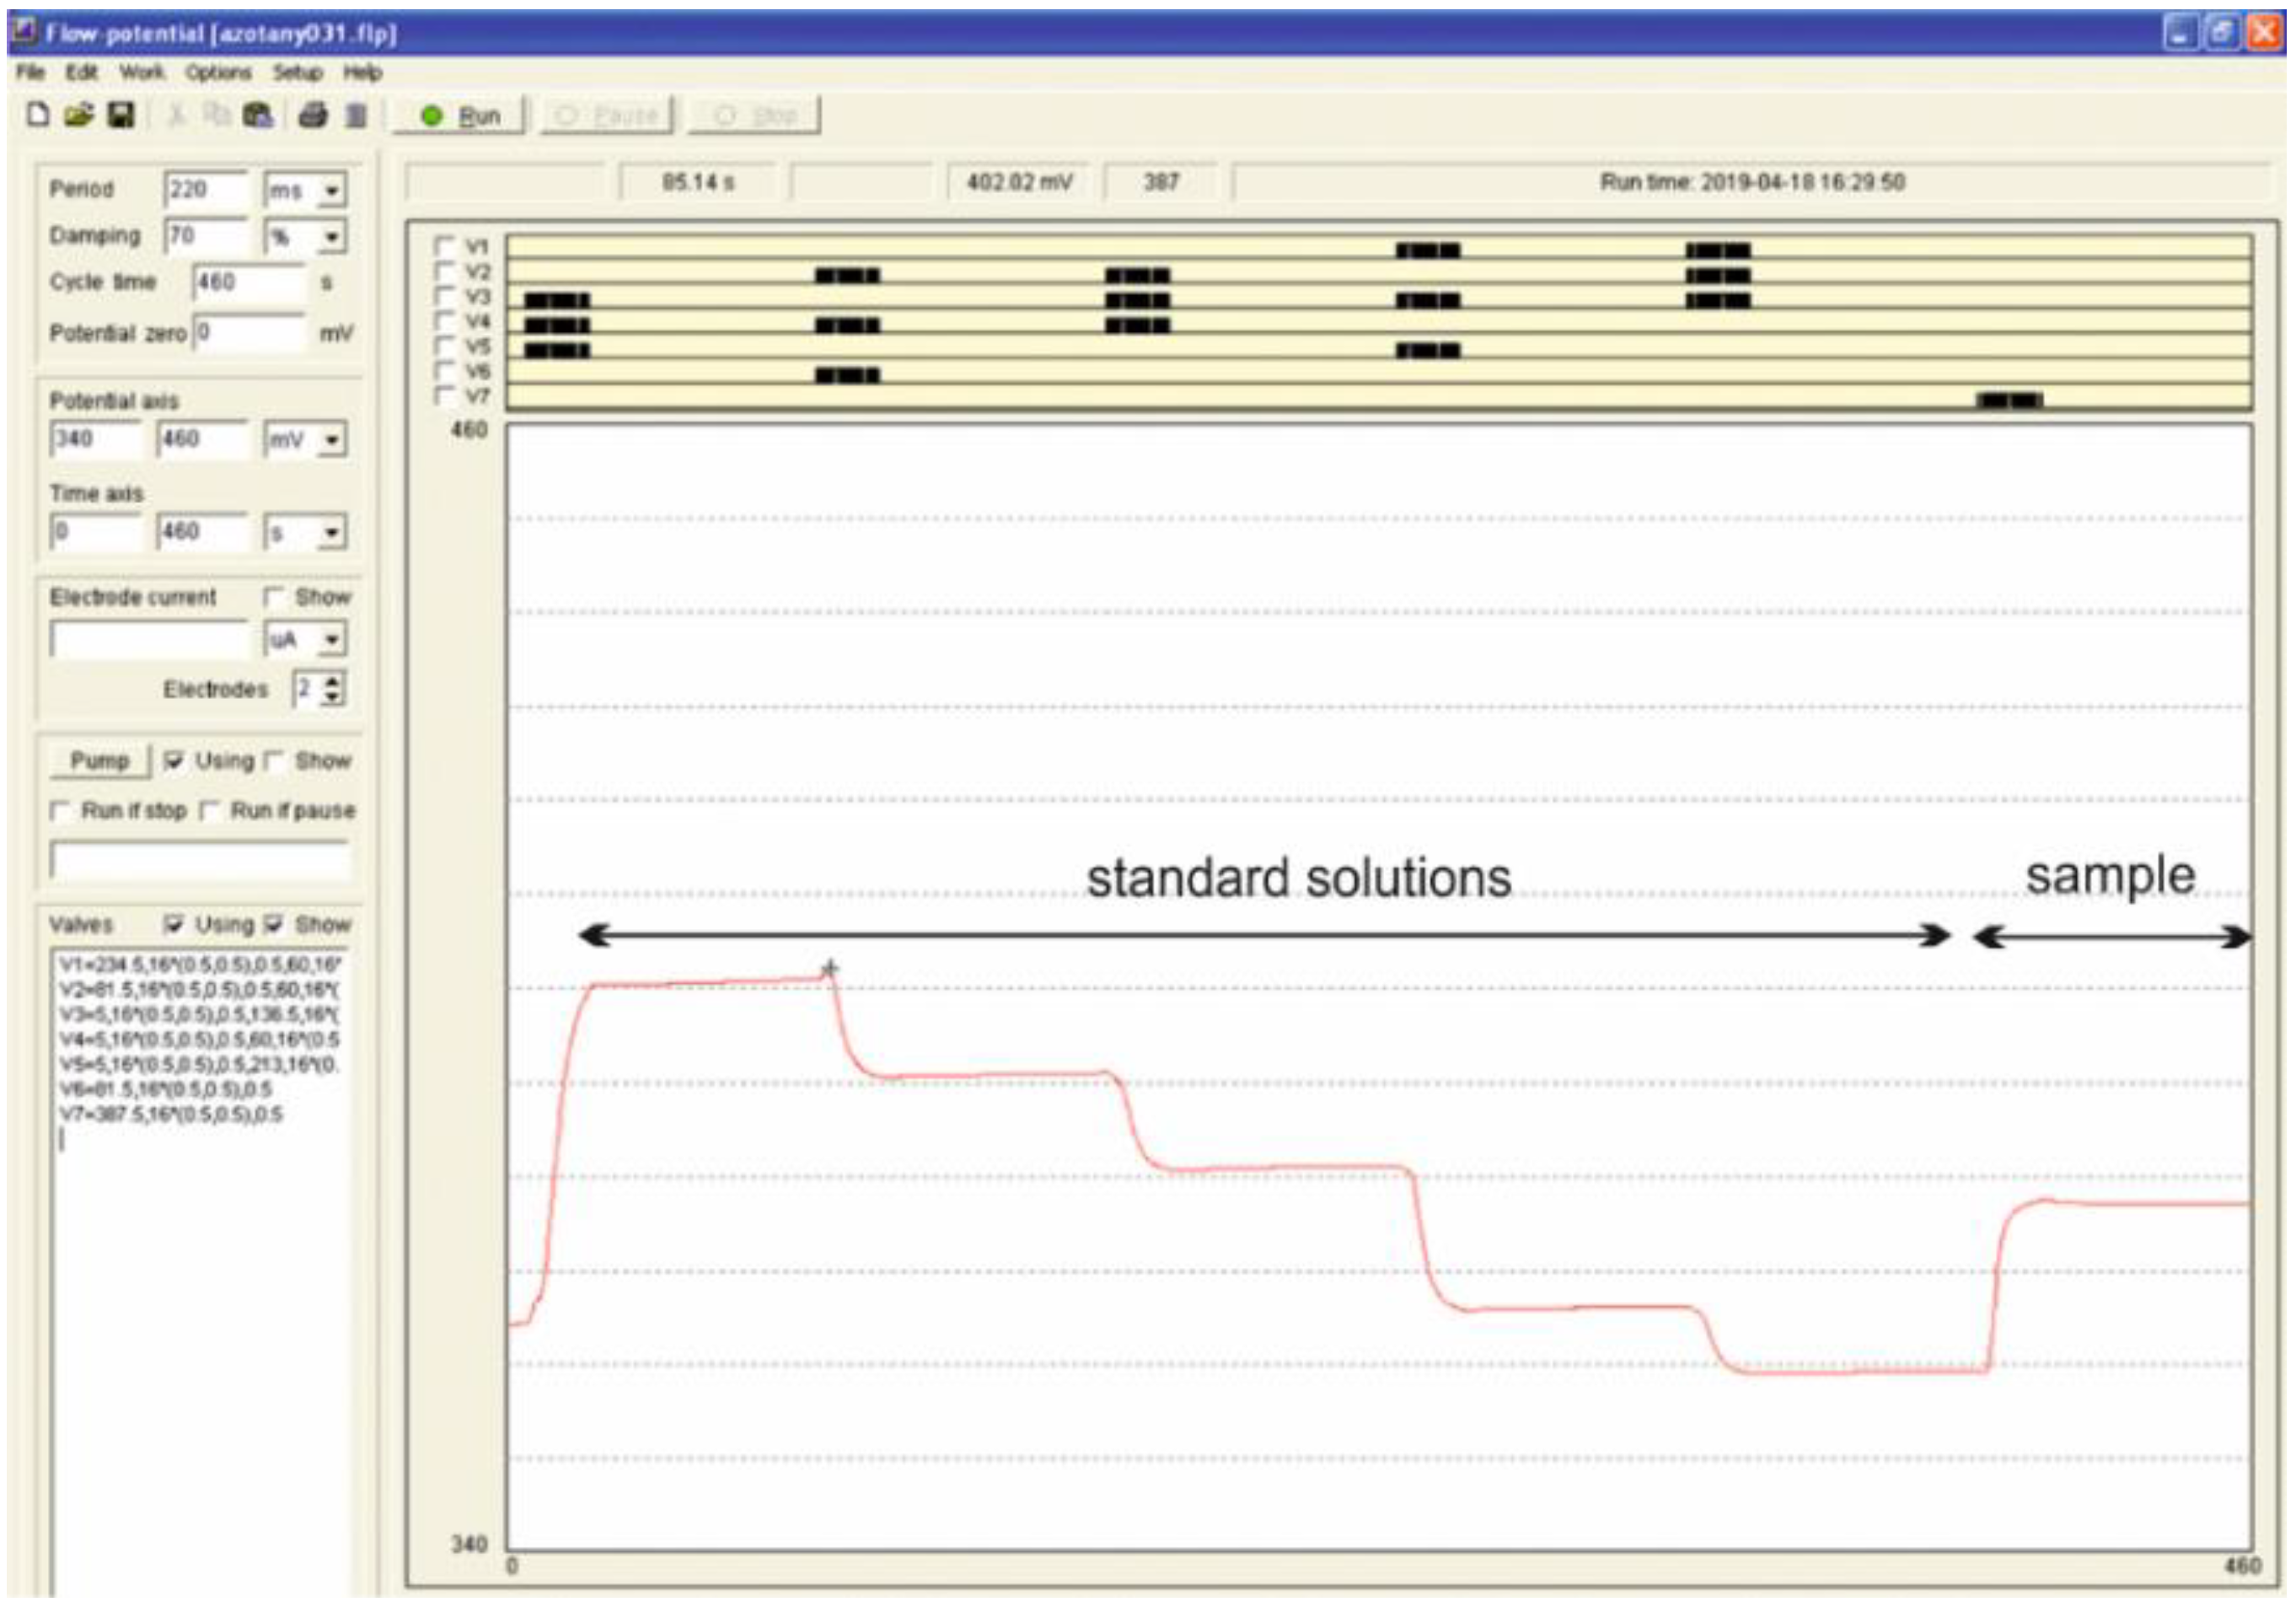
3.2.2. Procedure
3.2.3. Reference Method
4. Conclusions
Author Contributions
Funding
Institutional Review Board Statement
Informed Consent Statement
Data Availability Statement
Conflicts of Interest
Sample Availability
References
- Hornung, M. The Role of Nitrates in the Eutrophication and Acidification of Surface Waters. In Managing Risks of Nitrates to Humans and the Environment; Wilson, W.S., Ball, A.S., Hinton, R.H., Eds.; Woodhead Publishing: Cambridge, UK, 1999; pp. 155–174. [Google Scholar]
- Worsfold, P.J. Challenges in the determination of nutrient species in natural waters. Microchim. Acta 2006, 154, 45–48. [Google Scholar] [CrossRef]
- Trojanowicz, M. Advances in Flow Analysis; Wiley-VCH: Weinheim, Germany, 2008. [Google Scholar]
- Trojanowicz, M.; Kolacinska, K. Recent advances in flow injection analysis. Analyst 2016, 141, 2085–2139. [Google Scholar] [CrossRef] [PubMed]
- Giné, M.F.; Bergamin, H.; Zagatto, F.E.A.G.; Reis, B.F. Simultaneous determination of nitrate and nitrite by flow injection analysis. Anal. Chim. Acta 1980, 114, 191–197. [Google Scholar] [CrossRef]
- Hansen, E.H.; Ghose, A.K.; Růzicka, J. Flow injection analysis of environmental samples for nitrate using an ion-selective electrode. Analyst 1977, 1219, 705–713. [Google Scholar] [CrossRef]
- Brabcová, M.; Rychlovský, P.; Nĕmcová, I. Determination of nitrites, nitrates, and their mixtures using flow injection analysis with spectrophotometric detection. Anal. Lett. 2003, 36, 2303–2316. [Google Scholar] [CrossRef]
- Oms, M.T.; Cerdà, A.; Cerda, V. Sequential injection analysis of nitrites and nitrates. Anal. Chim. Acta 1995, 315, 321–330. [Google Scholar] [CrossRef]
- Horstkotte, B.; Duarte, C.M.; Cerda, V. Chip-on-valve concept: An integrated platform for multisyringe flow injection analysis: Application to nitrite and nitrate determination in seawater. Anal. Lett. 2013, 46, 2345–2358. [Google Scholar] [CrossRef] [Green Version]
- Pons, C.; Santos, J.L.M.; Lima, J.L.F.C.; Forteza, F.; Cerda, V. Multi-pumping flow system for the determination of nitrite and nitrate in water samples. Microchim. Acta 2008, 161, 73–79. [Google Scholar] [CrossRef]
- Tymecki, L.; Strzelak, K.; Koncki, R. A single standard calibration module for flow analysis system based on solenoid microdevices. Talanta 2009, 79, 205–210. [Google Scholar] [CrossRef]
- Tyson, J. Flow injection calibration techniques. Fresenius Z. Anal. Chem. 1988, 329, 663–667. [Google Scholar] [CrossRef]
- Kościelniak, P.; Herman, M.; Janiszewska, J. Flow calibration system with the use of fully rotary directive valve. Lab. Robot. Autom. 1999, 11, 111–119. [Google Scholar] [CrossRef]
- Kościelniak, P.; Kozak, J. Review and classification of the univariate interpolative calibration procedures in flow analysis. Crit. Rev. Anal. Chem. 2004, 34, 25–37. [Google Scholar] [CrossRef]
- Lapa, R.A.S.; Lima, J.L.F.C.; Reis, B.F.; Santos, J.L.M.; Zagatto, E.A.G. Multi-pumping in flow analysis: Concepts, instrumentation, potentialities. Anal. Chim. Acta 2002, 466, 125–132. [Google Scholar] [CrossRef]
- Lima, J.L.F.C.; Santos, J.L.M.; Dias, A.C.B.; Ribeiro, M.F.T.; Zagatto, E.A.G. Multi-pumping flow systems: An automation tool. Talanta 2004, 64, 1091–1098. [Google Scholar] [CrossRef] [PubMed]
- Santos, J.L.M.; Ribeiro, M.F.T.; Dias, A.C.B.; Lima, J.L.F.C.; Zagatto, E.A.G. Multi-pumping flow systems: The potential of simplicity. Anal. Chim. Acta 2007, 600, 21–28. [Google Scholar] [CrossRef]
- Wieczorek, M.; Koscielniak, P.; Swit, P.; Paluch, J.; Kozak, J. Solenoid micropump-based flow system for generalized calibration strategy. Talanta 2015, 133, 21–26. [Google Scholar] [CrossRef]
- Moorcroft, M.J.; Davis, J.; Compton, R.G. Detection and determination of nitrate and nitrite: A review. Talanta 2001, 54, 758–803. [Google Scholar] [CrossRef] [PubMed]
- Singh, P.; Singh, M.K.; Beg, Y.R.; Nishad, G.R. Review on spectroscopic methods for determination of nitrite and nitrate in environmental samples. Talanta 2019, 191, 364–381. [Google Scholar] [CrossRef]
- De Marco, R.; Clarke, G.; Pejcic, B. Ion-selective electrode potentiometry in environmental analysis. Electroanalysis 2007, 19, 1987–2001. [Google Scholar] [CrossRef]
- Choosang, J.; Numnuam, A.; Thavarungkul, P.; Kanatharana, P.; Radu, T.; Ullah, S.; Radu, A. Simultaneous detection of ammonium and nitrate in environmental samples using on ion-selective electrode and comparison with portable colorimetric assays. Sensors 2018, 18, 3555. [Google Scholar] [CrossRef]
- Cole-Parmer, Laboratory Nitrate Ion Electrode Instruction Manual. Available online: https://archive-resources.coleparmer.com/Manual_pdfs/27504-22,-31.pdf (accessed on 15 February 2020).
- Fernandes, R.N.; Sales, M.G.F.; Reis, B.F.; Zagatto, E.A.G.; Arau’jo, A.N.; Montenegro, M.C.B.S.M. Multi-task flow system for potentiometric analysis: Its application to the determination of vitamin B6 in pharmaceuticals. J. Pharm. Biomed. Anal. 2001, 25, 713–720. [Google Scholar] [CrossRef] [PubMed]
- Dorneanu, S.A.; Coman, V.; Popescu, I.C.; Fabry, P. Computer-controlled system for ISEs automatic calibration. Sens. Actuator B 2005, 105, 421–531. [Google Scholar] [CrossRef]
- Pons, C.; Toth, I.V.; Rangel, A.O.S.S.; Forteza, R.; Cerda, V. Multi-pumping flow system for the determination of dissolved orthophosphate and dissolved organic phosphorus in wastewater samples. Anal Chim. Acta 2006, 572, 148–154. [Google Scholar] [CrossRef]
- Application Note 1, Comparison of a Measurement Result with the Certified Value. Available online: http://www.erm.crm.org/ERM_products/application_notes/application_note_1 (accessed on 20 May 2020).
- Koronkiewicz, S.; Kalinowski, S. Direct-injection chemiluminescence detector. Properties and potential applications in flow analysis. Talanta 2015, 133, 112–119. [Google Scholar] [CrossRef] [PubMed]
- Software for Flow Injection Analysis. Available online: http://www.debiany.pl/ksp/index.html (accessed on 1 January 2020).
- Fortes, P.R.; Feres, M.A.; Sasaki, M.K.; Alves, E.R.; Zagatto, E.A.G.; Prior, J.A.V.; Santos, J.L.M.; Lima, J.L.F.C. Evidences for turbulent mixing in multi-pumping flow systems. Talanta 2009, 79, 978–983. [Google Scholar] [CrossRef] [PubMed]


| Micro-Pump | Nominal Volume [µL] | Mean, Real Stroke Volume [µL] | Precision (R.S.D. [%] 1) | Accuracy (R.D. [%] 2) |
|---|---|---|---|---|
| P1 | 50 | 54.3 (55.2) | 0.11 (0.03) | 8.6 (10.4) |
| P2 | 20 | 22.2 (22.7) | 0.54 (0.20) | 11.0 (13.5) |
| P3 | 10 | 13.1 (13.3) | 0.91 (0.16) | 31.0 (33.0) |
| P4 | 50 | 51.3 (52.2) | 0.02 (0.09) | 2.7 (4.4) |
| P5 | 20 | 21.0 (21.6) | 0.38 (0.13) | 5.2 (8.0) |
| P6 | 10 | 14.3 (14.8) | 0.21 (0.10) | 43 (48) |
| P7 | 50 | 52.3 (52.6) | 0.27 (0.03) | 4.7 (5.2) |
| Standard Concentration | Dilution Degree | Standard Concentration after Dilution log CNO3 | ISE Voltage V [mv] | Sample Concentration log CNO3 | Accuracy (R.D. [%]) | ||
|---|---|---|---|---|---|---|---|
| [mg L–1] | log CNO3 | Nominal | Found | ||||
| 10 | 1.00 | 0.153 | 0.186 | 439.4 ± 0.6 | 0.70 | 0.65 | −7.1 |
| 0.253 | 0.403 | 438.0 ± 0.4 | |||||
| 0.408 | 0.610 | 433.2 ± 0.2 | |||||
| 0.762 | 0.882 | 421.9 ± 0.1 | |||||
| 1.00 | 1.00 | 415.0 ± 0.1 | |||||
| 50 | 1.70 | 0.153 | 0.88 | 424.9 ± 0.7 | 1.00 1.30 | 0.97 1.27 | −3.0 −2.3 |
| 0.253 | 1.10 | 418.6 ± 0.5 | |||||
| 0.408 | 1.31 | 410.0 ± 0.3 | |||||
| 0.762 | 1.58 | 396.5 ± 0.5 | |||||
| 1.00 | 1.70 | 389.9 ± 0.3 | |||||
| 100 | 2.00 | 0.153 | 1.19 | 413.4 ± 0.6 | 1.00 1.30 | 0.99 1.26 | −1.0 −3.1 |
| 0.253 | 1.40 | 404.8 ± 0.4 | |||||
| 0.408 | 1.61 | 395.2 ± 0.2 | |||||
| 0.762 | 1.88 | 380.6 ± 0.2 | |||||
| 1.00 | 2.00 | 374.2 ± 0.2 | |||||
| 1000 | 3.00 | 0.153 | 2.19 | 359.5 ± 0.2 | 2.30 2.70 | 2.28 2.68 | −0.9 −0.7 |
| 0.253 | 2.40 | 349.6 ± 0.1 | |||||
| 0.408 | 2.61 | 339.4 ± 0.1 | |||||
| 0.762 | 2.88 | 324.6 ± 0.1 | |||||
| 1.00 | 3.00 | 318.12 ± 0.1 | |||||
| Sample | ISE | Cuvette Test | |
|---|---|---|---|
| Proposed Flow System | Manual Procedure | ||
| Lake water-1 | 1.43 ± 0.02 | 1.41 | 1.36 ± 0.00 |
| Lake water-2 | 1.37 ± 0.01 | 1.36 | 1.30 ± 0.01 |
| Pond water-1 | 0.55 ± 0.01 | 0.56 | 0.34 ± 0.04 |
| Pond water-2 | 0.56 ± 0.01 | 0.60 | 0.33 ± 0.01 |
| Point | Pumps Activated | Volume Ratio (Standard/Total) | Nominal Standard Dilution | Real Standard Dilution 1 |
|---|---|---|---|---|
| 1. | P3 + P4 + P5 | 0.125 | 0.153 | |
| 2. | P2 + P4 + P6 | 0.250 | 0.253 | |
| 3. | P2 + P3 + P4 | 0.375 | 0.408 | |
| 4. | P1 + P5 + P6 | 0.625 | 0.606 | |
| 5. | P1 + P3 + P5 | 0.750 | 0.762 | |
| 6. | P1 + P2 + P6 | 0.850 | 0.843 | |
| 7. | P1 + P2 + P3 | 1 | 1 |
Disclaimer/Publisher’s Note: The statements, opinions and data contained in all publications are solely those of the individual author(s) and contributor(s) and not of MDPI and/or the editor(s). MDPI and/or the editor(s) disclaim responsibility for any injury to people or property resulting from any ideas, methods, instructions or products referred to in the content. |
© 2023 by the authors. Licensee MDPI, Basel, Switzerland. This article is an open access article distributed under the terms and conditions of the Creative Commons Attribution (CC BY) license (https://creativecommons.org/licenses/by/4.0/).
Share and Cite
Kalinowski, S.; Kościelniak, P.; Wierzbicka, E.; Koronkiewicz, S. A Multi-Pumping Gradient Calibration Module for Potentiometric Determination of Nitrate in Surface Water. Molecules 2023, 28, 493. https://doi.org/10.3390/molecules28020493
Kalinowski S, Kościelniak P, Wierzbicka E, Koronkiewicz S. A Multi-Pumping Gradient Calibration Module for Potentiometric Determination of Nitrate in Surface Water. Molecules. 2023; 28(2):493. https://doi.org/10.3390/molecules28020493
Chicago/Turabian StyleKalinowski, Sławomir, Paweł Kościelniak, Elwira Wierzbicka, and Stanisława Koronkiewicz. 2023. "A Multi-Pumping Gradient Calibration Module for Potentiometric Determination of Nitrate in Surface Water" Molecules 28, no. 2: 493. https://doi.org/10.3390/molecules28020493