
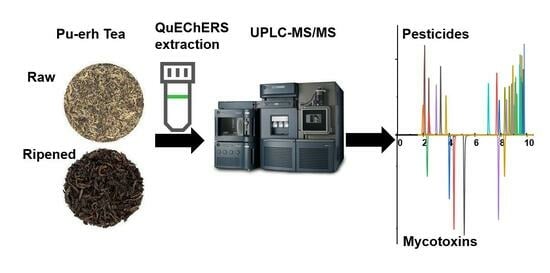
Simultaneous Determination of Pesticide Residues and Mycotoxins in Storage Pu-erh Tea Using Ultra-High-Performance Liquid Chromatography Coupled with Tandem Mass Spectrometry

Abstract
:
1. Introduction
2. Results and Discussion
2.1. Optimization of UPLC-MS/MS Conditions
2.2. Method Validation
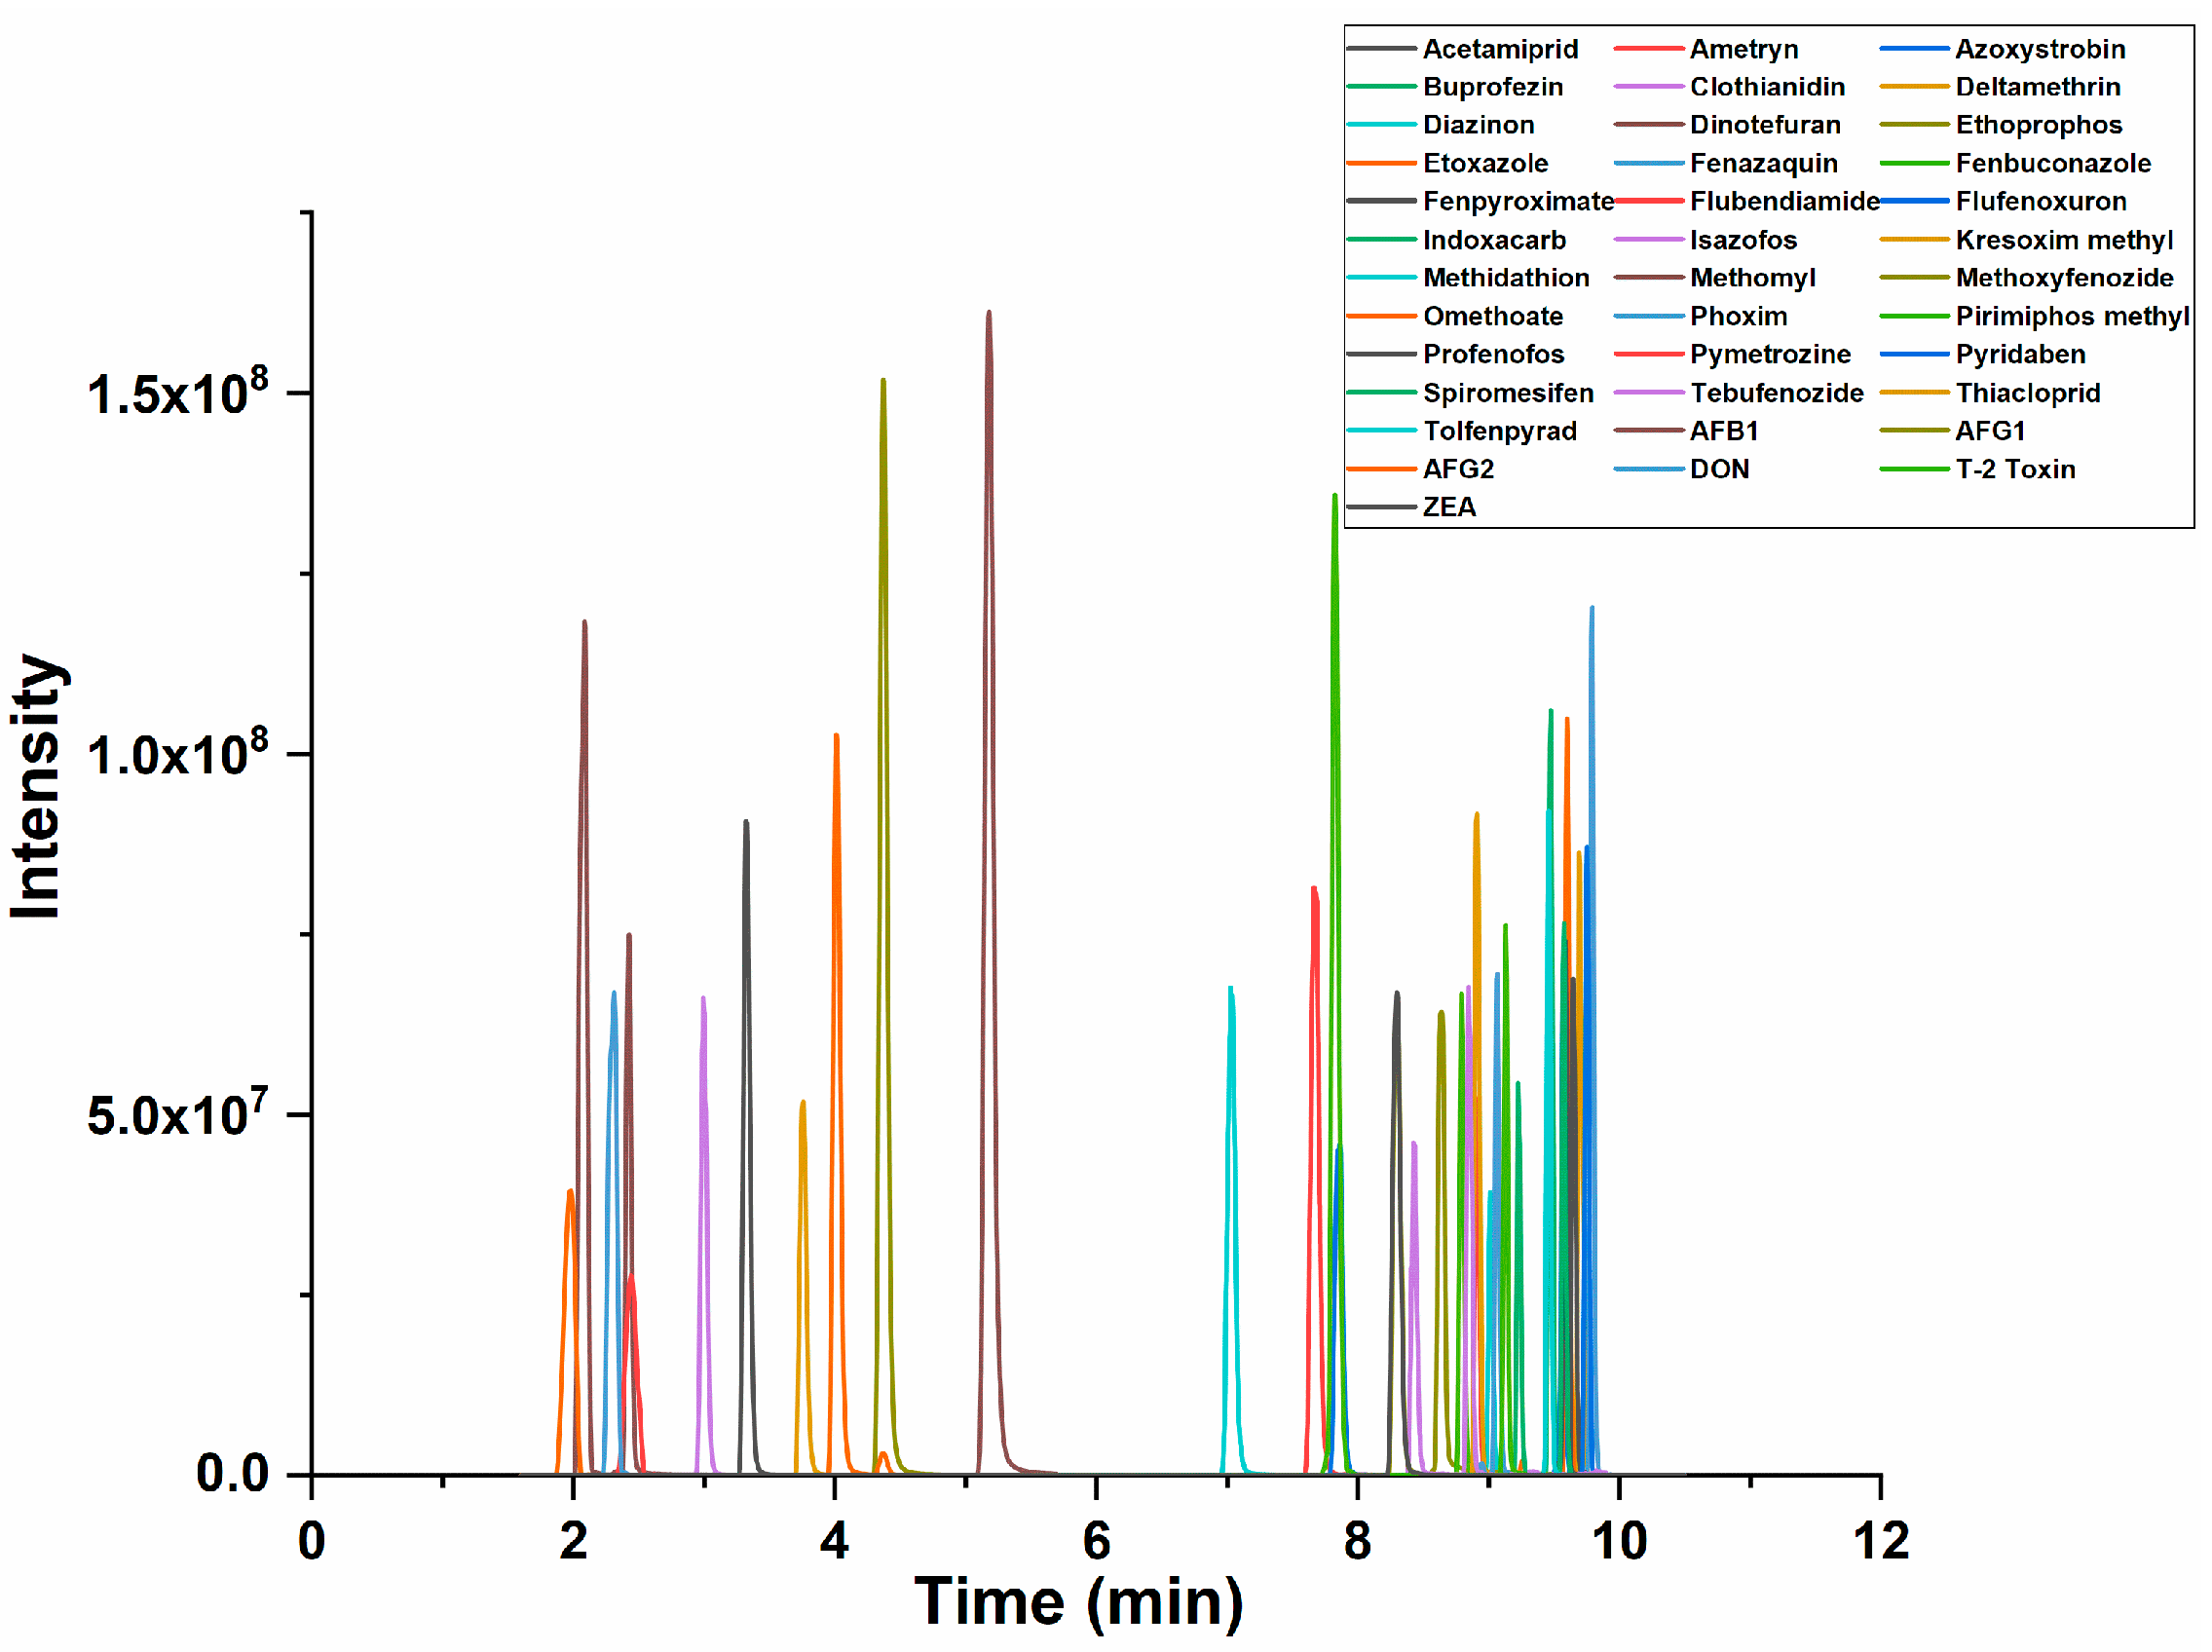
2.2.1. Selectivity
2.2.2. Linearity and LOQ
2.2.3. Intra- and Inter-Day Precision
2.2.4. Matrix Effect and Recovery
2.3. Pu-erh Tea Sample Analysis
3. Materials and Methods
3.1. Samples of Pu-erh Tea
3.2. Chemicals, Materials and Standards
3.3. Preparation of Standard Solutions
3.4. Sample Preparation
3.5. UPLC-MS/MS Analysis
3.6. Identification and Quantification of the Pesticide Residue
3.7. Data Processing
4. Conclusions
Supplementary Materials
Author Contributions
Funding
Institutional Review Board Statement
Informed Consent Statement
Data Availability Statement
Conflicts of Interest
References
- Huang, F.; Wang, S.; Zhao, A.; Zheng, X.; Zhang, Y.; Lei, S.; Ge, K.; Qu, C.; Zhao, Q.; Yan, C.; et al. Pu-erh Tea Regulates Fatty Acid Metabolism in Mice Under High-Fat Diet. Front. Pharmacol. 2019, 10, 63. [Google Scholar] [CrossRef]
- Lu, X.; Liu, J.; Zhang, N.; Fu, Y.; Zhang, Z.; Li, Y.; Wang, W.; Li, Y.; Shen, P.; Cao, Y. Ripened Pu-erh Tea Extract Protects Mice from Obesity by Modulating Gut Microbiota Composition. J. Agric. Food Chem. 2019, 67, 6978–6994. [Google Scholar] [CrossRef]
- Lei, S.; Zhang, Z.; Xie, G.; Zhao, C.; Miao, Y.; Chen, D.; Zhang, G.; Liu, H.; Peng, C.; Hou, Y.; et al. Theabrownin modulates the gut microbiome and serum metabolome in aging mice induced by D-galactose. J. Funct. Foods 2022, 89, 104941. [Google Scholar] [CrossRef]
- Huang, F.; Zheng, X.; Ma, X.; Jiang, R.; Zhou, W.; Zhou, S.; Zhang, Y.; Lei, S.; Wang, S.; Kuang, J.; et al. Theabrownin from Pu-erh tea attenuates hypercholesterolemia via modulation of gut microbiota and bile acid metabolism. Nat. Commun. 2019, 10, 4971. [Google Scholar] [CrossRef]
- Kuang, J.; Zheng, X.; Huang, F.; Wang, S.; Li, M.; Zhao, M.; Sang, C.; Ge, K.; Li, Y.; Li, J.; et al. Anti-adipogenic effect of theabrownin is mediated by bile acid alternative synthesis via gut microbiota remodeling. Metabolites 2020, 10, 475. [Google Scholar] [CrossRef] [PubMed]
- Zhang, H.; Sang, S.; Xu, H.; Piao, L.; Liu, X. Lovastatin suppresses bacterial therapy-induced neutrophil recruitment to the tumor by promoting neutrophil apoptosis. J. Funct. Foods 2021, 86, 104693. [Google Scholar] [CrossRef]
- Hu, S.; Li, S.; Liu, Y.; Sun, K.; Luo, L.; Zeng, L. Aged Ripe Pu-erh Tea Reduced Oxidative Stress-Mediated Inflammation in Dextran Sulfate Sodium-Induced Colitis Mice by Regulating Intestinal Microbes. J. Agric. Food Chem. 2021, 69, 10592–10605. [Google Scholar] [CrossRef] [PubMed]
- Wang, X.; Liu, Q.; Zhu, H.; Wang, H.; Kang, J.; Shen, Z.; Chen, R. Flavanols from the Camellia sinensis var. assamica and their hypoglycemic and hypolipidemic activities. Acta Pharm. Sin. B 2017, 7, 342–346. [Google Scholar] [CrossRef]
- Ding, Q.; Zheng, W.; Zhang, B.; Chen, X.; Zhang, J.; Pang, X.; Zhang, Y.; Jia, D.; Pei, S.; Dong, Y.; et al. Comparison of hypoglycemic effects of ripened pu-erh tea and raw pu-erh tea in streptozotocin-induced diabetic rats. RSC Adv. 2019, 9, 2967–2977. [Google Scholar] [CrossRef]
- Deng, Y.-T.; Lin-Shiau, S.-Y.; Shyur, L.-F.; Lin, J.-K. Pu-erh tea polysaccharides decrease blood sugar by inhibition of α-glucosidase activity in vitro and in mice. Food Funct. 2015, 6, 1539–1546. [Google Scholar] [CrossRef]
- Li, C.; Chai, S.; Ju, Y.; Hou, L.; Zhao, H.; Ma, W.; Li, T.; Sheng, J.; Shi, W. Pu-erh Tea Protects the Nervous System by Inhibiting the Expression of Metabotropic Glutamate Receptor 5. Mol. Neurobiol. 2016, 54, 5286–5299. [Google Scholar] [CrossRef] [PubMed]
- Ma, W.; Shi, Y.; Yang, G.; Shi, J.; Ji, J.; Zhang, Y.; Wang, J.; Peng, Q.; Lin, Z.; Lv, H. Hypolipidaemic and antioxidant effects of various Chinese dark tea extracts obtained from the same raw material and their main chemical components. Food Chem. 2022, 375, 131877. [Google Scholar] [CrossRef]
- Zhou, B.; Ma, B.; Ma, C.; Xu, C.; Wang, J.; Wang, Z.; Yin, D.; Xia, T. Classification of Pu-erh ripened teas and their differences in chemical constituents and antioxidant capacity. LWT 2022, 153, 112370. [Google Scholar] [CrossRef]
- Vu, H.T.; Song, F.V.; Tian, K.V.; Su, H.; Chass, G.A. Systematic characterisation of the structure and radical scavenging potency of Pu’Er tea (普洱茶) polyphenol theaflavin. Org. Biomol. Chem. 2019, 17, 9942–9950. [Google Scholar] [CrossRef] [PubMed]
- Lv, S.; Wu, Y.; Wei, J.; Lian, M.; Wang, C.; Gao, X.; Meng, Q. Application of gas chromatography-mass spectrometry and chemometrics methods for assessing volatile profiles of Pu-erh tea with different processing methods and ageing years. RSC Adv. 2015, 5, 87806–87817. [Google Scholar] [CrossRef]
- Wang, T.; Li, X.; Yang, H.; Wang, F.; Kong, J.; Qiu, D.; Li, Z. Mass spectrometry-based metabolomics and chemometric analysis of Pu-erh teas of various origins. Food Chem. 2018, 268, 271–278. [Google Scholar] [CrossRef]
- Sedova, I.; Kiseleva, M.; Tutelyan, V. Mycotoxins in Tea: Occurrence, Methods of Determination and Risk Evaluation. Toxins 2018, 10, 444. [Google Scholar] [CrossRef]
- Zhou, H.; Yan, Z.; Yu, S.; Wu, A.; Liu, N. Development of a Novel UPLC-MS/MS Method for the Simultaneous Determination of 16 Mycotoxins in Different Tea Categories. Toxins 2022, 14, 169. [Google Scholar] [CrossRef]
- Chen, H.; Wang, Q.; Jiang, Y.; Wang, C.; Yin, P.; Liu, X.; Lu, C. Monitoring and risk assessment of 74 pesticide residues in Pu-erh tea produced in Yunnan, China. Food Addit. Contam. Part B 2015, 8, 56–62. [Google Scholar] [CrossRef]
- Varghese, J.V.; Sebastian, E.M.; Iqbal, T.; Tom, A.A. Pesticide applicators and cancer: A systematic review. Rev. Environ. Health 2021, 36, 467–476. [Google Scholar] [CrossRef]
- Bogdanova, E.; Pugajeva, I.; Reinholds, I.; Bartkevics, V. Two-dimensional liquid chromatography-high resolution mass spectrometry method for simultaneous monitoring of 70 regulated and emerging mycotoxins in Pu-erh tea. J. Chromatogr. A 2020, 1622, 461145. [Google Scholar] [CrossRef] [PubMed]
- Klingelhöfer, D.; Zhu, Y.; Braun, M.; Bendels, M.H.; Brüggmann, D.; Groneberg, D.A. Aflatoxin–Publication analysis of a global health threat. Food Control 2018, 89, 280–290. [Google Scholar] [CrossRef]
- Pallarés, N.; Font, G.; Mañes, J.; Ferrer, E. Multimycotoxin LC–MS/MS Analysis in Tea Beverages after Dispersive Liquid–Liquid Microextraction (DLLME). J. Agric. Food Chem. 2017, 65, 10282–10289. [Google Scholar] [CrossRef]
- Ye, Z.; Wang, X.; Fu, R.; Yan, H.; Han, S.; Gerelt, K.; Cui, P.; Chen, J.; Qi, K.; Zhou, Y. Determination of six groups of mycotoxins in Chinese dark tea and the associated risk assessment. Environ. Pollut. 2020, 261, 114180. [Google Scholar] [CrossRef] [PubMed]
- Huang, Y.; Shi, T.; Luo, X.; Xiong, H.; Min, F.; Chen, Y.; Nie, S.; Xie, M. Determination of multi-pesticide residues in green tea with a modified QuEChERS protocol coupled to HPLC-MS/MS. Food Chem. 2019, 275, 255–264. [Google Scholar] [CrossRef] [PubMed]
- Miró-Abella, E.; Herrero, P.; Canela, N.; Arola, L.; Borrull, F.; Ras, R.; Fontanals, N. Determination of mycotoxins in plant-based beverages using QuEChERS and liquid chromatography–tandem mass spectrometry. Food Chem. 2017, 229, 366–372. [Google Scholar] [CrossRef] [PubMed]
- Zhu, B.; Xu, X.; Luo, J.; Jin, S.; Chen, W.; Liu, Z.; Tian, C. Simultaneous determination of 131 pesticides in tea by on-line GPC-GC–MS/MS using graphitized multi-walled carbon nanotubes as dispersive solid phase extraction sorbent. Food Chem. 2019, 276, 202–208. [Google Scholar] [CrossRef]
- Hu, S.; Zhao, M.; Mao, Q.; Fang, C.; Chen, D.; Yan, P. Rapid one-step cleanup method to minimize matrix effects for residue analysis of alkaline pesticides in tea using liquid chromatography–high resolution mass spectrometry. Food Chem. 2019, 299, 125146. [Google Scholar] [CrossRef]
- Chen, G.; Cao, P.; Liu, R. A multi-residue method for fast determination of pesticides in tea by ultra performance liquid chromatography–electrospray tandem mass spectrometry combined with modified QuEChERS sample preparation procedure. Food Chem. 2011, 125, 1406–1411. [Google Scholar] [CrossRef]
- Waris, K.H.; Lee, V.S.; Mohamad, S. Pesticide remediation with cyclodextrins: A review. Environ. Sci. Pollut. Res. 2021, 28, 47785–47799. [Google Scholar] [CrossRef]
- Hidalgo-Ruiz, J.L.; Romero-González, R.; Vidal, J.L.M.; Frenich, A.G. A rapid method for the determination of mycotoxins in edible vegetable oils by ultra-high performance liquid chromatography-tandem mass spectrometry. Food Chem. 2019, 288, 22–28. [Google Scholar] [CrossRef] [PubMed]
- Huang, Z.; Zhang, Y.; Wang, L.; Ding, L.; Wang, M.; Yan, H.; Li, Y.; Zhu, S. Simultaneous determination of 103 pesticide residues in tea samples by LC-MS/MS. J. Sep. Sci. 2009, 32, 1294–1301. [Google Scholar] [CrossRef] [PubMed]
- Solfrizzo, M.; Gambacorta, L.; Bibi, R.; Ciriaci, M.; Paoloni, A.; Pecorelli, I. Multimycotoxin Analysis by LC-MS/MS in Cereal Food and Feed: Comparison of Different Approaches for Extraction, Purification, and Calibration. J. AOAC Int. 2018, 101, 647–657. [Google Scholar] [CrossRef] [PubMed]
- Rasmussen, R.R.; Storm, I.M.L.D.; Rasmussen, P.H.; Smedsgaard, J.; Nielsen, K.F. Multi-mycotoxin analysis of maize silage by LC-MS/MS. Anal. Bioanal. Chem. 2010, 397, 765–776. [Google Scholar] [CrossRef] [PubMed]
- Gosetti, F.; Mazzucco, E.; Zampieri, D.; Gennaro, M.C. Signal suppression/enhancement in high-performance liquid chromatography tandem mass spectrometry. J. Chromatogr. A 2010, 1217, 3929–3937. [Google Scholar] [CrossRef]
- European Union. Commission Regulation (EC) No 401/2006 of 23 February 2006 laying down the methods of sampling and analysis for the official control of the levels of mycotoxins in foodstuffs. Off. J. Eur. Union 2006, 24, 1–42. [Google Scholar]
- Kaaya, A.N.; Kyamuhangire, W. The effect of storage time and agroecological zone on mould incidence and aflatoxin contamination of maize from traders in Uganda. Int. J. Food Microbiol. 2006, 110, 217–223. [Google Scholar] [CrossRef]
- Mo, H.Z.; Zhang, H.; Wu, Q.H.; Bin Hu, L. Inhibitory effects of tea extract on aflatoxin production by Aspergillus flavus. Lett. Appl. Microbiol. 2013, 56, 462–466. [Google Scholar] [CrossRef]
- Zhao, X.; Zhi, Q.-Q.; Li, J.-Y.; Keller, N.P.; He, Z.-M. The Antioxidant Gallic Acid Inhibits Aflatoxin Formation in Aspergillus flavus by Modulating Transcription Factors FarB and CreA. Toxins 2018, 10, 270. [Google Scholar] [CrossRef]
- Pinto, A.C.S.M.; De Pierri, C.R.; Evangelista, A.G.; Gomes, A.S.d.L.P.B.; Luciano, F.B. Deoxynivalenol: Toxicology, Degradation by Bacteria, and Phylogenetic Analysis. Toxins 2022, 14, 90. [Google Scholar] [CrossRef]
- Ramirez, M.L.; Chulze, S.; Magan, N. Impact of environmental factors and fungicides on growth and deoxinivalenol production by Fusarium graminearum isolates from Argentinian wheat. Crop Prot. 2004, 23, 117–125. [Google Scholar] [CrossRef]
- Sobrova, P.; Adam, V.; Vasatkova, A.; Beklova, M.; Zeman, L.; Kizek, R. Deoxynivalenol and its toxicity. Interdiscip. Toxicol. 2010, 3, 94–99. [Google Scholar] [CrossRef] [PubMed]
- Zhao, M.; Su, X.Q.; Nian, B.; Chen, L.J.; Zhang, D.L.; Duan, S.M.; Wang, L.Y.; Shi, X.Y.; Jiang, B.; Jiang, W.W.; et al. Integrated Meta-omics Approaches To Understand the Microbiome of Spontaneous Fermentation of Traditional Chinese Pu-erh Tea. mSystems 2019, 4, e00680-19. [Google Scholar] [CrossRef] [PubMed]


| Type of Analytes | Compounds | ESI mode | RT (min) | Precursor Ion (m/z) | Cone (V) | Quantification Ion | Qualification Ion | Linearity | Linear Range | LOQ | MRL | ||
|---|---|---|---|---|---|---|---|---|---|---|---|---|---|
| CE (eV) | Product (m/z) | CE (eV) | Product (m/z) | r2 | (ppb) | ||||||||
| Pesticide | Acetamiprid | + | 3.3 | 223.2 | 25 | 20 | 56.0 | 15 | 126.0 | 0.997 | 0.13–100 | 0.13 | 10 a |
| Ametryn | + | 7.7 | 228.2 | 25 | 20 | 68.0 | 15 | 186.0 | 0.998 | 1–1000 | 1 | 50 a | |
| Azoxystrobin | + | 7.8 | 404.0 | 25 | 15 | 344.1 | 14 | 372.0 | 0.994 | 5–1000 | 5 | 10 a | |
| Buprofezin | + | 9.5 | 306.2 | 30 | 16 | 116.1 | 12 | 201.0 | 0.998 | 0.25–1000 | 0.25 | 10 a | |
| Clothianidin | + | 3.0 | 250.2 | 30 | 15 | 132.0 | 10 | 169.1 | 0.997 | 0.13–100 | 0.13 | 10 a | |
| Deltamethrin | + | 9.7 | 505.9 | 35 | 17 | 280.9 | 15 | 328.3 | 0.997 | 5–1000 | 5 | 10 a | |
| Diazinon | + | 9.0 | 305.0 | 25 | 20 | 153.2 | 15 | 169.1 | 0.999 | 0.13–100 | 0.13 | 10 a | |
| Dinotefuran | + | 2.1 | 203.1 | 30 | 10 | 113.0 | 10 | 129.2 | 0.996 | 0.13–100 | 0.13 | 20 a | |
| Ethoprophos | + | 8.6 | 243.1 | 33 | 19 | 130.9 | 27 | 97.0 | 0.996 | 0.06–1001 | 0.06 | 10 a | |
| Etoxazole | + | 9.6 | 360.2 | 55 | 55 | 113.1 | 30 | 141.0 | 0.996 | 0.25–1000 | 0.25 | 10 a | |
| Fenazaquin | + | 9.8 | 307.2 | 25 | 15 | 57.1 | 14 | 161.2 | 0.995 | 5–1000 | 5 | 300 a | |
| Fenbuconazole | + | 8.8 | 337.1 | 35 | 17 | 70.0 | 15 | 125.0 | 0.993 | 0.25–1000 | 0.25 | 10 a | |
| Fenpyroximate | + | 9.7 | 422.0 | 42 | 33 | 138.1 | 13 | 366.0 | 0.993 | 10–1000 | 10 | 50 a | |
| Flubendiamide | + | 8.9 | 683.0 | 25 | 20 | 273.9 | 13 | 408.0 | 0.996 | 10–1000 | 10 | 10 a | |
| Flufenoxuron | + | 9.6 | 489.0 | 25 | 20 | 141.1 | 15 | 158.1 | 0.994 | 10–1000 | 10 | 10 a | |
| Indoxacarb | + | 9.2 | 528.0 | 25 | 23 | 150.0 | 15 | 218.0 | 0.996 | 1–1000 | 1 | 20 a | |
| Isazofos | + | 8.4 | 314.1 | 25 | 15 | 120.0 | 8 | 162.1 | 0.994 | 0.25–100 | 0.25 | 10 a | |
| Kresoxim methyl | + | 8.9 | 314.1 | 15 | 15 | 222.2 | 14 | 235.0 | 0.998 | 0.25–100 | 0.25 | 10 a | |
| Methidathion | + | 7.0 | 303.0 | 15 | 20 | 85.0 | 15 | 145.1 | 0.991 | 0.5–100 | 0.5 | 1 a | |
| Methomyl | + | 2.4 | 163.2 | 20 | 8 | 88.0 | 8 | 103.0 | 0.996 | 0.13–100 | 0.13 | 20 a | |
| Methoxyfenozide | + | 8.3 | 313.0 | 25 | 15 | 133.0 | 14 | 149.0 | 0.998 | 0.5–100 | 0.5 | 20 a | |
| Omethoate | + | 2.0 | 214.1 | 15 | 15 | 183.0 | 11 | 196.0 | 0.998 | 0.25–100 | 0.25 | 10 a | |
| Phoxim | + | 9.1 | 299.0 | 25 | 15 | 77.0 | 14 | 129.0 | 0.995 | 0.13–100 | 0.13 | 50 a | |
| Pirimiphos methyl | + | 9.1 | 306.2 | 25 | 20 | 108.1 | 15 | 164.0 | 0.993 | 0.5–100 | 0.5 | 10 a | |
| Profenofos | + | 9.4 | 372.9 | 25 | 15 | 302.7 | 14 | 344.9 | 0.993 | 5–1000 | 5 | 10 a | |
| Pymetrozine | + | 2.5 | 218.0 | 30 | 17 | 105.0 | 15 | 107.0 | 0.997 | 0.13–100 | 0.13 | 20 a | |
| Pyridaben | + | 9.8 | 365.1 | 38 | 24 | 147.0 | 11 | 309.1 | 0.996 | 1–1000 | 1 | 100 a | |
| Spiromesifen | + | 9.6 | 393.0 | 45 | 17 | 295.2 | 15 | 303.3 | 0.991 | 0.5–100 | 0.5 | 15 a | |
| Tebufenozide | + | 8.9 | 353.2 | 30 | 10 | 133.1 | 20 | 105.1 | 0.998 | 0.25–100 | 0.25 | 10 a | |
| Thiacloprid | + | 3.8 | 253.1 | 45 | 21 | 126.0 | 36 | 90.0 | 0.993 | 0.13–100 | 0.13 | 20 a | |
| Tolfenpyrad | + | 9.5 | 384.2 | 25 | 29 | 171.1 | 15 | 197.0 | 0.992 | 10–1000 | 10 | 10 a | |
| Mycotoxin | AFB1 | + | 5.2 | 313.1 | 40 | 25 | 285.3 | 30 | 241.8 | 0.995 | 0.5–100 | 0.5 | 5 b |
| AFG1 | + | 4.4 | 329.1 | 40 | 30 | 243.4 | 30 | 215.0 | 0.999 | 0.5–100 | 0.5 | 5 b | |
| AFG2 | + | 4.0 | 331.1 | 40 | 30 | 245.4 | 35 | 189.4 | 0.999 | 0.5–100 | 0.5 | 5 b | |
| DON | + | 2.3 | 297.1 | 40 | 15 | 203.5 | 15 | 231.4 | 0.995 | 50–1000 | 50 | 1000 b | |
| T-2 Toxin | + | 7.8 | 467.3 | 40 | 10 | 305.5 | 10 | 245.5 | 0.991 | 50–1000 | 50 | 200 c | |
| ZEA | - | 8.3 | 317.2 | 40 | 25 | 175.2 | 30 | 131.0 | 0.994 | 10–1000 | 10 | 60 b | |
| Type of Analytes | Compounds | Repeatability (RSD %) | Spiking Level | |||||||||
|---|---|---|---|---|---|---|---|---|---|---|---|---|
| Low | Medium | High | ||||||||||
| Intra-Day | Inter-Day | Recovery (%) | RSD (n = 6) | Matrix Effects | Recovery (%) | RSD (n = 6) | Matrix Effects | Recovery (%) | RSD (n = 6) | Matrix Effects | ||
| Pesticide | Acetamiprid | 7.4 | 12.3 | 73.5 | 8.5 | 0.1 | 85.5 | 8.6 | 1.0 | 111.3 | 18.8 | −5.0 |
| Ametryn | 7.6 | 8.8 | 94.1 | 22.6 | 11.0 | 87.2 | 8.3 | 10.0 | 87.7 | 5.7 | −1.0 | |
| Azoxystrobin | 7.8 | 11.1 | 85 | 5.4 | −4.0 | 92.9 | 10.5 | −1.0 | 89.4 | 13.9 | −3.0 | |
| Buprofezin | 8.6 | 7.5 | 91.4 | 10.9 | 4.0 | 94.7 | 4.8 | 3.0 | 77.5 | 9.3 | −7.0 | |
| Clothianidin | 5.3 | 12.0 | 85.4 | 20.1 | 28.0 | 75.8 | 10.1 | 20.0 | 74.8 | 17.2 | 2.0 | |
| Deltamethrin | 2.8 | 6.4 | 94.1 | 4.1 | 11.0 | 89.7 | 7 | 11.0 | 83 | 5.1 | −15.0 | |
| Diazinon | 5.9 | 3.2 | 97.7 | 3.4 | −1.0 | 100.2 | 11.1 | 0.0 | 80.4 | 7.1 | −5.0 | |
| Dinotefuran | 2.8 | 6.4 | 114.4 | 26.1 | 7.0 | 106 | 12.8 | 6.0 | 84.5 | 11.1 | 4.0 | |
| Ethoprophos | 2.5 | 3.5 | 94.2 | 4.2 | 3.0 | 103.5 | 9.2 | 1.0 | 93.7 | 5.4 | −3.0 | |
| Etoxazole | 7.3 | 7.9 | 104.4 | 17.6 | 5.0 | 96.8 | 14.2 | 1.0 | 97.8 | 16 | −10.0 | |
| Fenazaquin | 10.5 | 13.9 | 97.5 | 1.9 | −9.0 | 94.8 | 10.5 | 5.0 | 110.5 | 5.6 | −22.0 | |
| Fenbuconazole | 3.2 | 7.4 | 101.6 | 5.7 | 0.0 | 105.6 | 10.4 | 0.0 | 84.1 | 10.6 | −3.0 | |
| Fenpyroximate | 4.7 | 6.9 | 130.3 | 4.8 | −32.0 | 129 | 10.7 | −10.0 | 92.7 | 18.6 | −22.0 | |
| Flubendiamide | 8.4 | 5.6 | 124.5 | 8.9 | −30.0 | 114.6 | 9.2 | −34.0 | 82 | 4.4 | −4.0 | |
| Flufenoxuron | 5.0 | 8.3 | 105.1 | 0.6 | −13.0 | 93.2 | 2.6 | 17.0 | 102.5 | 3.4 | −14.0 | |
| Indoxacarb | 8.6 | 6.6 | 111 | 8.3 | −29.0 | 112 | 4.6 | −13.0 | 90.7 | 17.8 | −4.0 | |
| Isazofos | 4.3 | 5.2 | 95.5 | 6.2 | −6.0 | 100.5 | 7.8 | 0.0 | 96.7 | 0.8 | −3.0 | |
| Kresoxim methyl | 1.8 | 8.6 | 94.1 | 3.5 | −18.0 | 102.9 | 13 | −15.0 | 98.6 | 11 | 1.0 | |
| Methidathion | 1.2 | 11.2 | 99.2 | 2.3 | −10.0 | 100.1 | 12.7 | −7.0 | 95.5 | 2.6 | −3.0 | |
| Methomyl | 2.5 | 7.6 | 88.6 | 3.2 | 6.3 | 100 | 12.4 | 4.7 | 94.4 | 9.8 | 2.0 | |
| Methoxyfenozide | 4.4 | 2.5 | 95.1 | 4.2 | −10.0 | 106.6 | 10.1 | −3.0 | 82.8 | 1.4 | −5.0 | |
| Omethoate | 1.9 | 7.9 | 87.4 | 6.1 | 4.0 | 92.4 | 9.8 | 5.0 | 79.5 | 2.7 | 0.0 | |
| Phoxim | 3.6 | 7.1 | 102.2 | 6.6 | −25.0 | 98.8 | 1.1 | −6.0 | 94.7 | 12.8 | −22.0 | |
| Pirimiphos methyl | 6.1 | 6.5 | 114.5 | 1.2 | −16.0 | 106.7 | 12.1 | −6.0 | 107.3 | 12.8 | −5.0 | |
| Profenofos | 9.0 | 6.0 | 104 | 1.9 | −31.0 | 103.9 | 14.5 | 2.0 | 96.4 | 14.2 | −17.0 | |
| Pyridaben | 5.5 | 13.5 | 81.0 | 8.4 | 23.0 | 82.7 | 14.1 | 15.0 | 88 | 15.5 | −5.0 | |
| Pyriproxyfen | 8.6 | 6.7 | 112.9 | 4.2 | 2.0 | 99.1 | 11.9 | 0.0 | 95.3 | 12.9 | −3.0 | |
| Spiromesifen | 3.4 | 6.4 | 89.8 | 7.9 | 14.0 | 100.5 | 10.1 | 3.0 | 99.2 | 19.7 | −4.0 | |
| Tebufenozide | 3.9 | 7.5 | 90.5 | 6.5 | 0.0 | 104.9 | 10.9 | 1.0 | 97.5 | 1.5 | −1.0 | |
| Thiacloprid | 2.4 | 12.3 | 99.4 | 16.8 | 10.0 | 92.5 | 12.8 | 5.0 | 97.4 | 19.8 | −2.0 | |
| Tolfenpyrad | 5.4 | 8.0 | 102.7 | 1.7 | −8.0 | 109 | 9.7 | −5.0 | 101.7 | 16.5 | −14.0 | |
| Mycotoxin | AFB1 | 5.2 | 12.8 | 112.9 | 14.2 | −43.3 | 100.9 | 9.5 | −41.1 | 112.7 | 3.3 | −41.1 |
| AFG1 | 2.1 | 13.8 | 110.3 | 0.2 | −40.2 | 108.9 | 0.6 | −43.8 | 113.2 | 4.3 | −47.7 | |
| AFG2 | 2.6 | 12.8 | 96.8 | 0.2 | −29.9 | 107.9 | 11.1 | −42.4 | 101.2 | 5.6 | −44.2 | |
| DON | 6.9 | 13.9 | 79.2 | 12.9 | 14.3 | 62 | 10.6 | −12.3 | 65.8 | 17.4 | −16.5 | |
| T-2 Toxin | 1.4 | 13.2 | 91.3 | 7.8 | −1.3 | 70.6 | 11.7 | 2.8 | 83.6 | 12.2 | −13.7 | |
| ZEA | 7.1 | 4.7 | 113.7 | 4.3 | −39.8 | 121.8 | 2 | −2.1 | 91.7 | 9.1 | −7.3 | |
| Brand | Year of Production | Type | Storage Duration | Origin (Yunnan Province) | AFB1 | AFG1 | AFG2 | T-2 Toxin | DON |
|---|---|---|---|---|---|---|---|---|---|
| Bu Lang Shan | 2021 | Raw | 1 | Bulang mountain | ND | ND | ND | ND | 61.8 |
| Mi Di | 2021 | Raw | 1 | Mojiang County | ND | ND | ND | ND | 54.9 |
| Bu Lang Shan | 2020 | Raw | 2 | Bulang mountain | ND | ND | ND | ND | 55.1 |
| Nan Nuo | 2020 | Raw | 2 | Nannuo mountain | ND | ND | ND | ND | 56.5 |
| Meng Song | 2020 | Raw | 2 | Mengsong | ND | ND | ND | ND | 55.5 |
| Bu Lang Shan | 2016 | Raw | 6 | Bulang mountain | ND | ND | ND | ND | 40.5 |
| Wang Rui | 2015 | Raw | 7 | Unknown | ND | ND | ND | ND | ND |
| Bu Lang Shan | 2011 | Raw | 11 | Bulang mountain | ND | ND | ND | ND | ND |
| Gu Dong Bing | 2010 | Raw | 12 | Unknown | ND | ND | ND | ND | 33.8 |
| Yong Nian Jiu Jiu | 2005 | Raw | 17 | Yunxian country of Lincang City | ND | ND | ND | 42.6 | ND |
| Bu Lang Shan | 2004 | Raw | 18 | Bulang mountain | ND | ND | ND | ND | ND |
| Yi Wu | 2001 | Raw | 21 | Yiwu | ND | ND | ND | ND | ND |
| 1999 Yi Chang Hao | 1999 | Raw | 23 | Unknown | ND | ND | ND | ND | ND |
| 7582 Qing Cake | 1995 | Raw | 27 | Menghai County | ND | ND | ND | ND | ND |
| Zhu Tea | 1992 | Raw | 30 | Menghai County | ND | 0.4 | 0.4 | ND | ND |
| Yi Wu | 1992 | Raw | 30 | Yi Wu | ND | 0.2 | 0.2 | ND | ND |
| 88 Qing Cake | 1989 | Raw | 33 | Menghai County | ND | ND | ND | ND | ND |
| 8582 Qing Cake | 1985 | Raw | 37 | Unknown | ND | ND | ND | ND | ND |
| 8582 Bozhi | 1980 | Raw | 42 | Menghai County | 0.5 | 0.3 | 0.5 | ND | ND |
| Wu Zhi Hong Yin | 1950 | Raw | 72 | Menghai County | 0.5 | 0.1 | 0.3 | ND | ND |
| Da Hong Yin | 1950 | Raw | 72 | Unknown | ND | ND | ND | ND | ND |
| Jing Chang Hao | 1920 | Raw | 102 | Jiang Cheng | 0.8 | 0.1 | 0.5 | ND | ND |
| Song Pin Hao | 1900 | Raw | 122 | Unknown | ND | ND | ND | ND | ND |
| Yi Run | 2020 | Ripened | 2 | Unknown | ND | ND | ND | 28.0 | ND |
| Bu Lang Shan | 2020 | Ripened | 2 | Bulang mountain | ND | ND | ND | ND | ND |
| Nan Nuo | 2020 | Ripened | 2 | Nannuo mountain | ND | ND | ND | ND | ND |
| Meng Song | 2020 | Ripened | 2 | Mengsong | ND | ND | ND | ND | ND |
| Bang Dong | 2020 | Ripened | 2 | Bangdong Village | ND | ND | ND | 50.3 | ND |
| Jing Mai | 2020 | Ripened | 2 | Jing Mai | ND | ND | ND | ND | ND |
| Lin Cang Yun Xian | 2021 | Ripened | 1 | Yunxian country of Lincang City | ND | ND | ND | ND | ND |
| Gong Ming | 2005 | Ripened | 17 | Dian Lake | ND | ND | ND | 25.4 | ND |
Disclaimer/Publisher’s Note: The statements, opinions and data contained in all publications are solely those of the individual author(s) and contributor(s) and not of MDPI and/or the editor(s). MDPI and/or the editor(s) disclaim responsibility for any injury to people or property resulting from any ideas, methods, instructions or products referred to in the content. |
© 2023 by the authors. Licensee MDPI, Basel, Switzerland. This article is an open access article distributed under the terms and conditions of the Creative Commons Attribution (CC BY) license (https://creativecommons.org/licenses/by/4.0/).
Share and Cite
Chau, S.L.; Zhao, A.; Jia, W.; Wang, L. Simultaneous Determination of Pesticide Residues and Mycotoxins in Storage Pu-erh Tea Using Ultra-High-Performance Liquid Chromatography Coupled with Tandem Mass Spectrometry. Molecules 2023, 28, 6883. https://doi.org/10.3390/molecules28196883
Chau SL, Zhao A, Jia W, Wang L. Simultaneous Determination of Pesticide Residues and Mycotoxins in Storage Pu-erh Tea Using Ultra-High-Performance Liquid Chromatography Coupled with Tandem Mass Spectrometry. Molecules. 2023; 28(19):6883. https://doi.org/10.3390/molecules28196883
Chicago/Turabian StyleChau, Siu Leung, Aihua Zhao, Wei Jia, and Lu Wang. 2023. "Simultaneous Determination of Pesticide Residues and Mycotoxins in Storage Pu-erh Tea Using Ultra-High-Performance Liquid Chromatography Coupled with Tandem Mass Spectrometry" Molecules 28, no. 19: 6883. https://doi.org/10.3390/molecules28196883