
Discovery of Novel Mono-Carbonyl Curcumin Derivatives as Potential Anti-Hepatoma Agents
 ,
,
Abstract
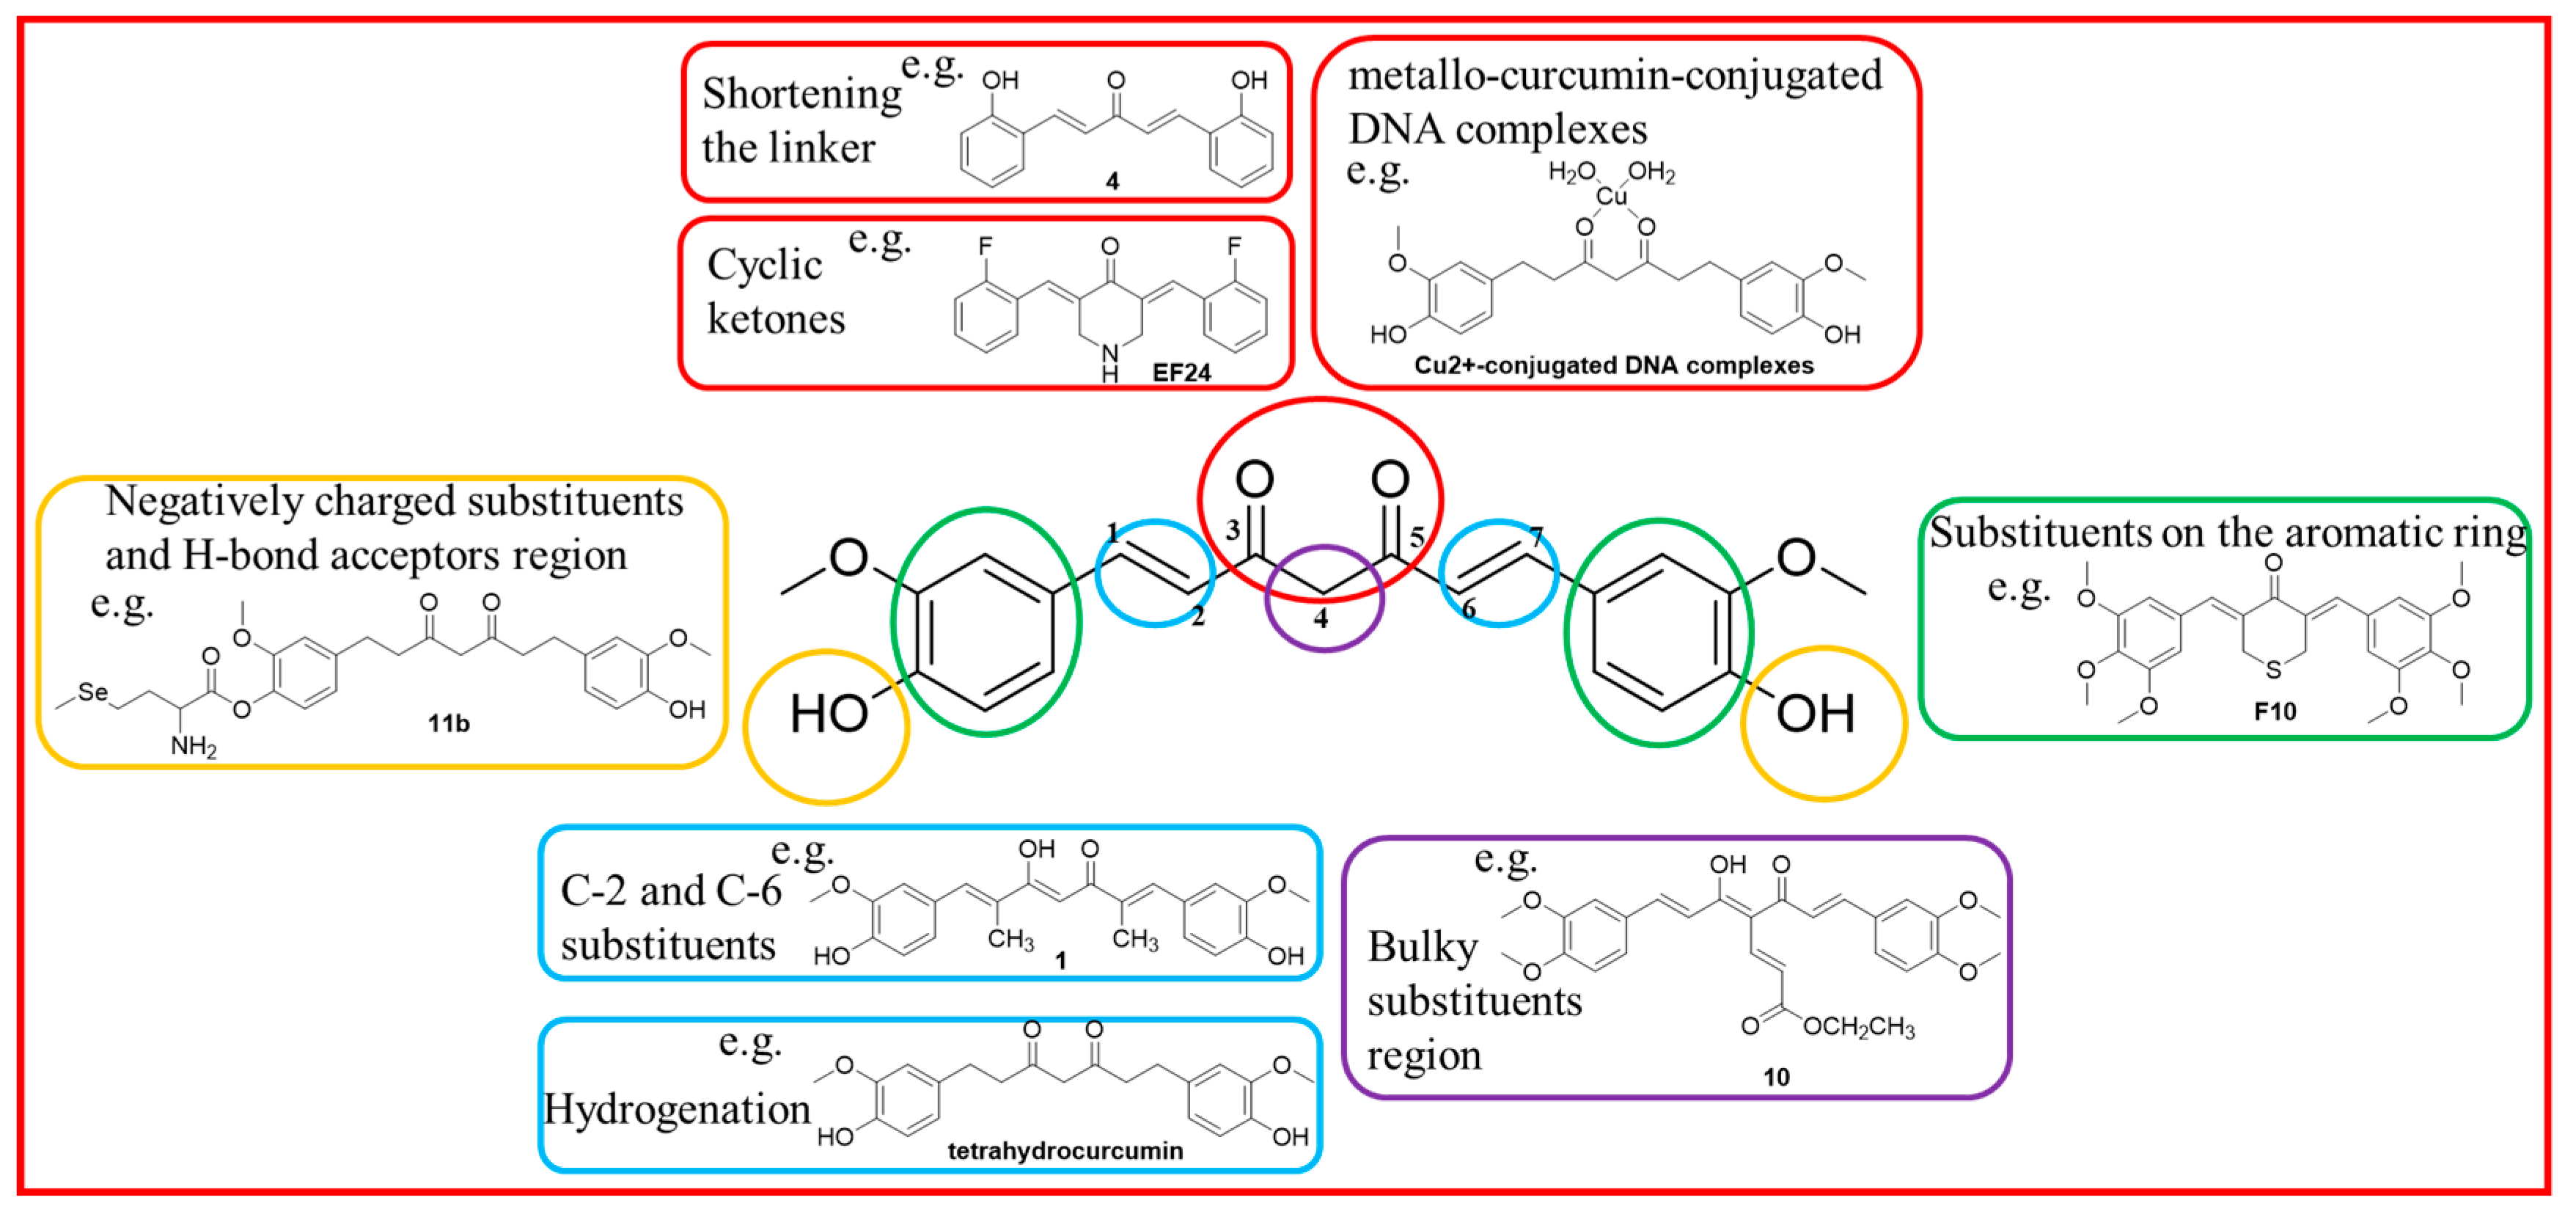
:1. Introduction
2. Materials and Methods
2.1. Chemistry
2.1.1. General
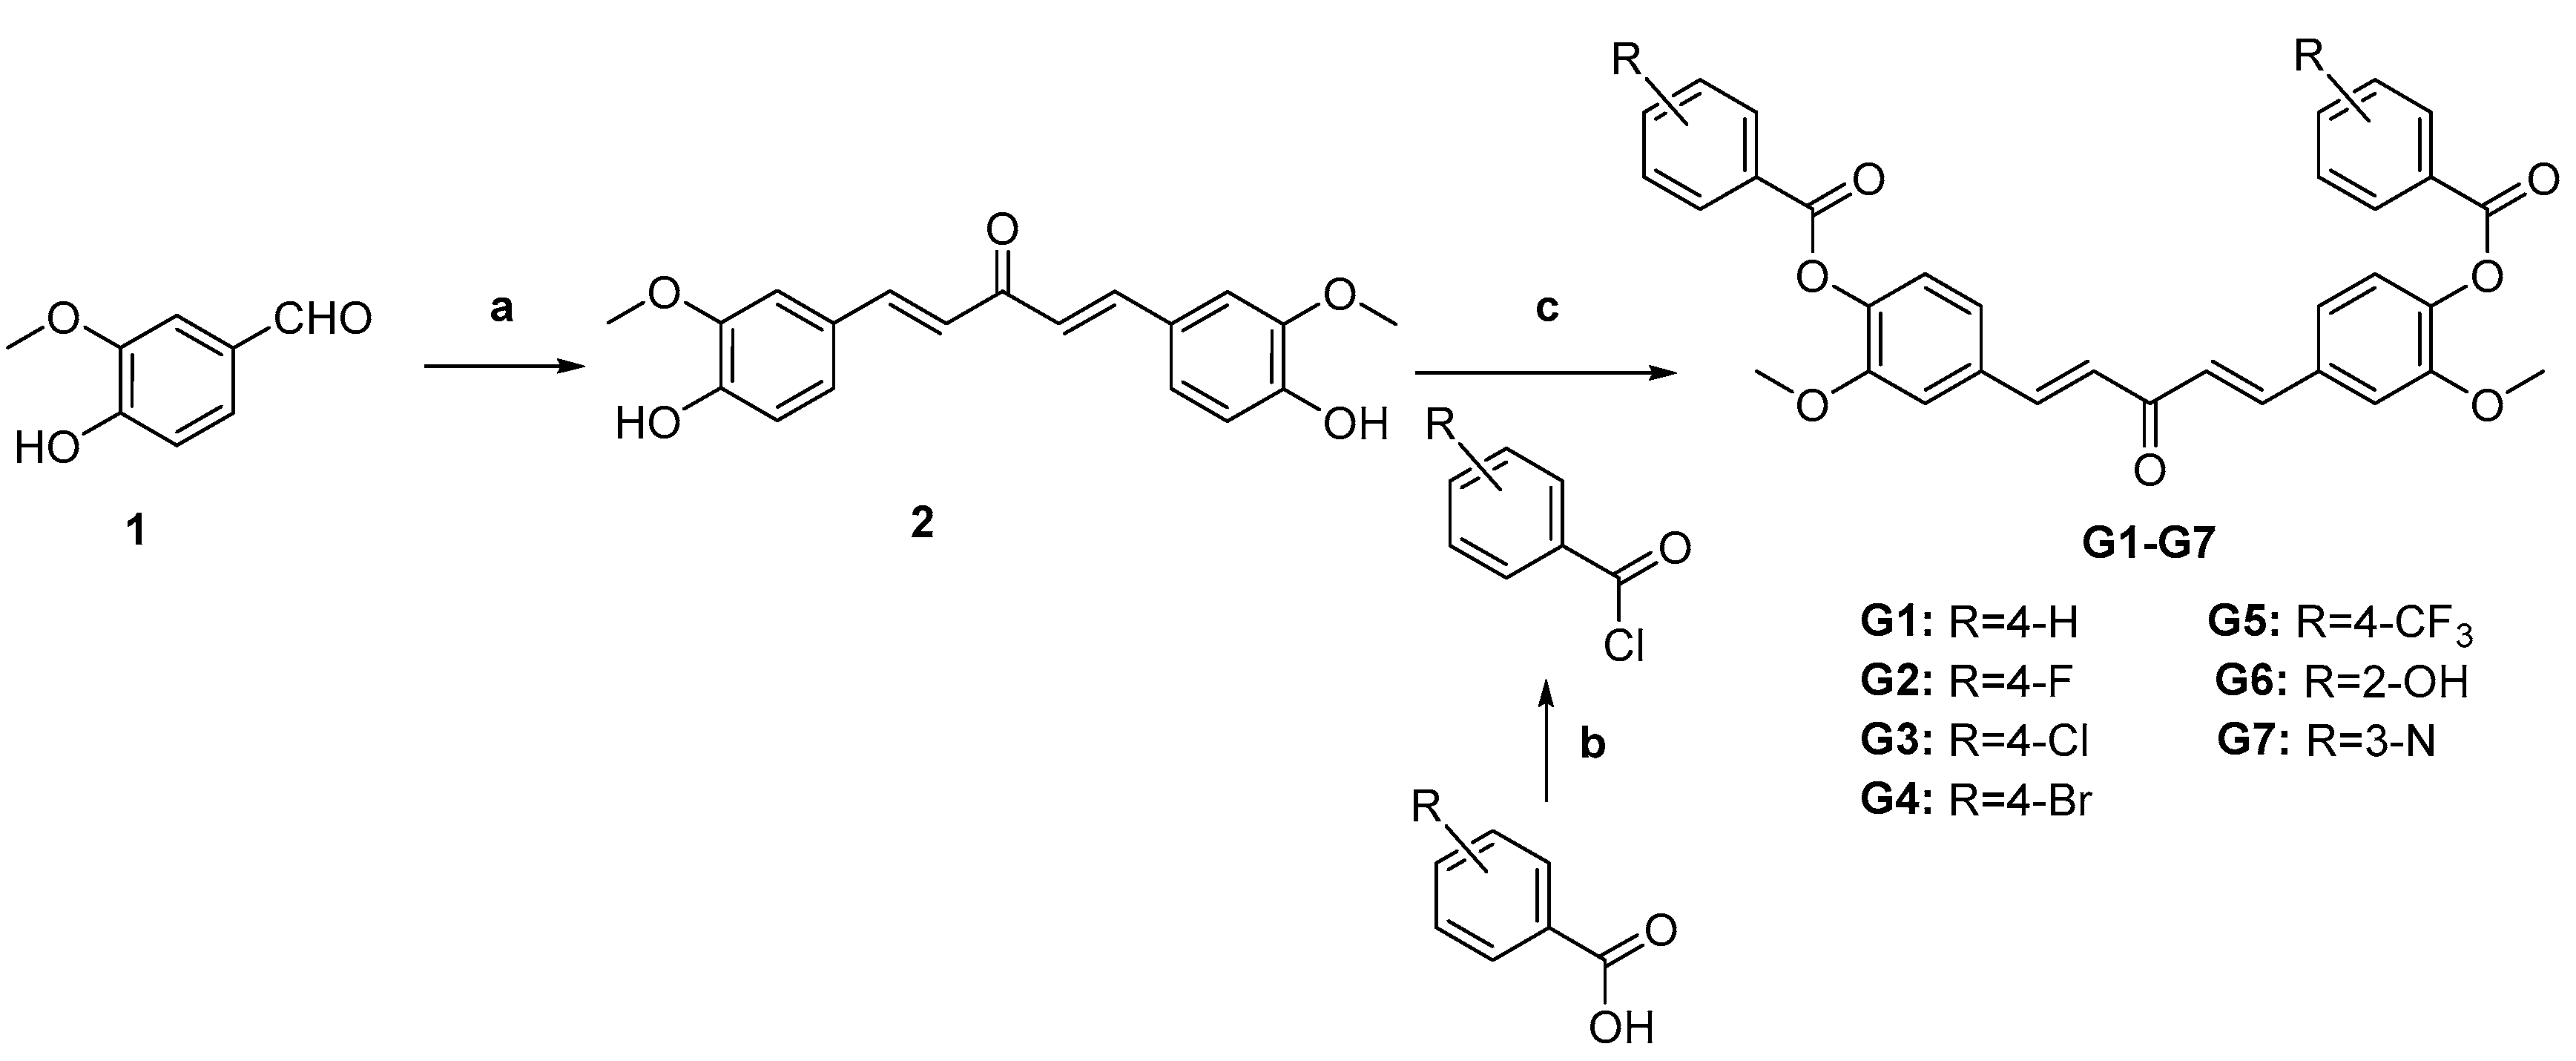
2.1.2. Preparation of Curcumin Derivatives G1–G7
2.1.3. Molecular Docking Studies
2.2. Biological Assays
2.2.1. Cell Culture
2.2.2. MTT Assay
2.2.3. Clone Formation Assay
2.2.4. Wound Healing Assay
2.2.5. Transwell Migration Assay
2.2.6. Mitochondrial Membrane Potential Assay
2.2.7. Western Blot Analysis
2.2.8. Xenograft Model and In Vivo Study
2.2.9. H&E Staining Analysis
3. Results and Discussion
3.1. Chemistry
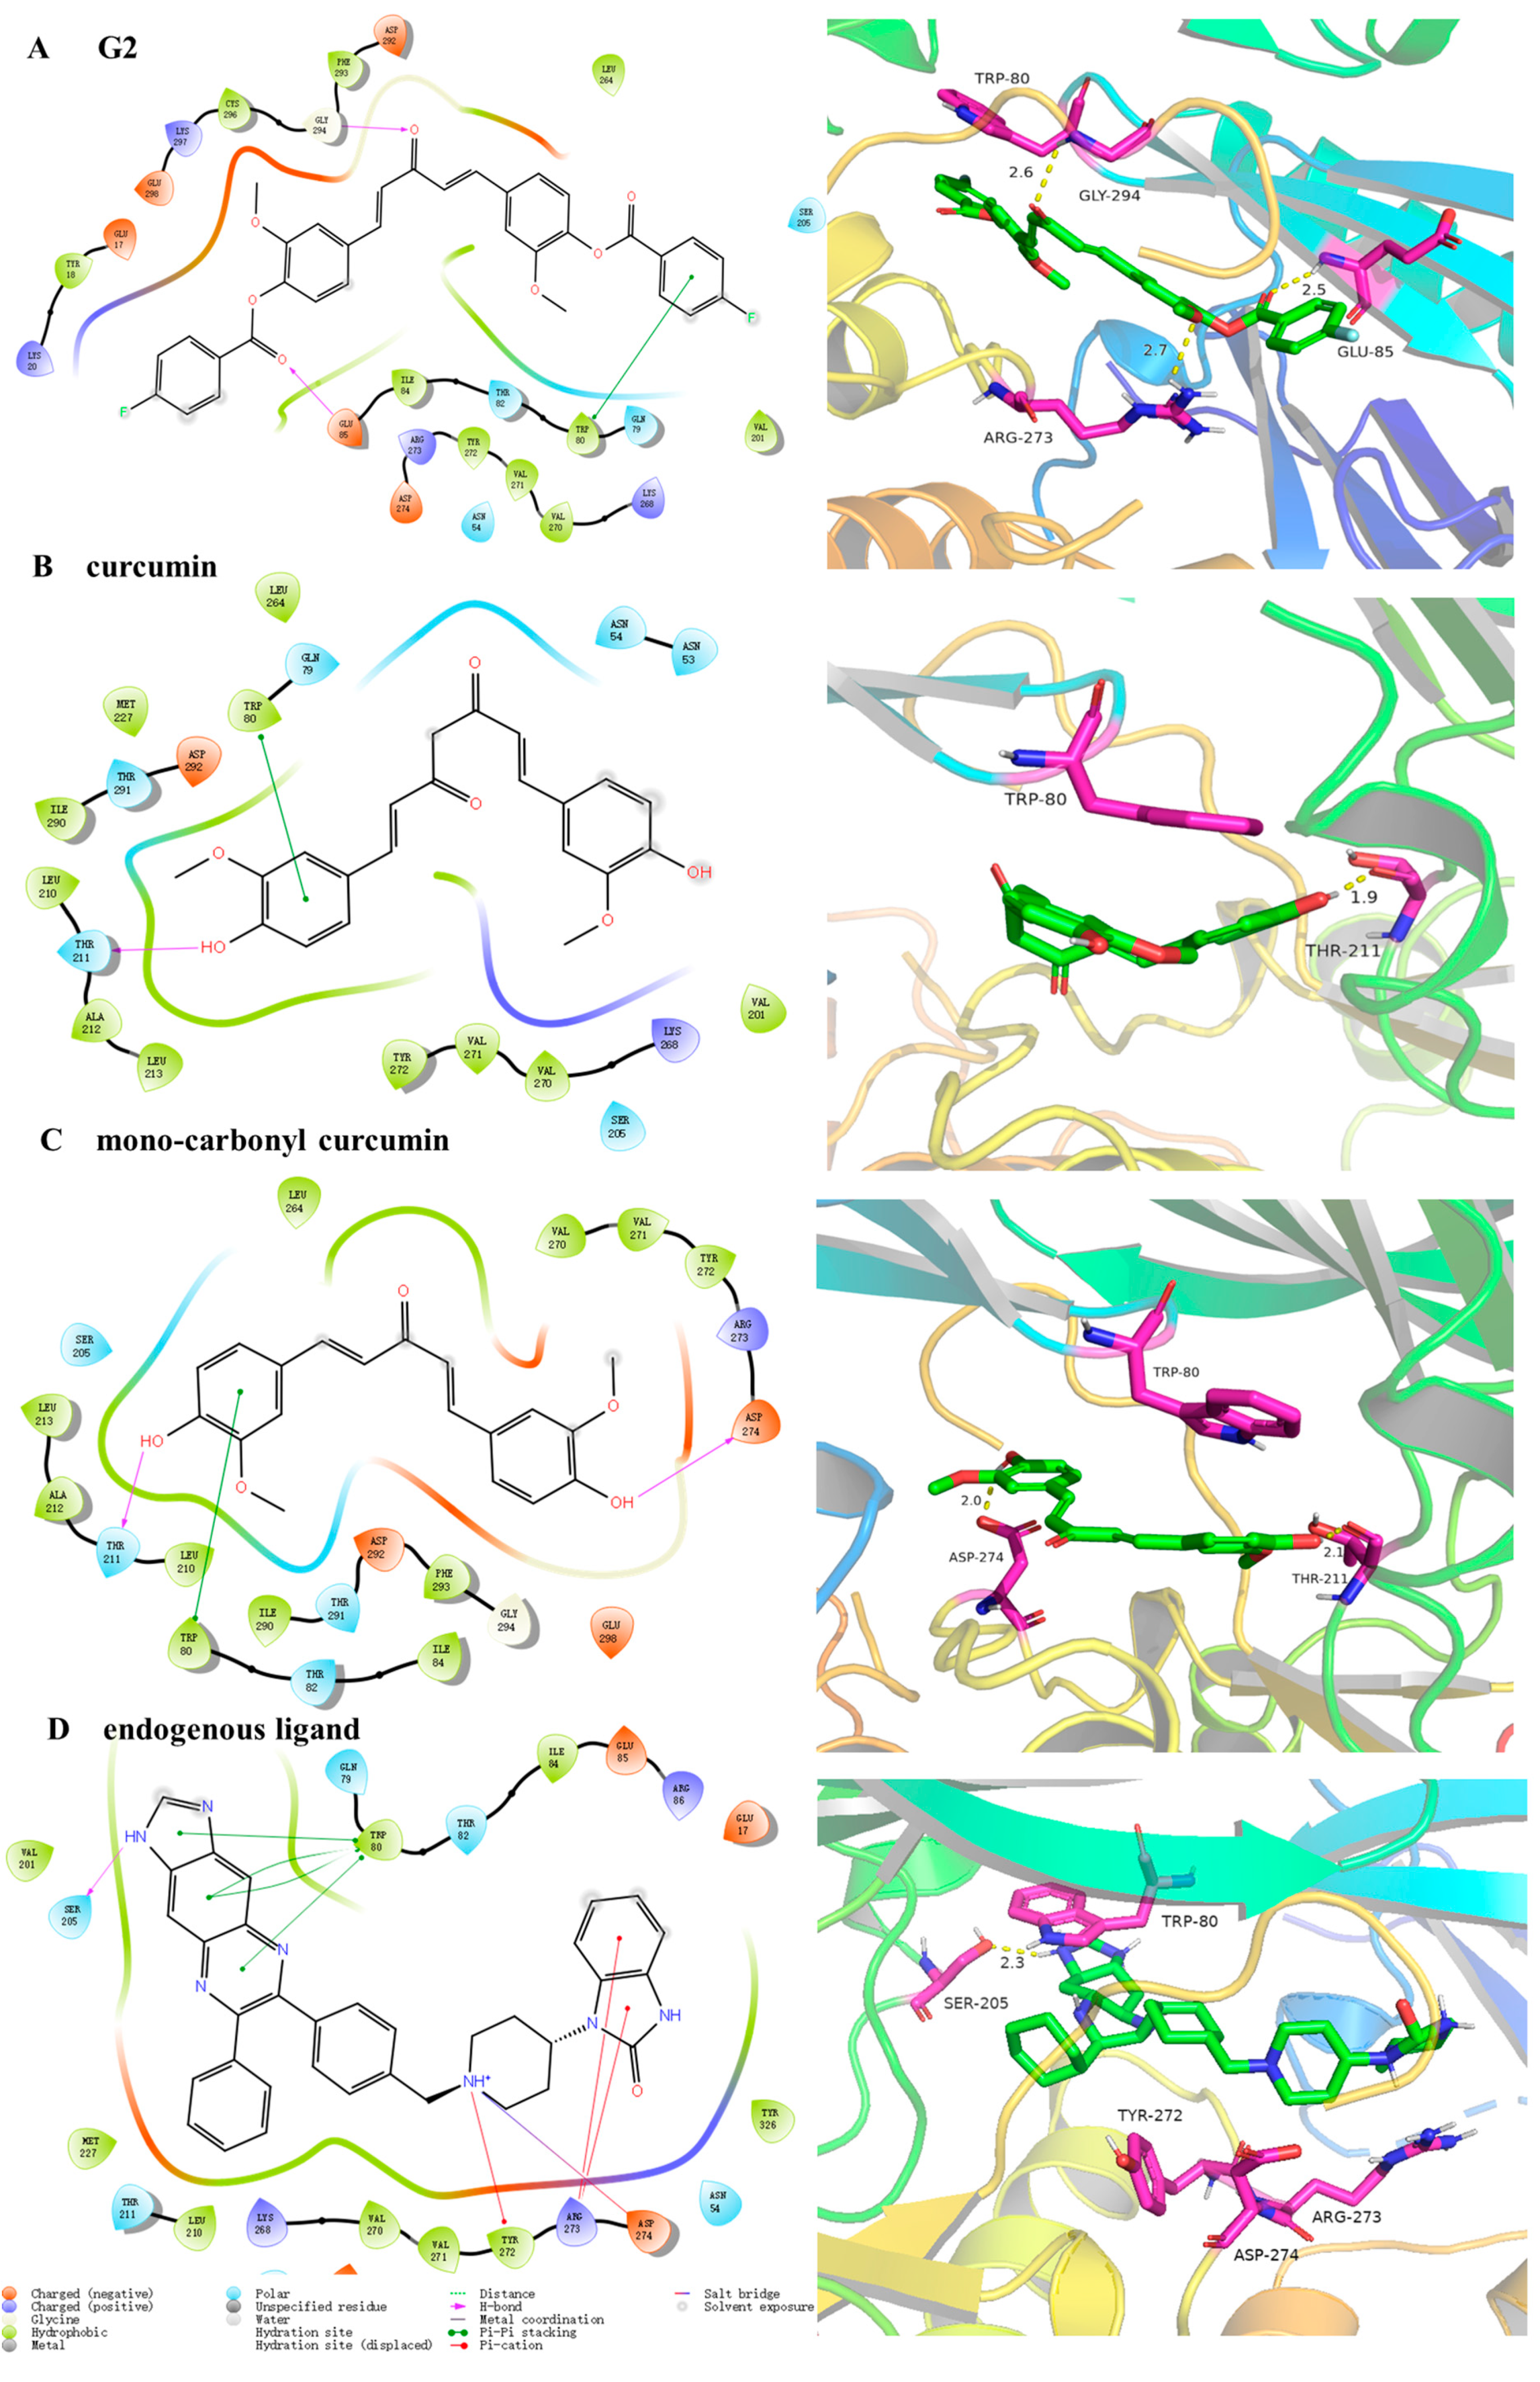
3.2. Molecular Docking Analysis
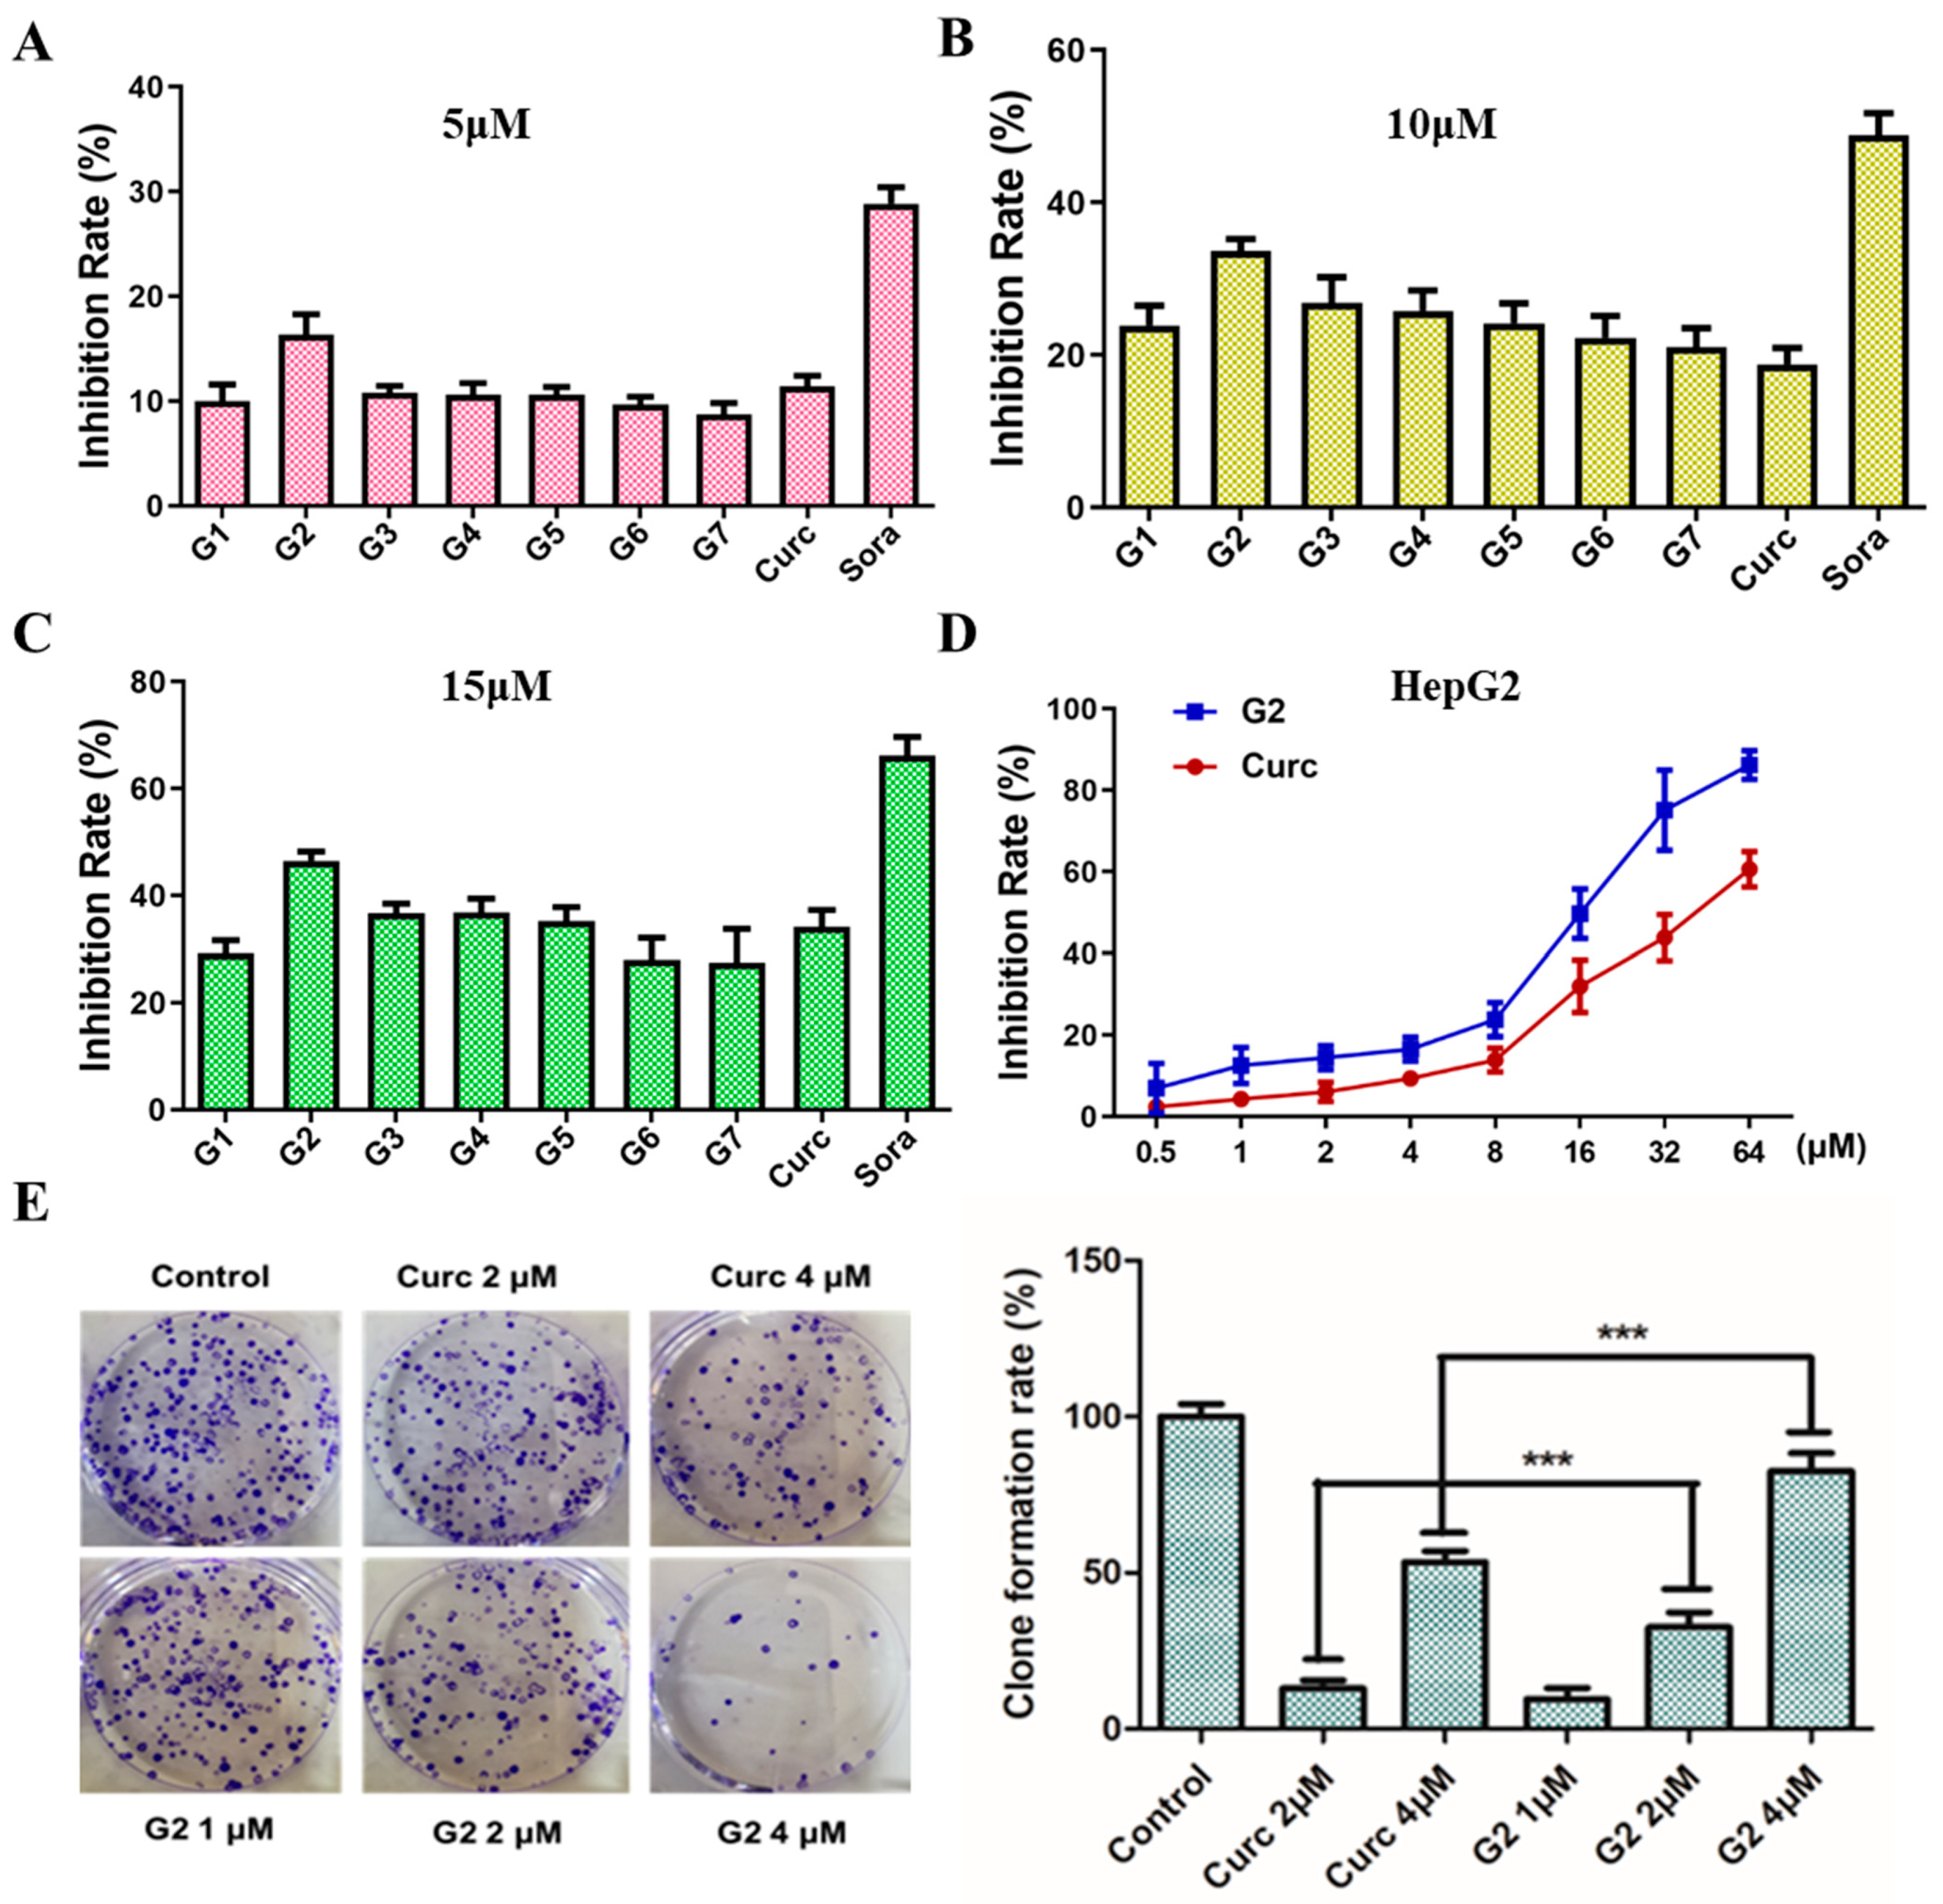
3.3. Inhibition Effect on Cell Proliferation
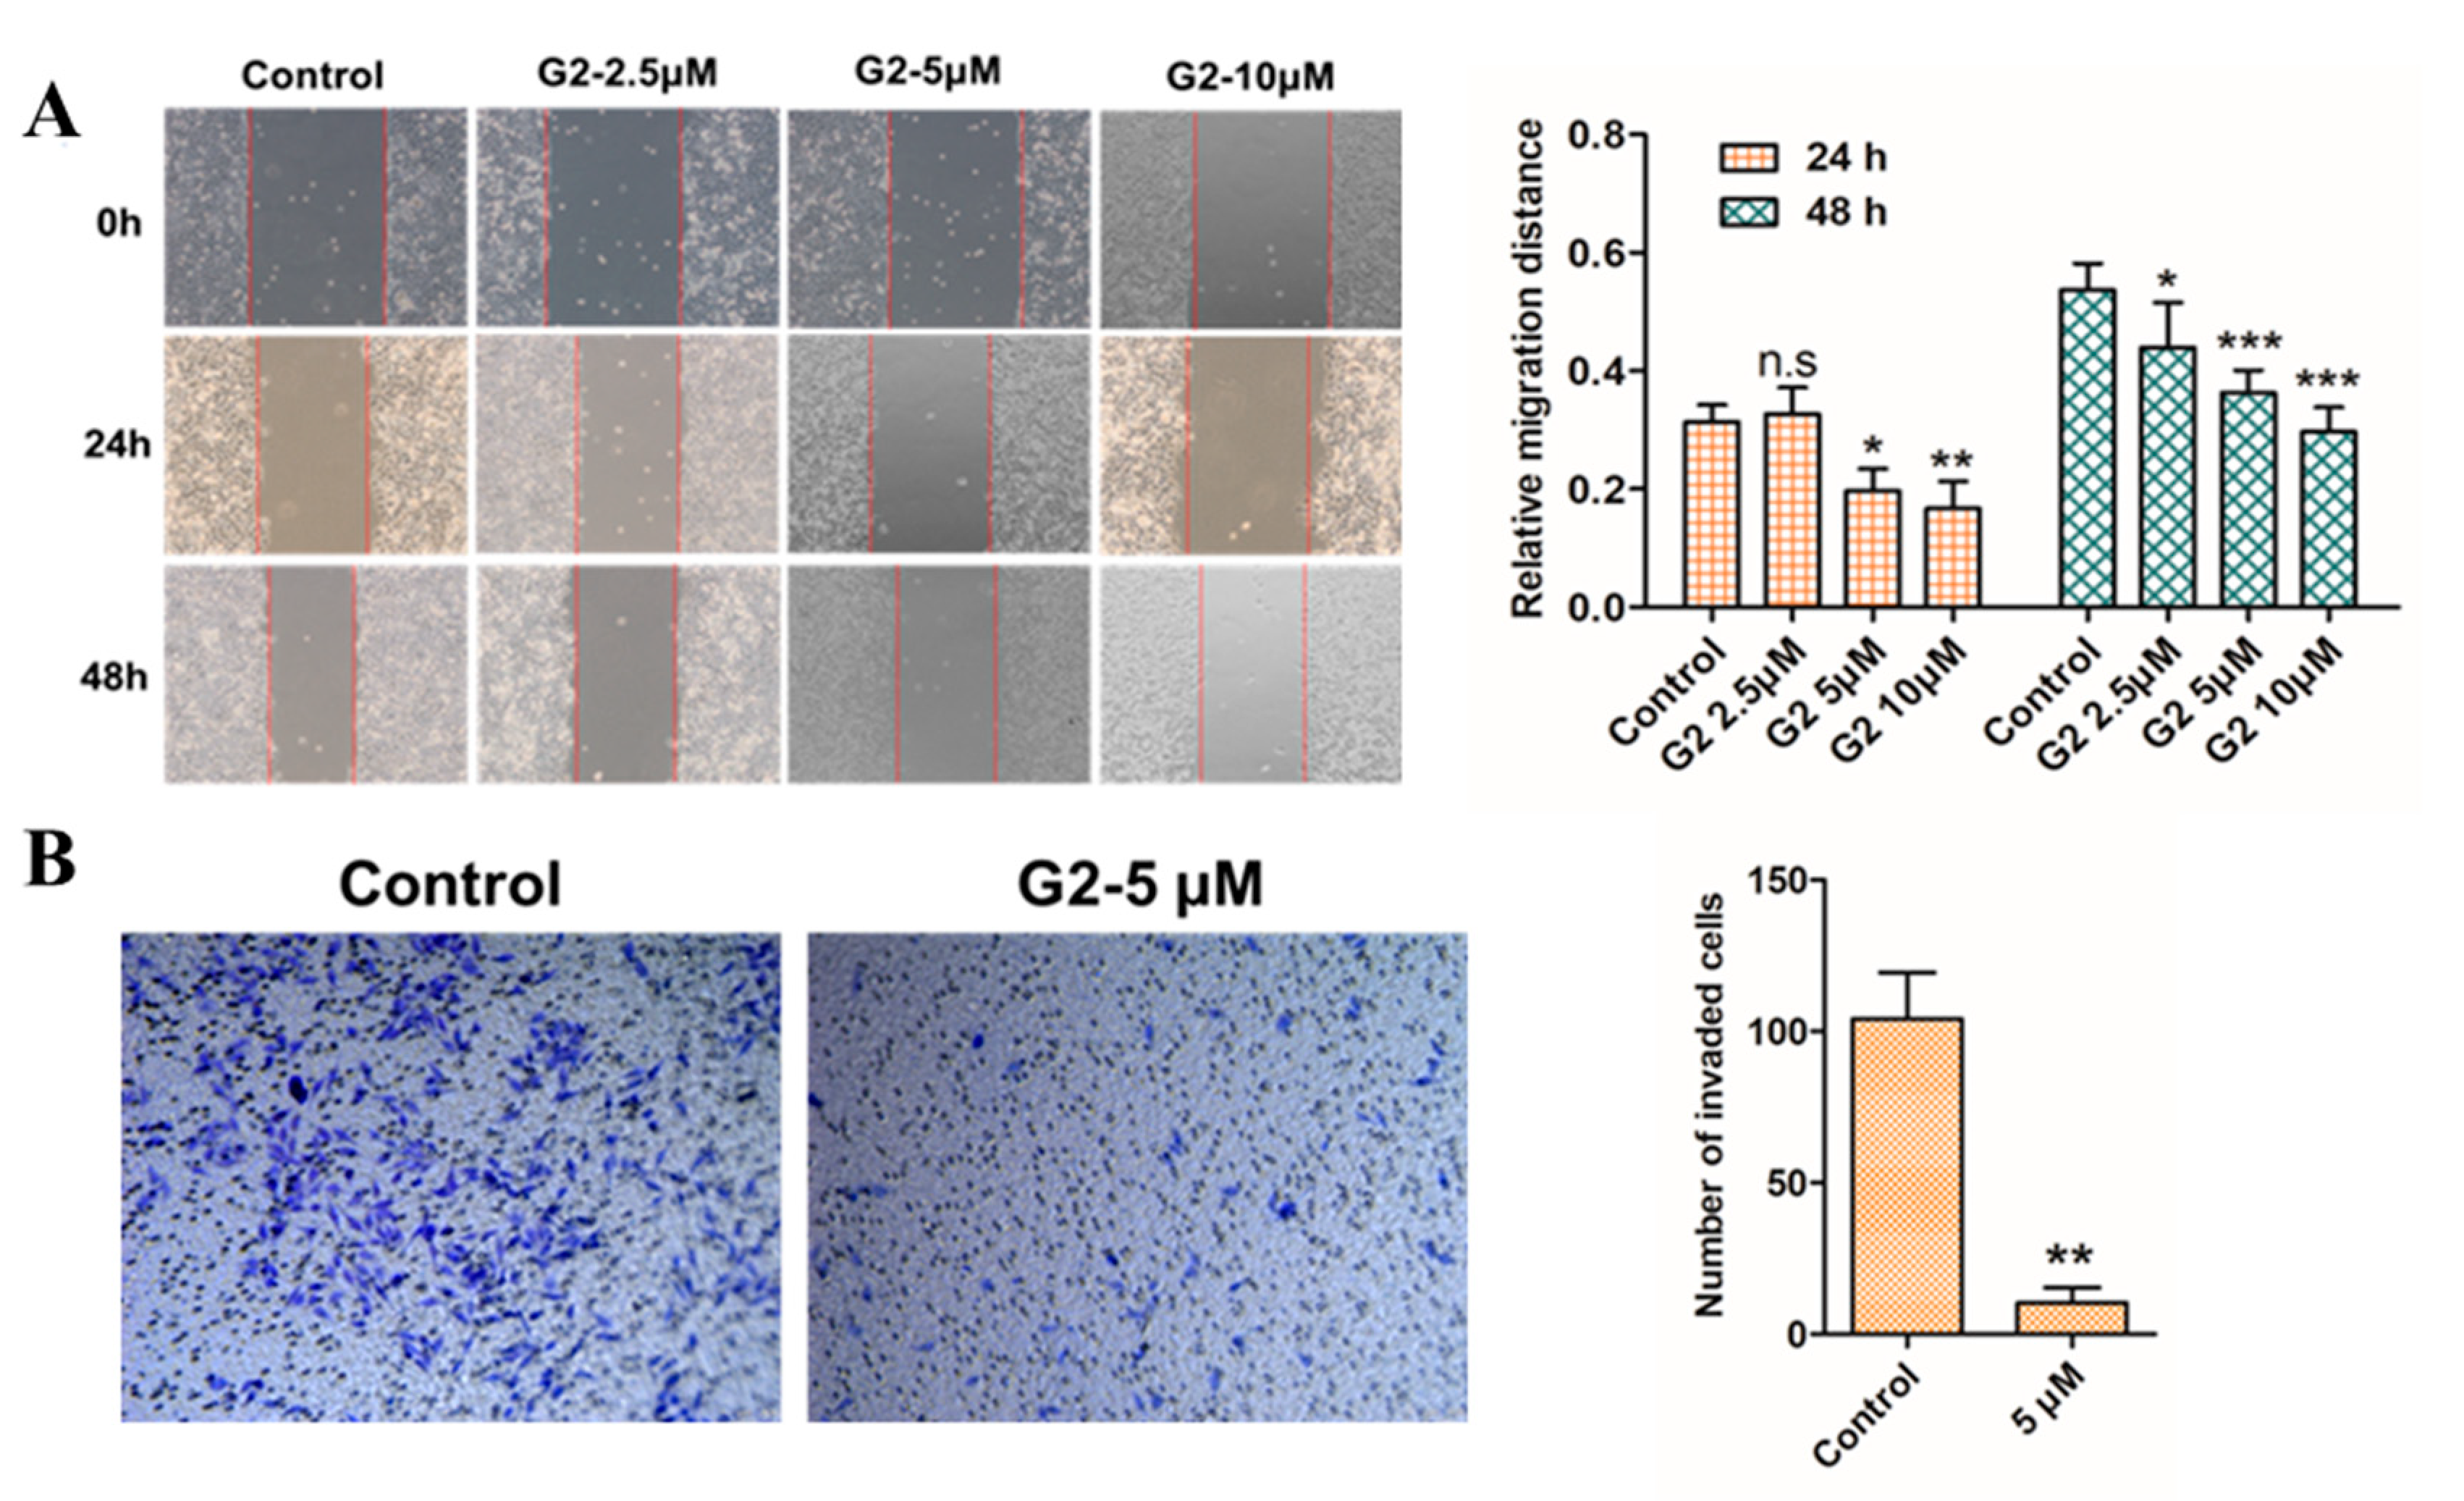
3.4. Inhibition Effect on Cell Migration
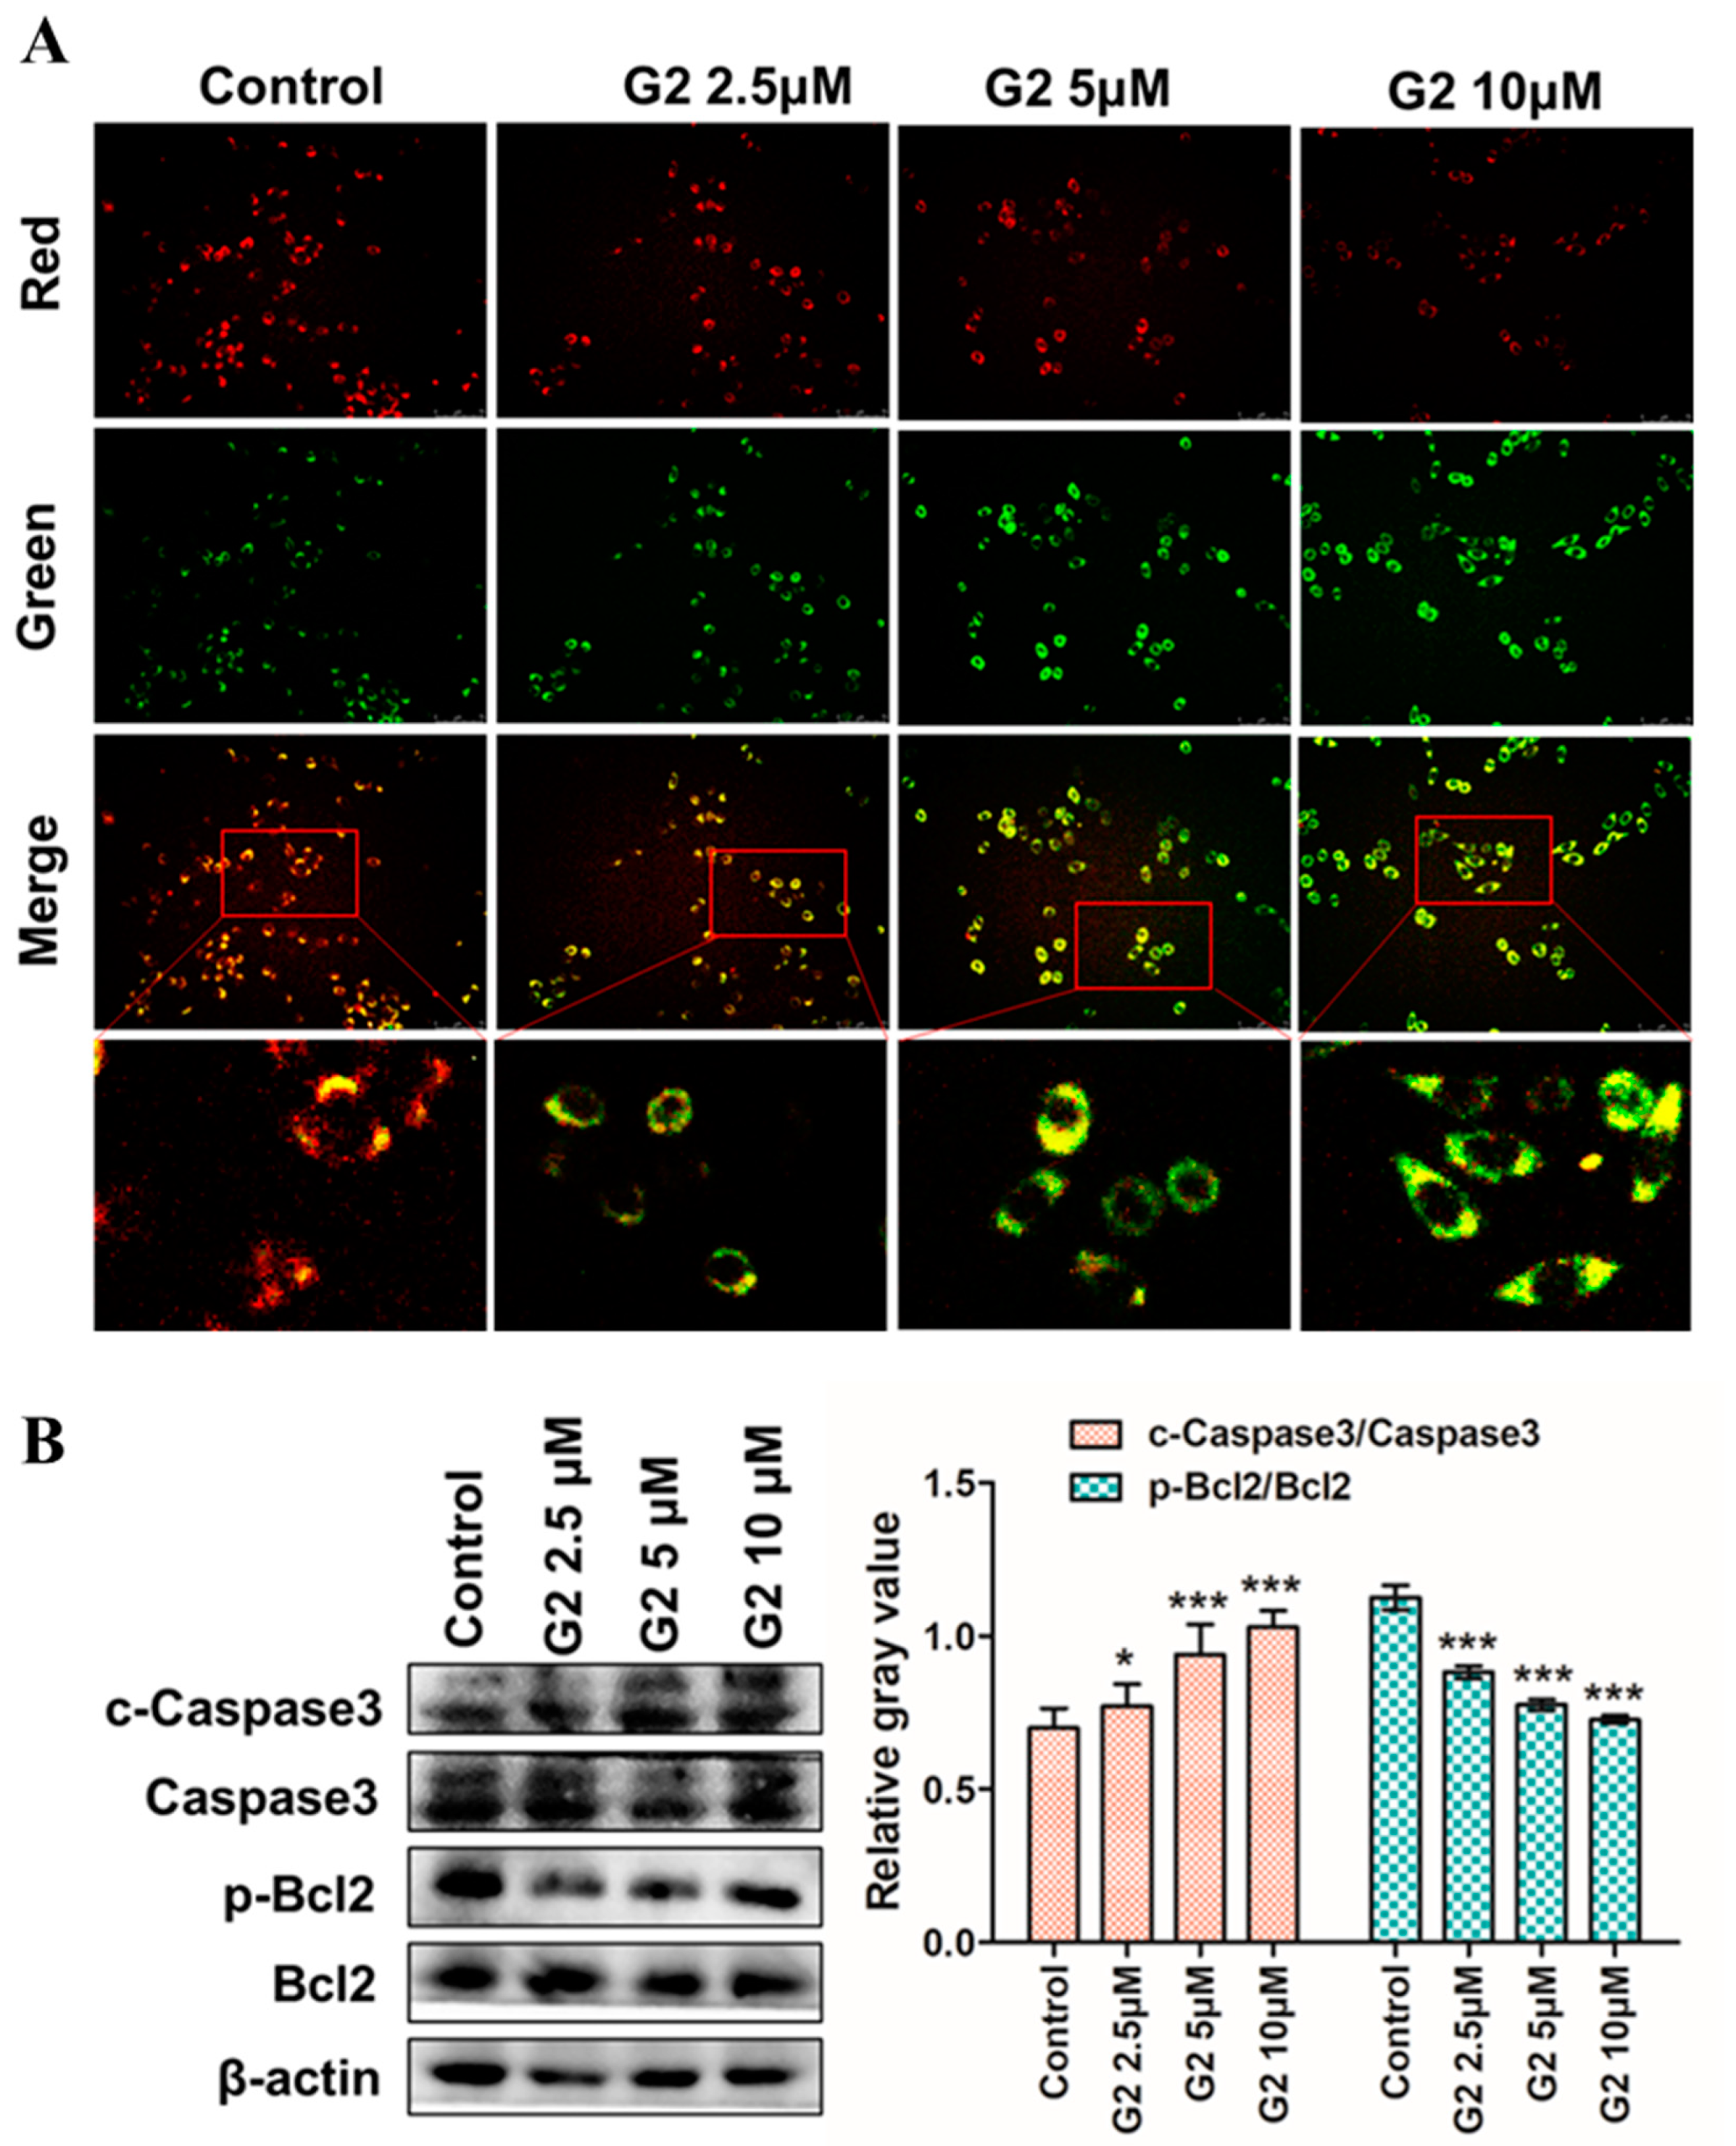
3.5. Apoptosis-Inducing Effect on HepG2 Cells
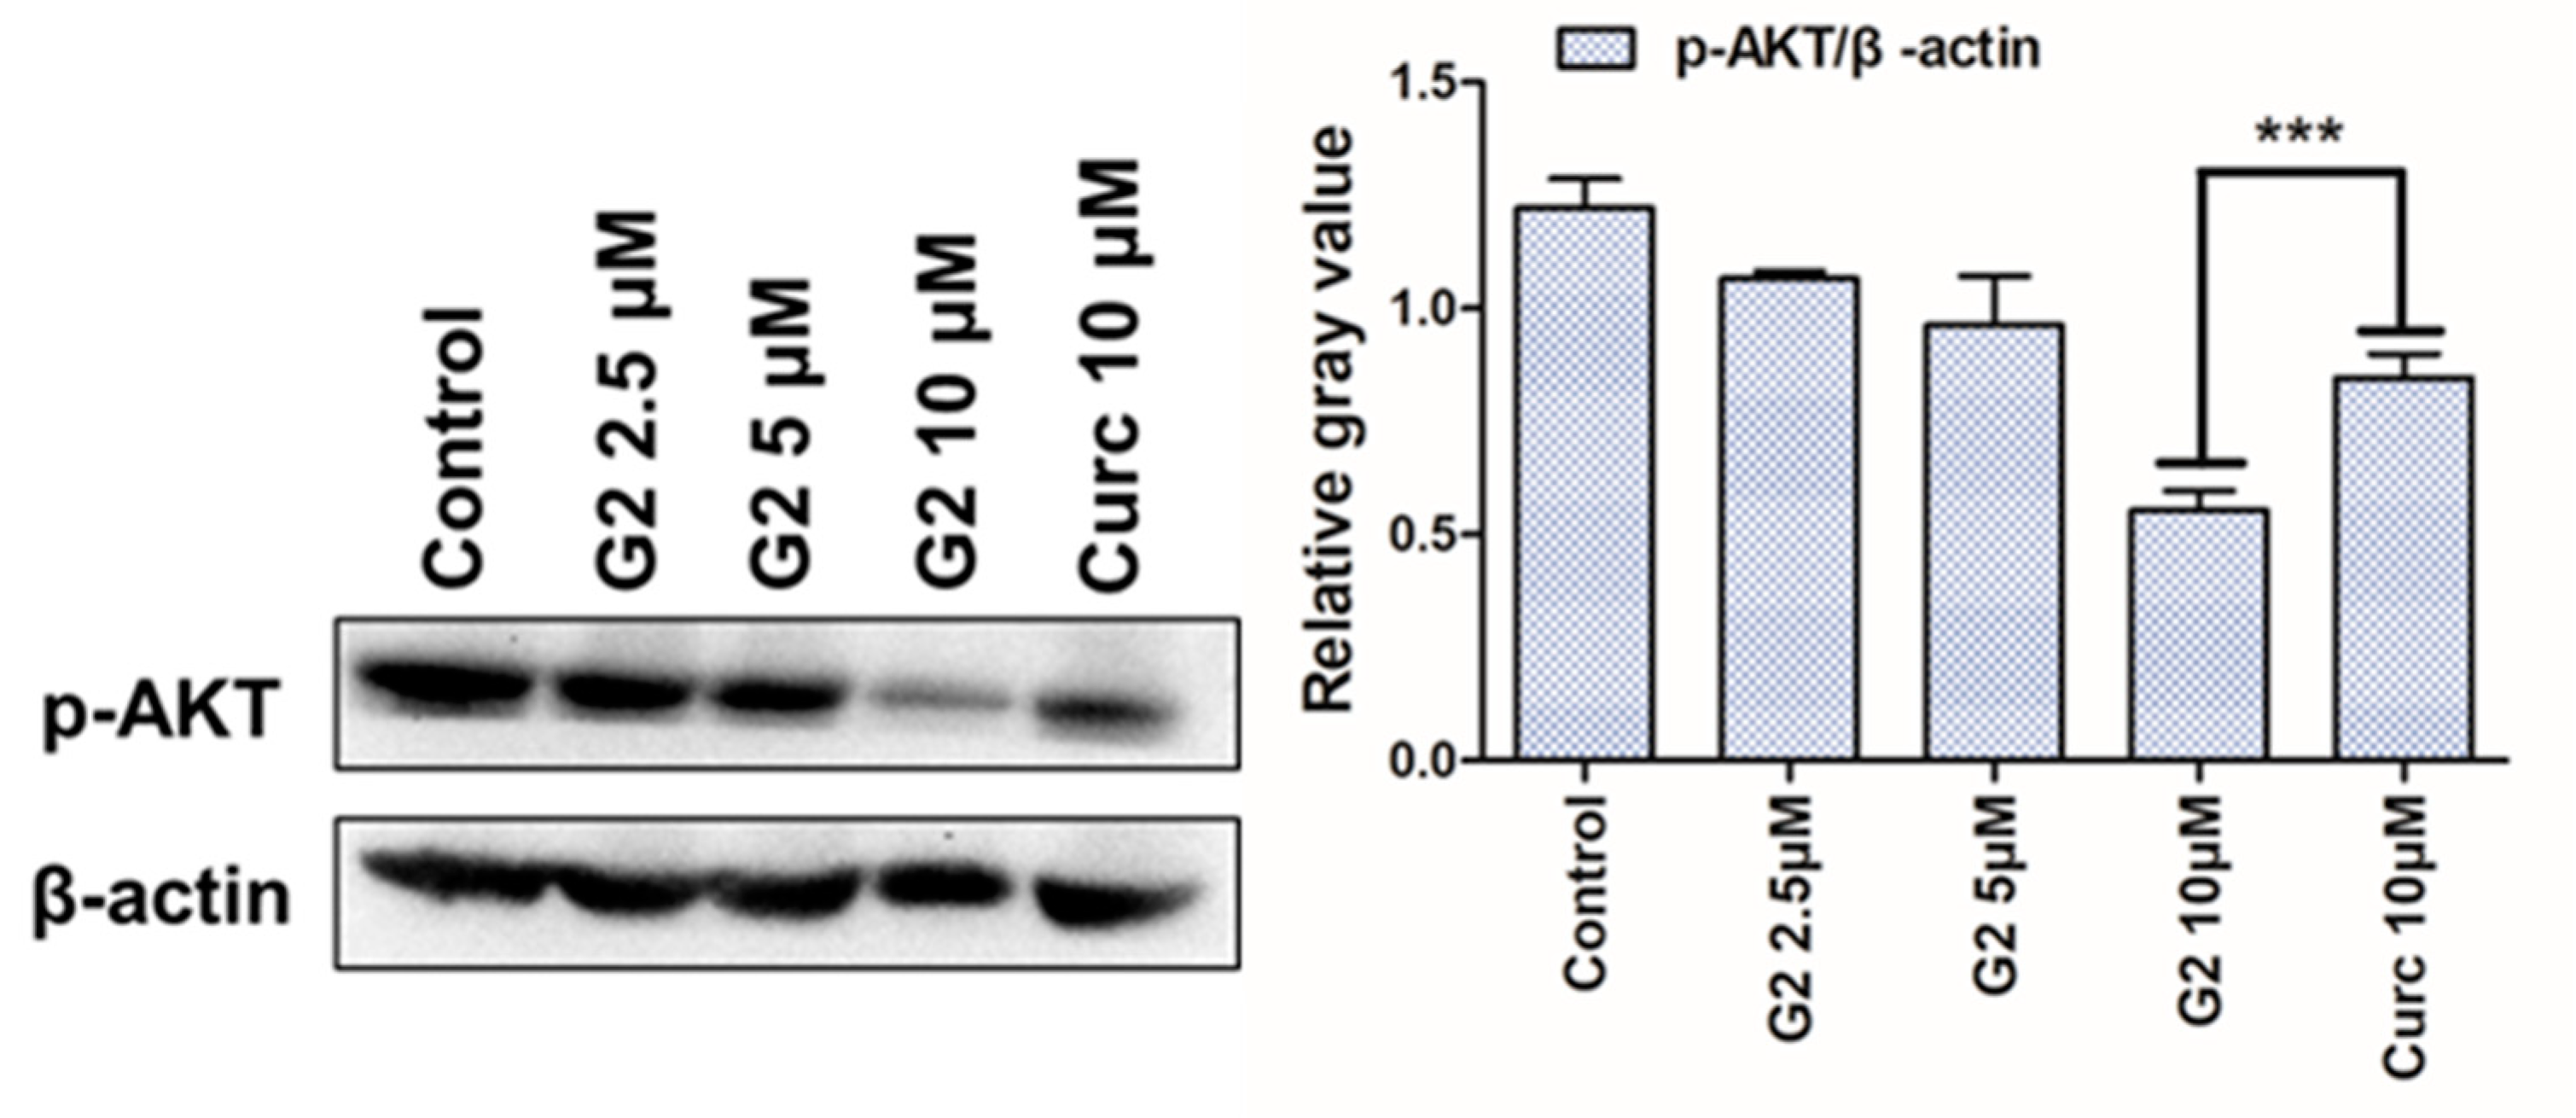
3.6. AKT Inhibition
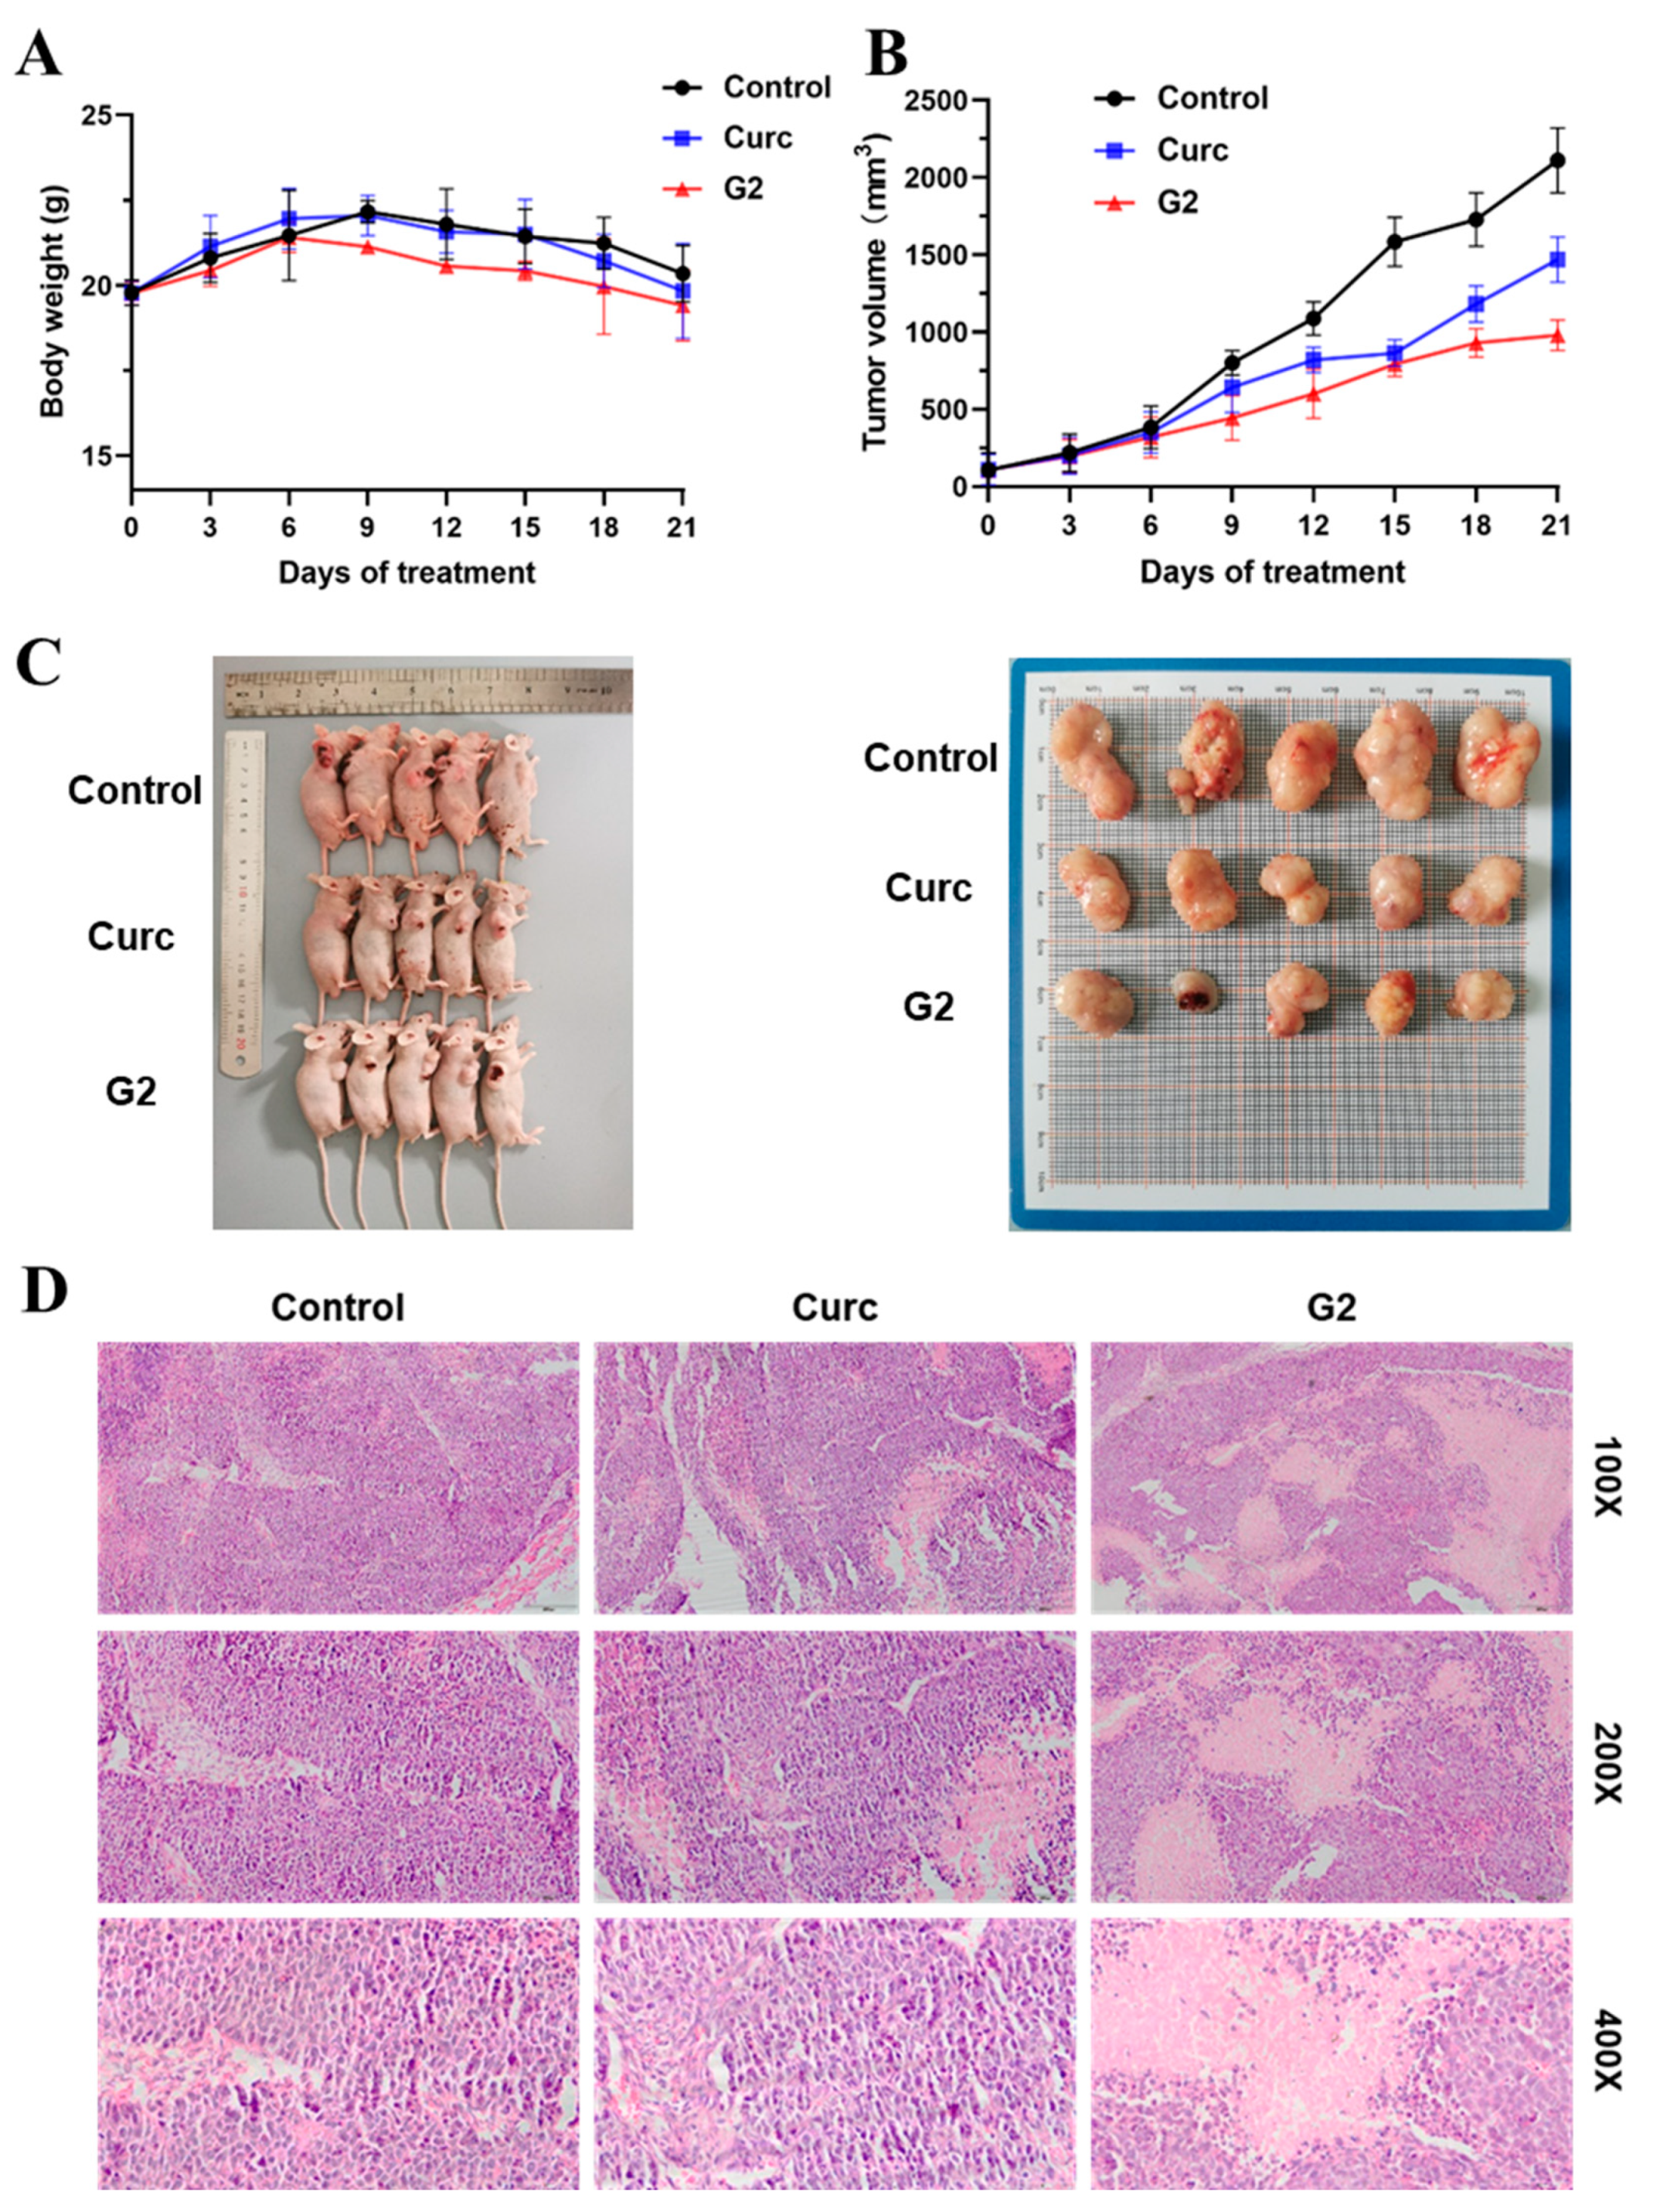
3.7. Antitumor Activity In Vivo
4. Conclusions
Supplementary Materials
Author Contributions
Funding
Institutional Review Board Statement
Informed Consent Statement
Data Availability Statement
Conflicts of Interest
References
- Zhao, S.; Pi, C.; Ye, Y.; Zhao, L.; Wei, Y. Recent advances of analogues of curcumin for treatment of cancer. Eur. J. Med. Chem. 2019, 180, 524–535. [Google Scholar] [CrossRef] [PubMed]
- Agrawal, D.K.; Mishra, P.K. Curcumin and its analogues: Potential anticancer agents. Med. Res. Rev. 2010, 30, 818–860. [Google Scholar] [CrossRef] [PubMed]
- Noorafshan, A.; Ashkani-Esfahani, S. A review of therapeutic effects of curcumin. Curr. Pharm. Des. 2013, 19, 2032–2046. [Google Scholar]
- Ireson, C.R.; Jones, D.J.L.; Orr, S.; Coughtrie, M.W.H.; Boocock, D.J.; Williams, M.L.; Farmer, P.B.; Steward, W.P.; Gescher, A.J. Metabolism of the cancer chemopreventive agent curcumin in human and rat intestine. Cancer Epidemiol. Biomark. Prev. 2002, 11, 105–111. [Google Scholar]
- Anand, P.; Kunnumakkara, A.B.; Newman, R.A.; Aggarwal, B.B. Bioavailability of curcumin: Problems and promises. Mol. Pharm. 2007, 4, 807–818. [Google Scholar] [CrossRef] [PubMed]
- Adams, B.K.; Ferstl, E.M.; Davis, M.C.; Herold, M.; Kurtkaya, S.; Camalier, R.F.; Hollingshead, M.G.; Kaur, G.; Sausville, E.A.; Rickles, F.R.; et al. Synthesis and biological evaluation of novel curcumin analogs as anti-cancer and anti-angiogenesis agents. Bioorg. Med. Chem. 2004, 12, 3871–3883. [Google Scholar] [CrossRef]
- Manohar, S.; Khan, S.I.; Kandi, S.K.; Raj, K.; Sun, G.; Yang, X.; Molina, A.D.C.; Ni, N.; Wang, B.; Rawat, D.S. Synthesis, antimalarial activity and cytotoxic potential of new monocarbonyl analogues of curcumin. Bioorg. Med. Chem. Lett. 2013, 23, 112–116. [Google Scholar] [CrossRef]
- Woo, H.B.; Eom, Y.W.; Park, K.-S.; Ham, J.; Ahn, C.M.; Lee, S. Synthesis of substituted benzimidazolyl curcumin mimics and their anticancer activity. Bioorg. Med. Chem. Lett. 2012, 22, 933–936. [Google Scholar] [CrossRef]
- Ai, Y.; Zhu, B.; Ren, C.; Kang, F.; Li, J.; Huang, Z.; Lai, Y.; Peng, S.; Ding, K.; Tian, J.; et al. Discovery of New Monocarbonyl Ligustrazine-Curcumin Hybrids for Intervention of Drug-Sensitive and Drug-Resistant Lung Cancer. J. Med. Chem. 2016, 59, 1747–1760. [Google Scholar] [CrossRef]
- Lagisetty, P.; Vilekar, P.; Sahoo, K.; Anant, S.; Awasthi, V. CLEFMA—An anti-proliferative curcuminoid from structure-activity relationship studies on 3,5-bis(benzylidene)-4-piperidones. Bioorg. Med. Chem. 2010, 18, 6109–6120. [Google Scholar] [CrossRef]
- Weber, W.M.; Hunsaker, L.A.; Abcouwer, S.F.; Deck, L.M.; Vander Jagt, D.L. Anti-oxidant activities of curcumin and related enones. Bioorg. Med. Chem. 2005, 13, 3811–3820. [Google Scholar] [CrossRef] [PubMed]
- Weber, W.M.; Hunsaker, L.A.; Roybal, C.N.; Bobrovnikova-Marjon, E.V.; Abcouwer, S.F.; Royer, R.E.; Deck, L.M.; Vander Jagt, D.L. Activation of NFκB is inhibited by curcumin and related enones. Bioorg. Med. Chem. 2006, 14, 2450–2461. [Google Scholar] [CrossRef] [PubMed]
- Liang, G.; Liu, Z.; Wang, Z.; Zhang, Y.; Xiao, B.; Fang, Q.; Zhao, C.; He, W.; Yang, S. Discovery and evaluation of asymmetrical monocarbonyl analogs of curcumin as anti-inflammatory agents. Drug Des. Dev. Ther. 2014, 8, 373–382. [Google Scholar] [CrossRef] [PubMed]
- Zhao, C.; Liu, Z.; Liang, G. Promising curcumin-based drug design: Mono-carbonyl analogues of curcumin (MACs). Curr. Pharm. Des. 2013, 19, 2114–2135. [Google Scholar]
- PLi, P.-X.; Li, Y.-M.; Mu, W.-W.; Liu, Y.; Yang, J.; Liu, G.-Y. 2,2′-Methoxyl Mono-Carbonyl Curcumin Promotes HEPG2 Cell Apoptosis and ROS Generation. Pharm. Chem. J. 2022, 56, 614–618. [Google Scholar]
- Liu, H.; Zhou, B.-H.; Qiu, X.; Wang, H.-S.; Zhang, F.; Fang, R.; Wang, X.-F.; Cai, S.-H.; Du, J.; Bu, X.-Z. T63, a new 4-arylidene curcumin analogue, induces cell cycle arrest and apoptosis through activation of the reactive oxygen species-FOXO3a pathway in lung cancer cells. Free. Radic. Biol. Med. 2012, 53, 2204–2217. [Google Scholar] [CrossRef]
- Zhou, G.-Z.; Li, A.-F.; Sun, Y.-H.; Sun, G.-C. A novel synthetic curcumin derivative MHMM-41 induces ROS-mediated apoptosis and migration blocking of human lung cancer cells A549. Biomed. Pharmacother. 2018, 103, 391–398. [Google Scholar] [CrossRef]
- Padhye, S.; Yang, H.; Jamadar, A.; Cui, Q.C.; Chavan, D.; Dominiak, K.; McKinney, J.; Banerjee, S.; Dou, Q.P.; Sarkar, F.H. New difluoro Knoevenagel condensates of curcumin, their Schiff bases and copper complexes as proteasome inhibitors and apoptosis inducers in cancer cells. Pharm. Res. 2009, 26, 1874–1880. [Google Scholar] [CrossRef]
- Kasinski, A.L.; Du, Y.; Thomas, S.L.; Zhao, J.; Sun, S.Y.; Khuri, F.R.; Wang, C.Y.; Shoji, M.; Sun, A.; Snyder, J.P.; et al. Inhibition of IκB kinase-nuclear factor-κB signaling pathway by 3,5-bis(2-flurobenzylidene)piperidin-4-one (EF24), a novel monoketone analog of curcumin. Mol. Pharmacol. 2008, 74, 654–661. [Google Scholar] [CrossRef]
- Youssef, D.; Nichols, C.E.; Cameron, T.S.; Balzarini, J.; De Clercq, E.; Jha, A. Design, synthesis, and cytostatic activity of novel cyclic curcumin analogues. Bioorg. Med. Chem. Lett. 2007, 17, 5624–5629. [Google Scholar] [CrossRef]
- Vellampatti, S.; Chandrasekaran, G.; Mitta, S.B.; Lakshmanan, V.-K.; Park, S.H. Metallo-Curcumin-Conjugated DNA Complexes Induces Preferential Prostate Cancer Cells Cytotoxicity and Pause Growth of Bacterial Cells. Sci. Rep. 2018, 8, 14929. [Google Scholar] [CrossRef] [PubMed]
- Koo, H.-J.; Shin, S.; Choi, J.Y.; Lee, K.-H.; Kim, B.-T.; Choe, Y.S. Introduction of Methyl Groups at C2 and C6 Positions Enhances the Antiangiogenesis Activity of Curcumin. Sci. Rep. 2015, 5, 14205. [Google Scholar] [CrossRef] [PubMed]
- Anand, P.; Thomas, S.G.; Kunnumakkara, A.B.; Sundaram, C.; Harikumar, K.B.; Sung, B.; Tharakan, S.T.; Misra, K.; Priyadarsini, I.K.; Rajasekharan, K.N.; et al. Biological activities of curcumin and its analogues (Congeners) made by man and Mother Nature. Biochem. Pharmacol. 2008, 76, 1590–1611. [Google Scholar] [CrossRef] [PubMed]
- Khopde, S.M.; Priyadarsini, K.I.; Guha, S.N.; Satav, J.G.; Venkatesan, P.; Rao, M.N.A. Inhibition of radiation-induced lipid peroxidation by tetrahydrocurcumin: Possible mechanisms by pulse radiolysis. Biosci. Biotechnol. Biochem. 2000, 64, 503–509. [Google Scholar] [CrossRef]
- Ohtsu, H.; Xiao, Z.; Ishida, J.; Nagai, M.; Wang, H.-K.; Itokawa, H.; Su, C.-Y.; Shih, C.; Chiang, T.; Chang, E.; et al. Antitumor agents. 217. Curcumin analogues as novel androgen receptor antagonists with potential as anti-prostate cancer agents. J. Med. Chem. 2002, 45, 5037–5042. [Google Scholar] [CrossRef]
- Cao, Y.-K.; Li, H.-J.; Song, Z.-F.; Li, Y.; Huai, Q.-Y. Huai, Synthesis and biological evaluation of novel curcuminoid derivatives. Molecules 2014, 19, 16349–16372. [Google Scholar] [CrossRef]
- Ferrari, E.; Lazzari, S.; Marverti, G.; Pignedoli, F.; Spagnolo, F.; Saladini, M. Synthesis, cytotoxic and combined cDDP activity of new stable curcumin derivatives. Bioorg. Med. Chem. 2009, 17, 3043–3052. [Google Scholar] [CrossRef]
- Wei, X.; Du, Z.-Y.; Zheng, X.; Cui, X.-X.; Conney, A.H.; Zhang, K. Synthesis and evaluation of curcumin-related compounds for anticancer activity. Eur. J. Med. Chem. 2012, 53, 235–245. [Google Scholar] [CrossRef]
- Quincoces Suarez, J.A.; Rando, D.G.; Santos, R.P.; Gonçalves, C.P.; Ferreira, E.; De Carvalho, J.E.; Kohn, L.; Maria, D.A.; Faião-Flores, F.; Michalik, D.; et al. New antitumoral agents I: In vitro anticancer activity and in vivo acute toxicity of synthetic 1,5-bis(4-hydroxy-3-methoxyphenyl)-1,4-pentadien-3-one and derivatives. Bioorg. Med. Chem. 2010, 18, 6275–6281. [Google Scholar] [CrossRef]
- Shi, Q.; Shih, C.C.-Y.; Lee, K.H. Novel anti-prostate cancer curcumin analogues that enhance androgen receptor degradation activity. Anti-Cancer Agents Med. Chem. 2009, 9, 904–912. [Google Scholar] [CrossRef]
- Yu, P.; Cao, W.; Zhao, L.; Han, Q.; Yang, S.; Yang, K.; Pan, X.; Wang, Q.; Wang, Y. Design, Synthesis, and Antitumor Evaluation of Novel Mono-Carbonyl Curcumin Analogs in Hepatocellular Carcinoma Cell. Pharmaceuticals 2022, 15, 950. [Google Scholar] [CrossRef]
- Reddy, A.R.; Dinesh, P.; Prabhakar, A.; Umasankar, K.; Shireesha, B.; Raju, M.B. A comprehensive review on SAR of curcumin. Mini-Rev. Med. Chem. 2013, 13, 1769–1777. [Google Scholar] [CrossRef] [PubMed]
- Rodrigues, F.C.; Anil Kumar, N.V.; Thakur, G. Developments in the anticancer activity of structurally modified curcumin: An up-to-date review. Eur. J. Med. Chem. 2019, 177, 76–104. [Google Scholar] [CrossRef] [PubMed]
- Feng, L.; Li, Y.; Song, Z.-F.; Li, H.-J.; Huai, Q.-Y. Synthesis and Biological Evaluation of Curcuminoid Derivatives. Chem. Pharm. Bull. 2015, 63, 873–881. [Google Scholar] [CrossRef]
- Sakle, N.-S.; More, S.-A.; Dhawale, S.-A.; Mokale, S.-N. Targeting Small Molecule Tyrosine Kinases by Polyphenols: New Move Towards Anti-tumor Drug Discovery. Curr. Drug Discov. Technol. 2020, 17, 585–615. [Google Scholar] [CrossRef]
- Wu, W.-I.; Voegtli, W.C.; Sturgis, H.L.; Dizon, F.P.; Vigers, G.P.A.; Brandhuber, B.J. Crystal structure of human AKT1 with an allosteric inhibitor reveals a new mode of kinase inhibition. PLoS ONE 2010, 5, e12913. [Google Scholar] [CrossRef] [PubMed]
- Saad Al Shehri, Z.; Alanazi, A.-D.; Alnomasy, S.-F. Anti-Cancer Effects of Queen Bee Acid (10-Hydroxy-2-Decenoic Acid) and Its Cellular Mechanisms against Human Hepatoma Cells. Molecules 2023, 28, 1972. [Google Scholar] [CrossRef]
- Zhang, T.; Cui, Y.; Wu, Y.; Meng, J.; Han, L.; Zhang, J.; Zhang, C.; Yang, C.; Chen, L.; Bai, X.; et al. Mitochondrial GCN5L1 regulates glutaminase acetylation and hepatocellular carcinoma. Clin. Transl. Med. 2022, 12, e852. [Google Scholar] [CrossRef]
- Cao, W.; Zhang, Y.; Li, A.; Yu, P.; Song, L.; Liang, J.; Cao, N.; Gao, J.; Xu, R.; Ma, Y.; et al. Curcumin reverses hepatic epithelial mesenchymal transition induced by trichloroethylene by inhibiting IL-6R/STAT3. Toxicol. Mech. Methods 2021, 31, 589–599. [Google Scholar] [CrossRef]
- Yu, P.; Cao, W.; Yang, S.; Wang, Y.; Xia, A.; Tan, X.; Wang, L. Design, synthesis and antitumor evaluation of novel quinazoline analogs in hepatocellular carcinoma cell. J. Mol. Struct. 2022, 1268, 133718. [Google Scholar] [CrossRef]
- Yu, P.; Cao, W.; Wang, Y. Dynamics simulation and in vitro studies of betulinic acid derivative with liver X receptor. J. Biomol. Struct. Dyn. 2023, 1–10. [Google Scholar] [CrossRef]
- Wang, P.-F.; Qiu, H.-Y.; Wang, Z.-F.; Zhang, Y.-J.; Wang, Z.-C.; Li, D.-D.; Zhu, H.-L. Identification of novel B-RafV600E inhibitors employing FBDD strategy. Biochem. Pharmacol. 2017, 132, 63–76. [Google Scholar] [CrossRef] [PubMed]
- Abd El-Lateef, H.-M.; Elbastawesy, M.A.-I.; Abdelghani Ibrahim, T.-M.; Khalaf, M.-M.; Gouda, M.; Wahba, M.G.-F.; Zaki, I.; Morcoss, M.-M. Design, Synthesis, Docking Study, and Antiproliferative Evaluation of Novel Schiff Base-Benzimidazole Hybrids with VEGFR-2 Inhibitory Activity. Molecules 2023, 28, 481. [Google Scholar] [CrossRef] [PubMed]
- Burke, P.J. Mitochondria, Bioenergetics and Apoptosis in Cancer. Trends Cancer 2017, 3, 857–870. [Google Scholar] [CrossRef]
- Han, X.; Peng, B.; Xiao, B.-B.; Cao, S.-L.; Yang, C.-R.; Wang, W.-Z.; Wang, F.-C.; Li, H.-Y.; Yuan, X.-L.; Shi, R.; et al. Synthesis and evaluation of chalcone analogues containing a 4-oxoquinazolin-2-yl group as potential anti-tumor agents. Eur. J. Med. Chem. 2019, 162, 586–601. [Google Scholar] [CrossRef]
- Mou, S.; Zhou, Z.; He, Y.; Liu, F.; Gong, L. Curcumin inhibits cell proliferation and promotes apoptosis of laryngeal cancer cells through Bcl-2 and PI3K/Akt, and by upregulating miR-15a. Oncol. Lett. 2017, 14, 4937–4942. [Google Scholar] [CrossRef] [PubMed]
- Rana, C.; Piplani, H.; Vaish, V.; Nehru, B.; Sanyal, S.N. Downregulation of PI3-K/Akt/PTEN pathway and activation of mitochondrial intrinsic apoptosis by Diclofenac and Curcumin in colon cancer. Mol. Cell. Biochem. 2015, 402, 225–241. [Google Scholar] [CrossRef]


| Compounds | Docking Score (Kcal/mol) | Compounds | Docking Score (Kcal/mol) | ||
|---|---|---|---|---|---|
| SP | XP | SP | XP | ||
| endogenous ligand | −11.044 | −10.519 | G5 | −9.302 | −8.721 |
| G2 | −9.922 | −9.383 | G3 | −9.288 | −8.871 |
| G4 | −9.514 | −8.56 | G6 | −9.08 | −8.307 |
| G1 | −9.457 | −8.256 | mono-carbonyl curcumin | −7.369 | −7.136 |
| G7 | −9.344 | −8.674 | curcumin | −6.599 | −7.094 |
Disclaimer/Publisher’s Note: The statements, opinions and data contained in all publications are solely those of the individual author(s) and contributor(s) and not of MDPI and/or the editor(s). MDPI and/or the editor(s) disclaim responsibility for any injury to people or property resulting from any ideas, methods, instructions or products referred to in the content. |
© 2023 by the authors. Licensee MDPI, Basel, Switzerland. This article is an open access article distributed under the terms and conditions of the Creative Commons Attribution (CC BY) license (https://creativecommons.org/licenses/by/4.0/).
Share and Cite
Cao, W.; Yu, P.; Yang, S.; Li, Z.; Zhang, Q.; Liu, Z.; Li, H. Discovery of Novel Mono-Carbonyl Curcumin Derivatives as Potential Anti-Hepatoma Agents. Molecules 2023, 28, 6796. https://doi.org/10.3390/molecules28196796
Cao W, Yu P, Yang S, Li Z, Zhang Q, Liu Z, Li H. Discovery of Novel Mono-Carbonyl Curcumin Derivatives as Potential Anti-Hepatoma Agents. Molecules. 2023; 28(19):6796. https://doi.org/10.3390/molecules28196796
Chicago/Turabian StyleCao, Weiya, Pan Yu, Shilong Yang, Zheyu Li, Qixuan Zhang, Zengge Liu, and Hongzhuo Li. 2023. "Discovery of Novel Mono-Carbonyl Curcumin Derivatives as Potential Anti-Hepatoma Agents" Molecules 28, no. 19: 6796. https://doi.org/10.3390/molecules28196796