

Comparative Performance of Rapid Diagnostics for the Detection of T-2 and HT-2 Toxins in Oats
 , , , and
Abstract
:
1. Introduction
2. Results and Discussion
2.1. Compliance/Non-Compliance in Relation to the EU Guidance Limits
2.2. Test Kit Performance Characteristics
3. Materials and Methods
3.1. Chemicals and Materials
3.2. Sample Collection and Preparation
3.3. LC-MS/MS Analysis of Oat Samples
3.3.1. Sample Extraction
3.3.2. LC-MS/MS Parameters
3.3.3. LC-MS/MS Validation and Method Performance
3.4. Test Kit Analysis of Oat Samples
4. Conclusions
Author Contributions
Funding
Institutional Review Board Statement
Informed Consent Statement
Data Availability Statement
Acknowledgments
Conflicts of Interest
Sample Availability
References
- Bennett, J.W.; Klich, M. Mycotoxins. Clin. Microbiol. Rev. 2003, 16, 497–516. [Google Scholar] [CrossRef] [PubMed]
- CAST. Mycotoxins: Risks in Plant, Animal and Human Systems; Task Force Report, No. 139; The Council for Agricultural Science and Technology Agricultural Science: Ames, IA, USA, 2003; Available online: https://www.cast-science.org/publication/mycotoxins-risks-in-plant-animal-and-human-systems/ (accessed on 5 April 2023).
- Eskola, M.; Kos, G.; Elliott, C.T.; Hajšlová, J.; Mayar, S.; Krska, R. Worldwide contamination of food-crops with mycotoxins: Validity of the widely cited ‘FAO estimate’ of 25. Crit. Rev. Food Sci. Nutr. 2020, 60, 2773–2789. [Google Scholar] [CrossRef] [PubMed]
- Krska, R.; De Nijs, M.; McNerney, O.; Pichler, M.; Gilbert, J.; Edwards, S.; Suman, M.; Magan, N.; Rossi, V.; Van Der Fels-Klerx, H.J.; et al. Safe food and feed through an integrated toolbox for mycotoxin management: The MyToolBox approach. World Mycotoxin J. 2016, 9, 487–495. [Google Scholar] [CrossRef]
- Medina, Á.; González-Jartín, J.M.; Sainz, M.J. Impact of global warming on mycotoxins. Curr. Opin. Food Sci. 2017, 18, 76–81. [Google Scholar] [CrossRef]
- Moretti, A.; Pascale, M.; Logrieco, A.F. Mycotoxin risks under a climate change scenario in Europe. Trends Food Sci. Technol. 2019, 84, 38–40. [Google Scholar] [CrossRef]
- Paterson, R.R.M.; Lima, N. How will climate change affect mycotoxins in food? Food Res. Int. 2010, 43, 1902–1914. [Google Scholar] [CrossRef]
- EU. Commission Recommendation of 27 March 2013 on the Presence of T-2 and HT-2 Toxin in Cereals and Cereal Products (2013/165/EU) 2013. Available online: https://eur-lex.europa.eu/LexUriServ/LexUriServ.do?uri=OJ:L:2013:091:0012:0015:EN:PDF (accessed on 17 April 2023).
- Agrolab. Current Status of Discussions on Limit Values for Mycotoxins in Food. 2020. Available online: https://www.agrolab.com/en/news/food-news/2697-limit-values-mycotoxins.html (accessed on 20 April 2023).
- Meyer, J.C.; Hennies, I.; Wessels, D.; Schwarz, K. Survey of mycotoxins in milling oats dedicated for food purposes between 2013 and 2019 by LC–MS/MS. Food Addit. Contam. Part A Chem. Anal. Control Expo. Risk Assess. 2021, 38, 1934–1947. [Google Scholar] [CrossRef] [PubMed]
- Luo, S.; Du, H.; Kebede, H.; Liu, Y.; Xing, F. Contamination status of major mycotoxins in agricultural product and food stuff in Europe. Food Control 2021, 127, 108120. [Google Scholar] [CrossRef]
- Kiš, M.; Vulić, A.; Kudumija, N.; Šarkanj, B.; Jaki Tkalec, V.; Aladić, K.; Škrivanko, M.; Furmeg, S.; Pleadin, J. A Two-Year Occurrence of Fusarium T-2 and HT-2 Toxin in Croatian Cereals Relative of the Regional Weather. Toxins 2021, 13, 39. [Google Scholar] [CrossRef] [PubMed]
- De Colli, L.; De Ruyck, K.; Abdallah, M.F.; Finnan, J.; Mullins, E.; Kildea, S.; Spink, J.; Elliott, C.; Danaher, M. Natural Co-Occurrence of Multiple Mycotoxins in Unprocessed Oats Grown in Ireland with Various Production Systems. Toxins 2021, 13, 188. [Google Scholar] [CrossRef] [PubMed]
- Kolawole, O.; De Ruyck, K.; Greer, B.; Meneely, J.; Doohan, F.; Danaher, M.; Elliott, C. Agronomic Factors Influencing the Scale of Fusarium Mycotoxin Contamination of Oats. J. Fungi 2021, 7, 965. [Google Scholar] [CrossRef] [PubMed]
- Pereira, V.L.; Fernandes, J.O.; Cunha, S.C. Mycotoxins in cereals and related foodstuffs: A review on occurrence and recent methods of analysis. Trends Food Sci. Technol. 2014, 36, 96–136. [Google Scholar] [CrossRef]
- Gab-Allah, M.A.; Choi, K.; Kim, B. Type B Trichothecenes in Cereal Grains and Their Products: Recent Advances on Occurrence, Toxicology, Analysis and Post-Harvest Decontamination Strategies. Toxins 2023, 15, 85. [Google Scholar] [CrossRef] [PubMed]
- Lebesi, D.; Dimakou, C.; Alldrick, A.J.; Oreopoulou, V. Rapid test methods: A versatile tool to assist food-safety management. Qual. Assur. Saf. Crops Foods 2010, 2, 173–181. [Google Scholar] [CrossRef]
- Markets and Markets Research. Mycotoxin Testing Market by Type (Aflatoxins, Ochratoxin, Fumonisins, Zearalenone, Deoxynivalenol, Trichothecenes, Patulin), Technology (Chromatography- & Spectroscopy-Based, Immunoassay-Based), Sample (Feed & Food), and Region—Global Forecast to 2025. 2021. Available online: https://www.marketsandmarkets.com/Market-Reports/mycotoxin-testing-market-229073477.html (accessed on 17 April 2023).
- Plotan, M.; Devlin, R.; Porter, J.; Benchikh, M.E.; RodRíguez, M.L.; McConnell, R.I.; Fitzgerald, S.P. The use of biochip array technology for rapid multimycotoxin screening. J. AOAC Int. 2016, 99, 878–889. [Google Scholar] [CrossRef] [PubMed]
- EU. Commission Regulation (EU) No 519/2014 of 16 May 2014 Amending Regulation (EC) No 401/2006 as Regards Methods of Sampling of Large Lots, Spices and Food Supplements, Performance Criteria for T-2, HT-2 Toxin and Citrinin and Screening Methods of Analysis 2014. Available online: https://op.europa.eu/en/publication-detail/-/publication/5a9dcba3-dd8b-11e3-8cd4-01aa75ed71a1/language-en (accessed on 17 April 2023).
- EC. Commission Regulation (EC) No 401/2006 of 23 February 2006 Laying Down the Methods of Sampling and Analysis for the Official Control of the Levels of Mycotoxins in Foodstuffs 2006. Available online: https://eur-lex.europa.eu/legal-content/EN/TXT/PDF/?uri=CELEX:32006R0401&from=EN (accessed on 2 December 2021).
- Sulyok, M.; Stadler, D.; Steiner, D.; Krska, R. Validation of an LC-MS/MS-based dilute-and-shoot approach for the quantification of >500 mycotoxins and other secondary metabolites in food crops: Challenges and solutions. Anal. Bioanal. Chem. 2020, 412, 2607–2620. [Google Scholar] [CrossRef] [PubMed]
- Steiner, D.; Krska, R.; Malachová, A.; Taschl, I.; Sulyok, M. Evaluation of Matrix Effects and Extraction Efficiencies of LC-MS/MS Methods as the Essential Part for Proper Validation of Multiclass Contaminants in Complex Feed. J. Agric. Food Chem. 2020, 68, 3868–3880. [Google Scholar] [CrossRef] [PubMed]
- EC. SANTE/11312/202—Guidance Document on Analytical Quality Control and Method Validation Procedures for Pesticide Residues and Analysis in Food and Feed 2021. Available online: https://food.ec.europa.eu/system/files/2022-02/pesticides_mrl_guidelines_wrkdoc_2021-11312.pdf (accessed on 20 April 2023).
- The European Committee for Standarization. Food Analysis—Performance Criteria for Single Laboratory Validated Methods of Analysis for the Determination of Mycotoxins. 2010. Available online: https://standards.iteh.ai/catalog/standards/cen/46238075-7d9b-4e55-9c3e-0ff8781fa565/cen-tr-16059-2010. (accessed on 20 April 2023).
- EC. Commission Decision of 12 August 2002 Implementing Council Directive 96/23/EC Concerning the Performance of Analytical Methods and the Interpretation of Results (2002/657/EC) 2002. Available online: https://op.europa.eu/en/publication-detail/-/publication/ed928116-a955-4a84-b10a-cf7a82bad858/language-en (accessed on 20 April 2023).
- Nolan, P.; Auer, S.; Spehar, A.; Elliott, C.T.; Campbell, K. Current trends in rapid tests for mycotoxins. Food Addit. Contam. Part A Chem. Anal. Control Expo. Risk Assess. 2019, 36, 800–814. [Google Scholar] [CrossRef] [PubMed]
- Li, W.; Powers, S.; Dai, S.Y. Using commercial immunoassay kits for mycotoxins: ‘Joys and sorrows’? World Mycotoxin J. 2014, 7, 417–430. [Google Scholar] [CrossRef]


| Sample ID | Sample Type | LC-MS/MS | Test Kit 1 | Test Kit 2 | Test Kit 3 | Test Kit 4 |
|---|---|---|---|---|---|---|
| (µg/kg) | ||||||
| 1 | Processed | 6.2 | 17.8 | 13.5 | 35.2 | 10.5 |
| 2 | Processed | 7.8 | 23.8 | 16.4 | 33.4 | 20.7 |
| 3 | Processed | 7.6 | 37.4 | 20.6 | 36.5 | 14.1 |
| 5 | Processed | 33.2 | 27.1 | 38.9 | 48.2 | 24.5 |
| 6 | Processed | 14.3 | 0 | 28.2 | 38.2 | 15.1 |
| 7 | Processed | 0.5 | 0 | 0 | 27.9 | 8.6 |
| 8 | Processed | 49.4 | 246.2 | 48.5 | 62.2 | 41.0 |
| 9 | Processed | 1.0 | 0 | 15.8 | 0 | 8.2 |
| 10 | Processed | 18.0 | 31.8 | 36.9 | 53.5 | 26.6 |
| 11 | Processed | 26.7 | 0 | 31.8 | 35.4 | 24.7 |
| 12 | Processed | 7.1 | 0 | 16.5 | 32.3 | 16.5 |
| 13 | Processed | 1.8 | 0 | 10.6 | 26.5 | 17.8 |
| 14 | Processed | 6.8 | 0 | 15.8 | 37.5 | 22.2 |
| 15 | Processed | 9.1 | 0 | 18 | 36.8 | 15.3 |
| 16 | Processed | 38.8 | 13.9 | 38.1 | 40.6 | 29.6 |
| 17 | Processed | 11.7 | 0 | 18.4 | 34.1 | 17.6 |
| 18 | Processed | 22.4 | 6.3 | 37.3 | 40.9 | 34.0 |
| 19 | Processed | 16.1 | 11.8 | 15.8 | 33.4 | 22.0 |
| 20 | Processed | 38.0 | 0 | 47.9 | 53 | 36.1 |
| 21 | Processed | 16.2 | 29.4 | 22.3 | 38.2 | 18.9 |
| 22 | Processed | 5.2 | 1.4 | 23.5 | 26.2 | 13.0 |
| 23 | Processed | 49.4 | 0.7 | 42.2 | 51.8 | 31.2 |
| 24 | Processed | 22.7 | 0 | 25.5 | 40.6 | 31.7 |
| 25 | Processed | 13.7 | 8.9 | 8.6 | 37.3 | 29.0 |
| 27 | Processed | 46.9 | 5.4 | 43 | 53 | 33.4 |
| 28 | Processed | 22.7 | 40.3 | 31.2 | 45.7 | 12.9 |
| 29 | Processed | 4.2 | 69.3 | 6.7 | 27 | 45.4 |
| 30 | Processed | 20.7 | 43 | 40.8 | 43.6 | 20.1 |
| 31 | Processed | 9.5 | 101.5 | 19.2 | 29.2 | 18.0 |
| 32 | Processed | 3.3 | 216.7 | 9.7 | 27.4 | 14.5 |
| 33 | Processed | 0.0 | 0 | 10.9 | 0 | 13.5 |
| 34 | Processed | 2.9 | 4.7 | 15.3 | 27.8 | 44.0 |
| 35 | Processed | 16.3 | 62.9 | 12.7 | 29.2 | 12.6 |
| 36 | Processed | 1.0 | 0.92 | 5.3 | 0 | 23.4 |
| 37 | Processed | 15.3 | 8.5 | 24.1 | 33 | 15.2 |
| 38 | Processed | 2.0 | 0 | 15.3 | 0 | 8.0 |
| 39 | Processed | 4.7 | 0.47 | 0 | 0 | 8.4 |
| 40 | Processed | 0.0 | 0 | 9.8 | 0 | 10.6 |
| 41 | Processed | 1.2 | 0.89 | 8.5 | 0 | 6.8 |
| 42 | Processed | 3.8 | 0 | 14.4 | 28.6 | 16.4 |
| 43 | Processed | 0.2 | 3.5 | 0 | 0 | 8.5 |
| 45 | Processed | 42.2 | 42.5 | 40.2 | 43.2 | 29.5 |
| 48 | Processed | 3.0 | 0 | 1.2 | 0 | 18.0 |
| 50 | Processed | 0.0 | 80.9 | 0 | 0 | 6.9 |
| 53 | Unprocessed | 790.4 | 966 | 377.2 | 439.4 | 336.4 |
| 56 | Unprocessed | 1105.1 | 1166.5 | 690 | 864 | 758.2 |
| 57 | Unprocessed | 404.2 | 319.7 | 471.8 | 429.6 | 380.9 |
| 58 | Unprocessed | 895.3 | 690.5 | 442.4 | 476.2 | 448.0 |
| 59 | Unprocessed | 353.2 | 523 | 261.4 | 190 | 237.1 |
| 63 | Unprocessed | 488.8 | 686.5 | 395.2 | 420.2 | 509.4 |
| 68 | Unprocessed | 513.7 | 764.5 | 351.4 | 540.2 | 452.1 |
| 71 | Unprocessed | 839.6 | 1122.5 | 966.1 | >range | 641.8 |
| 72 | Unprocessed | 45.8 | 76.8 | 84.6 | 55.4 | 49.9 |
| 74 | Unprocessed | 506.7 | 608 | 424.3 | 542.6 | 381.1 |
| 76 | Unprocessed | 13.7 | 0 | 7.2 | 0 | 16.9 |
| 77 | Unprocessed | 578.0 | 610 | 394.3 | 449.8 | 383.4 |
| 80 | Unprocessed | 582.9 | 717 | 80.5 | 94 | 78.4 |
| 81 | Unprocessed | 482.3 | 656.5 | 561.5 | 628.6 | 484.7 |
| 83 | Unprocessed | 1024.8 | 694 | 506.8 | 619.5 | 429.7 |
| 85 | Unprocessed | 388.8 | 572.5 | 532.6 | 346.1 | 425.4 |
| 86 | Unprocessed | 387.3 | 355 | 303.8 | 307.1 | 247.8 |
| 88 | Unprocessed | 536.2 | 474.5 | 286.2 | 521 | 350.9 |
| 90 | Unprocessed | 1025.0 | 1354.5 | 986 | 1454.4 | 718.7 |
| 93 | Unprocessed | 395.0 | 217.5 | 283.5 | 368 | 437.7 |
| 96 | Unprocessed | 1080.0 | 1173.5 | 755.1 | 1020 | 913.0 |
| 100 | Unprocessed | 0.0 | 1129.3 | >range | >range | 5092.4 |
| 101 | Unprocessed | 55.4 | 21.1 | 42.1 | 37.1 | 28.4 |
| 108 | Unprocessed | 80.9 | 21.8 | 0 | 0 | 10.2 |
| 116 | Unprocessed | 8.2 | 1.2 | 0 | 0 | 28.6 |
| 117 | Unprocessed | 458.2 | 416 | 317.9 | 503.8 | 297.5 |
| 118 | Unprocessed | 417.8 | 487.5 | 270.3 | 481.4 | 337.7 |
| 130 | Unprocessed | 0.0 | 0 | 6.1 | 0 | 19.0 |
| 134 | Unprocessed | 3993.3 | 1477 | 1461.5 | >range | 2919.4 |
| 137 | Unprocessed | 503.1 | 863.5 | 360.5 | 496.4 | 302.2 |
| 142 | Unprocessed | 463.6 | 560.1 | 425.1 | 490 | 223.9 |
| 148 | Unprocessed | 162.7 | 111.7 | 116.6 | 129 | 62.4 |
| 150 | Unprocessed | 14.3 | 124.9 | 33.6 | 65.2 | 54.5 |
| 151 | Unprocessed | 66.8 | 134.8 | 133.1 | 105.8 | 75.0 |
| 154 | Unprocessed | 1114.6 | 1148 | 972.7 | 1497.9 | 985.5 |
| 155 | Unprocessed | 808.5 | 625.5 | 461.3 | 736.2 | 629.5 |
| 157 | Unprocessed | 768.0 | 1319 | 676.8 | >range | 694.8 |
| 164 | Unprocessed | 424.7 | 478 | 515.9 | 457.6 | 256.1 |
| 165 | Unprocessed | 9.4 | 36.1 | 46.3 | 50.2 | 28.5 |
| 167 | Unprocessed | 1427.7 | 487 | 62.1 | 172.8 | <range |
| 169 | Unprocessed | 288.4 | 268.6 | 281.4 | 227.3 | 181.3 |
| 178 | Unprocessed | 532.2 | 490 | 348.9 | 438.6 | 359.0 |
| 179 | Unprocessed | 1095.1 | 1452 | 949.9 | 1271.4 | 796.6 |
| 180 | Unprocessed | 499.8 | 369 | 313 | 296.6 | 282.0 |
| 184 | Unprocessed | 846.3 | 344.5 | 378.6 | 383.8 | 346.6 |
| 189 | Unprocessed | 606.6 | 642 | 440 | 514.8 | 530.9 |
| 195 | Unprocessed | 2583.0 | 2384.5 | 2331.1 | 3218 | 2962.2 |
| 198 | Unprocessed | 1458.6 | 562.5 | 12.8 | 132 | <range |
| 201 | Unprocessed | 553.2 | Invalid | 396.9 | 517 | 317.0 |
| 205 | Unprocessed | 1383.5 | 832 | Invalid | 1011.2 | 905.9 |
| 216 | Unprocessed | 499.3 | 490.7 | 515 | 614.8 | 525.8 |
| 218 | Unprocessed | 345.0 | 489.6 | 288.4 | 303.9 | 321.0 |
| 223 | Unprocessed | 0.0 | 0 | 8 | 0 | 8.1 |
| 227 | Unprocessed | 2964.6 | 1284.5 | 477.2 | 1616 | 1299.4 |
| 229 | Unprocessed | 17.5 | 264.1 | 42.1 | 42.5 | 30.6 |
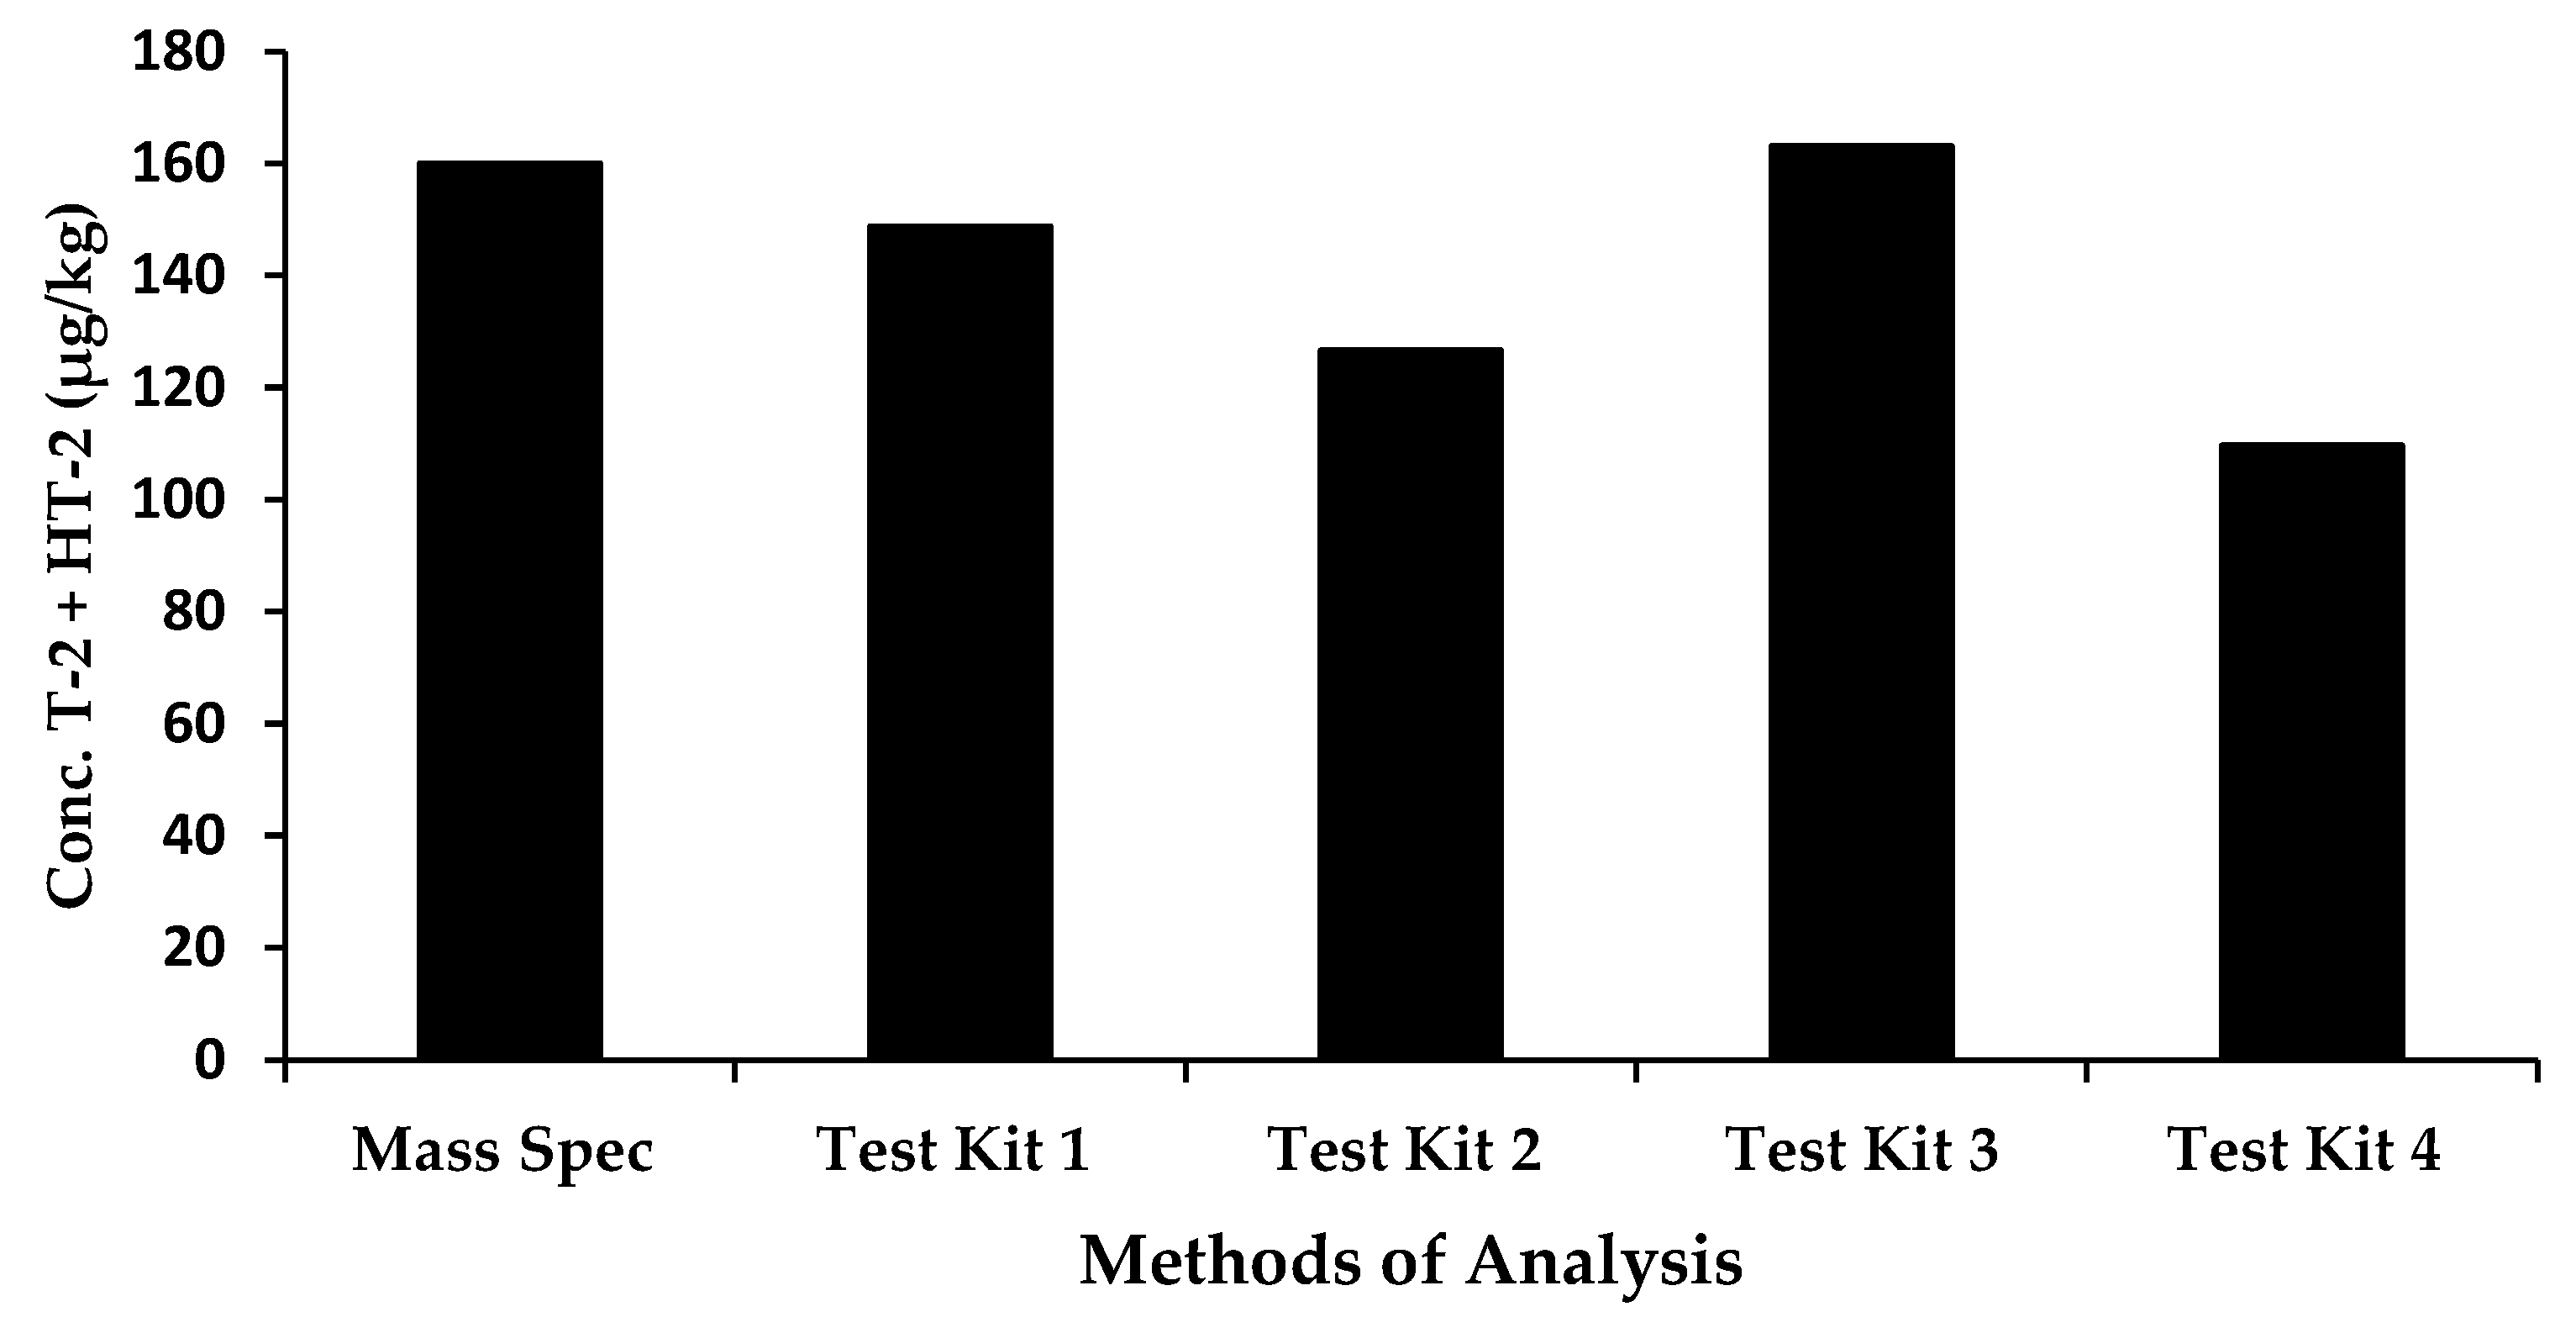
| ERM | Processed | 160 | 148.8 | 126.6 | 163.1 | 109.7 |
| LC-MS/MS | ||||
|---|---|---|---|---|
| Positive | Negative | Total | ||
| Test Kit 1 | Positive | 7 | 2 | 9 |
| Negative | 1 | 82 | 83 | |
| Total | 8 | 84 | 92 | |
| Cohen’s Kappa (K) | 0.81 | |||
| Test Kit 2 | Positive | 1 | 0 | 1 |
| Negative | 7 | 84 | 91 | |
| Total | 8 | 84 | 92 | |
| Cohen’s Kappa (K) | 0.21 | |||
| Test Kit 3 | Positive | 6 | 0 | 6 |
| Negative | 2 | 84 | 86 | |
| Total | 8 | 84 | 92 | |
| Cohen’s Kappa (K) | 0.85 | |||
| Test Kit 4 | Positive | 2 | 0 | 2 |
| Negative | 6 | 84 | 90 | |
| Total | 8 | 84 | 92 | |
| Cohen’s Kappa (K) | 0.38 | |||
| Rapid Test Kit | Number of False Positives | False Positive Rate (%) | Number of FalseNegatives | False Negative Rate (%) |
|---|---|---|---|---|
| Test Kit 1 | 2 | 2.2 | 1 | 1.1 |
| Test Kit 2 | 0 | 0 | 7 | 7.6 |
| Test Kit 3 | 0 | 0 | 2 | 2.2 |
| Test Kit 4 | 0 | 0 | 6 | 6.5 |
| Rapid Test Kit | Number of False Positives | False Positive Rate (%) | Number of False Negatives | False Negative Rate (%) |
|---|---|---|---|---|
| Test Kit 1 | 11 | 12 | 3 | 3.3 |
| Test Kit 2 | 4 | 4.3 | 13 | 14.1 |
| Test Kit 3 | 7 | 7.6 | 7 | 7.6 |
| Test Kit 4 | 2 | 2.2 | 11 | 12 |
| Test Kit 1 | Test Kit 2 | Test Kit 3 | Test Kit 4 | |
|---|---|---|---|---|
| Matrix–oats | Yes | No | No | Yes |
| Limit of detection | 50 ppb | 10 ppb | 50 ppb | 12 ppb |
| Quantification range | 50–3000 ppb | 10–800 ppb | 50–500 ppb | 10–360 ppb |
| Test time * | 5 min | 5 min | 5 min | 45 min |
| Ease of use | Easy | Easy | Easy | Technical skills required |
| Kit reagents supplied | All supplied | No extraction buffer | All supplied | All supplied |
| Cost per analysis | GBP 7.20 | GBP 16.80 | GBP 7.40 | GBP 7.44 |
| False negative rate (%) | 1.1 | 7.6 | 2.2 | 6.5 |
| False positive rate (%) | 2.2 | 0 | 0 | 0 |
| Recovery (ERM sample) (%) | 93 | 79 | 102 | 69 |
| Analyte | Precursor Ion (m/z) | Product Ion (m/z) | Declustering Potential (DV) | Collision Energy (eV) | Collision Cell Exit Potential |
|---|---|---|---|---|---|
| Aflatoxin B1 | 313.061 313.061 | 285.1 241.1 | 121 121 | 33 53 | 14 14 |
| Aflatoxin B2 | 315.074 315.074 | 287.2 259.1 | 141 141 | 37 41 | 14 14 |
| Aflatoxin G1 | 329.055 329.055 | 243.2 311.1 | 131 131 | 37 31 | 18 16 |
| Aflatoxin G2 | 331.057 331.057 | 313 245.2 | 106 106 | 35 41 | 16 14 |
| Deoxynivalenol | 297.097 297.097 | 249.1 203.2 | 91 91 | 21 21 | 20 20 |
| Fumonisin B1 | 722.316 722.316 | 704.3 334.4 | 1 1 | 41 53 | 38 10 |
| Fumonisin B2 | 706.309 706.309 | 336.1 354.3 | 126 126 | 49 47 | 20 18 |
| Ochratoxin A | 404.092 404.092 | 239 358.1 | 81 81 | 33 21 | 12 18 |
| T-2 Toxin | 484.3 484.3 | 215.2 185.1 | 76 76 | 29 31 | 18 11 |
| HT-2 Toxin | 442.257 442.257 | 263.102 215.102 | 71 71 | 19 19 | 14 22 |
| Zearalenone | 317.1 317.1 | 175 131.1 | −100 −100 | −34 −42 | −13 −8 |
| Time (min) | MPA (%) | MPB (%) |
|---|---|---|
| 0 | 99 | 1 |
| 1.0 | 99 | 1 |
| 3.0 | 50 | 50 |
| 9.0 | 1 | 99 |
| 11.5 | 1 | 99 |
| 12.0 | 99 | 1 |
| 14.0 | 99 | 1 |
| Mycotoxin | HL Spike (μg/kg) | LL Spike (μg/kg) |
|---|---|---|
| Aflatoxin B1 | 5 | 1 |
| Aflatoxin B2 | 5 | 1 |
| Aflatoxin G1 | 5 | 1 |
| Aflatoxin G2 | 5 | 1 |
| Fumonisin B1 | 200 | 40 |
| Fumonisin B2 | 200 | 40 |
| Deoxynivalenol | 200 | 40 |
| Zearalenone | 200 | 40 |
| Ochratoxin A | 10 | 2 |
| T-2 toxin | 200 | 40 |
| HT-2 toxin | 200 | 40 |
| Analyte | Mean Conc. (µg/kg) | StdDev | RSD (%) | RA (%) | RE (%) | LOD (ppb) | LOQ (ppb) |
|---|---|---|---|---|---|---|---|
| Aflatoxin B1 | 4.7 | 0.2 | 5.1% | 93.7% | 94.0% | 0.1 | 0.5 |
| Aflatoxin B2 | 5.1 | 0.3 | 6.0% | 102.5% | 96.8% | 0.2 | 0.7 |
| Aflatoxin G1 | 2.9 | 0.3 | 10.6% | 57.9% | 88.4% | 0.1 | 0.4 |
| Aflatoxin G2 | 3.3 | 0.3 | 9.2% | 65.9% | 91.3% | 0.1 | 0.5 |
| Deoxynivalenol | 191.2 | 6.2 | 3.2% | 95.6% | 100.8% | 3.7 | 12.4 |
| Fumonisin B1 | 153.2 | 12.5 | 8.2% | 76.6% | 83.5% | 4.2 | 13.8 |
| Fumonisin B2 | 168.9 | 10.6 | 6.3% | 84.5% | 86.9% | 2.6 | 8.7 |
| Ochratoxin A | 9.2 | 0.4 | 4.2% | 91.9% | 95.3% | 0.3 | 1.0 |
| T-2 Toxin | 187.2 | 4.5 | 2.4% | 93.6% | 98.5% | 3.4 | 11.4 |
| HT-2 Toxin | 188.1 | 4.8 | 2.6% | 94.1% | 97.7% | 4.1 | 13.6 |
| Zearalenone | 186.1 | 6.3 | 3.4% | 93.1% | 99.5% | 1.8 | 6.1 |
| Test Kit 1 | Test Kit 2 | Test Kit 3 | Test Kit 4 | |
|---|---|---|---|---|
| Sample size | 10 ± 0.1 g | 5 ± 0.1 g | 10 g | 5 g |
| Extraction | Add extraction powder. Add 50 mL distilled or deionized water. Shake vigorously for 3 min or blend for 1 min. Filter or centrifuge for 30 s at 2000× g. | Add 25 mL extraction buffer. Vortex for 2 min. Filter (≤5 min). | Add extraction powder. Add 37 mL distilled or deionized water. Shake for 1 min 30 s. Filter. | Add 25 mL of ready-to-use extraction buffer. Shake the sample for 10 min. Centrifuge for 10 min at 3000× g |
| Analysis | Mix 100 μL extract with 1500 μL sample diluent. Insert a test strip into the cartridge. Insert the cartridge into the reader. The barcode is read. Enter a sample ID. Add 400 μL sample extract. | Transfer 100 μL of filtered extract to the LFD sample well. Develop for 5 min. Insert the LFD into the reader. | Mix 600 μL of running buffer with 100 μL of sample extract. Transfer 150 μL to a tube and add the test strip. Develop for 5 min. Insert the test strip into the reader. | Dilute the supernatant 1:1 with methanol/distilled water (70/30; v/v). To 50 μL of standard or sample in separate duplicate wells, add 50 μL conjugate and 50 μL antibody. Mix and incubate at room temperature for 30 min. Wash 3 times with 250 μL wash buffer. Add 100 μL of substrate/chromogen to each well, mix and incubate for 15 min at room temperature in the dark. Add 100 μL of the stop solution to each well. Measure the absorbance at 450 nm. |
| Results | Results are displayed on the reader screen. Calibration cartridges are provided by the manufacturer. | Results are displayed on the reader screen. Automatic calibration through the barcode and lot ID of the strips. | Results are displayed on the reader screen. Automatic calibration through the barcode and lot ID of the strips. | Evaluation of results through software (absorbance values of the samples interpolated against those of the calibration curve). Calibration curve performed by the analyst using standards provided. |
Disclaimer/Publisher’s Note: The statements, opinions and data contained in all publications are solely those of the individual author(s) and contributor(s) and not of MDPI and/or the editor(s). MDPI and/or the editor(s) disclaim responsibility for any injury to people or property resulting from any ideas, methods, instructions or products referred to in the content. |
© 2023 by the authors. Licensee MDPI, Basel, Switzerland. This article is an open access article distributed under the terms and conditions of the Creative Commons Attribution (CC BY) license (https://creativecommons.org/licenses/by/4.0/).
Share and Cite
Meneely, J.; Greer, B.; Kolawole, O.; He, Q.; Elliott, C. Comparative Performance of Rapid Diagnostics for the Detection of T-2 and HT-2 Toxins in Oats. Molecules 2023, 28, 6657. https://doi.org/10.3390/molecules28186657
Meneely J, Greer B, Kolawole O, He Q, Elliott C. Comparative Performance of Rapid Diagnostics for the Detection of T-2 and HT-2 Toxins in Oats. Molecules. 2023; 28(18):6657. https://doi.org/10.3390/molecules28186657
Chicago/Turabian StyleMeneely, Julie, Brett Greer, Oluwatobi Kolawole, Qiqi He, and Christopher Elliott. 2023. "Comparative Performance of Rapid Diagnostics for the Detection of T-2 and HT-2 Toxins in Oats" Molecules 28, no. 18: 6657. https://doi.org/10.3390/molecules28186657