Article

Electrochemical Determination of 17-β-Estradiol Using a Glassy Carbon Electrode Modified with α-Fe2O3 Nanoparticles Supported on Carbon Nanotubes

by
Juliana Costa Rolim Galvão
,
Mayara da Silva Araujo
,
Maiyara Carolyne Prete
,
Vanildo Leão Neto
,
Luiz Henrique Dall’Antonia
,
Roberto Matos
,
Cesar Ricardo Texeira Tarley
and
Roberta Antigo Medeiros
*
Department of Chemistry, State University of Londrina, Londrina 86057-970, PR, Brazil
*
Author to whom correspondence should be addressed.
Molecules 2023, 28(17), 6372; https://doi.org/10.3390/molecules28176372
Submission received: 28 July 2023 / Revised: 22 August 2023 / Accepted: 28 August 2023 / Published: 31 August 2023
(This article belongs to the Special Issue Advanced Electrochemical Methods in Molecular Detection)

Abstract

:
In this study, a novel electrochemical assay for determining 17-β-estradiol (E2) was proposed. The approach involves modifying a glassy carbon electrode (GCE) with a nanocomposite consisting of α-Fe2O3 nanoparticles supported on carbon nanotubes (CNTs)—denoted as α-Fe2O3-CNT/GCE. The synthesis of the α-Fe2O3-CNT nanocomposite was achieved through a simple and cost-effective hydrothermal process. Morphological and chemical characterization were conducted using scanning electron microscopy (SEM), Raman spectroscopy, and energy-dispersive X-ray spectroscopy (EDX). The presence of the α-Fe2O3-CNT film on the GCE surface resulted in an enhanced electrochemical response to E2, preventing electrode surface fouling and mitigating the decrease in peak current intensity during E2 oxidation. These outcomes substantiate the rationale behind the GCE modification. After the optimization of experimental conditions, E2 was determined by the square wave voltammetry technique using 0.1 mol L−1 KCl solution (pH = 7.0) with 20% ethanol as a supporting electrolyte. A linear concentration range of 5.0–100.0 nmol L−1 and a low limit of detection of 4.4 nmol L−1 were obtained. The electroanalytical method using α-Fe2O3-CNT/GCE was applied for E2 determination in pharmaceutical, lake water, and synthetic urine samples. The obtained results were attested by recovery tests and by high-performance liquid chromatography as a comparative technique at a 95% confidence level. Thus, the developed electrochemical sensor is simple and fast to obtain, presents high accuracy, and is viable for determining E2 in routine analysis.

Graphical Abstract

1. Introduction

In the last several years, the effect of endocrine-disrupting compounds in animal and human systems has drawn the attention of scientists, research communities, and the public. They do this by imitating the biological functions of natural hormones, occupying hormonal receptors, and disrupting the transportation and metabolic processes of these natural hormones [1,2]. The 17-β-estradiol hormone (E2) is an estrogen with significant endocrine-disrupting capabilities. It is produced in the ovaries and is responsible for maintaining the menstrual cycle, reproductive system, and lipid metabolism. It also plays a role in the growth and development of the skin, brain, and sinus tissue. Additionally, E2 is present in the testicles and is important for maintaining bone structure and sperm production [3]. Moreover, E2 is also used as a medication for hormone replacement therapy and contraceptives [4].
E2 is excreted daily by humans and released into aquatic environments and sewage effluents along with industrial waste, as water treatment systems do not completely remove this hormone and its derivatives. The bioaccumulation of E2 in fish, birds, and reptiles can lead to immune system complications and reproductive anomalies. When present at abnormal levels in humans, E2 can cause health problems such as ovary cancer, cirrhosis, hyperthyroidism, early puberty, hypertension, and polycystic ovary syndrome [3,5,6,7].
Hence, the detection of E2 using methods with high sensitivity and low detection limits is very important. In the literature, methods for determining E2 mainly employ gas [8] and liquid [9,10,11,12] chromatography. Most of these methods require tedious sample preparation and the analysis is very delayed.
Over the past few decades, electroanalytical methods have arisen as potent substitutes for conventional analysis techniques. The strength of these methods lies in their versatility and advantageous analytical capabilities, offering an array of benefits including cost-effectiveness, heightened sensitivity, portability, and user-friendliness. As a result, many electroanalytical methods stand as viable alternatives for E2 determination, owing to their uncomplicated instrumentation, economical nature, and the absence of intricate sample pre-treatment procedures or the necessity for toxic organic reagents [2].
In these studies, various electrodes are employed, with the majority being chemically modified using a range of nanomaterials. These include materials like wrinkled mesoporous carbon [13], molecularly imprinted polymer [14,15], multi-walled carbon nanotubes and gold nanoparticles [16], gold nanoparticles, graphene, and carbon nanotubes [17], graphene [6,18], graphene quantum dots [19], iron oxide [20,21,22,23], etc. However, some types of modified electrodes have complicated preparation steps and require the usage of expensive solvents or nanomaterials.
Therefore, in the present work, the primary objective is to propose a novel electroanalytical method utilizing a modified electrode with a nanocomposite obtained through a simple, less time-consuming, and cost-effective hydrothermal method.
Electrodes based on carbonaceous materials are widely used because they are inexpensive and readily available, have a broad potential range and low background current, and are chemically inert during electrochemical analysis [24,25]. Additionally, the modification of these electrodes with different materials can improve the selectivity and high detection limits of the electroanalytical methods. As a result, the use of chemically modified electrodes has significantly increased, leading to the need for exploring new materials that provide high surface area, stability, and excellent conductivity [26,27,28,29]. Among the most used materials were metallic oxides [30,31] and carbonaceous nanomaterials such as graphene nanosheets [32,33], and carbon nanotubes (CNTs) [34,35].
CNTs are cylindrical structures produced by the winding of graphene sheets composed of carbon atoms with sp2 hybridization in a hexagonal structure. They find wide applications in electrochemistry, primarily due to their conjugated π-bonds, which give them a steric bulkiness like an alkene with electron deficiency. Additionally, this material consists of hexagonal nets with high aromaticity, which enhances conductivity on its surface [36]. Therefore, CNTs are commonly employed in electrode modifications due to their large electrochemical window, excellent conductivity, expansive surface area, and stability, all amplifying electron transfer [17].
α-Fe2O3, a metal oxide, possesses great utility and finds applications in numerous fields like magnetic storage devices, supercapacitors, photocatalysts, and sensors [37,38]. It possesses advantageous qualities such as non-toxicity, biocompatibility, and affordability. Additionally, the α phase of this semiconductor is formed during the final stage of iron oxide synthesis, contributing to its exceptional chemical stability and resistance to corrosion [39,40]. In the literature, there are examples of the use of the α-Fe2O3 and CNT composites in the modification of electrodes. They have been primarily used for the electroanalytical determination of drugs [41,42,43].
In this context, the purpose of the present work was a novel assay of electrochemical E2 determination using a glassy carbon electrode (GCE) modified with a nanocomposite of α-Fe2O3 nanoparticles supported by CNTs, obtained by a simple and inexpensive hydrothermal synthesis.

2. Results

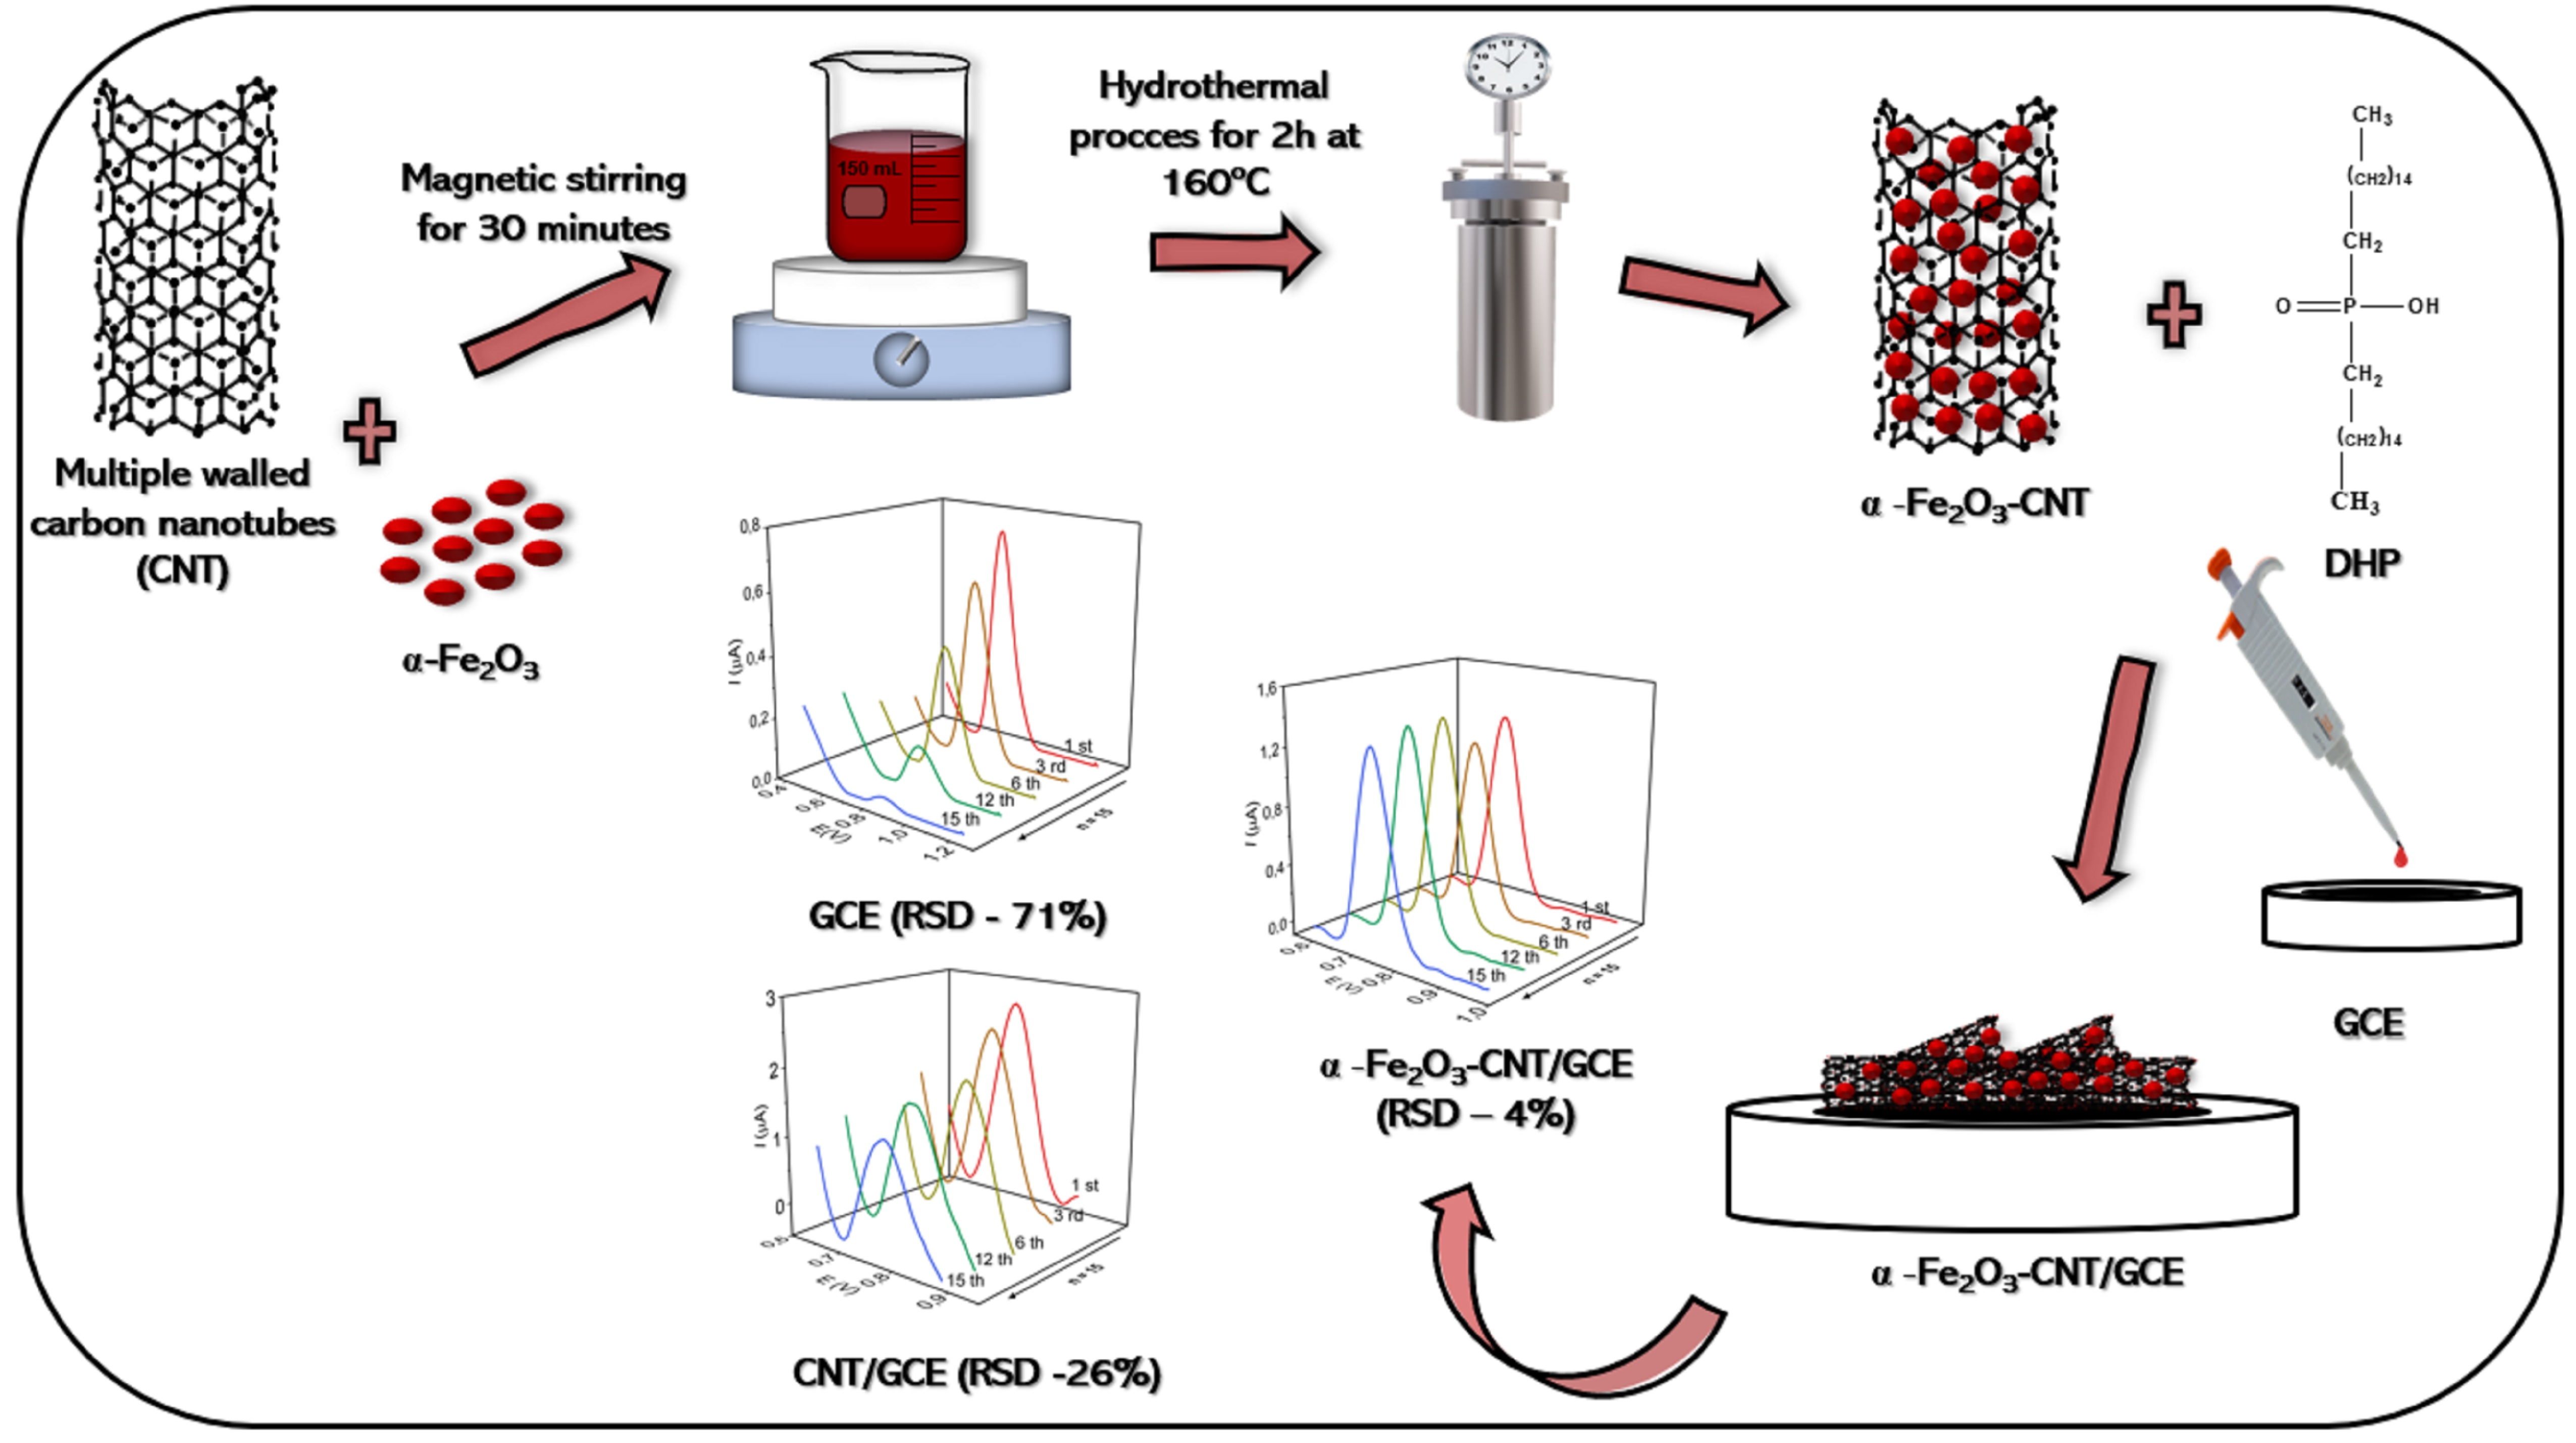
2.1. Chemical and Morphological Characterization of α-Fe2O3-CNT/GCE

Raman, SEM, and EDX were used to investigate the successful preparation of α-Fe2O3/CNT nanocomposite, and the results are shown in Figure 1. As can be seen from Figure 1A, in the Raman spectra of the CNTs the D and G band characteristics of this material for α-Fe2O3 observed bands located at 227, 294, and 407 cm−1 can be well assigned to Eg modes of Fe2O3 [44]. The Raman spectra obtained for α-Fe2O3-CNT show only the bands corresponding to Fe-O bonds, characteristic of this iron oxide. It was not possible to observe characteristic bands of carbonaceous materials in the region from 1330 to 1600 cm−1. This can be justified by the small region where the laser beam is incident on the materials, performing measurements in areas where no carbonaceous materials were present, and/or by the low concentration of these materials in the hydrothermal synthesis.
In EDX spectra (in Figure 1B), the presence of essentially three elements in the materials: carbon, iron, and oxygen, was observed, as expected [45]. This indicated that the synthesis of this material was satisfactory, and based on the intensities of the bands, a higher percentage of iron and oxygen compared to the carbonaceous material can be noted. This confirmed the initial proportions of the materials used, with a larger amount of the iron precursor when compared with CNTs. The SEM image (Figure 1C) obtained for α-Fe2O3-CNT showed a material in the form of rods with good homogeneity, and the CNTs were coated with α-Fe2O3.

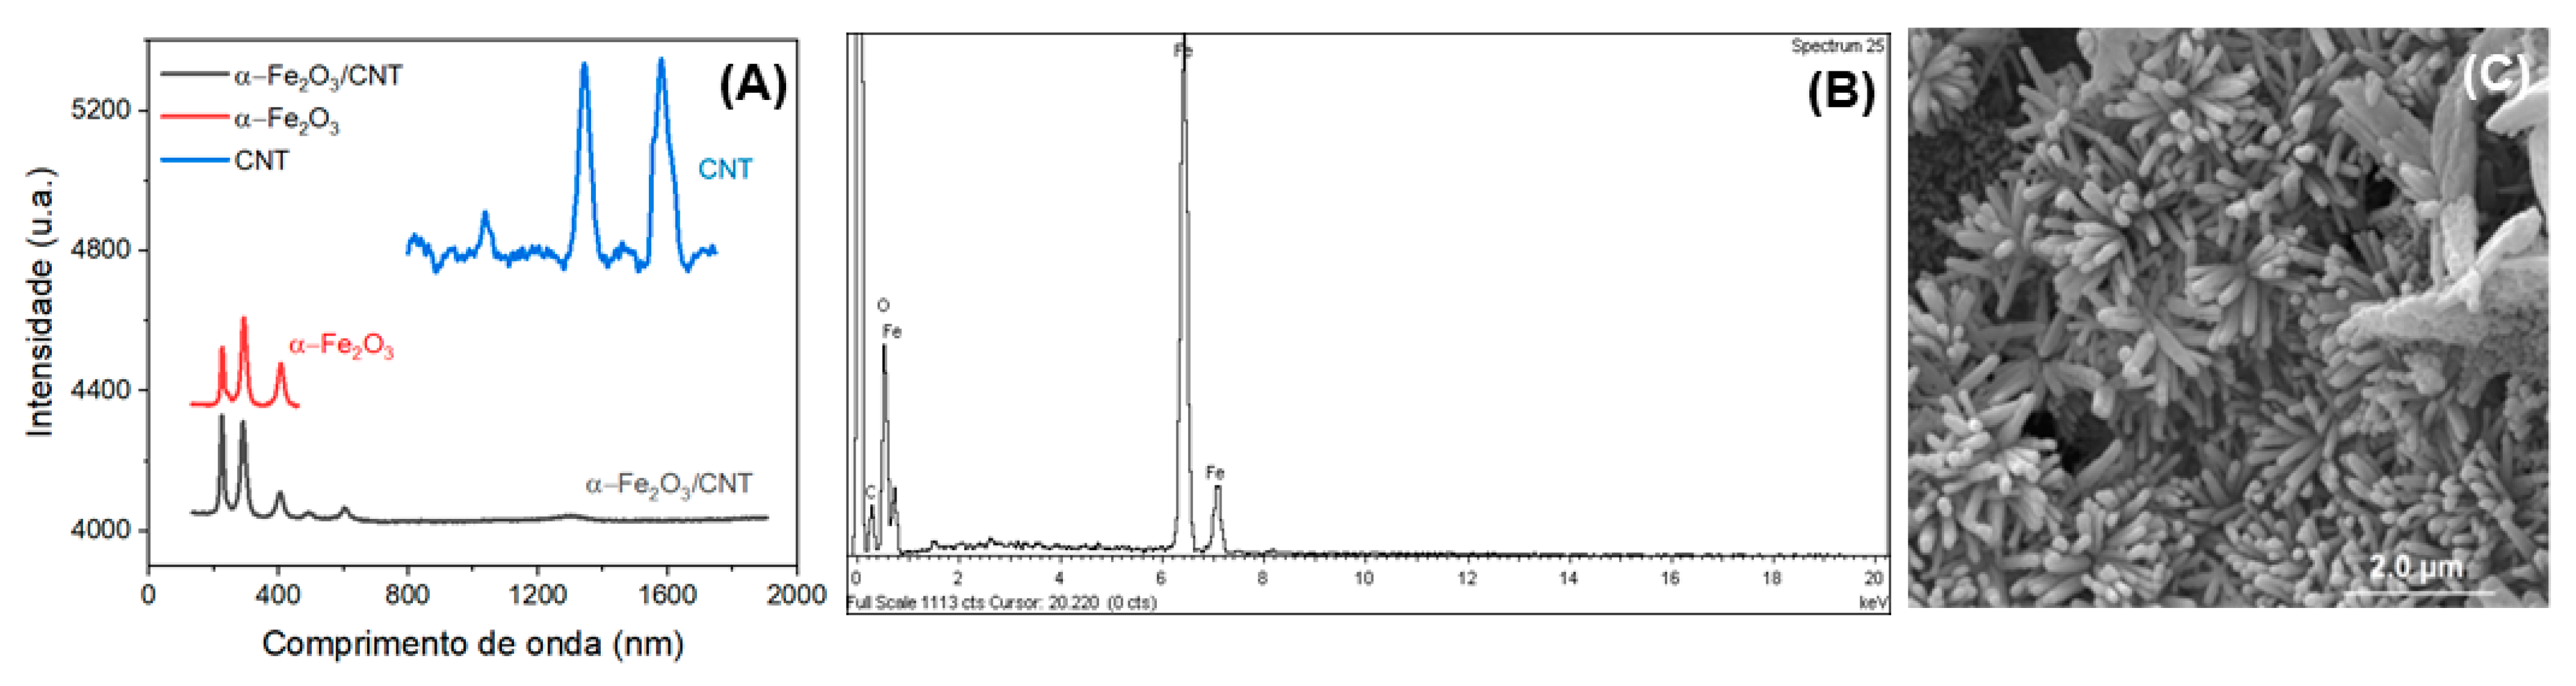
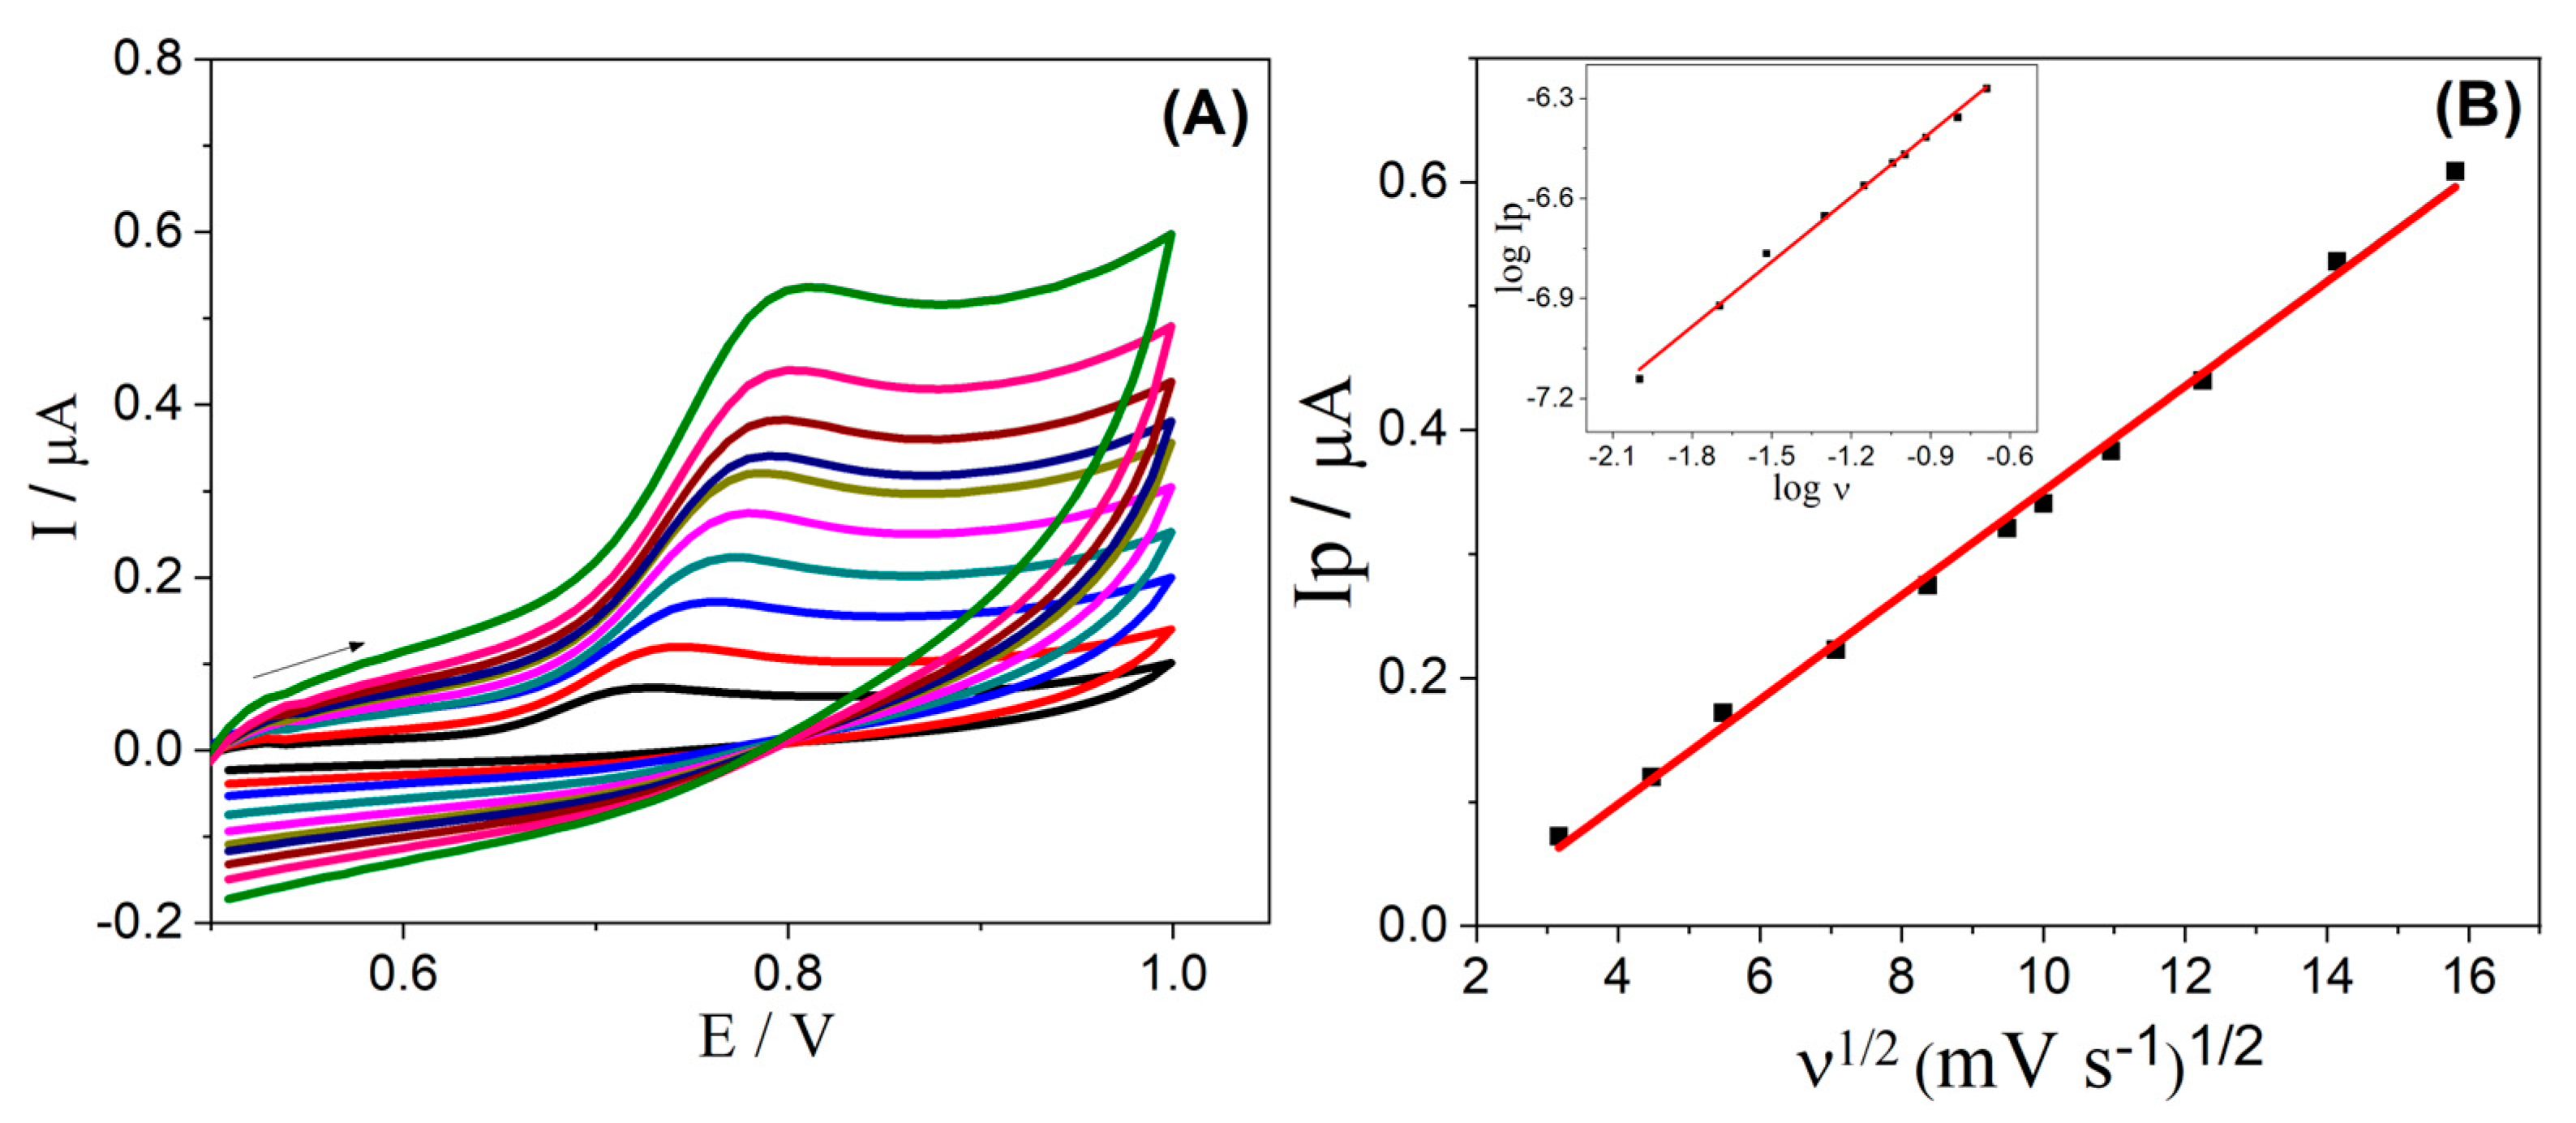
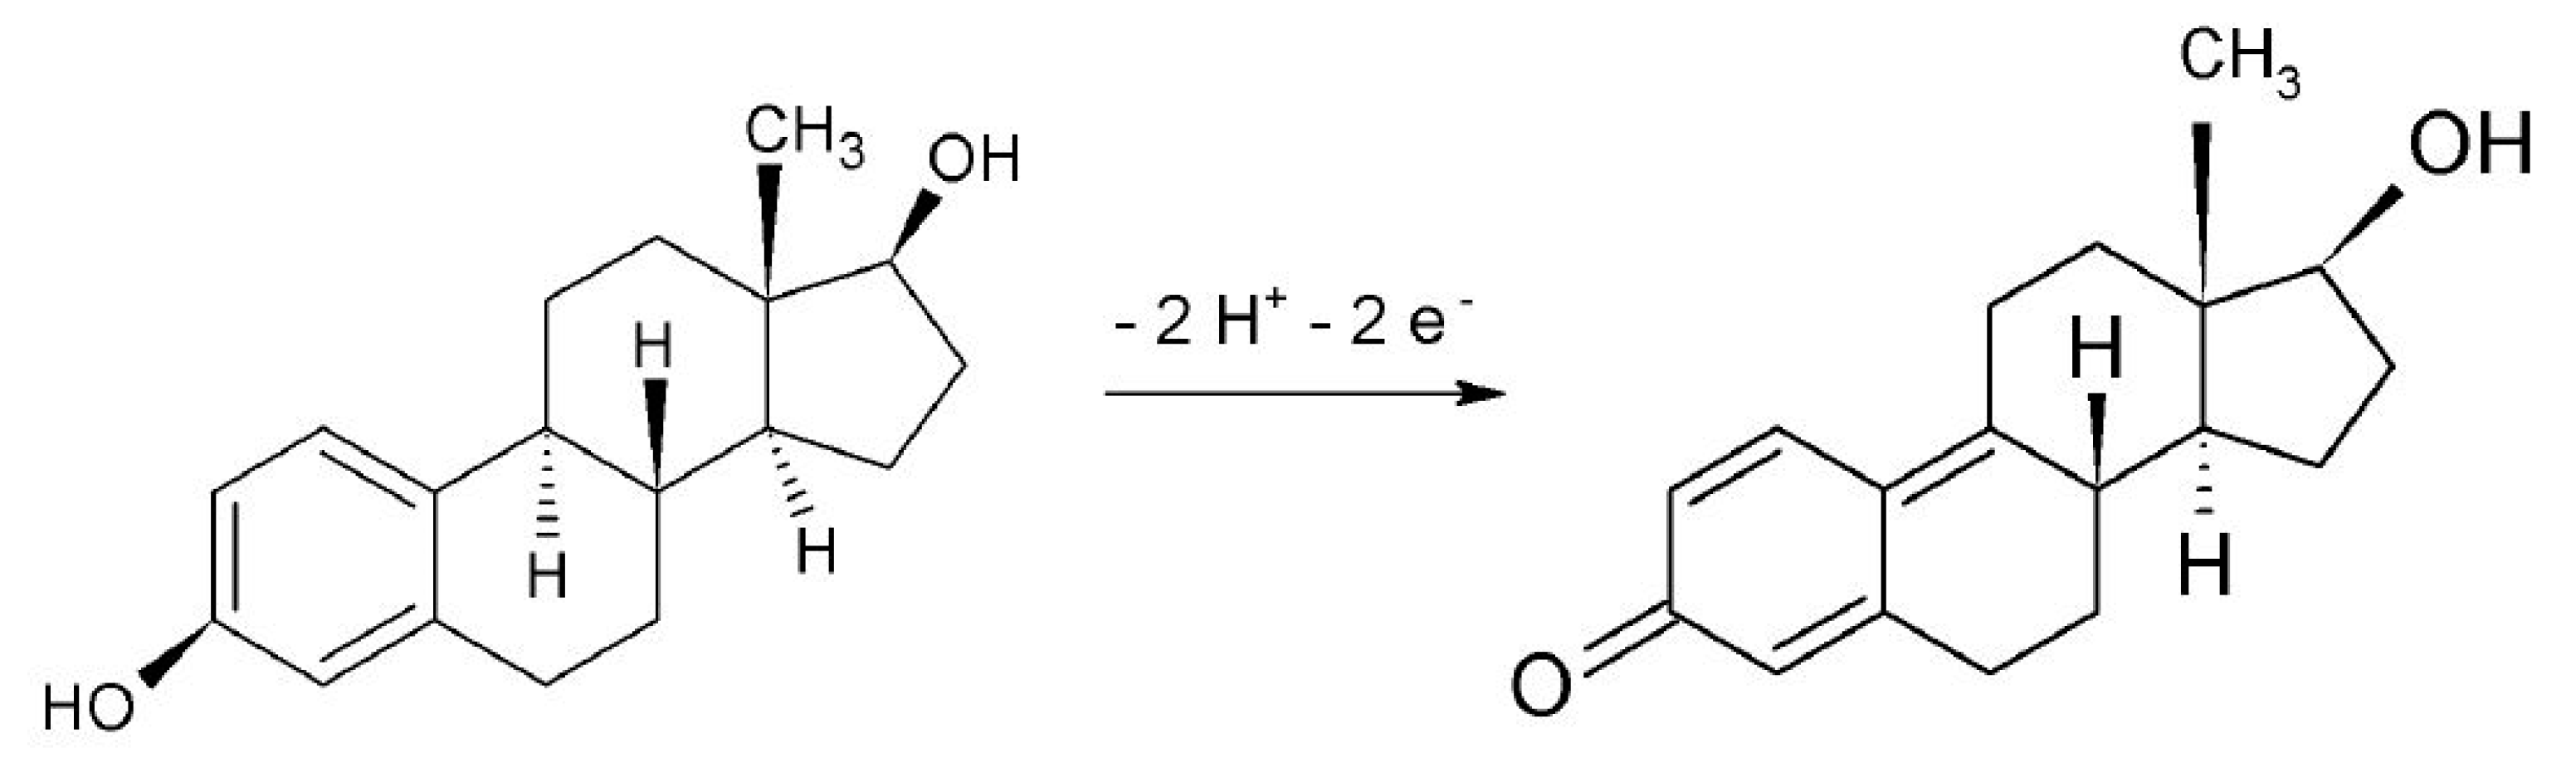
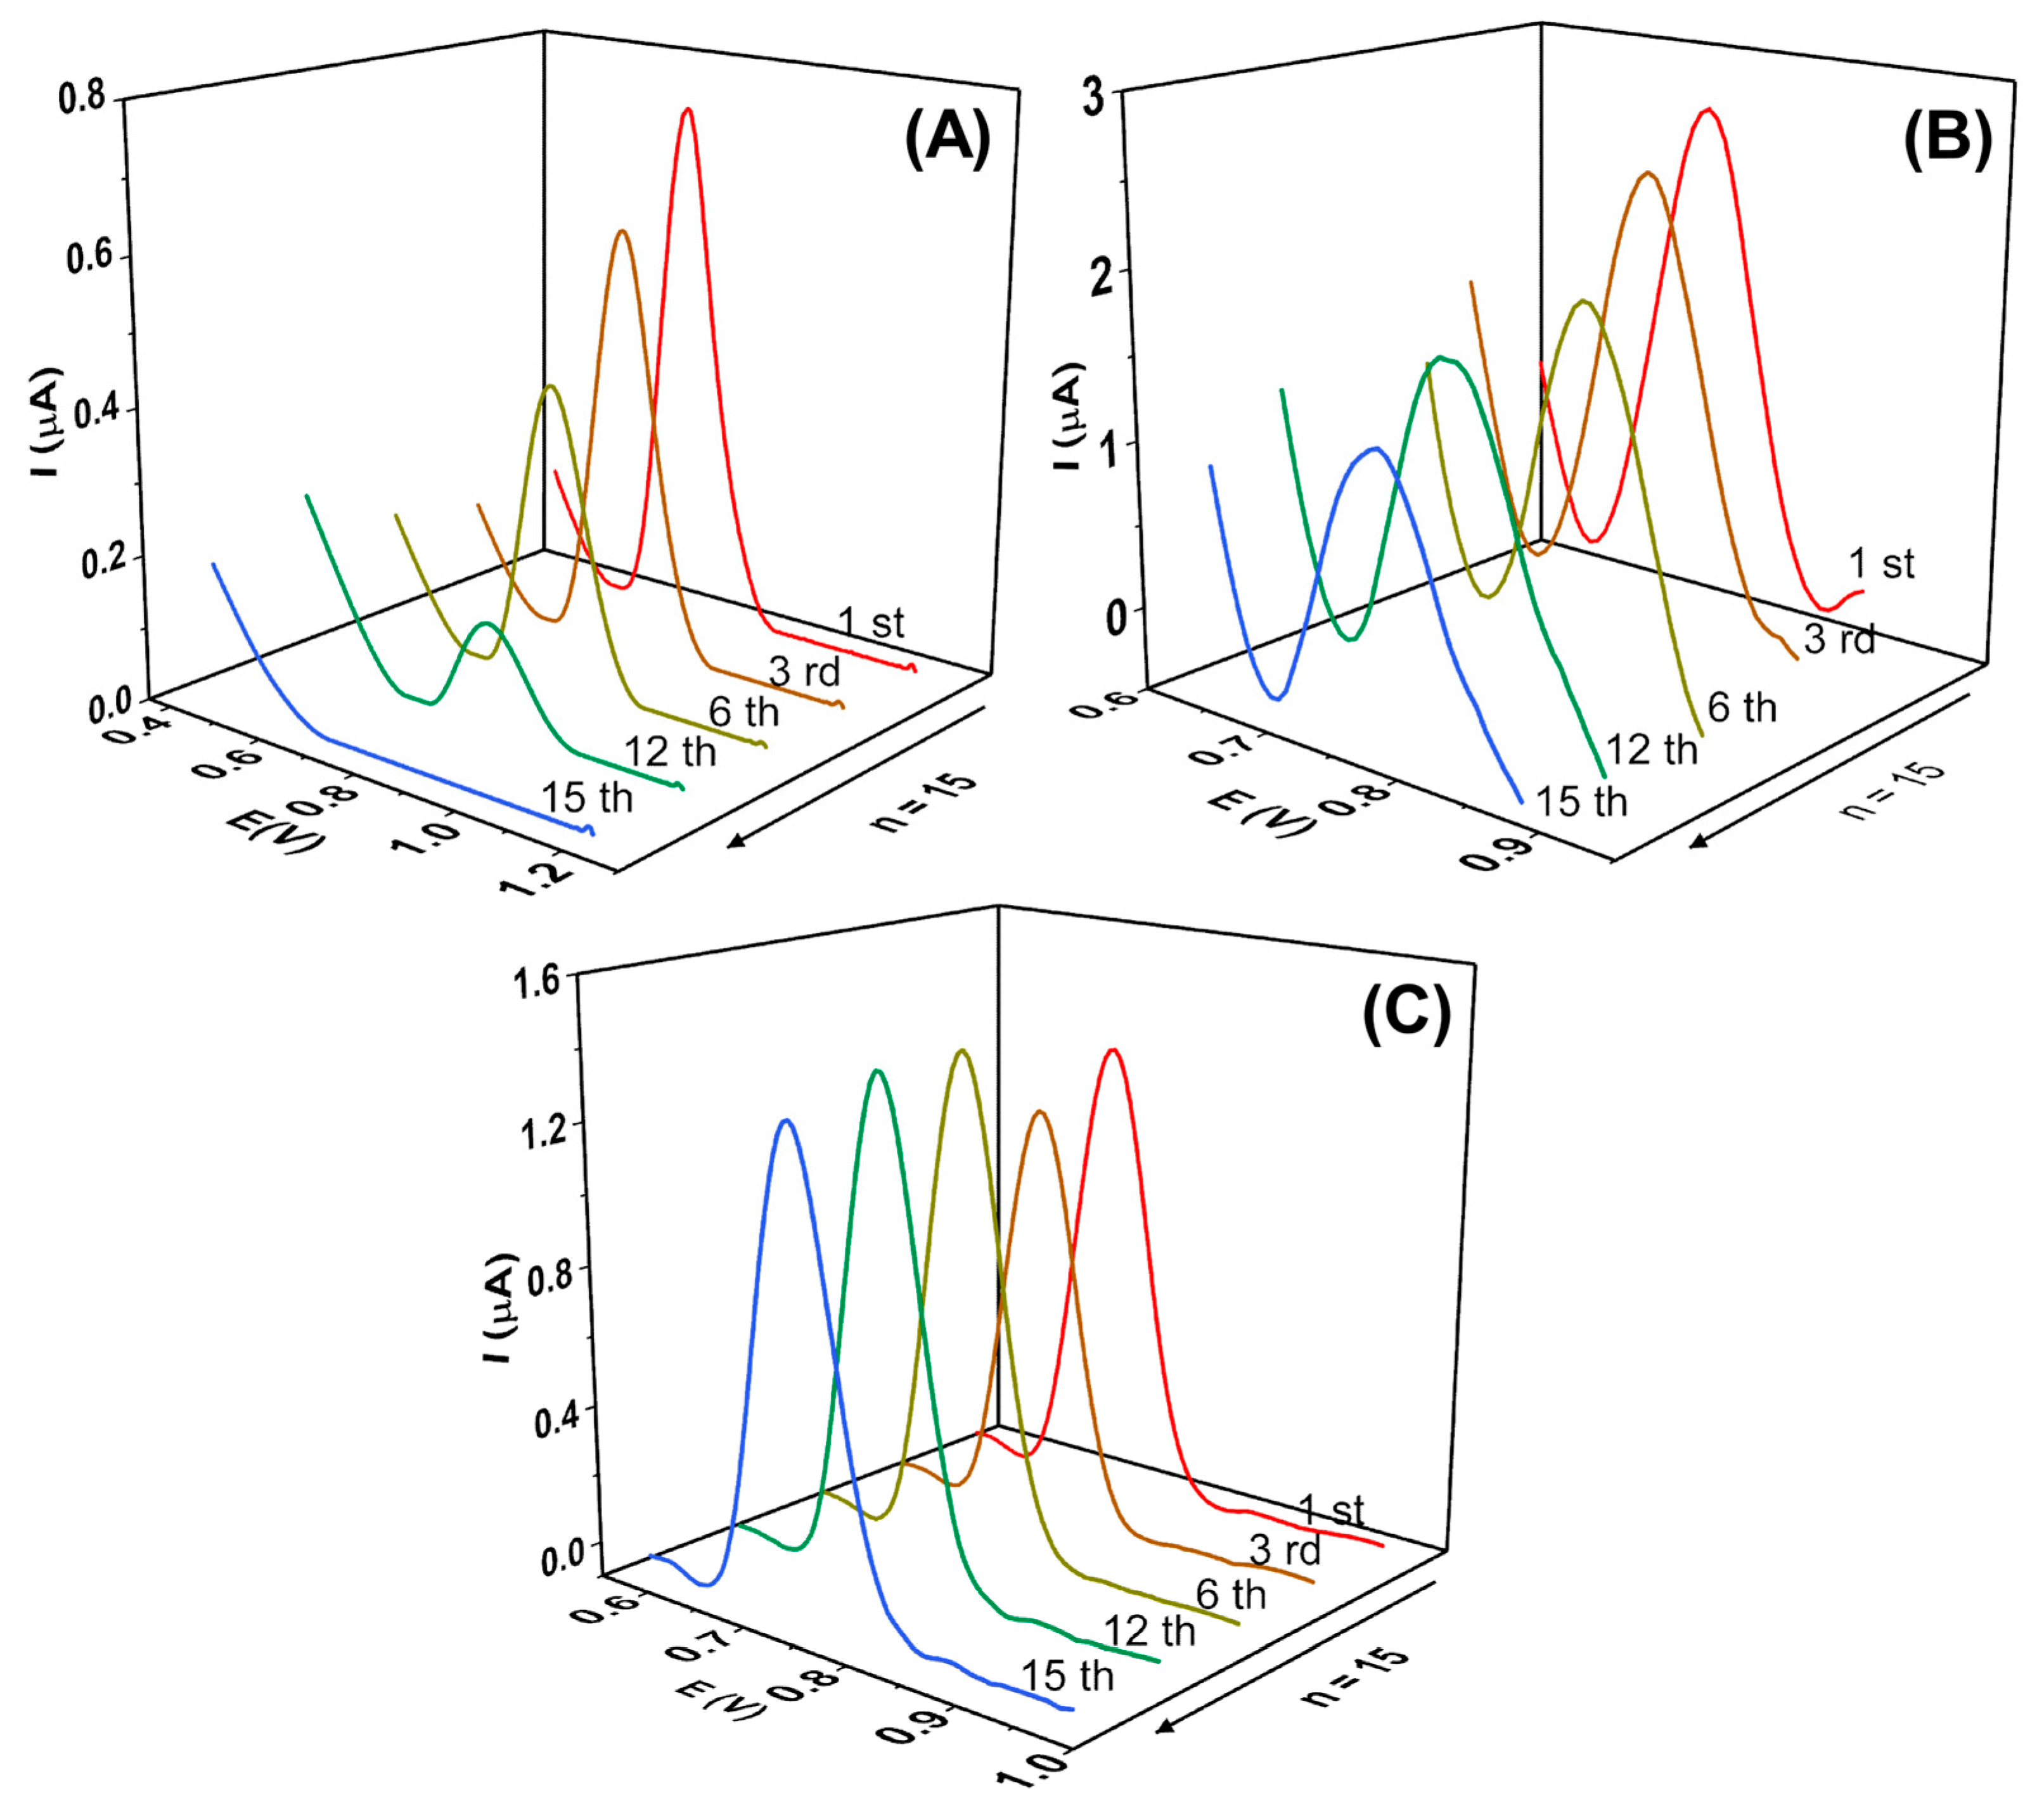
2.2. Electrochemical Behavior of E2 at α-Fe2O3-CNT/GCE

Cyclic voltammetry (CV) technique assays were performed in the presence of 0.1 µmol L−1 of E2 in a 0.1 mol L−1 KCl solution with 10% v/v ethanol (to prevent the precipitation of E2). Initially, we observed a comparison of the bare GCE and GCE modified with α-Fe2O3-CNT, and the concentration of α-Fe2O3-CNT in the suspension also was evaluated, with concentrations of 1.0 and 2.0 mg mL−1. As shown in Figure 2, the hormone E2 exhibits a single oxidation peak around 0.8 V, indicating an irreversible electrochemical process. This behavior is consistent with other reports found in the literature regarding E2 determination [6,16,46,47,48].
The voltammograms obtained with the bare GCE for E2 showed a peak with good current intensity. However, after the modification with α-Fe2O3-CNT, the peak current increased, indicating an improvement in the interaction with the electrode surface and an effective enhancement in the conductivity of the working electrode. This can be attributed to a reduction in the electron transfer resistance and an increase in the electrode surface area. Furthermore, two concentrations were evaluated, and no significant difference in the voltammetric response was observed. Thus, the α-Fe2O3-CNT suspension at a concentration of 1.0 mg mL−1 was adopted for further experiments.
The composition and pH of supporting electrolytes play an important role in the electrochemical response. Therefore, KCl solution (0.1 mol L−1), phosphate buffer solution (0.01 mol L−1), and Britton–Robinson buffer solution (0.04 mol L−1), all at pH 7.0, were evaluated (results not shown). It was observed that the KCl solution provided a peak with higher intensity and a lower oxidation potential when compared to the others. Thus, KCl 0.1 mol L−1 was chosen as the supporting electrolyte for the next experiments.
The influence of the pH of the KCl solution was also investigated (see Figure S1 in Supplementary Material). For pH values above 10.0, the E2 oxidation process becomes kinetically unfavorable as it leads to the passivation of the electrode surface. High peak current intensities were obtained at pH 6.0, 7.0, and 8.0. However, the electrochemical response at pH 7.0 exhibited better peak definition and repeatability (RSD of 0.65%; n = 3). According to Mustafa et al. (2004) [49], α-Fe2O3 nanoparticles have a point of zero charge (pH pcz) of 6.50. Conversely, the pKa of the E2 molecule is 10.7. Therefore, at pH 7.0, the E2 molecule is protonated, while the α-Fe2O3 nanoparticles are negatively charged, resulting in an electrostatic interaction between α-Fe2O3-CNT/GCE and the E2 molecules.
A linear relationship between peak potential (Ep) and pH (Ep(V) = 1.00193–0.05060 pH; R2 = 0.9934) was obtained in the pH range of 2.0 to 6.0, where the Ep shifts to less positive values as the pH increases. This behavior was described by Vega et al. (2007) [50] as characteristic behavior for the oxidation of phenolic compounds. The slope of 0.0506 V pH−1 is close to the theoretical Nernstian slope of 0.0592 V pH−1, which indicates that the E2 oxidation process involves the same number of protons and electrons. This result is in accordance with the oxidation mechanism of E2 proposed by Ngundi et al. (2003) [51], in which the oxidation reaction involves transferring two protons and two electrons.
The electrochemical behavior of α-Fe2O3-CNT/GCE was studied by CV at different scan rates (from 10 to 500 mV s−1) in the presence of E2, as can be seen in Figure 3. It was noted that the overpotential was shifted positively (Figure 3A), which is characteristic of an irreversible process. Furthermore, the relation of Ip versus ν1/2 shown in Figure 3B reveals a linear behavior, and the slope of 0.6 obtained in the relation of log Ip versus log ν (inset Figure 3B) is close to the theoretical value of 0.5 for a diffusion-controlled process; these results confirm a diffusion-controlled process of species from solution to the electrode surface [52].
The results obtained in the scan rate study were also used to determine the number of electrons involved in the oxidation process of the E2 molecule through Equation (1):
|Ep − Ep/2| = 47.7 mV/αn
where Ep is the anodic peak potential, Ep/2 is the potential associated with the peak current half-height, α is the charge-transfer coefficient (0.50), which is pre-determined for organic molecules, and n is the number of electrons consumed in the reaction [52,53].
Considering the mean value of Ep = 0.769 V and Ep/2 = 0.709 V obtained with CV assays in different scan rates, the value of n calculated was 1.6. This result is in accordance with the oxidation mechanism reported by Ngundi et al. (2003) [51], where the oxidation reaction involves the transfer of two electrons and two protons, as shown in Figure 4.

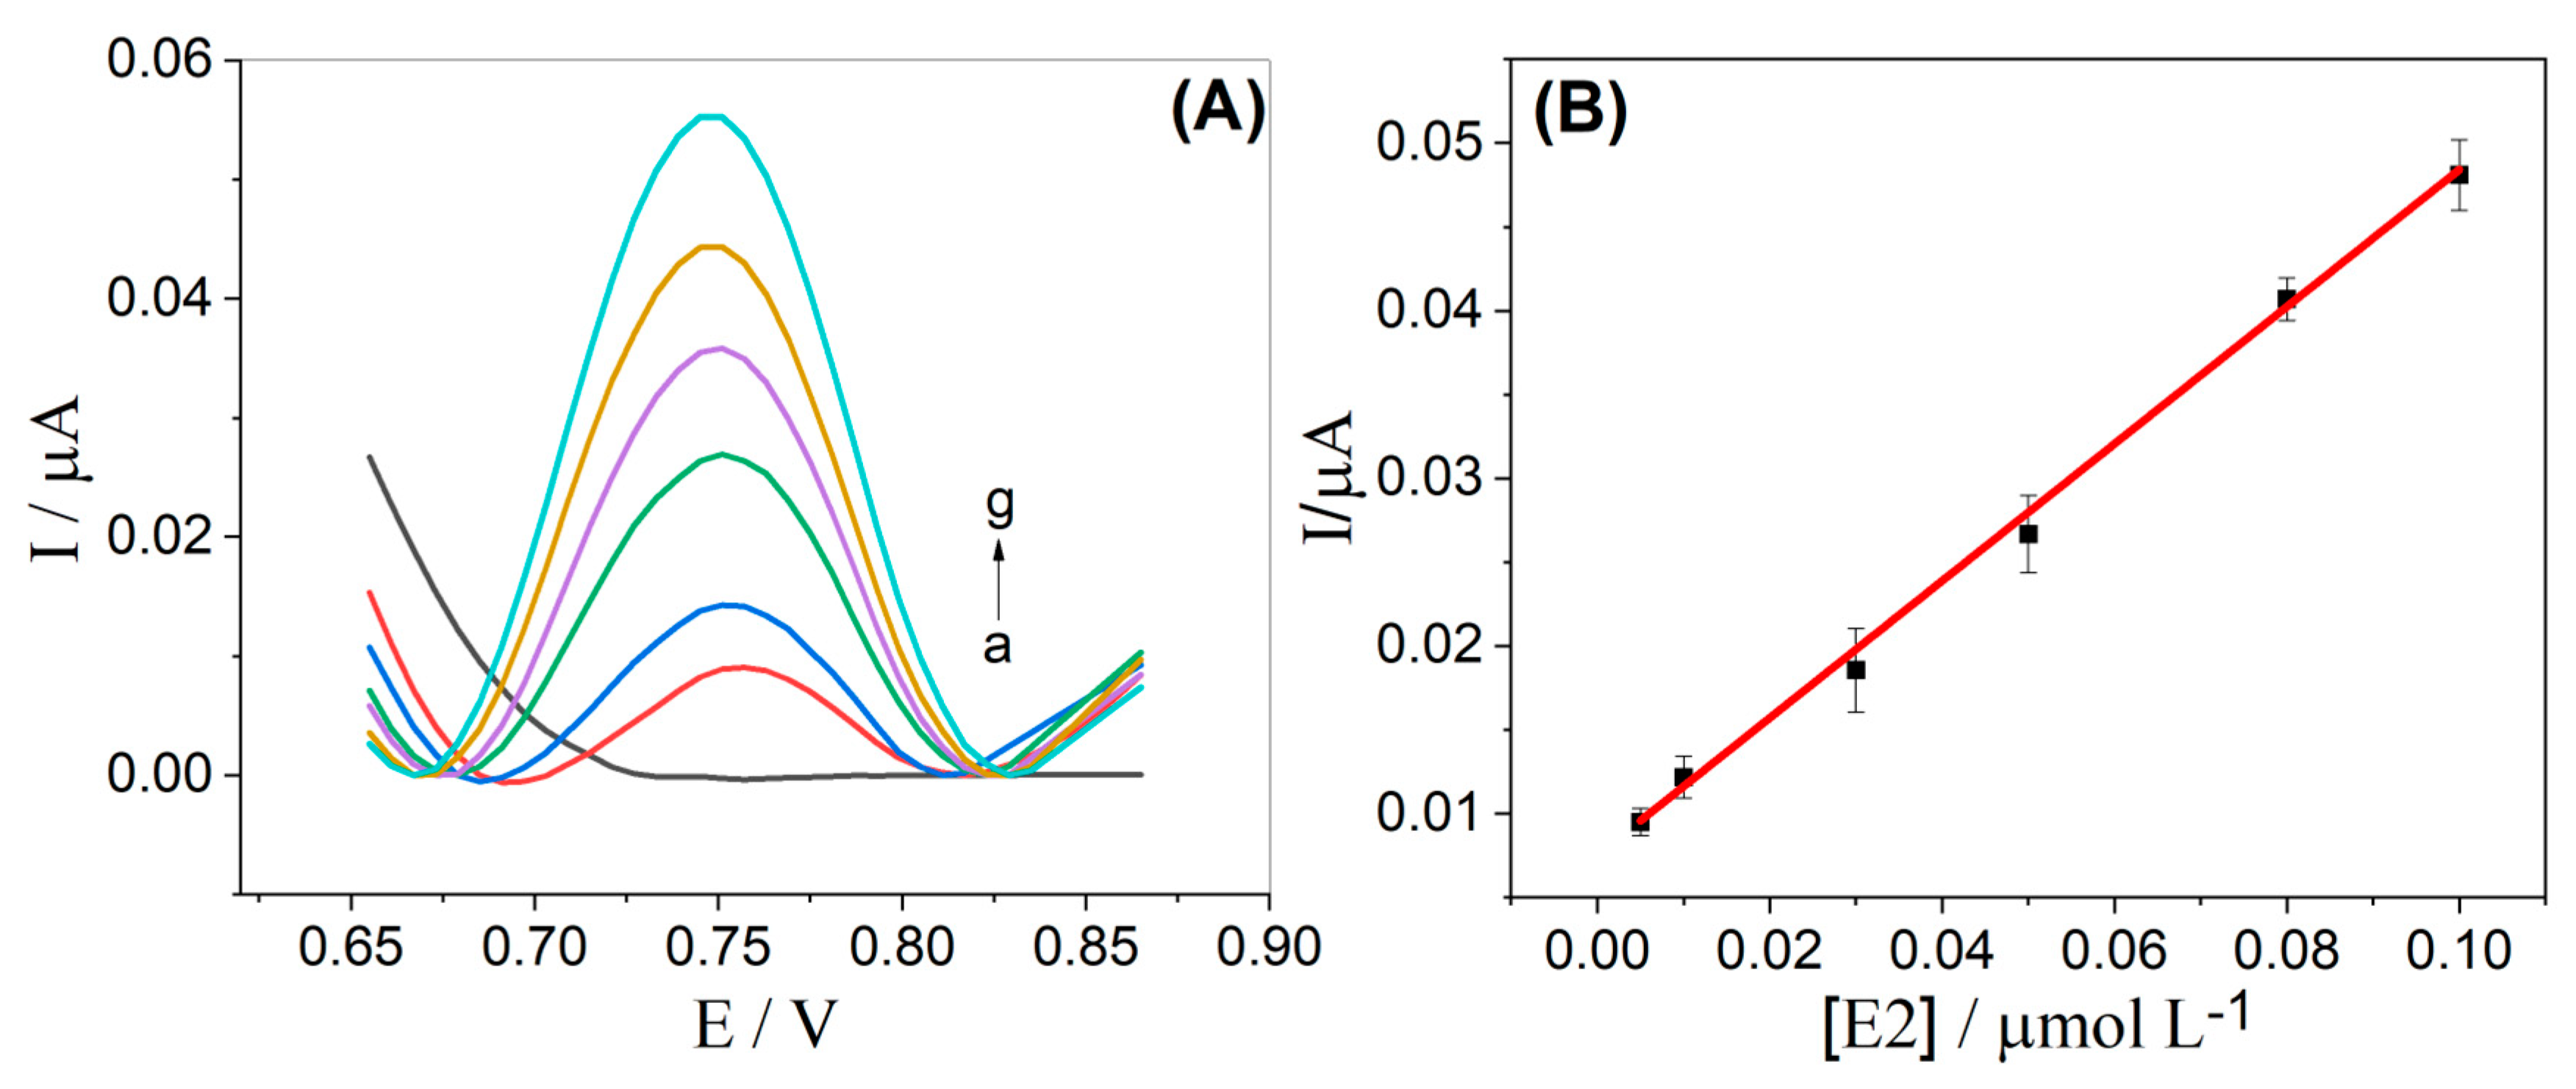
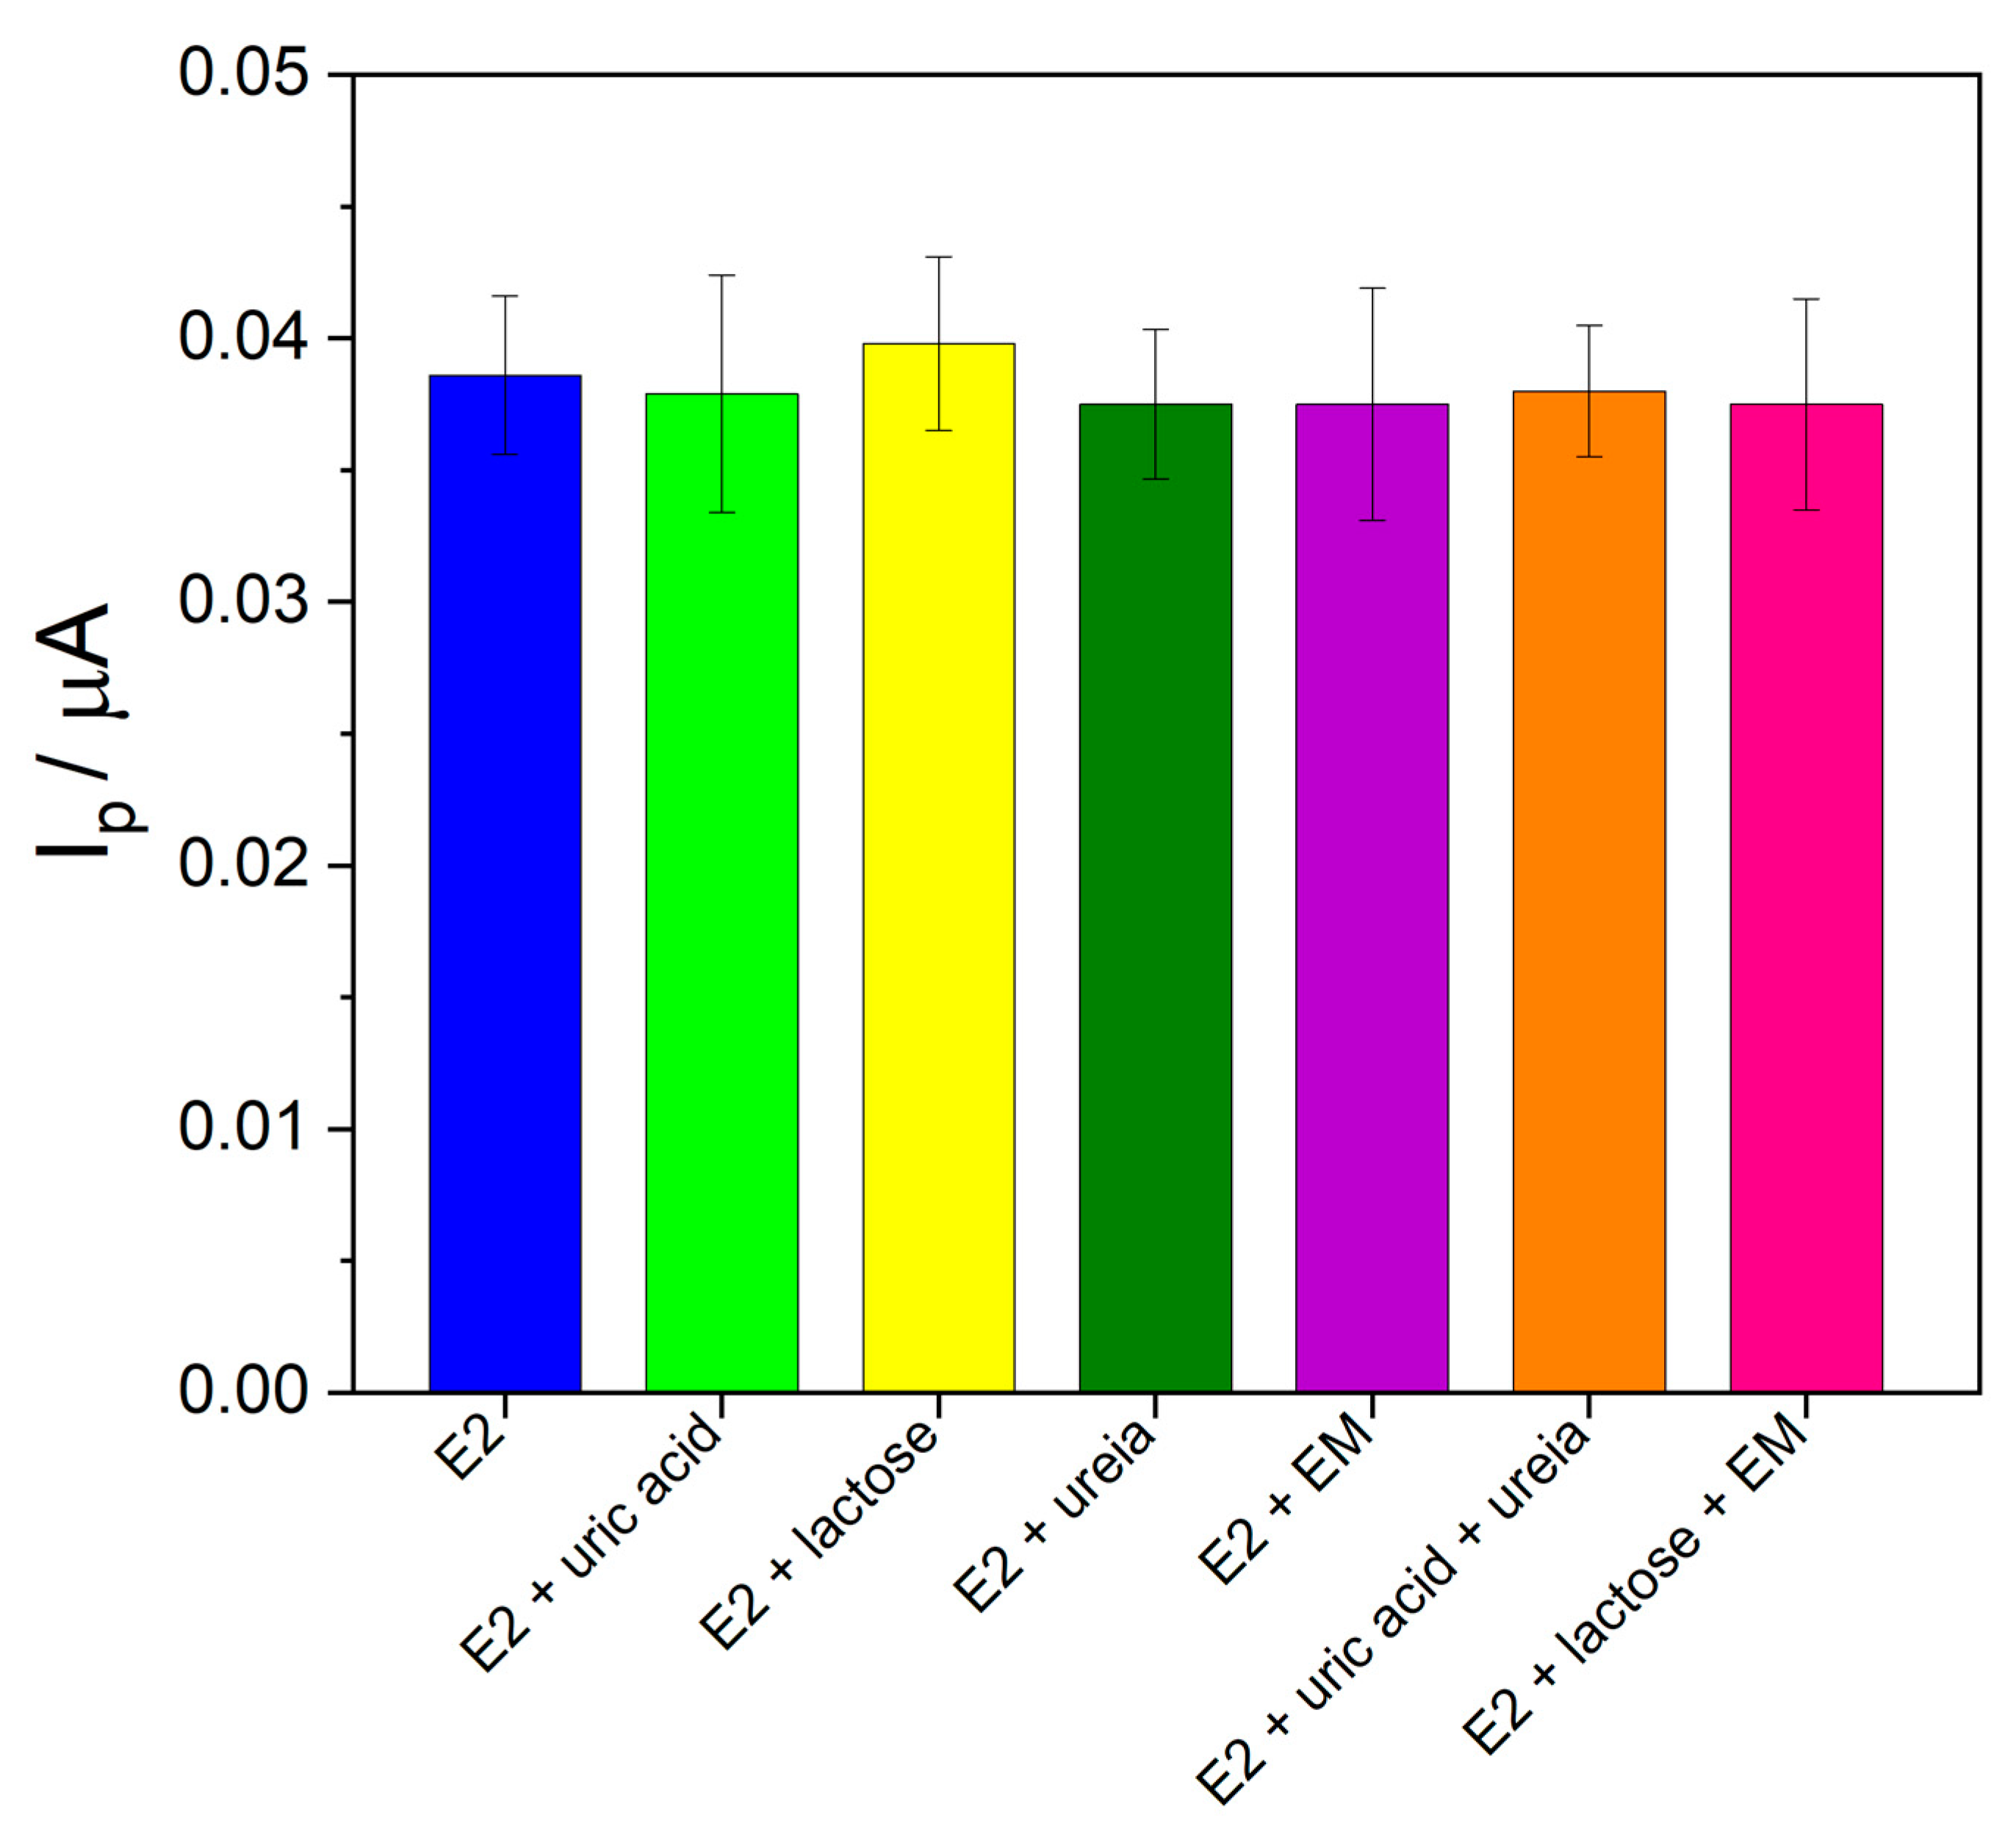
2.3. Determination of E2 at α-Fe2O3-CNT/GCE

As reported in the literature, it is common for the E2 electrochemical oxidation process to involve the adsorption of the E2 molecule or its oxidation products on the electrode surface. This can result in a decrease in Ipa (peak current) and reduced precision of the analytical method [6]. Therefore, this phenomenon was evaluated using the square wave voltammetry (SWV) technique with the bare GCE, CNT/GCE, and α-Fe2O3-CNT/GCE. A total of 15 consecutive measurements were conducted in the presence of 0.1 µmol L−1 E2 in KCl solution (10% v/v ethanol) at pH 7.0, as shown in Figure 5.
As can be seen for the bare GCE, a significant decrease in peak current intensity was observed, with a relative standard deviation (RSD) of 71%. Furthermore, the peak potential shifted toward more positive values as the measurements were taken, indicating passivation of the GCE surface and a slower interaction between the electrode surface and the E2 molecule. When the GCE electrode was modified with CNT, it was observed that the variation was lower compared to the bare GCE, with an RSD of 26%. On the other hand, when the α-Fe2O3-CNT/GCE was used, the RSD was 4%, indicating that the modification of the GCE surface significantly improved the electrode performance by preventing fouling and enhancing the analytical signal.
The SWV technique parameters were optimized as follows: frequency () (10–100 s−1), pulse amplitude (a) (10–150 mV), and scan increment (ΔEs) (1–12 mV). The responses were evaluated in terms of peak definition, repeatability, and peak current intensity. The selected values were = 60 s−1, a = 40 mV, and ΔEs = 6 mV.
After this previous study, the analytical curve was obtained, and SWV voltammograms were carried out with successive additions at concentrations of E2 ranging from 5.0 to 100.0 nmol L−1, as shown in Figure 6A. The peak current obtained for E2 exhibits a linear dependence on the respective concentration (see Figure 6B) and is described by the equation: Ip (μA) = 0.0072 μA + 0.4083 μA μmol−1 L [E2] (μmol L−1) (R2 = 0.998).
The limit of detection (LOD) was calculated as 3 std/m, where std represents the standard deviation of 10 determinations of the blank and m is the slope of the analytical curve. The obtained LOD value was found to be 4.4 nmol L−1. Next, the values of intra- and inter-day repeatability were obtained for two concentrations of E2 (10.0 and 50.0 nmol L−1). For the intra-day repeatability experiments, ten successive measurements (n = 10) were obtained on the same day, while for the inter-day repeatability measurements, they were obtained over five successive days (n = 3). The obtained RSD values ranged from 3.8% to 8.6%, indicating good precision of the proposed method.
The analytical parameters obtained in this proposed method were compared with other electroanalytical methods for the determination of E2 using different electrochemical sensors reported in the literature. As shown in Table 1, the method proposed here presents similar or smaller LOD values compared to most works found in the literature. The significant advantage of the proposed method lies in its relatively low cost and simple synthesis of the material.
To evaluate the effect of possible interfering molecules found in the pharmaceutical and urine samples, binary solutions were prepared containing E2 with uric acid, lactose, urea, or magnesium stearate (at a ratio of 1:10 (m/m) E2:interfering molecule). Additionally, solutions containing E2 with a mixture of interfering molecules (uric acid + urea or lactose + magnesium stearate) were studied at the same ratio of 1:10 (m/m) E2:interfering molecule mixture. As can be seen in Figure 7, the current intensity obtained for E2 in the presence of the interfering molecules was compared to the current obtained for E2 alone under the same experimental conditions. The relative errors ranged from 1.50% to 3.22%, indicating that the evaluated molecules did not interfere with the determination of E2 under the studied conditions.
It is important to emphasize that other estrogens such as estradiol, estrone, and estriol may also be present in biological and environmental samples [57]. These hormones oxidize at the same potential as E2, making them potential interference species. Therefore, in the presence of other estrogens, it is only possible to determine the total estrogen concentration in the samples.
To evaluate the matrix effect of lake water and synthetic urine samples on E2 determination using α-Fe2O3-CNT/GCE, addition–recovery studies were conducted. For this purpose, the samples were spiked with 50 nmol L−1 of E2. The recovery values are presented in Table 2, and they were found to be 105% for the lake water sample and 100% for the synthetic urine sample. These results suggest that the proposed method is applicable for determining E2 in real urine samples. Moreover, it can also be employed for water analysis using samples containing a higher E2 concentration, or for water samples subjected to E2 preconcentration treatment, as no matrix effects were observed.
Finally, the proposed electroanalytical method was used for the determination of E2 in commercial pharmaceutical samples. Two samples were evaluated, and the results obtained by the proposed method were statistically compared with the results obtained by the high-performance liquid chromatography (HPLC) method. The E2 concentrations found in the pharmaceutical samples for both methods are presented in Table 3. A low relative error (%) was observed for both samples, demonstrating the accuracy of the method. Additionally, the Student’s t test was used to compare the results, yielding experimental t values of 1.2 for sample 1 and 1.6 for sample 2, both of which were lower than the critical t value (tcritical = 2.8). This indicates that there is no significant difference between the proposed method and the HPLC comparative method, at a 95% confidence level.

3. Materials and Methods

3.1. Chemical Reagents and Solutions

All the chemical reagents used in this work were of analytical grade. Boric acid (H3BO3), acetic acid (CH3COOH), phosphoric acid (H3PO4), uric acid (C5H4N4O3), 2-propanol (CH3)2CHOH), sodium sulfate (Na2SO4), potassium dihydrogen phosphate (KH2PO4), sodium phosphate (Na3PO4), disodium hydrogen phosphate (Na2HPO4), multiwalled carbon nanotubes (CNTs), Fe2O3, polyvinylpyrrolidone (PVP) and sodium nitrite (NANO3) were obtained from Sigma-Aldrich; potassium chloride (KCl), sodium chloride (NaCl), hydrochloric acid (HCl), calcium chloride (CaCl2·2H2O), and sodium hydroxide (NaOH) were obtained from Sinth.
Solutions were prepared using ultrapure water (18.2 MΩ cm) from an ELGA® PURELAB Maxima (Woodridge, IL, USA) purification system. Pharmaceutical tablet samples were purchased from a local drugstore. E2 stock solution was prepared in ethanol at 0.1 mol L−1 concentration, then, proper dilutions in ultrapure water were performed. For the preparation of the BR buffer solution (0.01 mol L−1), appropriate amounts of boric acid, phosphoric acid, and acetic acid were mixed and dissolved in ultrapure water. The phosphate buffer solution was prepared by weighing adequate amounts of KH2PO4 and Na2HPO4 and dissolving them in ultrapure water. The 0.1 mol L−1 KCl solution was prepared by dissolving its salts in ultrapure water. The pH of phosphate and BR buffer and KCl solution was adjusted using 2.0 mol L−1 NaOH solution and 1.0 mol L−1 HCl solution. All the solutions were stored in a refrigerator until use.

3.2. Apparatus

Voltammetric measurements were carried out using a potentiostat/galvanostat PalmSens 2.0 (PalmSens BV, Houten, Netherlands) driven by PStrace 5.3 software using a conventional three-electrode electrochemical cell containing the bare GCE or the α-Fe2O3-CNT/GCE as working electrodes, an Ag/AgCl (3.0 mol L−1 KCl) as reference electrode, and a platinum wire as auxiliary electrode. For the morphological and chemical characterization a scanning electronic microscope (model FEI Quanta 200) and a DeltaNu spectrometer were used. The determination of E2 by a comparative HPLC method was carried out using a high-performance liquid chromatograph (model Shimadzu LC-20AD) equipped with a UV-Vis detection system using a detector of diode array (purchased in Tokyo, Japan), a C18 column (model Phenomenex) at 250 mm × 4.5 mm in dimension and particle size of 5 μm.
The quantification of E2 was performed according to the procedure described by Yilmaz and Kadioglu (2013) [58] with some modifications: a mobile phase in isocratic mode consisting of methanol and water (70:30 v/v), a flow rate of 1.0 mL min−1, injection volume of 20.0 μL, UV-Vis detection at 220 nm. Before injection in the chromatographic system, the samples and standards were filtered through a 0.25 µm PTFE membrane filter. The pH control in the preparation of solutions was performed using a Bench Top Water pH meter (model AZ86505).

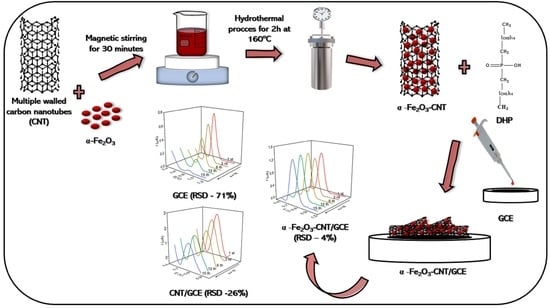
3.3. Synthesis of α-Fe2O3-CNT and Preparation of Electrochemical Sensors

The synthesis of α-Fe2O3 nanoparticles supported by carbon nanotubes was achieved by mixing 3.0 mg mL−1 of CNT, 3.0 g of Fe2O3, and subsequently adding 6.0 g of NaNO3, 0.45 g of PVP, and 80.0 mL of ultrapure water. The mixture was then stirred for 30 min. Subsequently, it was transferred to a Teflon autoclave, and the hydrothermal process was carried out at 160 °C for 12 h. After the reaction, the solid product was filtered, washed with ethanol and ultrapure water, dried in an oven at 80 °C for 12 h, and finally calcined using a muffle furnace at 600 °C for 3 h, resulting in the formation of the metallic oxide [59].
The α-Fe2O3-CNT suspensions were prepared at concentrations of 1.0 mg mL−1 and 2.0 mg mL−1. In both suspensions, the polyelectrolyte dihexadecyl hydrogen phosphate (DHP) was added at a concentration of 1.0 mg mL−1, and the mixture was dispersed in ultrapure water. The CNT suspension was prepared using 1.0 mg mL−1 of CNT and 1.0 mg mL−1 of DHP, also in ultrapure water. To achieve homogeneity, the suspensions were subjected to 2 h of ultrasonic treatment and 1 h of magnetic stirring. The polyelectrolyte DHP acts as a surfactant and forms a stable film on the electrode surface when dispersed in water under ultrasonic stirring [60].
Before the modification procedure, the surface of the GCE was polished using 3.0 μm alumina suspension. After washing, a second polishing was performed using fine-grit sandpaper and water. Subsequently, the electrode was subjected to a 3-min ultrasonic bath in 2-propanol, followed by another 3-min ultrasonic bath in ultrapure water. The cleaning and conditioning process was completed by carrying out an electrochemical treatment in a sulfuric acid solution with a concentration of 0.01 mol L−1 using the CV technique. The treatment involved 50 cycles in a potential range of −0.5 to 1.2 V and a scan rate of 100 mV s−1. The GCE was modified by drop-casting 6 μL of the aqueous suspensions of CNT or α-Fe2O3-CNT (at concentrations of 1.0 or 2.0 mg mL−1) onto its surface. Subsequently, the modified electrode was left to dry at room temperature for a minimum of 2 h.

3.4. Preparation of Lake Water, Synthetic Urine, and Pharmaceutical Samples

Natural water samples were collected at Igapó Lake in Londrina, Paraná, Brazil, using a clean amber glass bottle. Then, the samples were filtered through qualitative filter paper and used in the preparation of a 0.1 mol L−1 KCl solution (pH = 7.0), which was used as a supporting electrolyte. Aliquots of E2 were added to the water sample and quantified by the addition and recovery test.
The synthetic urine sample was prepared according to the procedure described by Laube, Mohr and Hesse [61] as follows: 0.110 g of CaCl2·2H2O, 0.296 g of NaCl, 0.225 g of Na2SO4, 0.140 g of KH2PO4, 0.160 g of NH4Cl, and 2.5 g of urea were dissolved in 100 mL of ultrapure water. For analysis, 1.0 mL of synthetic urine sample was diluted in 19 mL of 0.1 mol L−1 KCl solution (pH = 7.0) with 10% ethanol. Aliquots of E2 were added to the urine sample and quantified by the addition and recovery test.
For the pharmaceutical sample preparation, ten tablets were weighed and ground in a mortar with a pestle; then, the amount of one tablet was weighed and diluted in 5.0 mL of ethanol, then for E2 determination was used an external calibration method.

3.5. Measurement Procedure

CV and SWV were employed to investigate the electrochemical behavior and the quantification of E2. The instrumental parameters for SWV were optimized, and the respective analytical curve was obtained by adding small volumes of concentrated standard solutions of the E2 to the supporting electrolyte solution. The limit of detection (LOD) value was calculated as three times the standard deviation for 10 measurements of the blank solution (s) divided by the slope of the respective analytical curve (b) (LOD = 3 s/b) [62]. The repeatability of the electroanalytical methods was checked with intra-day (n = 10) and inter-day (n = 5) determinations for two different concentrations of E2, for which the respective relative standard deviations (RSDs) were calculated.
The selectivity of the proposed methods was evaluated by the addition of possible interferents present in pharmaceutical formulations and urine samples (uric acid, urea, lactose, starch, povidone) to a standard solution containing E2, in the concentration ratios (standard solution to interferent) of 10, 1, and 0.1.

4. Conclusions

This work describes the successful development of an electrochemical method based on a glassy carbon electrode modified with α-Fe2O3 nanoparticles supported on CNTs. We explored the high electroactive surface area of CNTs and the high conductivity of α-Fe2O3 nanoparticles. The synthesis of the α-Fe2O3-CNT nanocomposite was achieved through a simple and cost-effective hydrothermal process. The α-Fe2O3-CNT/GCE provided an increase in current intensity obtained for E2 electrochemical oxidation and prevented fouling on the electrode surface when compared with a bare GCE. After optimizing the experimental conditions and SWV technique parameters, E2 determination was performed within a linear concentration range, and a LOD in the nanomolar order was achieved.
The proposed α-Fe2O3-CNT/GCE proved to be a simple and fast method for E2 determination in lake water, synthetic urine, and pharmaceutical samples, with good precision, accuracy, sensitivity, and no matrix effect or interference from other molecules. It can be a less expensive alternative for routine determinations of these drugs.

Supplementary Materials

The following supporting information can be downloaded at: https://www.mdpi.com/article/10.3390/molecules28176372/s1, Figure S1: Cyclic voltammograms obtained for 0.1 mmol L−1 of E2 using α-Fe2O3-CNT/GCE at different pHs (A) Ep versus pH plot (B). Supporting electrolyte: 0.1 mol L−1 KCl solution (10% v/v ethanol) in the presence of 0.1 µmol L−1 E2. Scan rate: 50 mV s−1.

Author Contributions

Conceptualization, R.A.M. and J.C.R.G.; methodology, J.C.R.G. and V.L.N.; validation, J.C.R.G., M.C.P. and R.A.M.; formal analysis, R.A.M. and R.M.; resources, R.A.M.; data curation, J.C.R.G.; writing—original draft preparation, M.d.S.A., J.C.R.G. and M.C.P.; writing, revision, editing, L.H.D., C.R.T.T., R.M. and R.A.M.; visualization, M.d.S.A., J.C.R.G., M.C.P. and R.A.M.; supervision, R.A.M.; project administration, R.A.M.; funding acquisition, R.A.M. All authors have read and agreed to the published version of the manuscript.

Funding

This research was funded by CNPq (307505/2021-9), Fundação Araucária (243/2022-PBA) and CAPES.

Institutional Review Board Statement

Not applicable.

Informed Consent Statement

Not applicable.

Data Availability Statement

The datasets used and/or examined during the present study can be obtained by contacting the corresponding author through a reasonable request.

Acknowledgments

We are very grateful for financial support from the Brazilian funding agencies CNPq (307505/2021-9), Fundação Araucária (09/2021-PBA2022011000123) and CAPES.

Conflicts of Interest

The authors declare no conflict of interest.

Sample Availability

Not applicable.

References

  1. Kavetskyy, T.; Khalilov, R.; Smutok, O.; Demkiv, O. Construction of Amperometric Laccase-Based Biosensors Using the Ureasil and Photocross-Linked Polymers. AB&ES 2019, 4, 137–149. [Google Scholar]
  2. Eftekhari, A.; Dalili, M.; Karimi, Z.; Rouhani, S.; Hasanzadeh, A.; Rostamnia, S.; Khaksar, S.; Idris, A.O.; Karimi-Maleh, H.; Yola, M.L.; et al. Sensitive and Selective Electrochemical Detection of Bisphenol a Based on SBA-15 like Cu-PMO Modified Glassy Carbon Electrode. Food Chem. 2021, 358, 129763. [Google Scholar] [CrossRef]
  3. Smajdor, J.; Piech, R.; Ławrywianiec, M.; Paczosa-Bator, B. Glassy Carbon Electrode Modified with Carbon Black for Sensitive Estradiol Determination by Means of Voltammetry and Flow Injection Analysis with Amperometric Detection. Anal. Biochem. 2018, 544, 7–12. [Google Scholar] [CrossRef]
  4. Nazari, E.; Suja, F. Effects of 17β-Estradiol (E2) on Aqueous Organisms and Its Treatment Problem: A Review. Rev. Environ. Health 2016, 31, 465–491. [Google Scholar] [CrossRef]
  5. Starling, M.C.V.M.; Amorim, C.C.; Leão, M.M.D. Occurrence, Control and Fate of Contaminants of Emerging Concern in Environmental Compartments in Brazil. J. Hazard. Mater. 2019, 372, 17–36. [Google Scholar] [CrossRef]
  6. Moraes, F.C.; Rossi, B.; Donatoni, M.C.; de Oliveira, K.T.; Pereira, E.C. Sensitive Determination of 17β-Estradiol in River Water Using a Graphene Based Electrochemical Sensor. Anal. Chim. Acta 2015, 881, 37–43. [Google Scholar] [CrossRef]
  7. Tseng, T.T.C.; Gusviputri, A.; Hoa, L.N.Q. A Simple, Sensitive and Compact Electrochemical ELISA for Estradiol Based on Chitosan Deposited Platinum Wire Microelectrodes. J. Electroanal. Chem. 2015, 758, 59–67. [Google Scholar] [CrossRef]
  8. Song, X.; Wen, Y.; Wang, Y.; Adeel, M.; Yang, Y. Environmental Risk Assessment of the Emerging EDCs Contaminants from Rural Soil and Aqueous Sources: Analytical and Modelling Approaches. Chemosphere 2018, 198, 546–555. [Google Scholar] [CrossRef]
  9. Mafra, G.; Spudeit, D.; Brognoli, R.; Merib, J.; Carasek, E. Expanding the Applicability of Cork as Extraction Phase for Disposable Pipette Extraction in Multiresidue Analysis of Pharmaceuticals in Urine Samples. J. Chromatogr. B Analyt Technol. Biomed. Life Sci. 2018, 1102–1103, 159–166. [Google Scholar] [CrossRef]
  10. Yuan, Y.; Wang, M.; Jia, N.; Zhai, C.; Han, Y.; Yan, H. Graphene/Multi-Walled Carbon Nanotubes as an Adsorbent for Pipette-Tip Solid-Phase Extraction for the Determination of 17β-Estradiol in Milk Products. J. Chromatogr. A 2019, 1600, 73–79. [Google Scholar] [CrossRef]
  11. Wang, Z.; Guo, L.; Liu, L.; Kuang, H.; Xu, C. Colloidal Gold-Based Immunochromatographic Strip Assay for the Rapid Detection of Three Natural Estrogens in Milk. Food Chem. 2018, 259, 122–129. [Google Scholar] [CrossRef] [PubMed]
  12. Li, X.; Li, S.; Kellermann, G. Simultaneous Determination of Three Estrogens in Human Saliva without Derivatization or Liquid-Liquid Extraction for Routine Testing via Miniaturized Solid Phase Extraction with LC-MS/MS Detection. Talanta 2018, 178, 464–472. [Google Scholar] [CrossRef]
  13. Xie, P.; Liu, Z.; Huang, S.; Chen, J.; Yan, Y.; Li, N.; Zhang, M.; Jin, M.; Shui, L. A Sensitive Electrochemical Sensor Based on Wrinkled Mesoporous Carbon Nanomaterials for Rapid and Reliable Assay of 17β-Estradiol. Electrochim. Acta 2022, 408, 139960. [Google Scholar] [CrossRef]
  14. Nunes da Silva, D.; Leijoto de Oliveira, H.; Borges, K.B.; Pereira, A.C. Sensitive Determination of 17β-Estradiol Using a Magneto Sensor Based on Magnetic Molecularly Imprinted Polymer. Electroanalysis 2021, 33, 506–514. [Google Scholar] [CrossRef]
  15. Bergamin, B.; Pupin, R.R.; Wong, A.; Sotomayor, M.D.P.T. A New Electrochemical Platform Based on a Polyurethane Composite Electrode Modified with Magnetic Nanoparticles Coated with Molecularly Imprinted Polymer for the Determination of Estradiol Valerate in Different Matrices. J. Braz. Chem. Soc. 2019, 30, 2344–2354. [Google Scholar] [CrossRef]
  16. Masikini, M.; Ghica, M.E.; Baker, P.G.L.; Iwuoha, E.I.; Brett, C.M.A. Electrochemical Sensor Based on Multi-Walled Carbon Nanotube/Gold Nanoparticle Modified Glassy Carbon Electrode for Detection of Estradiol in Environmental Samples. Electroanalysis 2019, 31, 1925–1933. [Google Scholar] [CrossRef]
  17. Musa, A.M.; Kiely, J.; Luxton, R.; Honeychurch, K.C. An Electrochemical Screen-Printed Sensor Based on Gold-Nanoparticle-Decorated Reduced Graphene Oxide–Carbon Nanotubes Composites for the Determination of 17-β Estradiol. Biosensors 2023, 13, 491. [Google Scholar] [CrossRef]
  18. Scala-Benuzzi, M.L.; Soler-Illia, G.J.A.A.; Raba, J.; Battaglini, F.; Schneider, R.J.; Pereira, S.V.; Messina, G.A. Immunosensor Based on Porous Gold and Reduced Graphene Platform for the Determination of EE2 by Electrochemical Impedance Spectroscopy. J. Electroanal. Chem. 2021, 897, 115604. [Google Scholar] [CrossRef]
  19. Spychalska, K.; Baluta, S.; Świst, A.; Cabaj, J. Biosensors for Β17-Estradiol Detection Based on Graphene Quantum Dots (GQDs)/Conducting Polymer and Laccase Modified Platinum/Gold Electrodes. Int. J. Electrochem. Sci. 2020, 15, 3127–3142. [Google Scholar] [CrossRef]
  20. Chen, X.; Shi, Z.; Hu, Y.; Xiao, X.; Li, G. A Novel Electrochemical Sensor Based on Fe3O4-Doped Nanoporous Carbon for Simultaneous Determination of Diethylstilbestrol and 17β-Estradiol in Toner. Talanta 2018, 188, 81–90. [Google Scholar] [CrossRef]
  21. Moreira, F.; Santana, E.R.; Spinelli, A. Ionic Liquid-Supported Magnetite Nanoparticles as Electrode Modifier Materials for Estrogens Sensing. Sci. Rep. 2020, 10, 1955. [Google Scholar] [CrossRef] [PubMed]
  22. Lahcen, A.A.; Baleg, A.A.; Baker, P.; Iwuoha, E.; Amine, A. Synthesis and Electrochemical Characterization of Nanostructured Magnetic Molecularly Imprinted Polymers for 17-β-Estradiol Determination. Sens. Actuators B Chem. 2017, 241, 698–705. [Google Scholar] [CrossRef]
  23. Li, Y.; Zhao, X.; Li, P.; Huang, Y.; Wang, J.; Zhang, J. Highly Sensitive Fe3O4 Nanobeads/Graphene-Based Molecularly Imprinted Electrochemical Sensor for 17β-Estradiol in Water. Anal. Chim. Acta 2015, 884, 106–113. [Google Scholar] [CrossRef] [PubMed]
  24. Adarakatti, P.S.; Kempahanumakkagari, S.K. Modified Electrodes for Sensing. SPR Electrochemistry 2019, 15, 58–95. [Google Scholar] [CrossRef]
  25. Zaib, M.; Athar, M.M.; Saeed, A.; Farooq, U. Electrochemical Determination of Inorganic Mercury and Arsenic-A Review. Biosens. Bioelectron. 2015, 74, 895–908. [Google Scholar] [CrossRef]
  26. Suherman, A.L.; Ngamchuea, K.; Tanner, E.E.L.; Sokolov, S.V.; Holter, J.; Young, N.P.; Compton, R.G. Electrochemical Detection of Ultratrace (Picomolar) Levels of Hg2+ Using a Silver Nanoparticle-Modified Glassy Carbon Electrode. Anal. Chem. 2017, 89, 7166–7173. [Google Scholar] [CrossRef]
  27. Šišoláková, I.; Hovancová, J.; Oriňaková, R.; Oriňak, A.; Trnková, L.; Třísková, I.; Farka, Z.; Pastucha, M.; Radoňák, J. Electrochemical Determination of Insulin at CuNPs/Chitosan-MWCNTs and CoNPs/Chitosan-MWCNTs Modified Screen Printed Carbon Electrodes. J. Electroanal. Chem. 2020, 860, 113881. [Google Scholar] [CrossRef]
  28. Wong, A.; Silva, T.A.; Vicentini, F.C.; Fatibello-Filho, O. Electrochemical Sensor Based on Graphene Oxide and Ionic Liquid for Ofloxacin Determination at Nanomolar Levels. Talanta 2016, 161, 333–341. [Google Scholar] [CrossRef]
  29. Üğe, A.; Koyuncu Zeybek, D.; Zeybek, B. An Electrochemical Sensor for Sensitive Detection of Dopamine Based on MWCNTs/CeO 2 -PEDOT Composite. J. Electroanal. Chem. 2018, 813, 134–142. [Google Scholar] [CrossRef]
  30. Li, R.; Liu, X.; Wang, H.; Wu, Y.; Chan, K.C.; Lu, Z. Sandwich Nanoporous Framework Decorated with Vertical CuO Nanowire Arrays for Electrochemical Glucose Sensing. Electrochim. Acta 2019, 299, 470–478. [Google Scholar] [CrossRef]
  31. Fayemi, O.E.; Adekunle, A.S.; Kumara Swamy, B.E.; Ebenso, E.E. Electrochemical Sensor for the Detection of Dopamine in Real Samples Using Polyaniline/NiO, ZnO, and Fe3O4 Nanocomposites on Glassy Carbon Electrode. J. Electroanal. Chem. 2018, 818, 236–249. [Google Scholar] [CrossRef]
  32. Rajaji, U.; Muthumariyappan, A.; Chen, S.M.; Chen, T.W.; Ramalingam, R.J. A Novel Electrochemical Sensor for the Detection of Oxidative Stress and Cancer Biomarker (4-Nitroquinoline N-Oxide) Based on Iron Nitride Nanoparticles with Multilayer Reduced Graphene Nanosheets Modified Electrode. Sens. Actuators B Chem. 2019, 291, 120–129. [Google Scholar] [CrossRef]
  33. Mao, Y.; Fan, Q.; Li, J.; Yu, L.; Qu, L.B. A Novel and Green CTAB-Functionalized Graphene Nanosheets Electrochemical Sensor for Sudan i Determination. Sens. Actuators B Chem. 2014, 203, 759–765. [Google Scholar] [CrossRef]
  34. Zahirifar, F.; Rahimnejad, M.; Abdulkareem, R.A.; Najafpour, G. Determination of Diazinon in Fruit Samples Using Electrochemical Sensor Based on Carbon Nanotubes Modified Carbon Paste Electrode. Biocatal. Agric. Biotechnol. 2019, 20, 101245. [Google Scholar] [CrossRef]
  35. Yang, Y.; Li, M.; Zhu, Z. A Novel Electrochemical Sensor Based on Carbon Nanotubes Array for Selective Detection of Dopamine or Uric Acid. Talanta 2019, 201, 295–300. [Google Scholar] [CrossRef] [PubMed]
  36. Sgobba, V.; Guldi, D.M. Carbon Nanotubes—Electronic/Electrochemical Properties and Application for Nanoelectronics and Photonics. Chem. Soc. Rev. 2009, 38, 165–184. [Google Scholar] [CrossRef]
  37. Li, Y.; Huang, Y.; Zheng, Y.; Huang, R.; Yao, J. Facile and Efficient Synthesis of A-Fe2O3 Nanocrystals by Glucose-Assisted Thermal Decomposition Method and Its Application in Lithium Ion Batteries. J. Power Sources 2019, 416, 62–71. [Google Scholar] [CrossRef]
  38. Quddus, M.; Rahman, M.; Khanam, J.; Biswas, B.; Sharmin, N.; Ahmed, S.; Neger, A. Synthesis and Characterization of Pigment Grade Red Iron Oxide from Mill Scale. Int. Res. J. Pure Appl. Chem. 2018, 16, 1–9. [Google Scholar] [CrossRef]
  39. Zhu, M.; Wang, Y.; Meng, D.; Qin, X.; Diao, G. Hydrothermal Synthesis of Hematite Nanoparticles and Their Electrochemical Properties. J. Phys. Chem. C 2012, 116, 16276–16285. [Google Scholar] [CrossRef]
  40. Campos, E.A.; Pinto, D.V.B.S.; de Oliveira, J.I.S.; da Costa Mattos, E.; Dutra, R.d.C.L. Synthesis, Characterization and Applications of Iron Oxide Nanoparticles—A Short Review. J. Aerosp. Technol. Manag. 2015, 7, 267–276. [Google Scholar] [CrossRef]
  41. Wasag, J.; Grabarczyk, M. Copper Film Modified Glassy Carbon Electrode and Copper Film with Carbon Nanotubes Modified Screen-Printed Electrode for the Cd(Ii) Determination. Materials 2021, 14, 5148. [Google Scholar] [CrossRef]
  42. Abdel-Haleem, F.M.; Gamal, E.; Rizk, M.S.; El Nashar, R.M.; Anis, B.; Elnabawy, H.M.; Khalil, A.S.G.; Barhoum, A. T-Butyl Calixarene/Fe2O3@MWCNTs Composite-Based Potentiometric Sensor for Determination of Ivabradine Hydrochloride in Pharmaceutical Formulations. Mater. Sci. Eng. C 2020, 116, 111110. [Google Scholar] [CrossRef]
  43. Cai, X.-Q.; Zhu, K.; Liu, B.-T.; Zhang, Q.-Y.; Luo, Y.-H.; Zhang, D.-E. γ-Fe2O3/CNTs Composites for Electrochemical Detection of Paracetamol: Synthesis, Phase Transition and Enhanced Properties. J. Electrochem. Soc. 2021, 168, 057511. [Google Scholar] [CrossRef]
  44. Zhang, Z.; Wang, H.; Zhang, Y.; Mu, X.; Huang, B.; Du, J.; Zhou, J.; Pan, X.; Xie, E. Carbon Nanotube/Hematite Core/Shell Nanowires on Carbon Cloth for Supercapacitor Anode with Ultrahigh Specific Capacitance and Superb Cycling Stability. Chem. Eng. J. 2017, 325, 221–228. [Google Scholar] [CrossRef]
  45. Nate, Z.; Gill, A.A.S.; Shinde, S.; Chauhan, R.; Inamdar, S.N.; Karpoormath, R. A Simple In-Situ Flame Synthesis of Nanocomposite (MWCNTs-Fe2O3) for Electrochemical Sensing of Proguanil in Pharmaceutical Formulation. Diam. Relat. Mater. 2021, 111, 108178. [Google Scholar] [CrossRef]
  46. Özcan, A.; Topçuoğulları, D. Voltammetric Determination of 17-Β-Estradiol by Cysteamine Self-Assembled Gold Nanoparticle Modified Fumed Silica Decorated Graphene Nanoribbon Nanocomposite. Sens. Actuators B Chem. 2017, 250, 85–90. [Google Scholar] [CrossRef]
  47. Antoniazzi, C.; de Lima, C.A.; Marangoni, R.; Spinelli, A.; de Castro, E.G. Voltammetric Determination of 17β-Estradiol in Human Urine and Buttermilk Samples Using a Simple Copper(II) Oxide-Modified Carbon Paste Electrode. J. Solid. State Electrochem. 2018, 22, 1373–1383. [Google Scholar] [CrossRef]
  48. Liu, X.; Deng, K.; Wang, H.; Li, C.; Zhang, S.; Huang, H. Aptamer Based Ratiometric Electrochemical Sensing of 17β-Estradiol Using an Electrode Modified with Gold Nanoparticles, Thionine, and Multiwalled Carbon Nanotubes. Microchimica Acta 2019, 186, 347. [Google Scholar] [CrossRef]
  49. Mustafa, S.; Tasleem, S.; Naeem, A. Surface Charge Properties of Fe2O3 in Aqueous and Alcoholic Mixed Solvents. J. Colloid. Interface Sci. 2004, 275, 523–529. [Google Scholar] [CrossRef]
  50. Vega, D.; Agüí, L.; González-Cortés, A.; Yáñez-Sedeño, P.; Pingarrón, J.M. Electrochemical Detection of Phenolic Estrogenic Compounds at Carbon Nanotube-Modified Electrodes. Talanta 2007, 71, 1031–1038. [Google Scholar] [CrossRef]
  51. Ngundi, M.M.; Sadik, O.A.; Yamaguchi, T.; Suye, S.-I. First Comparative Reaction Mechanisms of B-Estradiol and Selected Environmental Hormones in a Redox Environment. Electrochem. Commun 2003, 5, 61–67. [Google Scholar] [CrossRef]
  52. Gosser, D.K. Cyclic Voltammetry: Simulation and Analysis of Reaction Mechanisms, 1st ed.; Wiley–Blackwell: New York, NY, USA, 1993; ISBN 9781560810261. [Google Scholar]
  53. Bard, A.J.; Faulkner, L.R. Electrochemical Methods: Fundamentals and Applications, 2nd ed.; John Wiley & Sons: New York, NY, USA, 2001; ISBN 9781119524113. [Google Scholar]
  54. Spychalska, K.; Zając, D.; Cabaj, J. Electrochemical Biosensor for Detection of 17β-Estradiol Using Semi-Conducting Polymer and Horseradish Peroxidase. RSC Adv. 2020, 10, 9079–9087. [Google Scholar] [CrossRef] [PubMed]
  55. Terui, N.; Fugetsu, B.; Tanaka, S. Voltammetric Behavior and Determination of 17b-Estradiol at Multi-Wall Carbon Nanotube-Nafion Modified Glassy Carbon Electrode. Anal. Sci. 2006, 22, 895–898. [Google Scholar] [CrossRef] [PubMed]
  56. Wong, A.; Santos, A.M.; Fava, E.L.; Fatibello-Filho, O.; Sotomayor, M.D.P.T. Voltammetric Determination of 17β-Estradiol in Different Matrices Using a Screen-Printed Sensor Modified with CuPc, Printex 6L Carbon and Nafion Film. Microchem. J. 2019, 147, 365–373. [Google Scholar] [CrossRef]
  57. Brocenschi, R.F.; Rocha-Filho, R.C.; Duran, B.; Swain, G.M. The Analysis of Estrogenic Compounds by Flow Injection Analysis with Amperometric Detection Using a Boron-Doped Diamond Electrode. Talanta 2014, 126, 12–19. [Google Scholar] [CrossRef]
  58. Yilmaz, B.; Kadioglu, Y. Determination of 17 β-Estradiol in Pharmaceutical Preparation by UV Spectrophotometry and High Performance Liquid Chromatography Methods. Arab. J. Chem. 2017, 10, S1422–S1428. [Google Scholar] [CrossRef]
  59. Neto, V. Synthesis of Iron-Containing Composites: Characterization and Thin Films for Application in Photoelectrocatalysis. Ph.D Thesis, State University of Londrina, Londrina, Brazil, 2020. [Google Scholar]
  60. Janegitz, B.C.; Pauliukaite, R.; Ghica, M.E.; Brett, C.M.A.; Fatibello-Filho, O. Direct Electron Transfer of Glucose Oxidase at Glassy Carbon Electrode Modified with Functionalized Carbon Nanotubes within a Dihexadecylphosphate Film. Sens. Actuators B Chem. 2011, 158, 411–417. [Google Scholar] [CrossRef]
  61. Laube, N.; Mohr, B.; Hesse, A. Laser-Probe-Based Investigation of the Evolution of Particle Size Distributions of Calcium Oxalate Particles Formed in Artificial Urines. J. Cryst. Growth 2001, 233, 367–374. [Google Scholar] [CrossRef]
  62. ICH Expert Working Group. Validation Of Analytical Procedures: Text and Methodology Q2(R1). Available online: https://database.ich.org/sites/default/files/Q2%28R1%29%20Guideline.pdf (accessed on 16 July 2023).
Figure 1. (A) Raman spectra of CNT, α-Fe2O3, and α-Fe2O3-CNT; (B) EDX spectrum of α-Fe2O3-CNT; (C) SEM image of α-Fe2O3-CNT.
Molecules 28 06372 g001
Figure 2. Cyclic voltammograms obtained for 0.1 µmol L−1 E2 in KCl solution (10% v/v ethanol) pH 7.0 using bare GCE, α-Fe2O3-CNT/GCE (1.0 mg mL−1), and α-Fe2O3-CNT/GCE (2.0 mg mL−1). Scan rate: 50.0 mV s−1.
Molecules 28 06372 g002
Figure 3. (A) Cyclic voltammograms obtained for 0.1 µmol L−1 E2 in 0.1 mol L−1 KCl solution (10% v/v ethanol), pH 7.0, using α-Fe2O3-CNT/GCE at different scan rates (10–250 mV s−1). (B) Relation of Ip versus ν1/2; Inset: relation of log Ip (μA) versus log (ν1/2) (mV s−1). The arrow indicates the direction of the potential scan in cyclic voltammetry.
Molecules 28 06372 g003
Figure 4. Reaction mechanism proposed for E2 oxidation on the α-Fe2O3-CNT/GCE surface.
Molecules 28 06372 g004
Figure 5. Square wave voltammograms obtained for 0.1 µmol L−1 E2 using (A) bare GCE, (B) CNT/GCE (1.0 mg mL−1), (C) α-Fe2O3-CNT/GCE. Supporting electrolyte: 0.1 mol L−1 KCl solution (10% v/v ethanol) pH 7.0, SWV parameters: (ꬵ) = 60 s−1; (a) = 40 mV, and (ΔEs) = 6 mV.
Molecules 28 06372 g005
Figure 6. (A) SW voltammograms obtained for E2 in different concentrations: (a) blank; (b) 5.00; (c) 10.00; (d) 30.00; (e) 50.00; (f) 80.00; and (g) 100.00 nmol L−1; (B) Analytical curve obtained for E2, using an α-Fe2O3-CNT/GCE. Supporting electrolyte: 0.1 mol L−1 KCl solution (10% v/v ethanol) pH 7.0. SWV parameters: () = 60 s−1; (a) = 40 mV and (ΔEs) = 6 mV.
Molecules 28 06372 g006
Figure 7. Bar diagram of the interference effect study for E2 determination.
Molecules 28 06372 g007
Table 1. Comparison of results obtained for determination of E2 by the here-proposed method and by other electrochemical methods reported in the literature.
SensorTechniqueLinear Range
(mol L−1)
LOD
(mol L−1)
Reference
RGO-CuTthP/GCE aDPV1.0 × 10−7–1.0 × 10−65.3 × 10−9[6]
wMC/GCE bDPV5.0 × 10−8–1.0 × 10−58.3 × 10−9[13]
MMIP/MCPEc cDPAdSV6.0 × 10−8–1.8 × 10−42.0 × 10−8[14]
mag-MIP/GEC dSWV5.0 × 10−8–7.5 × 10−41.0 × 10−8[15]
AuNP-MWCNT/GCE eLSV1.0 × 10−6–2.0 × 10−57.0 × 10−9[16]
rGO-AuNPs/CNT/SPE fDPV5.0 × 10−8–1.0 × 10−63.0 × 10−9[17]
Ab-Au-RG-SPCE gEIS j0.0–1.2 × 10−71.5 × 10−9[18]
LAC-CP/Pt hCV1.0 × 10−7–1.2 × 10−49.9 × 10−7[19]
LAC-GQDs/Au iCV5.0 × 10−6–5.0 × 10−51.5 × 10−6
CuO/CPE jSWV6.0 × 10−8–8.0 × 10−72.1 × 10−8[47]
AuNP-Thi-CNTs/GCE kDPV1.2 × 10−11–6.0 × 10−81.5 × 10−12[48]
Fe3O4-NC/GCE lDPV1.0 × 10−8–2.0 × 10−54.9 × 10−9[20]
Fe3O4 NPs-BMI.PF6/CPE mSWV1.0 × 10−7–1.0 × 10−65.0 × 10−8[21]
HRP-Pol/Pt nDPV1.0 × 10−7–2.0 × 10−41.0 × 10−7[54]
Fe3O4-MIP/SPCE oSWV5.0 × 10−8–1.0 × 10−52.0 × 10−8[22]
Fe3O4-MIP@RGO/GCE pDPV5.0 × 10−8–1.0 × 10−58.2 × 10−10[23]
MWCNT/GCE qSWV2.5 × 10−7–1.0 × 10−51.0 × 10−8[55]
CuPc-P6LC-Nafion/SPEF rDPV8.0 × 10−8–7.3 × 10−65.0 × 10−9[56]
Fe2O3-CNT/GCESWV5.0 × 10−9–1.0 × 10−74.4 × 10−9This work
a RGO-CuTthP/GCE: Glassy carbon modified with Cu(II)-meso-tetra(thien-2-yl) porphyrin supported over reduced graphene oxide; b wMC/GCE: Glassy carbon electrode modified with wrinkled mesoporous carbon (wMC) nanomaterial; c MMIP/MCPEc: Magneto carbon paste electrode based on magnetic molecularly imprinted polymer; d mag-MIP/GEC: Graphite–epoxy composite electrode modified with magnetic nanoparticles (mag; Fe3O4) coated with molecularly imprinted polymers (MIPs); e AuNP-MWCNT/GCE: Glassy carbon electrode modified with multi-walled carbon nanotube and gold nanoparticle; f rGO-AuNPs/CNT/SPE: Screen-printed electrode modified with gold-nanoparticle-decorated reduced graphene oxide–carbon nanotubes; g Ab-Au-RG-SPCE: Screen-printed carbon electrode modified with electro-reduced graphene and porous gold structure; h LAC-CP/Pt: Platinum electrode modified with poly [4-(5-hexylthiophen-2-yl)-2,6-bis(5-(selenophen-2-yl)thiophen-2-yl)pyridine] (conducting polymer) and laccase; i LAC-GQDs/Au: Gold electrode modified with graphene quantum dots and laccase; j CuO/CPE: Carbon paste electrode modified with Copper (II) oxide; k AuNP-Thi-CNTs/GCE: Glassy carbon electrode with carbon nanotubes, thinine and gold nanoparticles; l Fe3O4-NC/GCE: Glassy carbon electrode modified with Fe3O4-doped nanoporous carbon; m Fe3O4 NPs-BMI.PF6/CPE: Carbon paste electrode modified with Fe3O4 magnetite nanoparticles and 1-butyl-3-methylimidazolium hexafluorophosphate ionic liquid; n HRP-Pol/Pt: Platinum electrode modified with polymer-poly(4,7-bis(5-(3,4-ethylenedioxythiophene)thiophen-2-yl)benzothiadiazole) and horseradish peroxidase; o Fe3O4-MIP/SPCE: Screen-printed carbon electrode modified with magnetic molecularly imprinted polymer; p Fe3O4-MIP@RGO/GCE: Glassy carbon electrode modified with Fe3O4 nanobeads immobilized on graphene; q MWCNT/GCE: Glassy carbon electrode modified with a multi-walled carbon nanotube; r CuPc-P6LC-Nafion/SPEF: Screen-printed electrode made of carbon ink modified with copper phthalocyanine (CuPc), Printex 6L carbon P6LC and nafion film.
Table 2. Addition and recovery study for E2 determination in lake water and synthetic urine samples using α-Fe2O3-CNT/GCE.
SampleAdded (µmol L−1)Found (µmol L−1)Recovery (%) a
Lake water0.050.052 ± 0.005105
Synthetic urine0.050.050 ± 0.007100
a Recovery (%) = ([Found]/[Added]) × 100%; n = 3.
Table 3. Results obtained for E2 determination in commercial pharmaceutical samples by the proposed SW voltammetric method and the high-performance liquid chromatography (HPLC) comparative method.
E2 Concentration (mg/Tablet)
SampleLabeledHPLC MethodProposed MethodRelative Error (%) a
11.00.96 ± 0.020.95 ± 0.051.0
22.01.83 ± 0.031.81 ± 0.021.1
a RE (%) = [(Proposed method content) − (HPLC method content)/(HPLC method content)] × 100%.
Disclaimer/Publisher’s Note: The statements, opinions and data contained in all publications are solely those of the individual author(s) and contributor(s) and not of MDPI and/or the editor(s). MDPI and/or the editor(s) disclaim responsibility for any injury to people or property resulting from any ideas, methods, instructions or products referred to in the content.

