1. Introduction
Vinyl acetate is a colorless, flammable liquid with a sweet, ether flavor. Because of the presence of carbon–carbon double bonds, vinyl acetate is active, and chemical reactions, such as addition and polymerization reactions, are prone to occurring [
1]. In industry, vinyl acetate is mainly used as a polymer or copolymer monomer in the synthesis of polyvinyl acetate homopolymer emulsions, vinyl acetate ethylene copolymer emulsions, ethylene vinyl alcohol copolymer emulsions, and other common adhesives that are widely used in the food, construction, and other industries [
2,
3,
4,
5]. Vinyl acetate is irritating to the eyes, skin, mucous membranes, and upper respiratory tract, and long-term exposure can anesthetize nerves. It has been proven that vinyl acetate is carcinogenic to animals, and it is classified as a class 2B carcinogen [
6,
7]. The food, construction, and other industries in China have restrictions on the allowable content of vinyl acetate in specific industrial products [
8]. Therefore, analytical methods for the accurate measurement of vinyl acetate are required in order to provide quality assurance for commercial products. Currently, the reported analysis methods include the saponification [
9], thermo-gravimetric [
10], nuclear magnetic resonance (NMR) spectroscopy [
11], infrared spectroscopy [
12], and gas chromatography (GC) [
13] methods. Because of its high accuracy and sensitivity, chromatography is a common method for the quantitative determination of vinyl acetate, and several chromatographic methods have been reported for the quantitative determination of vinyl acetate in food contact materials [
14], plastics [
15], and white latex [
16]. However, chromatographic quantification usually requires a certified reference material (CRM) to prepare a standard solution. Therefore, it is necessary to establish a measurement method for a vinyl acetate CRM and to use this vinyl acetate CRM to make the currently used methods more accurate and convenient.
There have been few reports of purity determination methods for vinyl acetate. Accurate purity determination methods are the basis for the development of CRMs, and play an important role in the establishment of measurement traceability, the calibration of instruments, and verification methods [
17,
18], Therefore, CRMs have important uses in food, medicine, and other fields [
19,
20,
21].
In the development of CRMs, the quantitative nuclear magnetic resonance (q-NMR) [
22,
23], thermal analysis [
24,
25], and mass balance [
26,
27,
28,
29] methods are commonly used methods for measuring the purity of organic substances. The mass balance method is generally considered to be a relatively high-precision method for purity determination, and can be directly traced back to the SI units of mass (kg) and amount of substance (mol). The mass balance method is one of the main methods for determining the purity of substances in the Organic Analysis Work Group of the International Bureau of Weights and Measures [
30]. The mass balance method is also one of the methods for determining the purity of pharmaceutical reference substances that is recommended by the World Health Organization and the European Pharmacopoeia [
31,
32]. Mass balance, high performance liquid chromatography (HPLC), and differential scanning calorimetry (DSC) were used by Kang Ma et al. to determine the purity of a theophylline CRM, and the accuracy of the mass balance method was shown to be better than that of the other methods [
33]. With the mass balance method, HPLC and GC are frequently used to measure organic components. A mass balance method combined with gas chromatography–mass spectrometry was used by Wang et al. [
34] to determine the content of benzene and to investigate the accuracy of DSC and q-NMR measurements. The mass balance method was used by Chen et al. to assign purity to four unsaturated fatty acid esters; the gas chromatographic area normalization method was used to determine the content of the main components; and the content of volatile impurities, moisture, and non-volatile impurities was calculated [
35]. However, because of the nonlinear response of the detector, the percentages calculated from the peak areas were not equal to the percentages of each component. Therefore, a correction factor was introduced by Wang et al. to correct the values for the purity obtained by area normalization to produce more accurate measurement results [
36].
However, it is still a challenge to determine vinyl acetate’s purity using the mass balance method, which can mainly be attributed to the difficulty of identifying and quantifying the organic impurities in vinyl acetate. This difficulty occurs because vinyl acetate and the organic impurities in it have small molecular weights and are difficult to separate.
Therefore, in the present study, a new pure CRM for vinyl acetate was developed, and a mass balance method was established to determine the purity of the vinyl acetate. The gas chromatographic area normalization results were corrected and recalculated by characterizing and calculating the relative correction factors for three organic impurities in vinyl acetate. In addition, a homogeneity test and stability study were carried out on the prepared vinyl acetate CRM, and the uncertainty of the CRM was evaluated.
3. Materials and Methods
3.1. Apparatus and Materials
Low-resolution mass spectrometry (Agilent 6890N-5973N GC/MS, USA), high-resolution mass spectrometry (Agilent 7890A/7200 Q-TOF GC/MS, USA), superconducting nuclear magnetic resonance spectroscopy (Bruker AV-500, USA), and Fourier transform infrared spectrometry (Thermo Fisher, Waltham, MA, USA, Thermo Nicolet In10MX-Iz10, USA) were used to characterize the CRM candidate; gas chromatography was also performed on an Agilent 6890N-5973N GC/MS instrument (Agilent Technologies, Santa Clara, CA, USA) equipped with a flame ionization detector (FID). The present study also employed a Karl Fischer automatic moisture analyzer (Mettler C30, Mettler Toledo, Zurich, Switzerland), an inductively coupled plasma mass spectrometer (Agilent 7500a, USA), and a potentiometric titrator (Mettler T50, Mettler Toledo, Switzerland).
The CRM candidate material for vinyl acetate required for the experiment was commissioned from the Beijing Oriental Organic Chemical Factory. Methyl acetate, ethyl acetate, and vinyl propionate were all standard products produced by Dr. Ehrenstorfer, Germany. The Karl Fischer reagent (without pyridine) had a titer of approximately 2–5 mg/mL. All other reagents used were of analytical grade or higher.
3.2. Methods
3.2.1. Preparation of CRM Candidate
Because of the instability and toxicity of vinyl acetate, the raw materials for vinyl acetate used in this study were prepared by the Beijing Dongfang Organic Chemical Factory (Beijing, China), the main information about the reagents can be obtained from the
Table S1.
Preparation method: Acetic acid, ethylene, and oxygen underwent a gas phase reaction under the action of a catalyst. After the reaction was completed, the obtained mixture was purified by rectification three times, and finally, vinyl acetate raw material was obtained. The material was cooled to −18 °C and dispensed into 2 mL brown ampoules under nitrogen protection, and the ampoules were immediately sealed. The same batch of vinyl acetate feedstock was used to fill 450 vials of CRM candidate before being stored at 4 °C.
3.2.2. Characterization of the CRM Candidate
- (1)
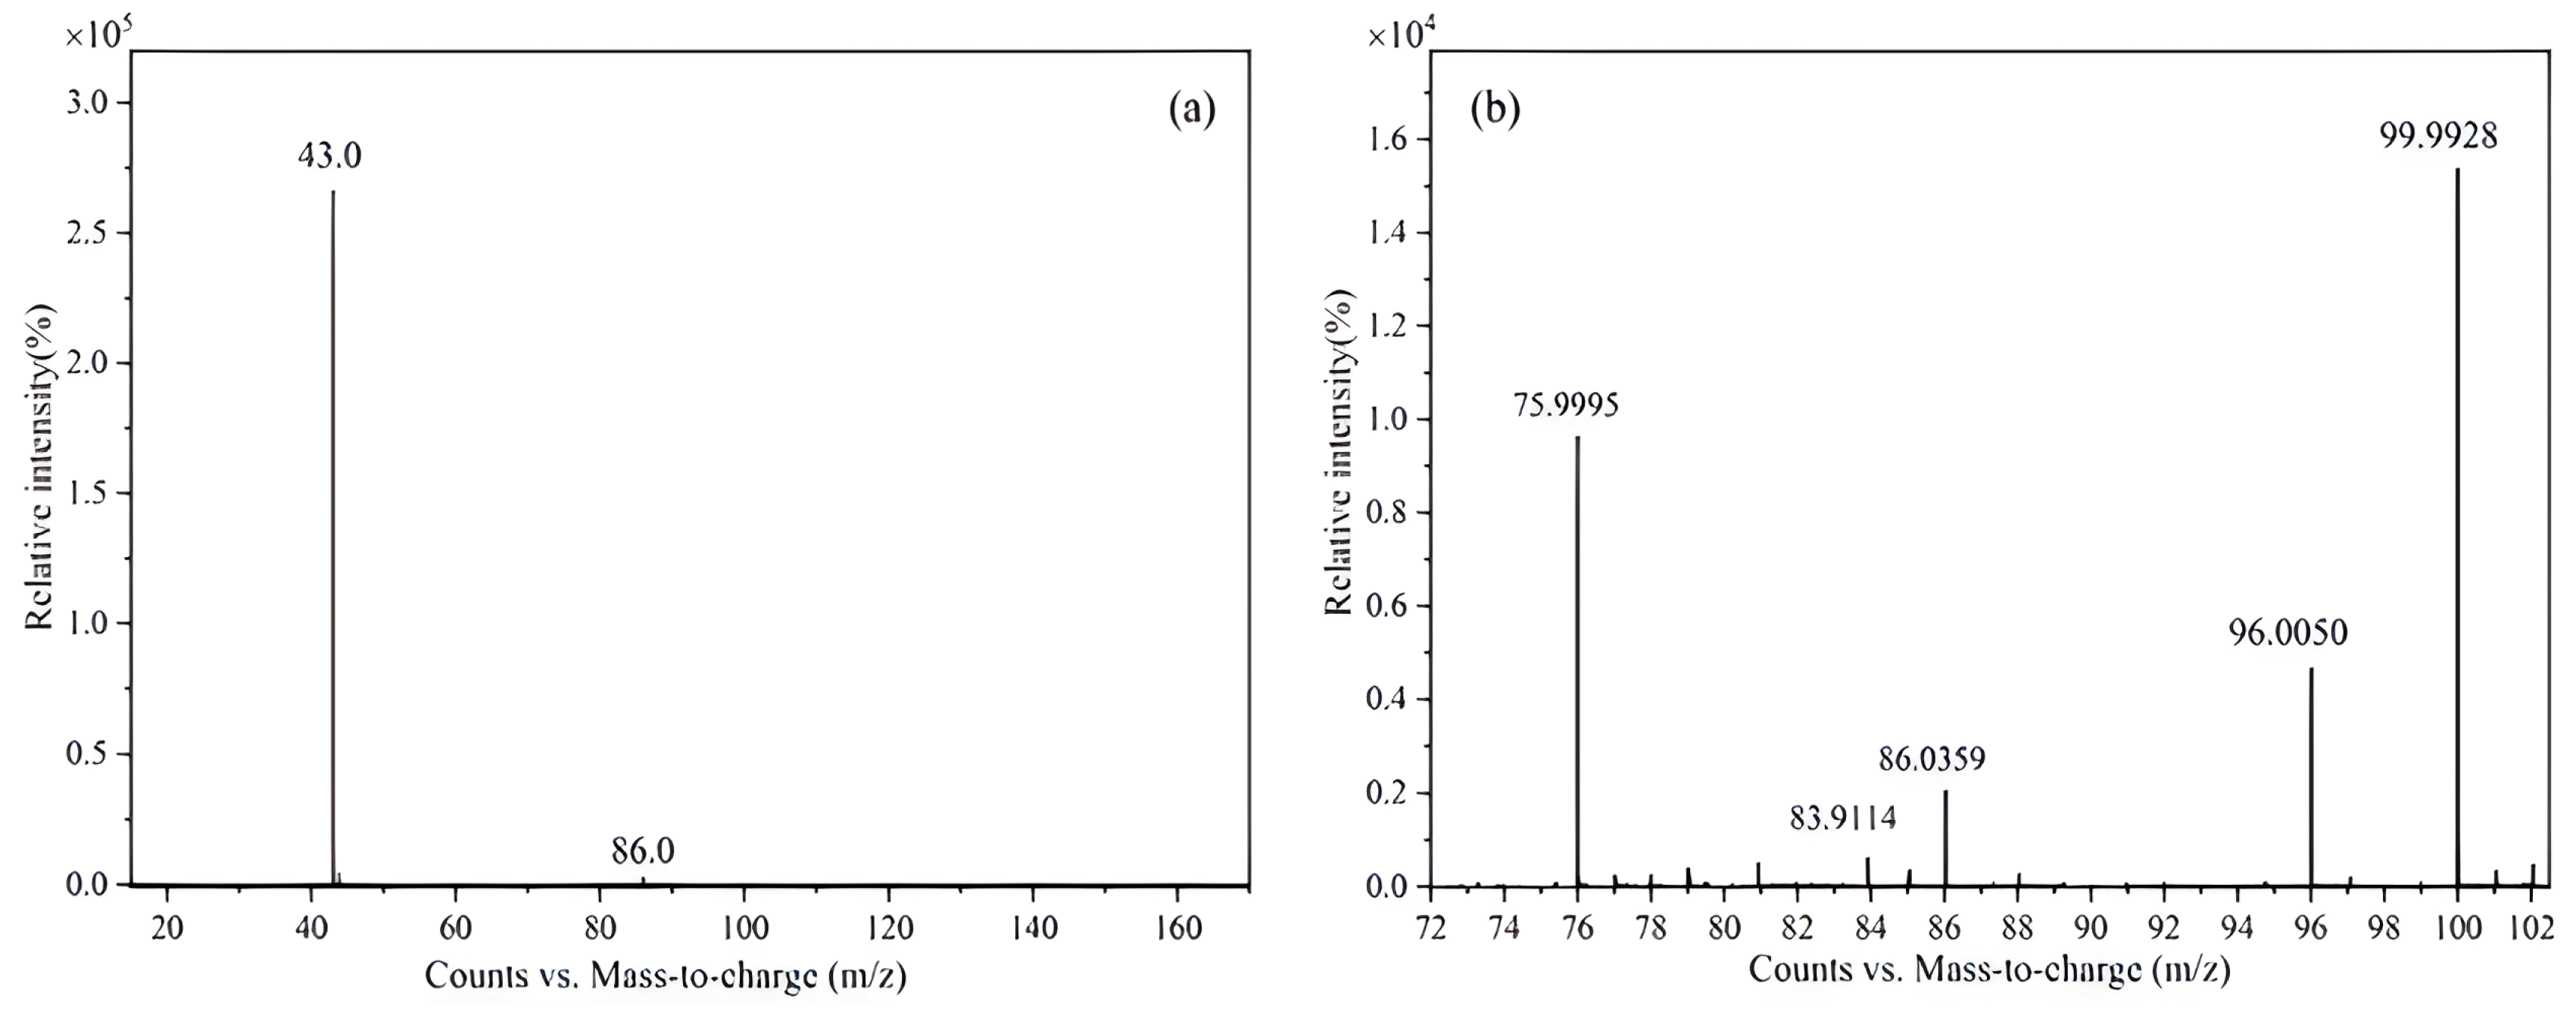
MS analysis
The CRM candidate was characterized by MS, and the molecular weights were determined. A 250 μL sample of CRM was introduced to a DB-5MS capillary column (30 m × 0.25 mm × 0.25 μm) for separation. The experimental conditions were as follows: The carrier gas was helium; the flow rate in constant flow mode was 1 mL/min; the inlet temperature was 200 °C; the ion source temperature was 230 °C; the quadrupole temperature was 150 °C; the transfer line temperature was 250 °C; the split ratio was 100:1; the ionization method was electron bombardment ionization (EI) (70 eV); and the heating program progressed from an initial temperature of 35 °C to the target temperature over 10 min. The range of mass m/z = 30–350 was scanned using a one-level full scan.
- (2)
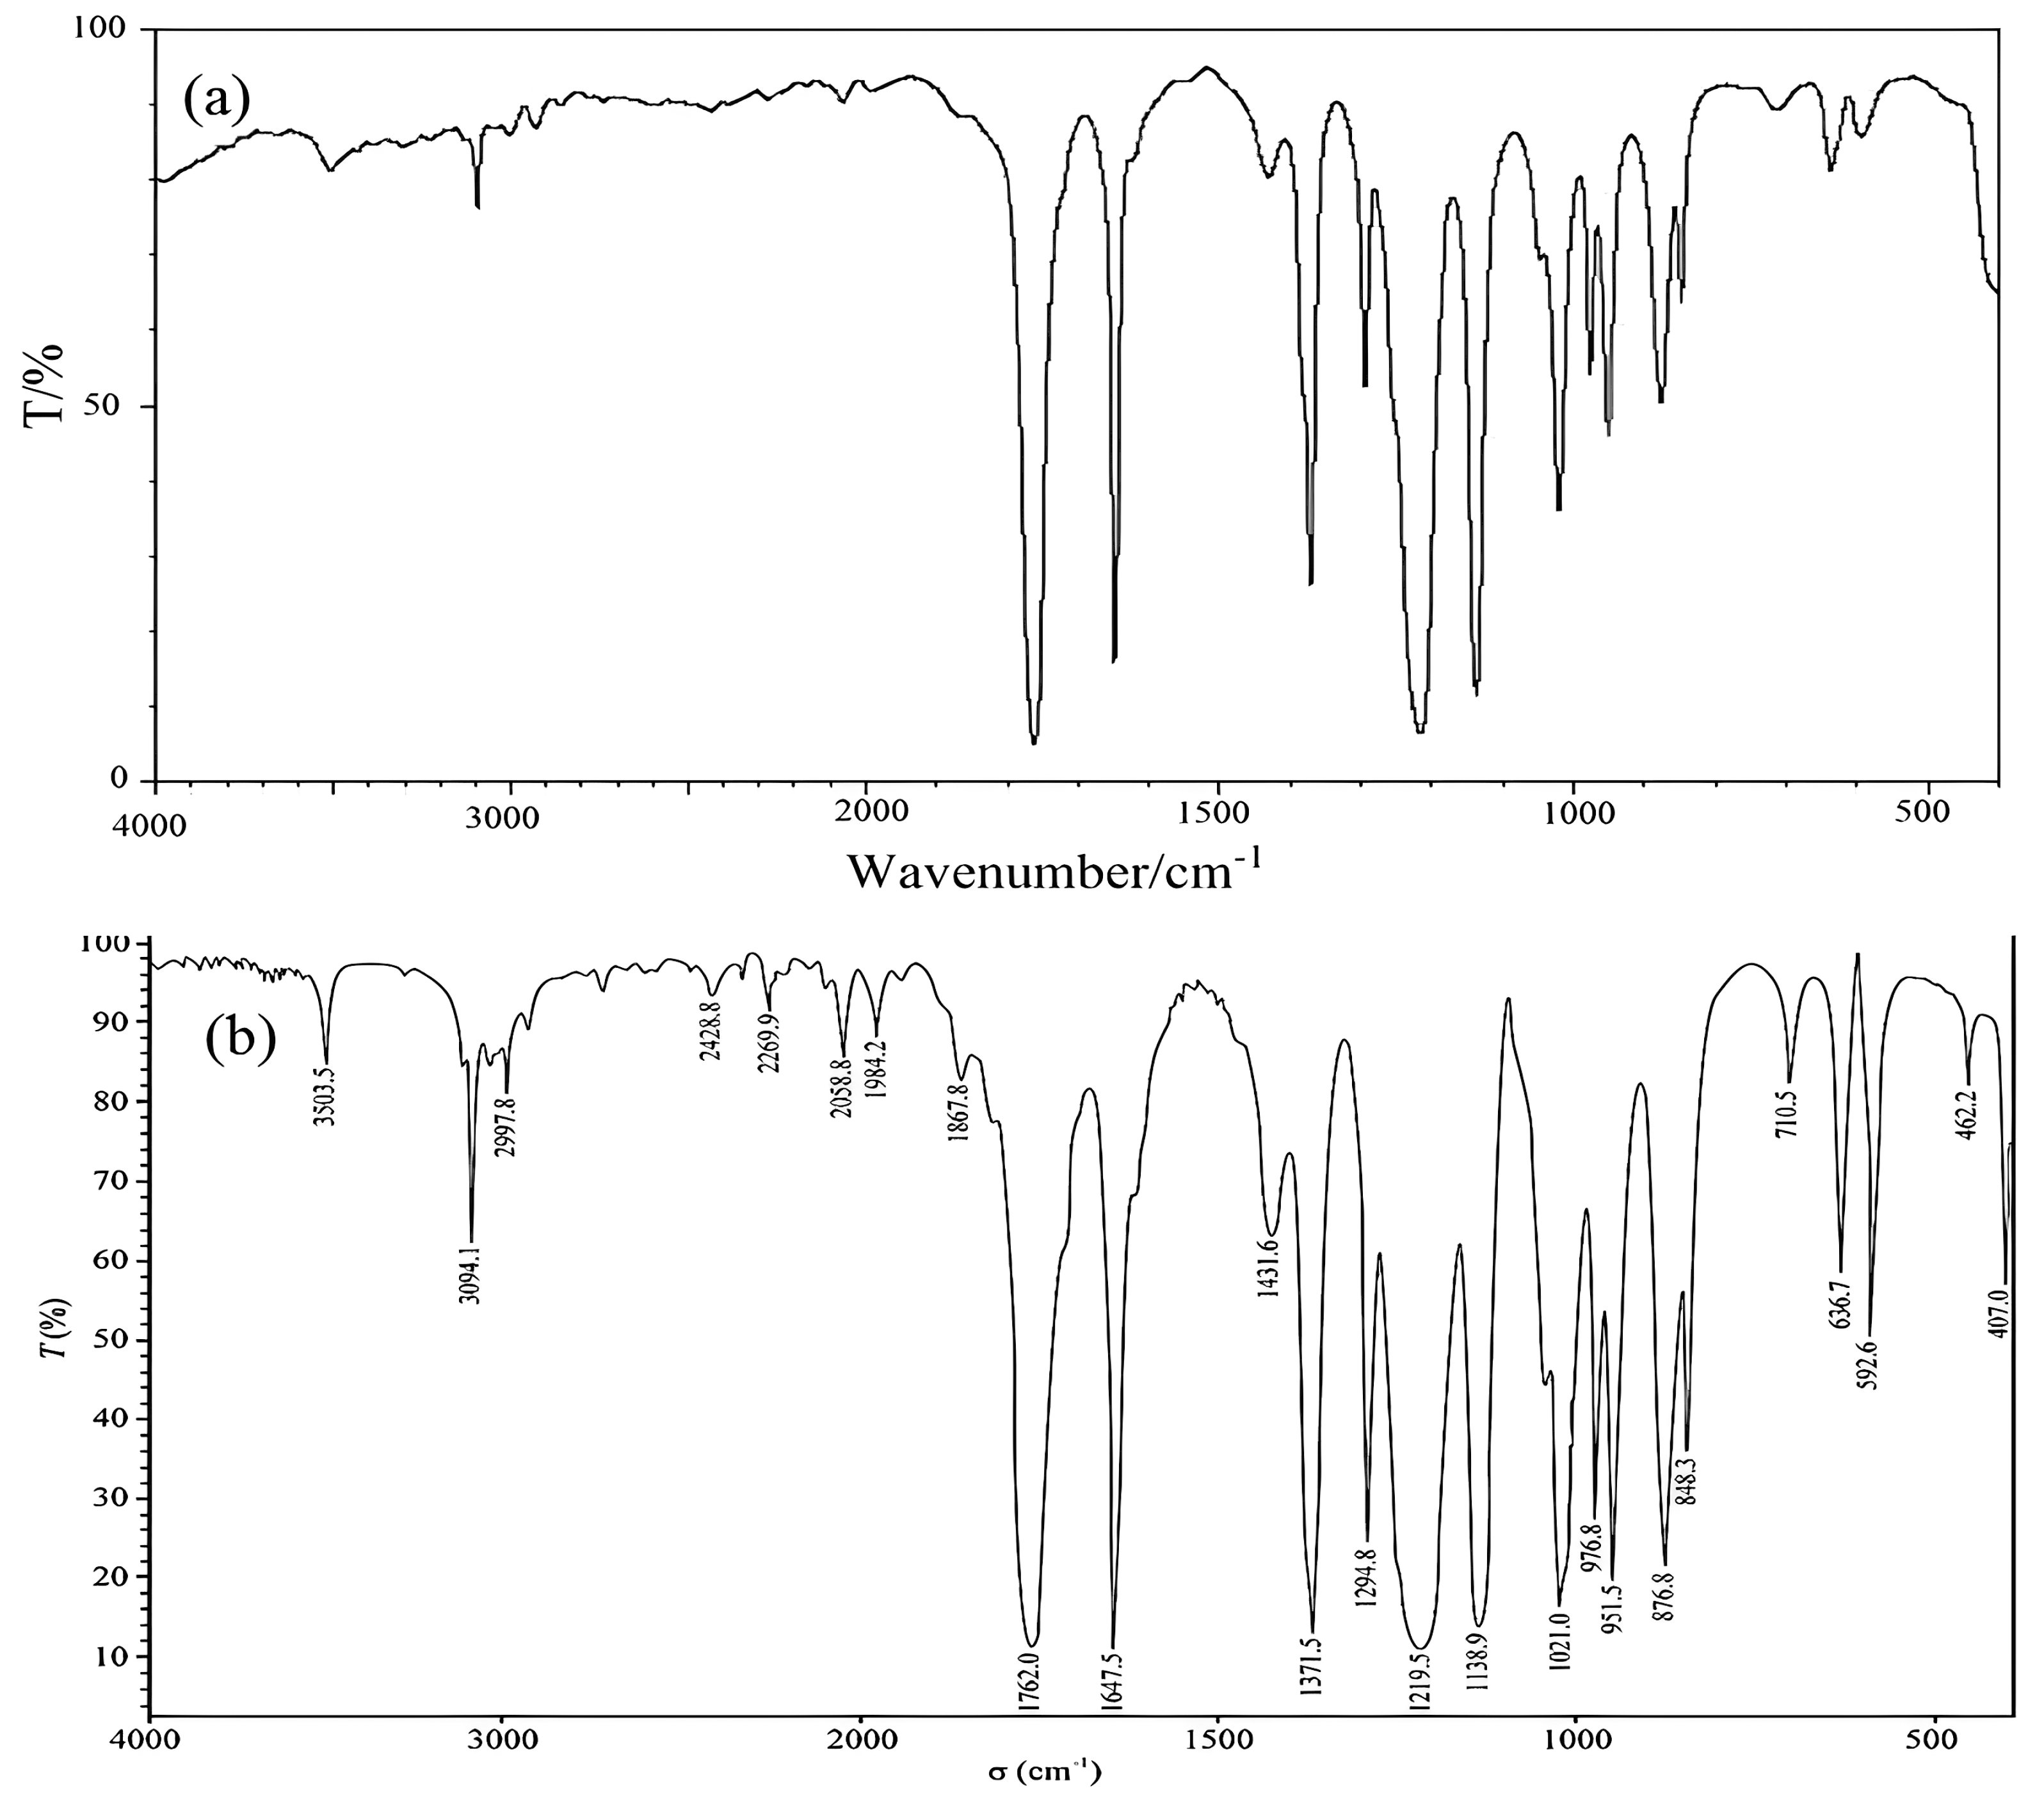
FT-IR
FT-IR spectroscopy was used to characterize the structures of the CRM candidate. Samples were prepared using the liquid film method, and infrared spectra were collected using the attenuated total reflection (ATR) technique using the infrared wavelength of polystyrene as a reference. All infrared spectra were acquired in the range of 4000–400 cm−1 at a resolution of 4.000 cm−1.
- (3)
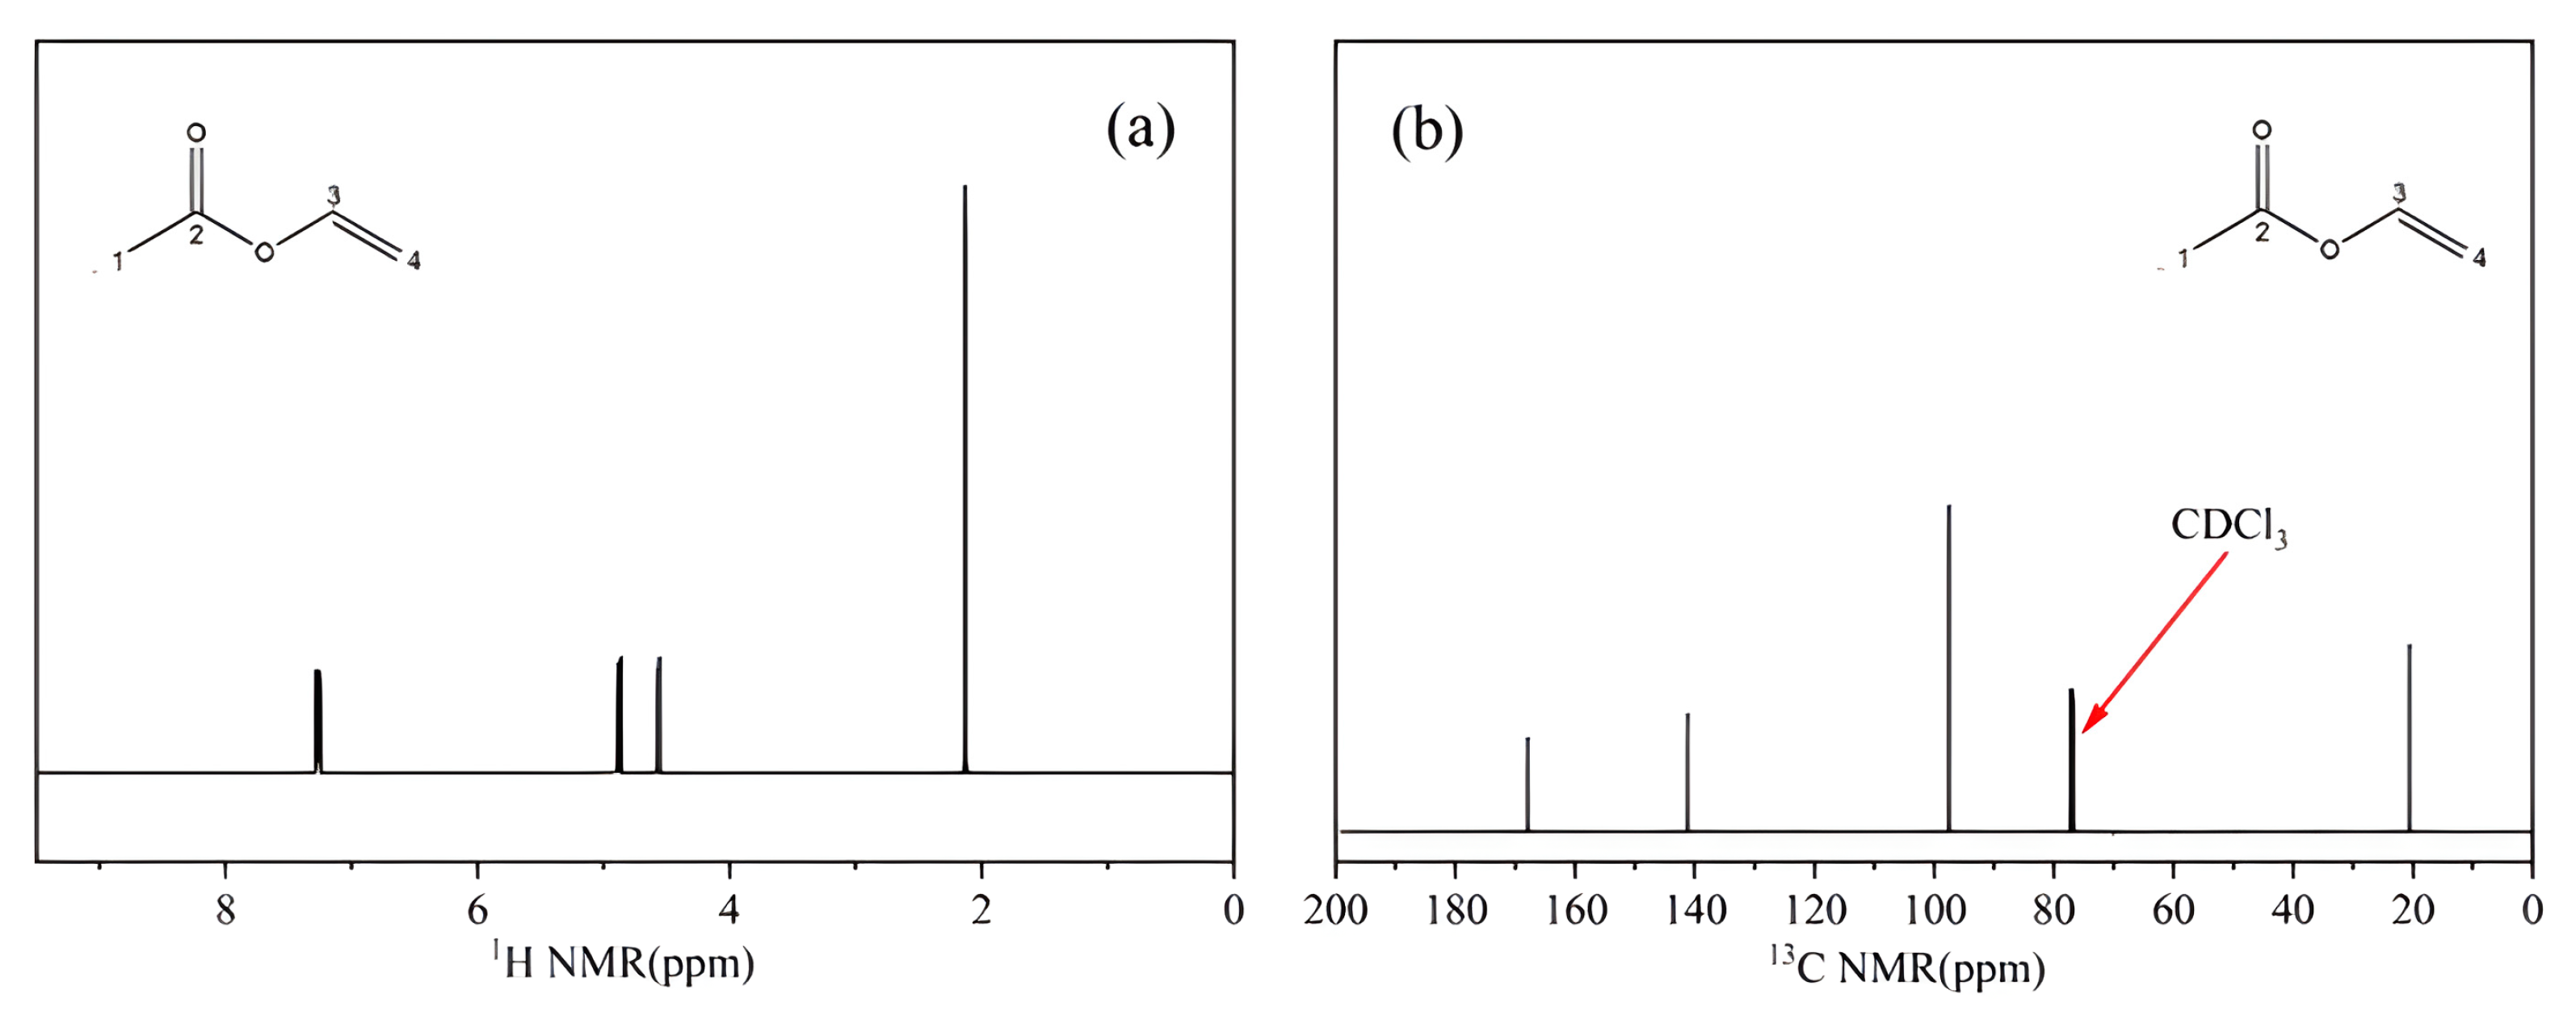
NMR
A sample of the CRM candidate (0.5 mg) was weighed and dissolved in 0.50 mL of CDCl3, and the proton and carbon spectra were acquired by means of superconducting NMR.
3.2.3. Mass Balance Method
The mass balance method involves the measurement of the major components in a sample, as well as moisture, less volatile impurities, and organic acids. According to the content of each component, the purity of vinyl acetate can be calculated by Equation (12) [
40].
where
Pim,
Pw,
Pn, and
Pa are the contents of organic impurities, water, non-volatile impurities, and organic acids, respectively, in the raw material.
- (1)
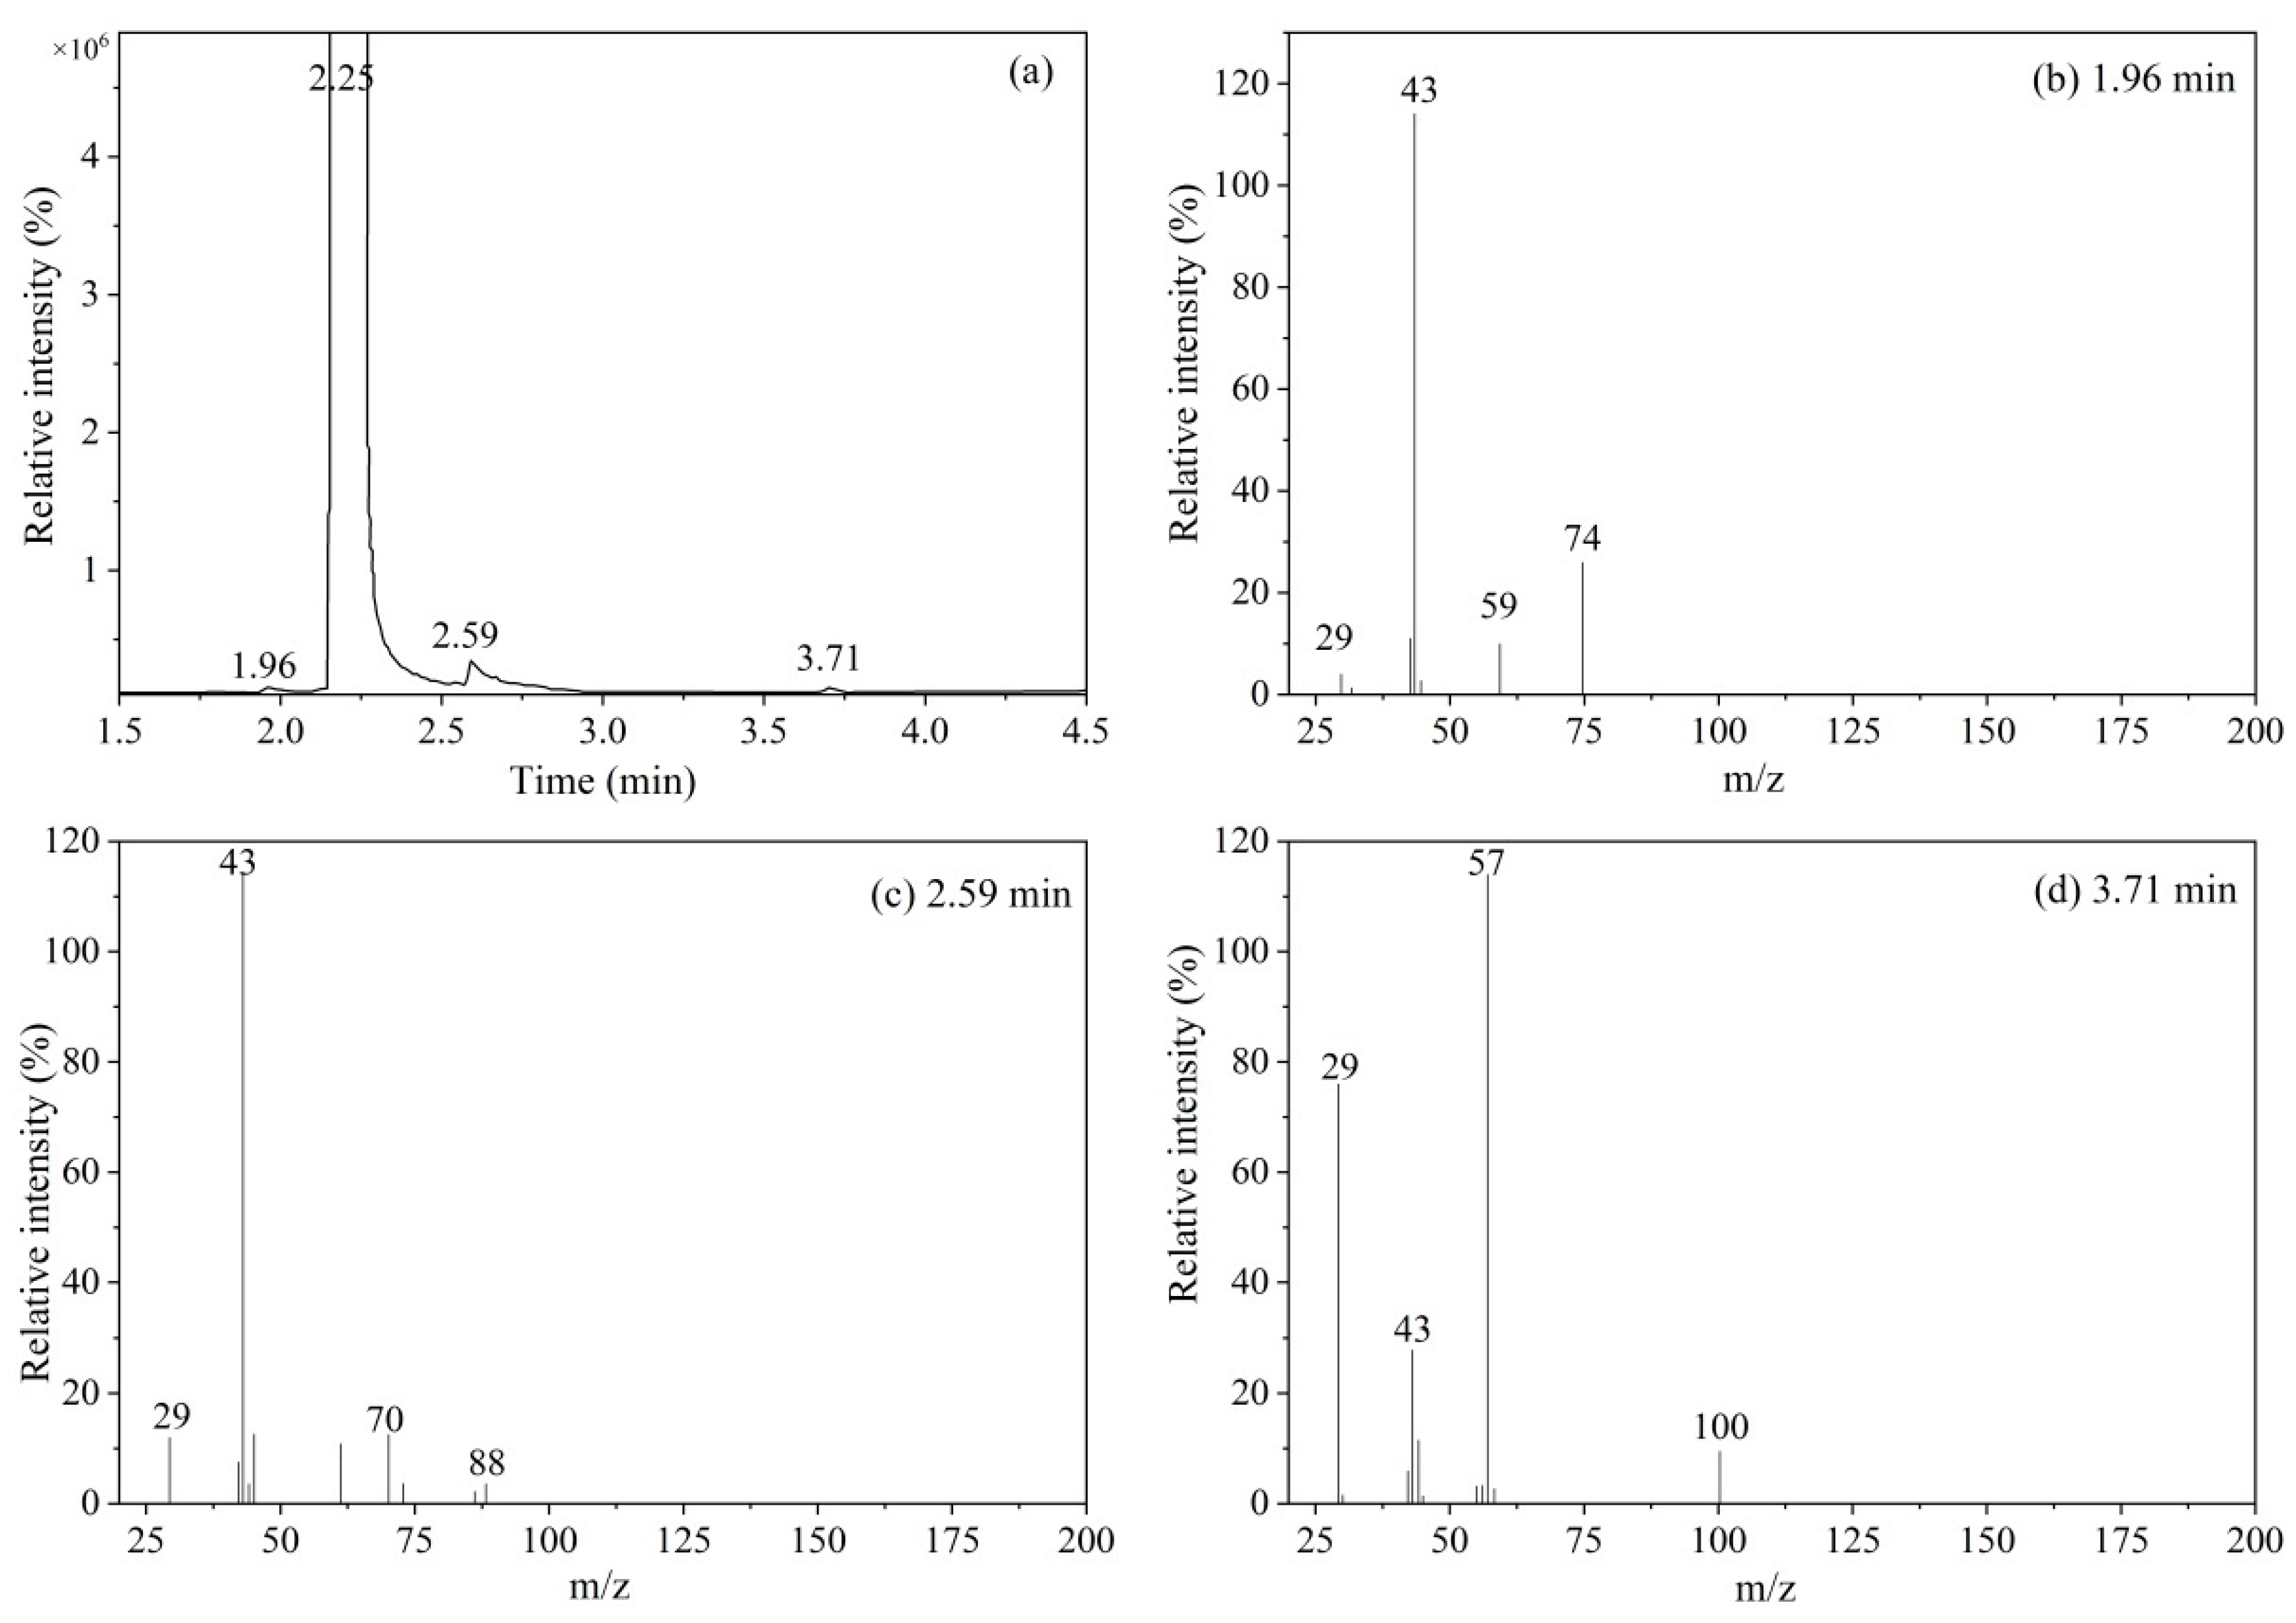
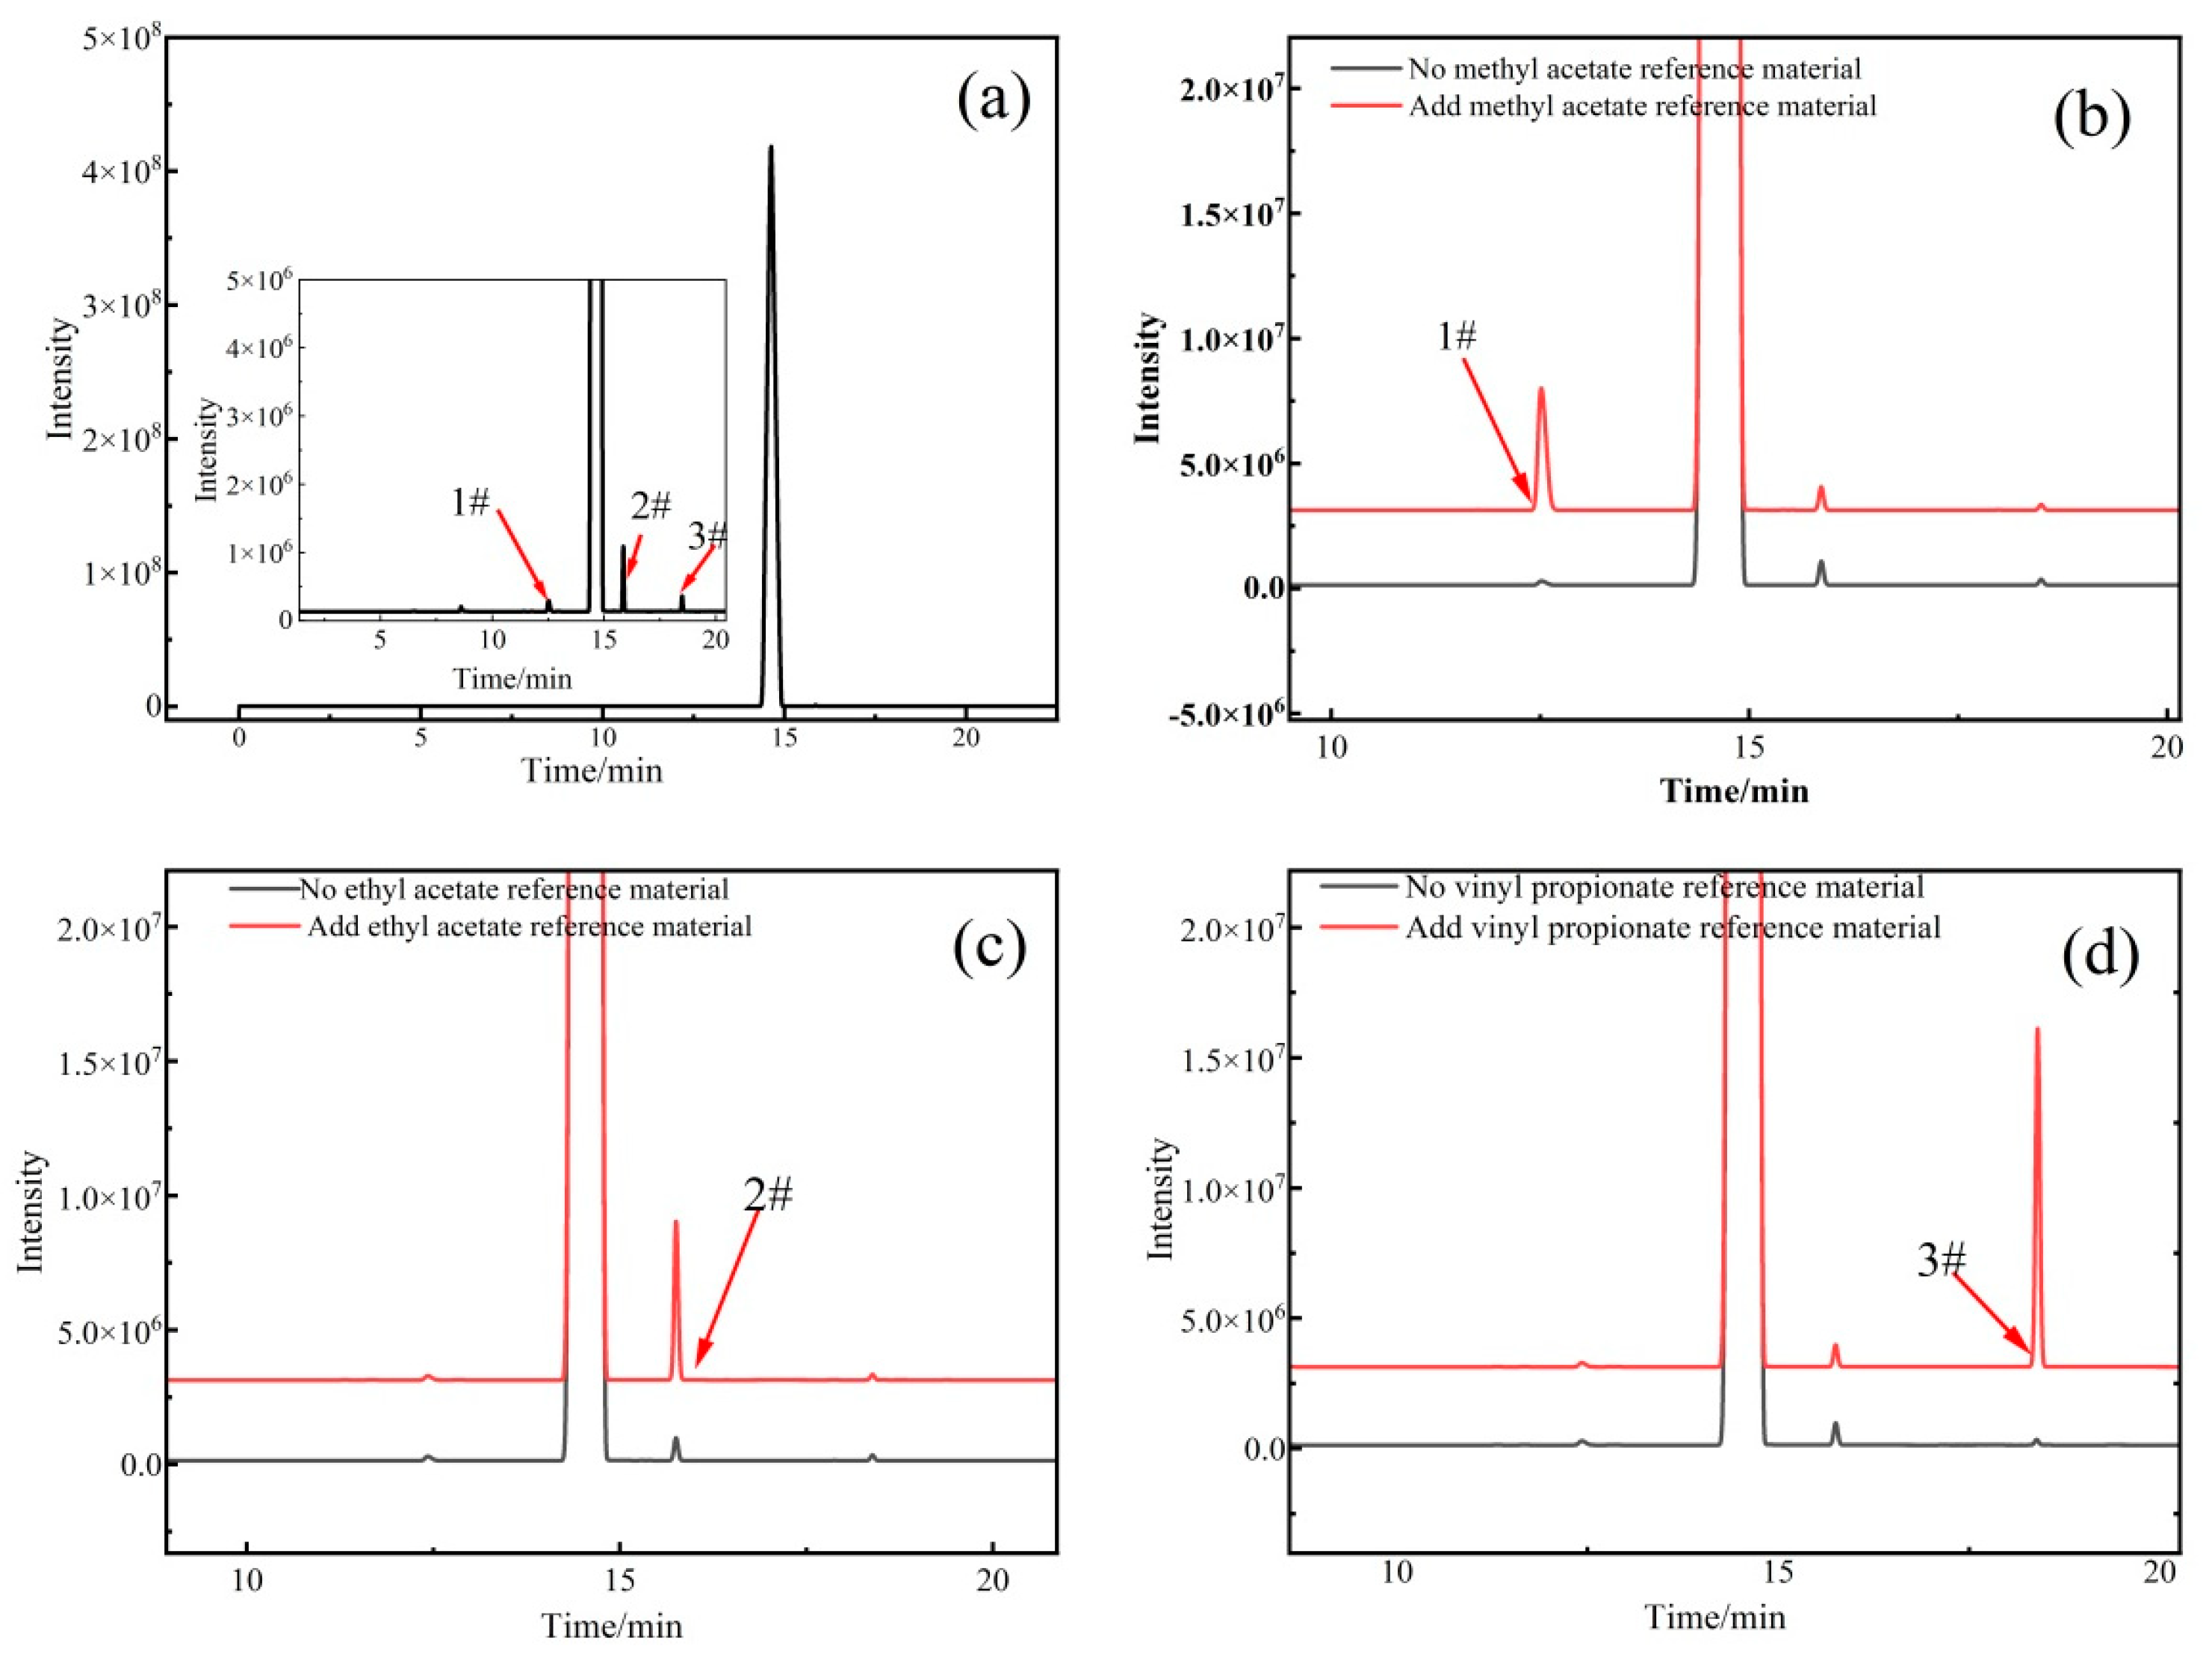
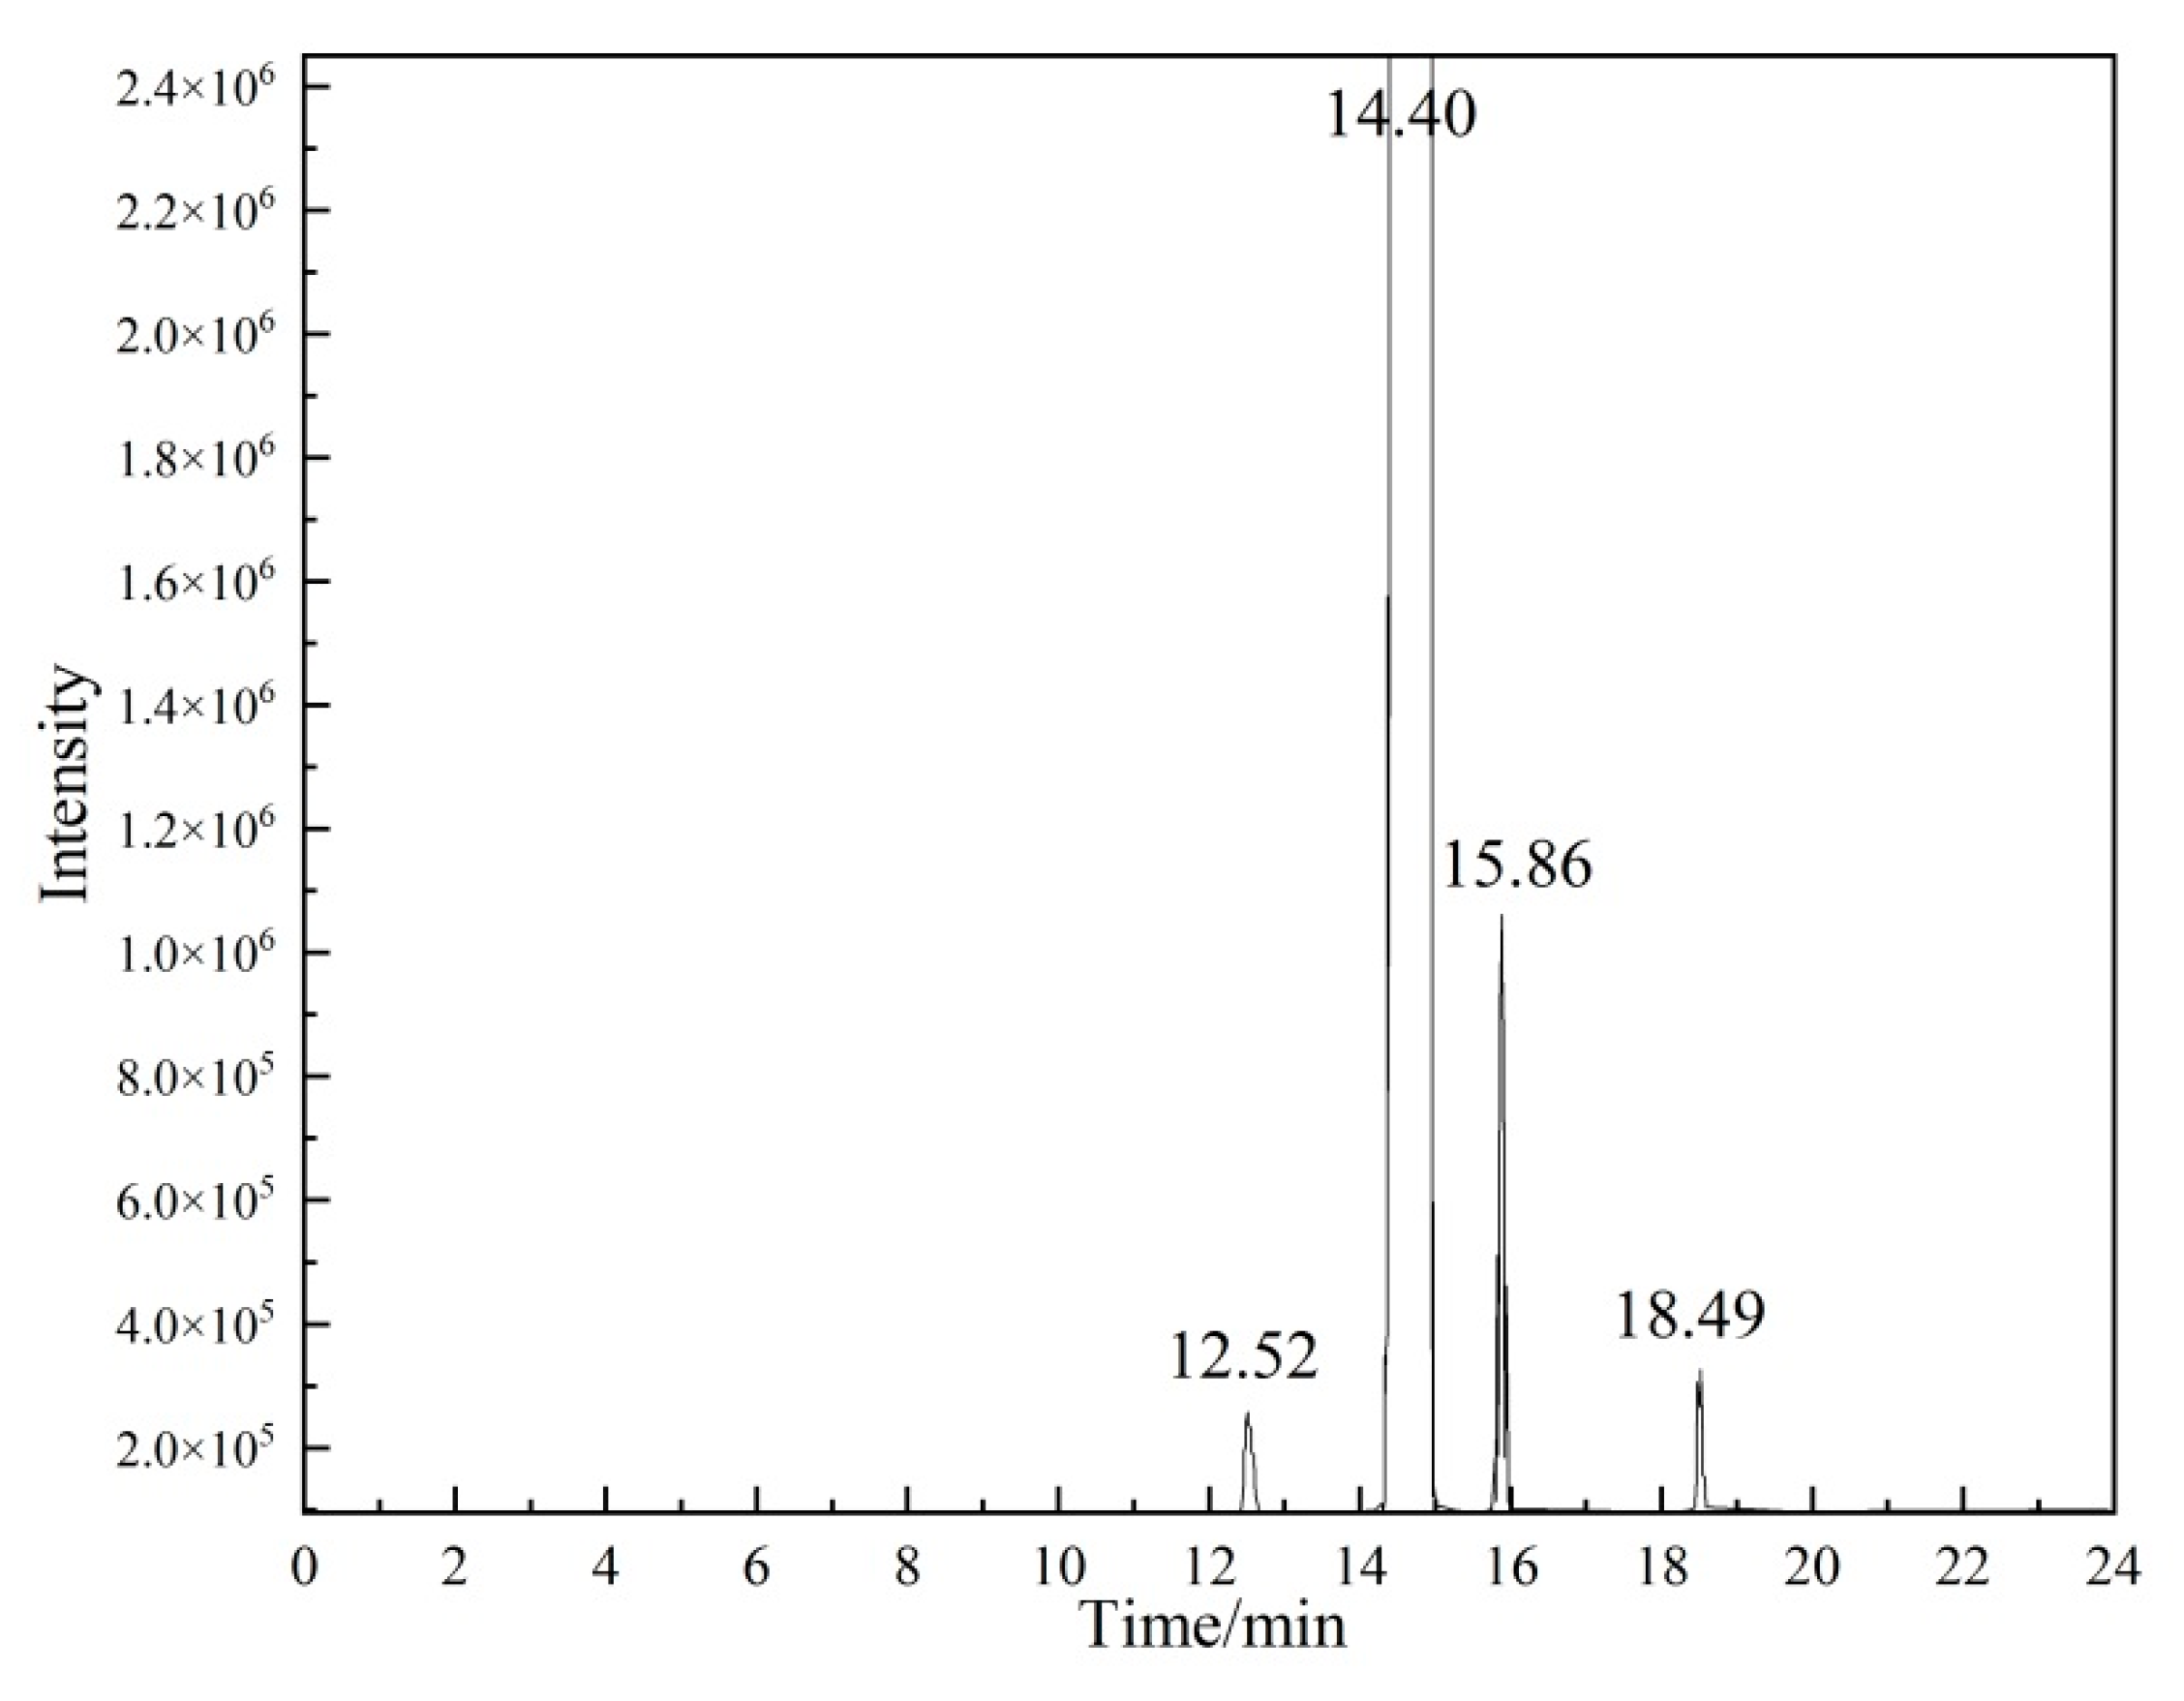
Qualitative analysis of organic components
The organic impurities in vinyl acetate were characterized by high-resolution mass spectrometry, and the results were verified by gas chromatography. The experimental conditions for the high-resolution mass spectrometry were the same as those described in
Section 3.2.2 (1).
For the GC conditions (the instrument model used was an Agilent 6890N-5973N GC/MS), 1 μL of vinyl acetate solution was separated using a J&W DB-624 capillary column (60 m × 0.32 mm × 0.25 μm). The experimental conditions were as follows: carrier gas helium; flow rate of 1 mL/min in constant flow mode; inlet temperature of 200 °C; ion source temperature of 230 °C; quadrupole temperature of 150 °C; transfer line temperature of 200 °C; and split ratio of 10:1. Temperature programming conditions were as follows: The initial temperature was 40 °C, the temperature was raised to 50 °C at a rate of 2 °C/min, and then the temperature was raised to 140 °C at a rate of 5 °C/min before being maintained for 1 min.
- (2)
Determination of organic components
The gas chromatography area normalization method was used to measure the contents of organic components in the CRM candidate, and the experimental conditions were the same as those described in
Section 3.2.3 (1). The organic component after introducing the correction factor can be calculated from Equation (13).
where
P0 is the content of the main component;
A0 represents the peak areas of the main components; and
fi,
Ai (
i = 1 − n) represent the relative correction factors and peak areas of the organic impurities, respectively. The experimental conditions were the same as those used for the gas chromatography spiked experiment.
where
As is the peak area of the standard substance,
Ai is the peak area of impurity
i,
ms is the mass of the standard substance, and
mi is the mass of impurity
i.
- (3)
Determination of water
Because vinyl acetate is prone to polymerization when heated, the Karl Fischer coulometric method was chosen to measure the water content in the CRM candidate. First, 100 mL of Karl Fischer reagent was added into the calibrated instrument, the vibration frequency of the oscillator was set to 155 r/min, and the solution was mixed evenly. Then, approximately 1 mL of vinyl acetate CRM was added and reacted to the end point under the protection of nitrogen. A blank experiment was performed to ensure the accuracy of the test data.
- (4)
Determination of inorganic impurities
The mass fraction of inorganic impurities in the CRM candidate was measured using ICP-MS. The instrument parameters were as follows: the radio frequency power was 1300 W; the carrier gas flow rate was 1.20 L/min; the sampling rate was 0.1 r/s; and the measurement was repeated three times in the full quantitative analysis mode. The measurement method was as follows: 1 mL of candidate CRM was transferred to a 10 mL volumetric flask, diluted to volume with deionized water, shaken well, and used directly for ICP-MS.
- (5)
Determination of acid
A Mettler T50 potentiometric titrator was used to measure the content of organic acids. The measurement method was as follows: 1.5 mL of vinyl acetate solution was added to the potentiometric titrator, and calibrated sodium hydroxide solution was automatically added dropwise to the titration end point. To ensure the accuracy of the experimental data, a DG113-SC non-aqueous titration composite electrode was used to monitor the titration end point.
3.3. Homogeneity and Stability Test
According to the packing sequence, a total of 15 bottles of samples were randomly selected, with five bottles of vinyl acetate CRM candidate samples taken from each of the front, middle, and back. Each bottle was tested three times using the established GC-FID method. One-way analysis of variance (ANOVA) was used to test the homogeneity of the sample values. Comparison of the calculated value of F with the critical value of F (with a confidence level of 95%) determined whether there was a significant difference in homogeneity.
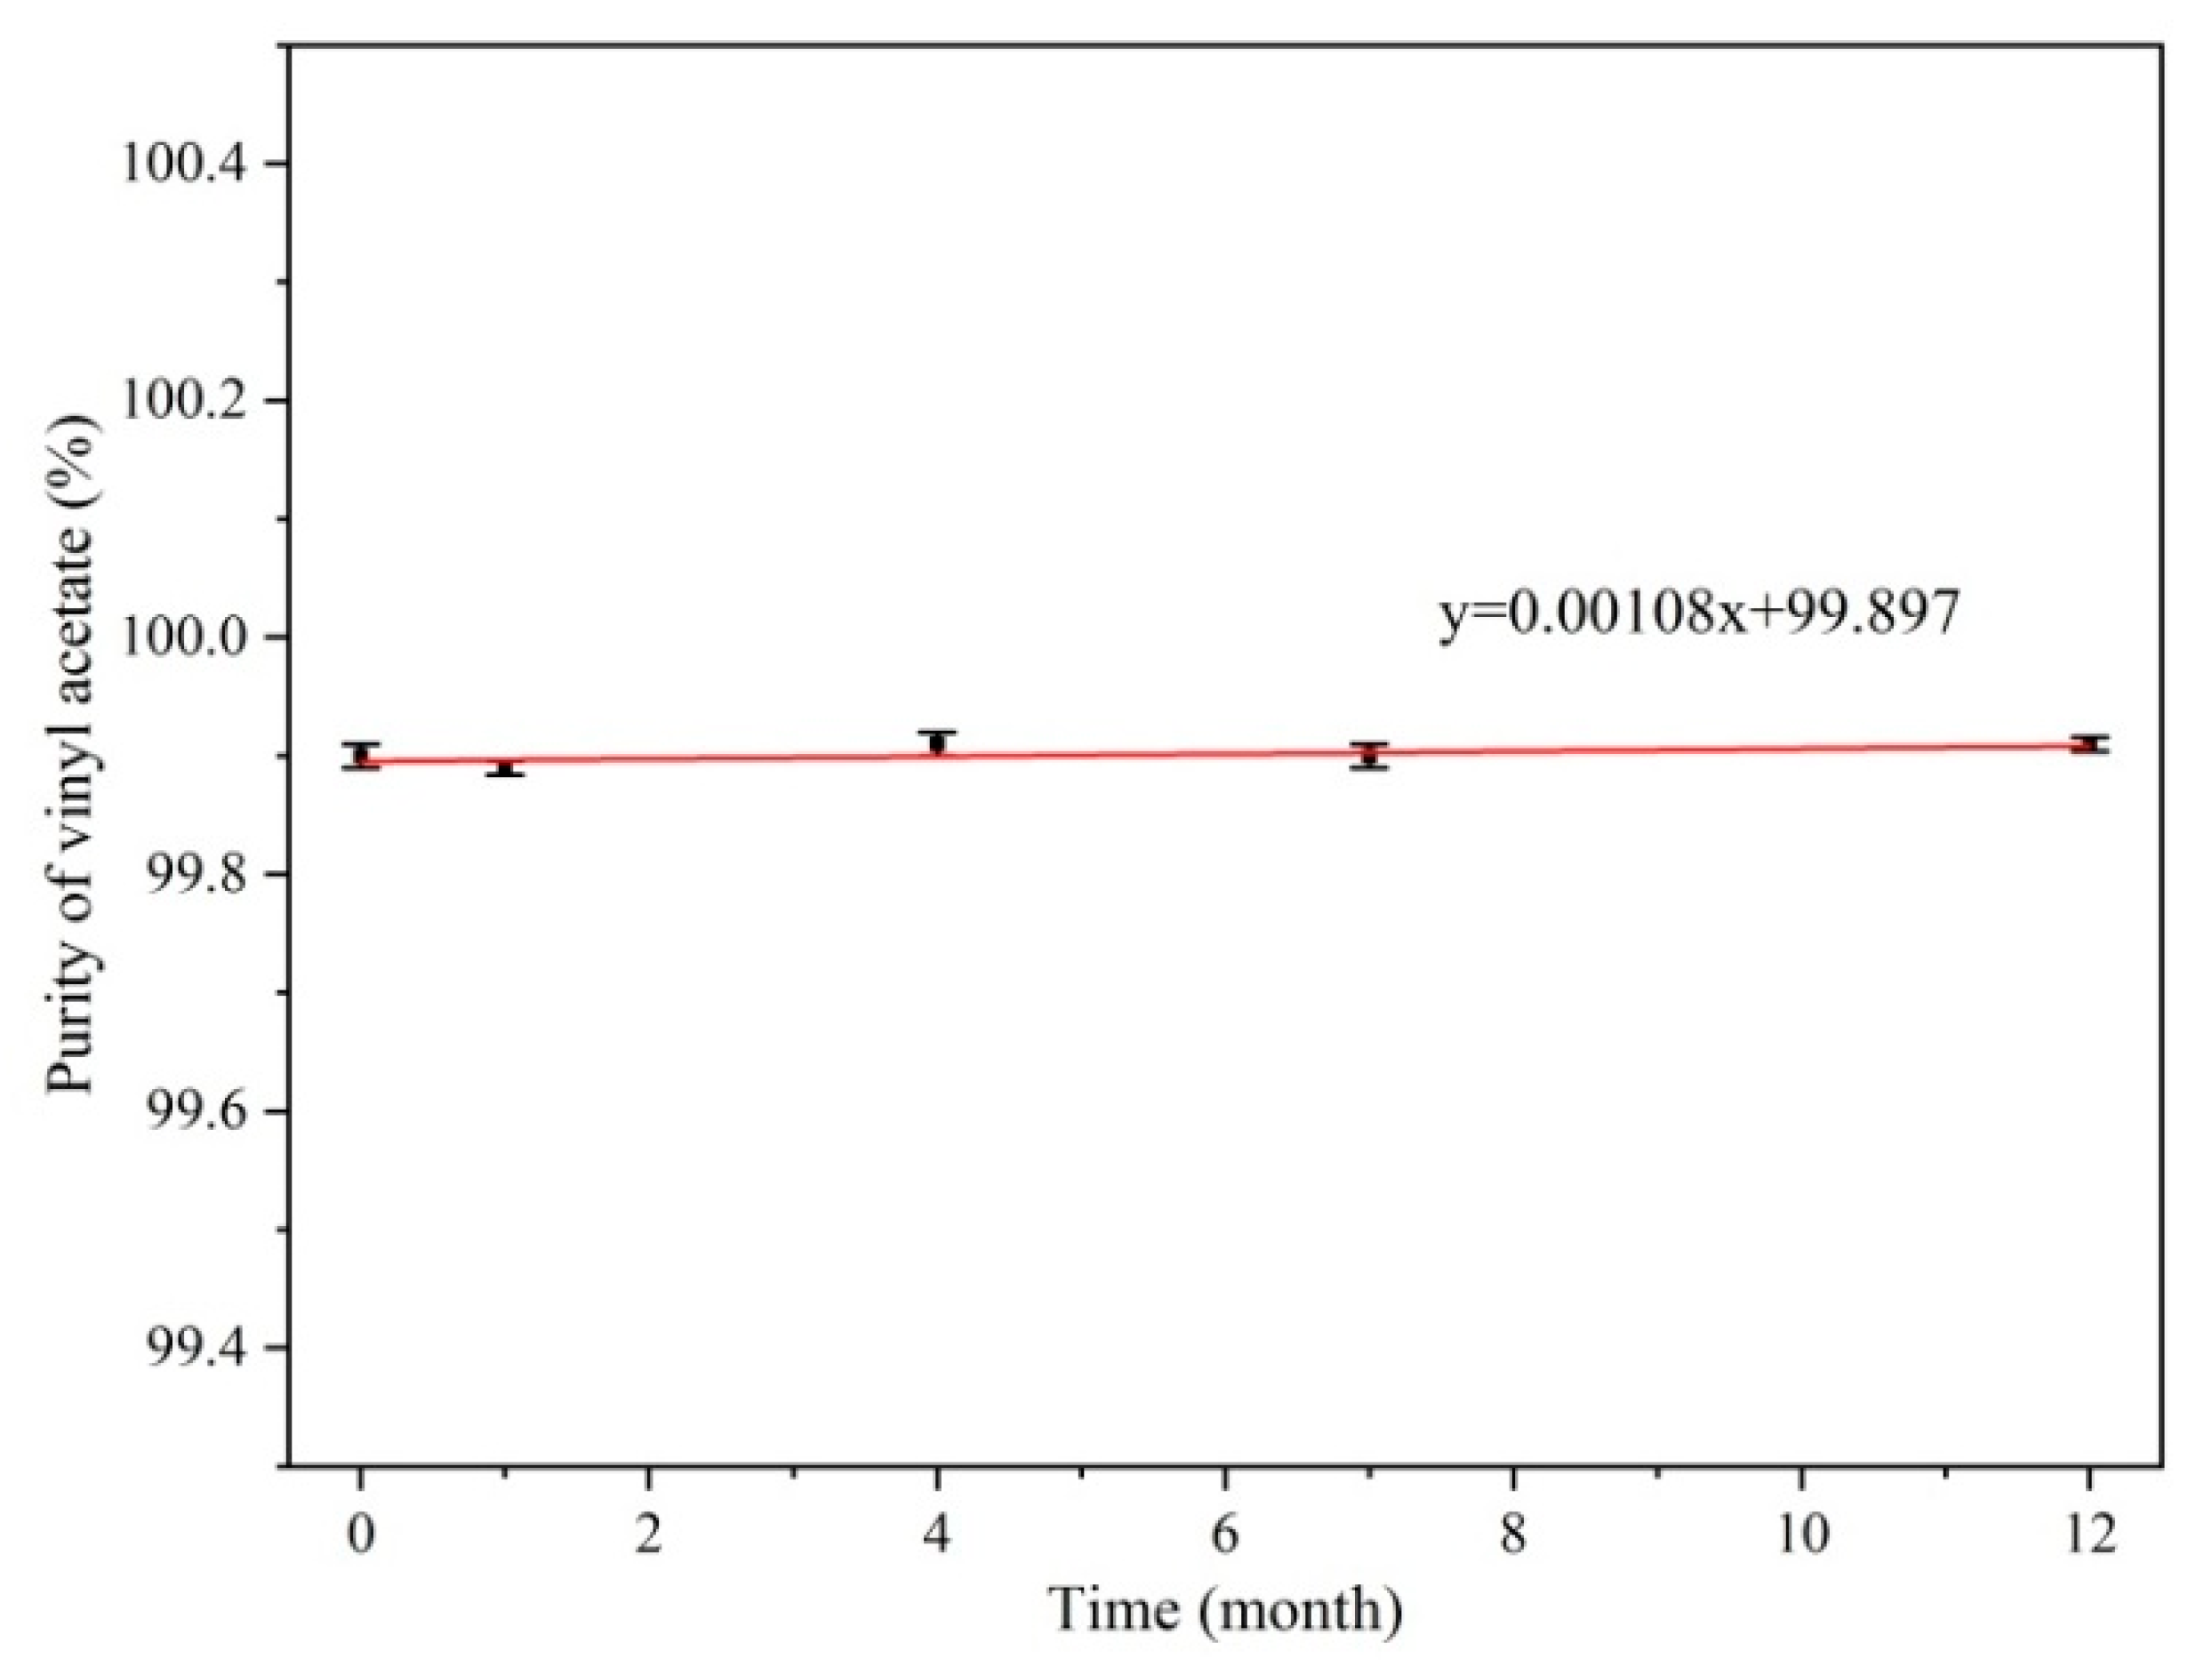
Because of the unstable nature of vinyl acetate, self-polymerization reactions may occur during long-term storage to affect the purity; therefore, monitoring the stability of vinyl acetate CRMs is the key to ensuring the quality of the measurements. The packaged vinyl acetate CRM candidate products were stored at 4 °C in the dark. Following the principle of dense first and thin later, and the concentrations were measured after 0, 1, 4, 7, and 12 months of storage. The purity of the vinyl acetate CRM products was measured by GC-FID, and the samples were measured three times at each time point.
Statistical Analyses
The homogeneity test data were analyzed by ANOVA (F-test). The F-value was calculated according to Equation (15), where
is the mean square error between groups and
is the mean square error within a group.
The stability studies were assessed by performing ANOVA (
t-test) on linear regression data to determine the stability trends in CRM candidate purity. Statistical tests for regression analysis were performed on the stability measurements. We compared the absolute value of the slope (a) with the product of t the critical value and the slope uncertainty s(a). The calculation of s(a) is shown in Equations (5) and (6), which are mentioned in
Section 2.3.


