
Determination of Multiclass Pharmaceutical Residues in Milk Using Modified QuEChERS and Liquid-Chromatography-Hybrid Linear Ion Trap/Orbitrap Mass Spectrometry: Comparison of Clean-Up Approaches and Validation Studies
Abstract
:
1. Introduction
2. Results and Discussion
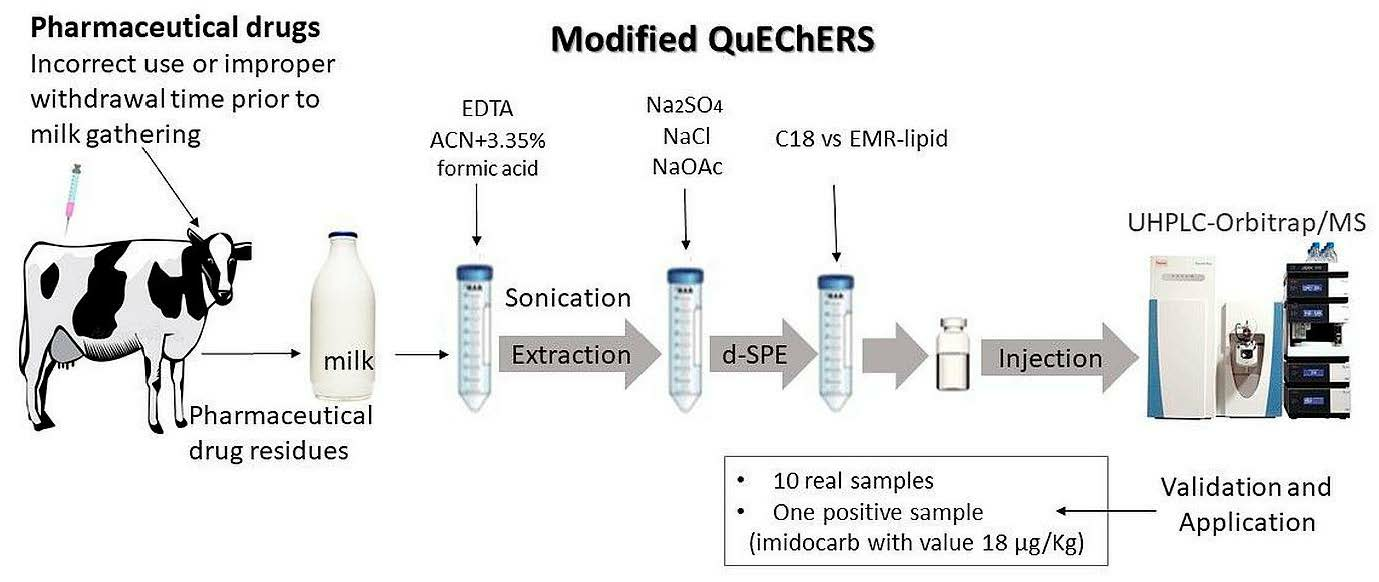
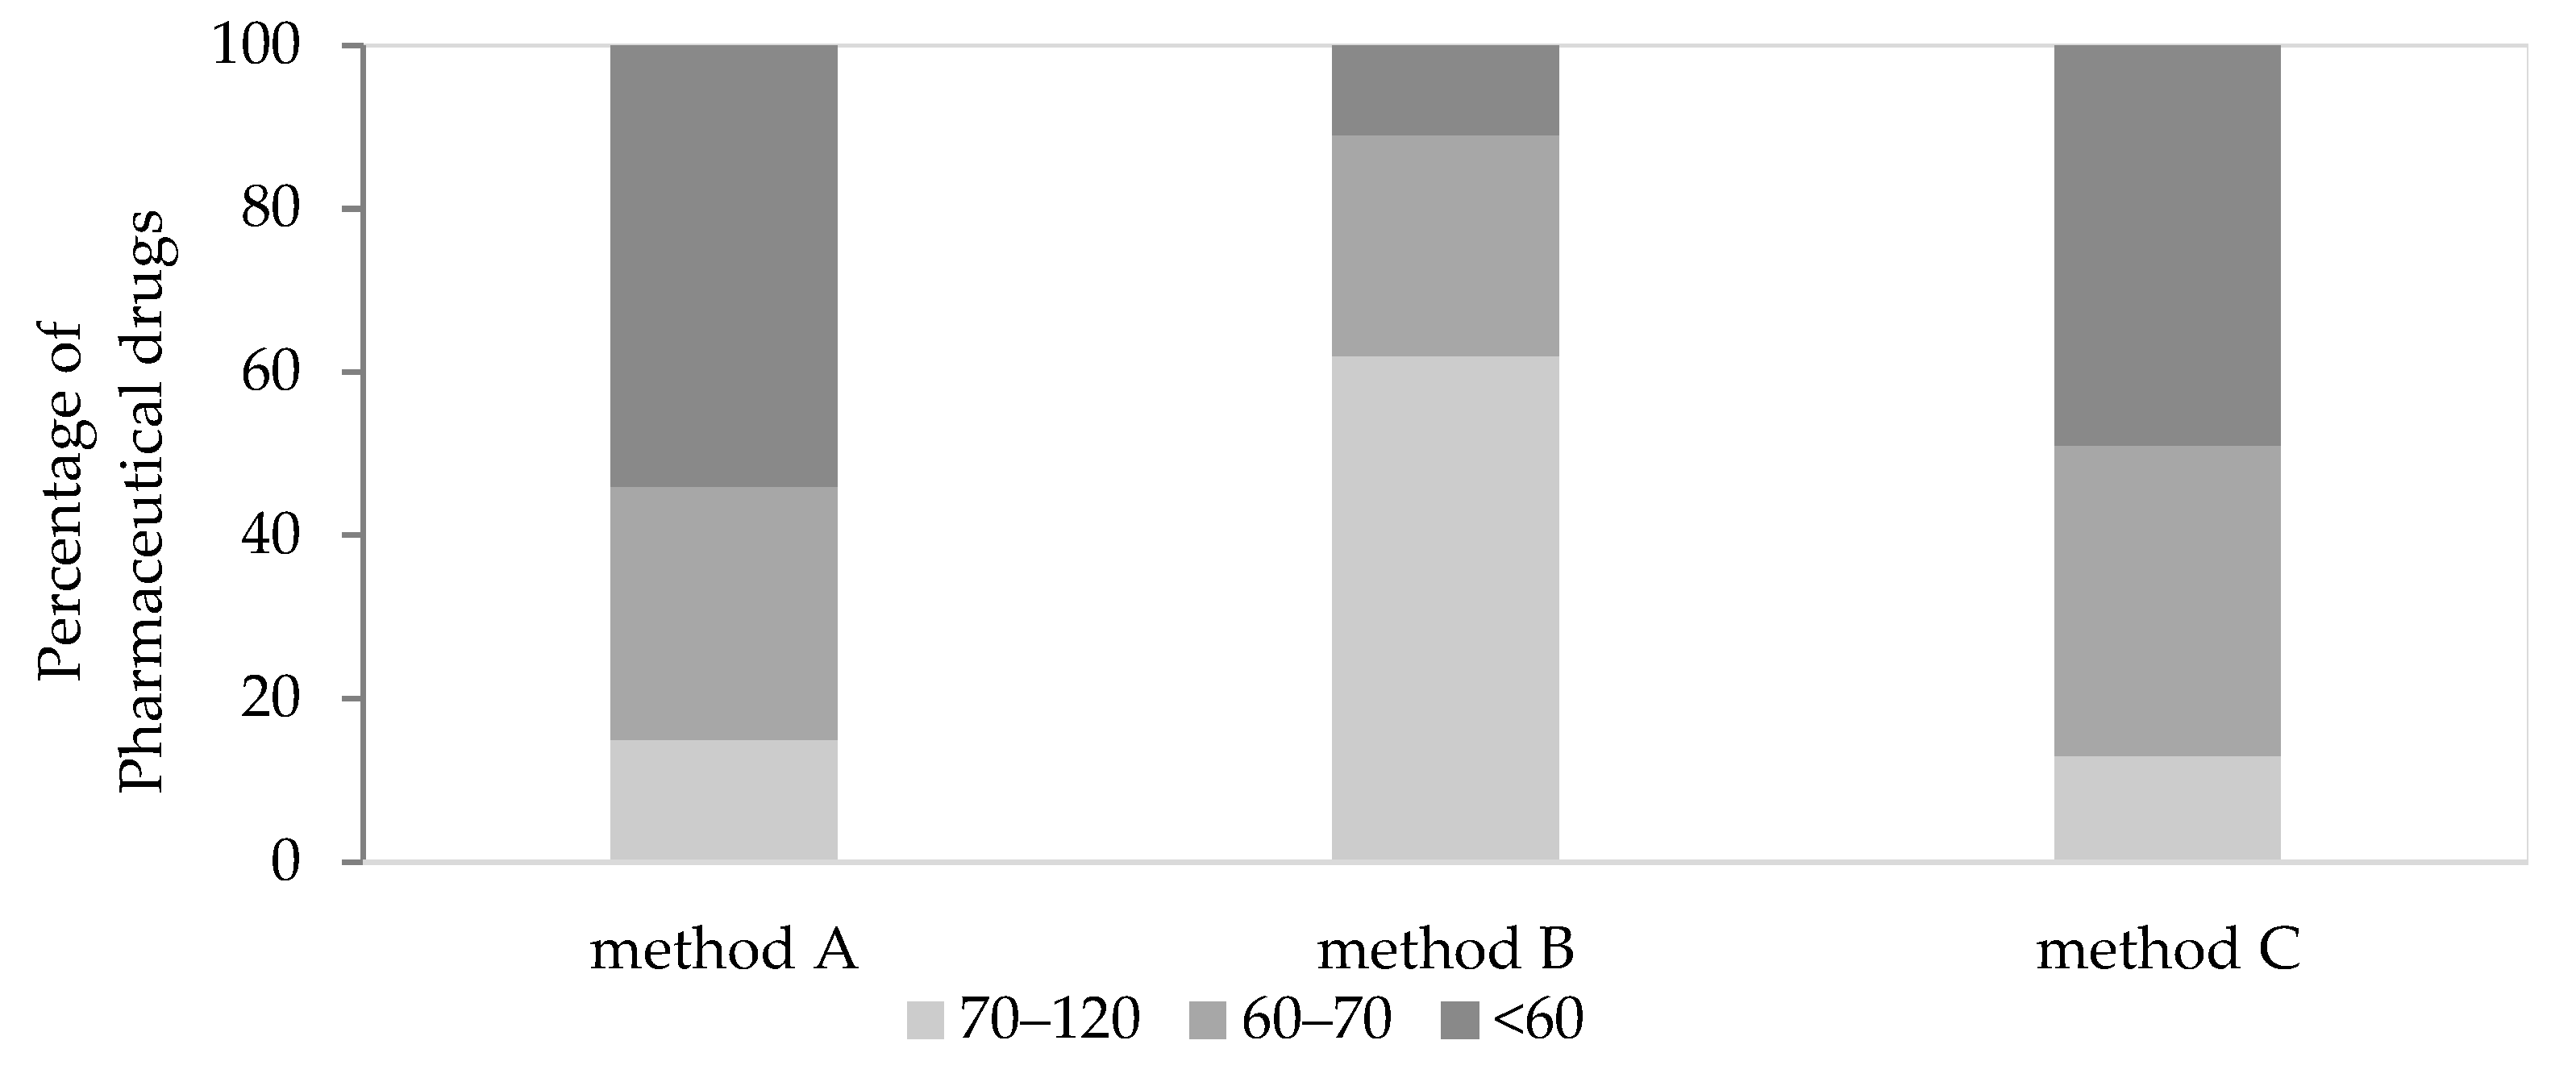
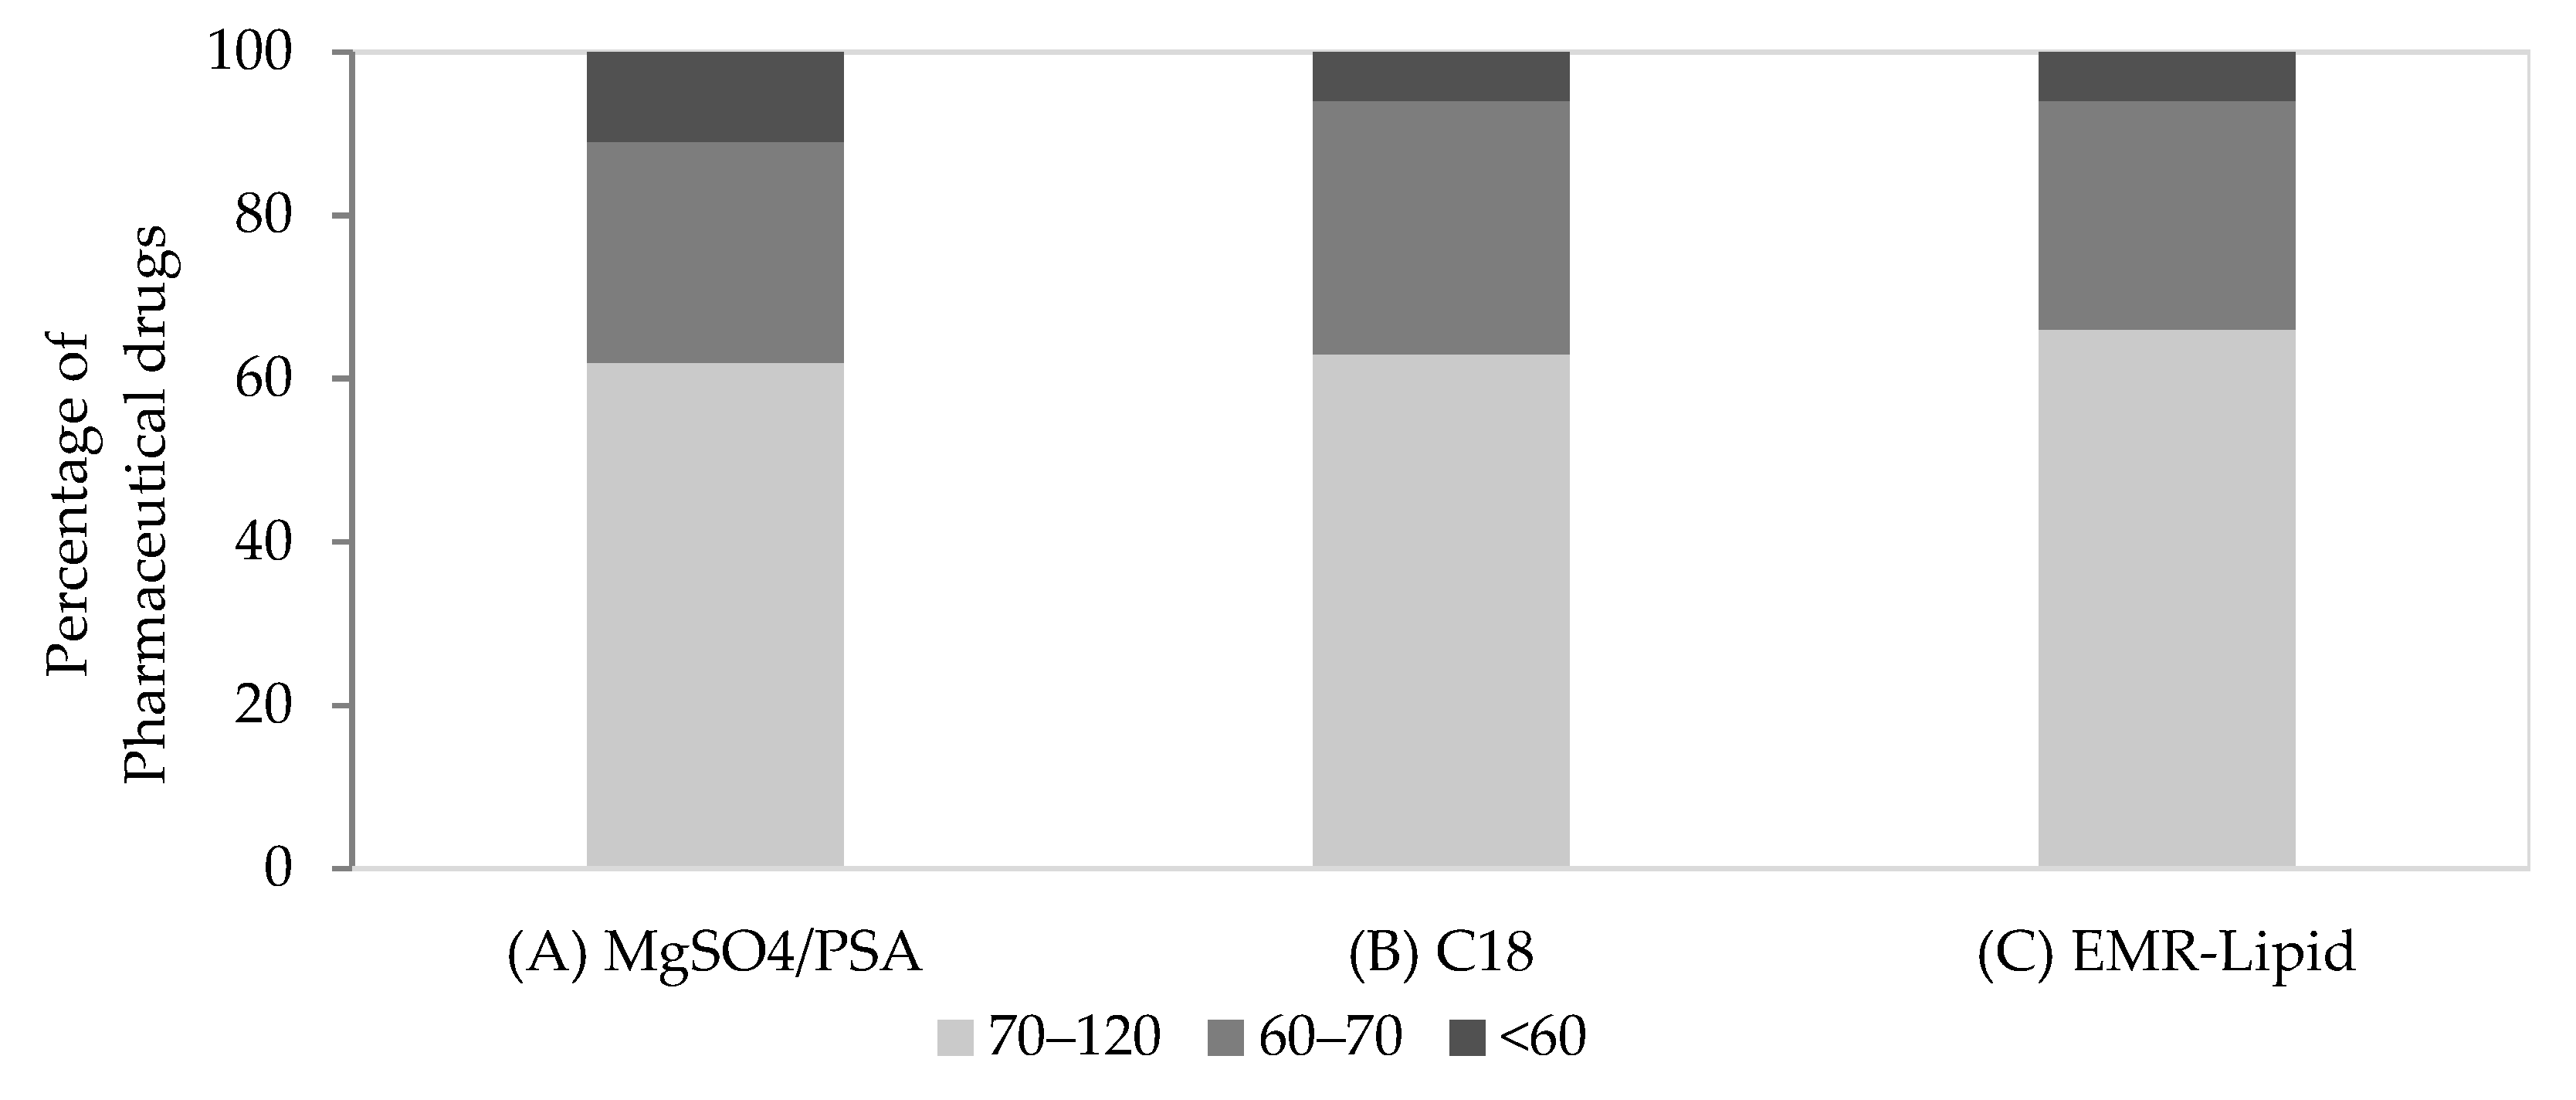
2.1. Optimization of QuEChERS Procedure
2.2. Validation of the Proposed Methods

| Food Matrix | Compounds | Extraction Method | Clean-Up Method | LC-MS Technique | Acquisition Mode | Linearity | Recovery (%) | LOQs (μg/kg) | Reference |
|---|---|---|---|---|---|---|---|---|---|
| Milk | 18 pharmaceutical drugs | Sonication/modified QuEChERS | EMR-Lipid/C18 | LC-hybrid LTQ/Orbitrap-MS | Full MS/dd-MS2 Resolution 60,000/15,000 FWHM | 0.9903 | 65.1–120.1 | 0.28–10 | Current study |
| Bovine milk | 209 veterinary drugs, mycotoxins, and pesticides | Modified QuEChERS | C18 | LC-QTRAP-MS | MRM-IDA-EPI mode | 0.99 | 51.20–129.76 | 0.05–5 | [8] |
| Milk/dairy products | 103 veterinary drugs | Modified QuEChERS | C18 and Na2SO4 | LC-QqQ-MS | MRM mode | 0.9902 | 31.1–120.7 | 0.5–50 | [47] |
| Goat milk | 19 quinolones | “Buffered CEN 15662” QuEChERS | C18 and Na2SO4 | LC–QqQ-MS | MRM mode | 0.9853 | 73.4–114.2 | 5–15 | [18] |
| Cow milk | 66 veterinary drugs | Solvent extraction | EMR-Lipid/SPE | LC-QqQ-MS | MRM mode | 0.998 | 70–120 | 0.02–18.25 | [25] |
| Milk, cheese, and whey | 36 antibiotics | SLE | C18 | LC-Q Exactive Orbitrap-MS | Full scan: resolution at 50,000 FWHM | 0.995 | 70–120 | 1–50 (CCβ) | [52] |
2.3. Preliminary Application Study
3. Materials and Methods
3.1. Chemicals, Reagents, and Samples
3.2. Preliminary Experiments
- (a)
- Extraction method A (“Original” QuEChERS): Solvent: 10 mL of acetonitrile; extract salts: 4 g of MgSO4 and 1 g of NaCl.
- (b)
- Extraction method B (“AOAC 2007.01” QuEChERS) [39]: Solvent: 10 mL of acetonitrile containing 1% acetic acid; extract salts: 6 g of MgSO4 and 1.5 g of NaOAc.
- (c)
- Extraction method C (“Buffered CEN 15662” QuEChERS) [40]: Solvent: 10 mL of acetonitrile; extract salts: 4 g of MgSO4, 1 g of NaCl, 1 g of C6H5Na3O7⋅H2O. and 0.5 g of C6H6Na2O7⋅1.5H2O.
3.3. UHPLC-Orbitrap MS Parameters
3.4. QuEChERS Extraction Procedure
3.5. Method Validation
4. Conclusions
Author Contributions
Funding
Institutional Review Board Statement
Informed Consent Statement
Data Availability Statement
Acknowledgments
Conflicts of Interest
Sample Availability
References
- He, Z.; Zhang, H. (Eds.) Applied Manure and Nutrient Chemistry for Sustainable Agriculture and Environment; Springer: Dordrecht, The Netherlands, 2014; ISBN 978-94-017-8806-9. [Google Scholar]
- Beyene, T. Veterinary Drug Residues in Food-Animal Products: Its Risk Factors and Potential Effects on Public Health. J. Vet. Sci. Technol. 2015, 7, 1–7. [Google Scholar] [CrossRef]
- European Commission. Regulation (EU) No 37/2010 of the Commission of 22 December 2009 on pharmacologically active substances and their classification as regards the maximum residue limits in foodstuffs of animal origin. Off. J. Eur. Union 2010, L15, 1–72. [Google Scholar]
- Tsiboukis, D.; Sazakli, E.; Jelastopulu, E.; Leotsinidis, M. Anthelmintics Residues in Raw Milk. Assessing Intake by a Children Population. Pol. J. Vet. Sci. 2013, 16, 85–91. [Google Scholar] [CrossRef]
- Dasenaki, M.E.; Thomaidis, N.S. Multi-Residue Determination of 115 Veterinary Drugs and Pharmaceutical Residues in Milk Powder, Butter, Fish Tissue and Eggs Using Liquid Chromatography–Tandem Mass Spectrometry. Anal. Chim. Acta 2015, 880, 103–121. [Google Scholar] [CrossRef]
- Grabsk, A.; de Souza, J.; De Marchi, F.; do Prado, R.; dos Santos, G.; Porto, C.; Pilau, E. Determination of Antibiotics Residues in Milk Using a QuEChERS Method Using Full Factorial Design and Liquid Chromatography-Tandem Mass Spectrometry. J. Braz. Chem. Soc. 2019, 35, 1498–1505. [Google Scholar] [CrossRef]
- Souza, R.; Fernández, P.; Muela, A.; Cesio, M.V.; Heinzen, H.; Pareja, L. Development of a Methodology for the Simultaneous Analysis of Multiclass Contaminants in Milk. Food Anal. Methods 2021, 14, 1075–1086. [Google Scholar] [CrossRef]
- Jia, Q.; Qiu, J.; Zhang, L.; Liao, G.; Jia, Y.; Qian, Y. Multiclass Comparative Analysis of Veterinary Drugs, Mycotoxins, and Pesticides in Bovine Milk by Ultrahigh-Performance Liquid Chromatography–Hybrid Quadrupole–Linear Ion Trap Mass Spectrometry. Foods 2022, 11, 331. [Google Scholar] [CrossRef]
- Unsal, I.A.; Tasan, M.; Gokcen, T.; Goren, A.C. Determination of Sulfonamides in Milk by ID-LC-MS/MS. J. Chem. Metrol. 2018, 12, 70–78. [Google Scholar] [CrossRef]
- Yue, Z.; Qiu, Y.; Liu, X.; Ji, C. Determination of Multi-Residues of Tetracyclines and Their Metabolites in Milk by High Performance Liquid Chromatography-Tandem Positive-Ion Electrospray Ionization Mass Spectrometry. Chin. J. Anal. Chem. 2006, 34, 1255–1259. [Google Scholar] [CrossRef]
- Xie, J.; Peng, T.; Zhu, A.; He, J.; Chang, Q.; Hu, X.; Chen, H.; Fan, C.; Jiang, W.; Chen, M.; et al. Multi-Residue Analysis of Veterinary Drugs, Pesticides and Mycotoxins in Dairy Products by Liquid Chromatography–Tandem Mass Spectrometry Using Low-Temperature Cleanup and Solid Phase Extraction. J. Chromatogr. B 2015, 1002, 19–29. [Google Scholar] [CrossRef]
- Bogialli, S.; Curini, R.; Di Corcia, A.; Laganà, A.; Mele, M.; Nazzari, M. Simple Confirmatory Assay for Analyzing Residues of Aminoglycoside Antibiotics in Bovine Milk: Hot Water Extraction Followed by Liquid Chromatography–Tandem Mass Spectrometry. J. Chromatogr. A 2005, 1067, 93–100. [Google Scholar] [CrossRef] [PubMed]
- Bogialli, S.; D’Ascenzo, G.; Di Corcia, A.; Laganà, A.; Nicolardi, S. A Simple and Rapid Assay Based on Hot Water Extraction and Liquid Chromatography–Tandem Mass Spectrometry for Monitoring Quinolone Residues in Bovine Milk. Food Chem. 2008, 108, 354–360. [Google Scholar] [CrossRef]
- Lu, Y.; Lü, L.; He, J.; Zhao, T. Preparation of Hydrophilic Molecularly Imprinted Solid-phase Microextraction Fiber for the Selective Removal and Extraction of Trace Tetracyclines Residues in Animal Derived Foods. J. Sep. Sci. 2020, 43, 2172–2179. [Google Scholar] [CrossRef]
- de Oliveira Arias, J.L.; Schneider, A.; Batista-Andrade, J.A.; Vieira, A.A.; Caldas, S.S.; Primel, E.G. Chitosan from Shrimp Shells: A Renewable Sorbent Applied to the Clean-up Step of the QuEChERS Method in Order to Determine Multi-Residues of Veterinary Drugs in Different Types of Milk. Food Chem. 2018, 240, 1243–1253. [Google Scholar] [CrossRef] [PubMed]
- Zhou, J.; Xu, J.-J.; Cong, J.-M.; Cai, Z.-X.; Zhang, J.-S.; Wang, J.-L.; Ren, Y.-P. Optimization for Quick, Easy, Cheap, Effective, Rugged and Safe Extraction of Mycotoxins and Veterinary Drugs by Response Surface Methodology for Application to Egg and Milk. J. Chromatogr. A 2018, 1532, 20–29. [Google Scholar] [CrossRef]
- Rageh, A.H.; Abdel-Rahim, S.A.; Askal, H.F.; Saleh, G.A. Hydrophilic-Interaction Planar Chromatography in Ultra-Sensitive Determination of α-Aminocephalosporin Antibiotics. Application to Analysis of Cefalexin in Goat Milk Samples Using Modified QuEChERS Extraction Technique. J. Pharm. Biomed. Anal. 2019, 166, 421–434. [Google Scholar] [CrossRef]
- Bang Ye, S.; Huang, Y.; Lin, D.-Y. QuEChERS Sample Pre-Processing with UPLC–MS/MS: A Method for Detecting 19 Quinolone-Based Veterinary Drugs in Goat’s Milk. Food Chem. 2022, 373, 131466. [Google Scholar] [CrossRef]
- Decheng, S.; Xia, F.; Zhiming, X.; Liyang; Peilong, W. Simultaneous Determination of Eight Carbapenems in Milk by Modified QuEChERS and Ultra High Performance Liquid Chromatography Coupled with High-Field Quadrupole-Orbitrap High-Resolution Mass Spectrometry. J. Chromatogr. A 2022, 1670, 462979. [Google Scholar] [CrossRef]
- Lambropoulou, D.A.; Albanis, T.A. Methods of Sample Preparation for Determination of Pesticide Residues in Food Matrices by Chromatography–Mass Spectrometry-Based Techniques: A Review. Anal. Bioanal. Chem. 2007, 389, 1663–1683. [Google Scholar] [CrossRef]
- Desmarchelier, A.; Fan, K.; Minh Tien, M.; Savoy, M.-C.; Tarres, A.; Fuger, D.; Goyon, A.; Bessaire, T.; Mottier, P. Determination of 105 Antibiotic, Anti-Inflammatory, Antiparasitic Agents and Tranquilizers by LC-MS/MS Based on an Acidic QuEChERS-like Extraction. Food Addit. Contam. Part A 2018, 35, 647–661. [Google Scholar] [CrossRef]
- Zhang, X.; Li, T.; Zhang, L.; Hu, T.; Fu, Y.; Guo, Z. Simultaneous Determination of Sulfoxaflor in 14 Daily Foods Using LC-MS/MS. Int. J. Environ. Anal. Chem. 2019, 99, 557–567. [Google Scholar] [CrossRef]
- López-Blanco, R.; Nortes-Méndez, R.; Robles-Molina, J.; Moreno-González, D.; Gilbert-López, B.; García-Reyes, J.F.; Molina-Díaz, A. Evaluation of Different Cleanup Sorbents for Multiresidue Pesticide Analysis in Fatty Vegetable Matrices by Liquid Chromatography Tandem Mass Spectrometry. J. Chromatogr. A 2016, 1456, 89–104. [Google Scholar] [CrossRef]
- Anumol, T.; Lehotay, S.J.; Stevens, J.; Zweigenbaum, J. Comparison of Veterinary Drug Residue Results in Animal Tissues by Ultrahigh-Performance Liquid Chromatography Coupled to Triple Quadrupole or Quadrupole–Time-of-Flight Tandem Mass Spectrometry after Different Sample Preparation Methods, Including Use of a Commercial Lipid Removal Product. Anal. Bioanal. Chem. 2017, 409, 2639–2653. [Google Scholar] [CrossRef] [PubMed]
- Castilla-Fernández, D.; Moreno-González, D.; Beneito-Cambra, M.; Molina-Díaz, A. Critical Assessment of Two Sample Treatment Methods for Multiresidue Determination of Veterinary Drugs in Milk by UHPLC-MS/MS. Anal. Bioanal. Chem. 2019, 411, 1433–1442. [Google Scholar] [CrossRef] [PubMed]
- Han, L.; Matarrita, J.; Sapozhnikova, Y.; Lehotay, S.J. Evaluation of a Recent Product to Remove Lipids and Other Matrix Co-Extractives in the Analysis of Pesticide Residues and Environmental Contaminants in Foods. J. Chromatogr. A 2016, 1449, 17–29. [Google Scholar] [CrossRef]
- Abesinghe, A.M.N.L.; Vidanarachchi, J.K.; Islam, N.; Prakash, S.; Silva, K.F.S.T.; Bhandari, B.; Karim, M.A. Effects of Ultrasonication on the Physicochemical Properties of Milk Fat Globules of Bubalus Bubalis (Water Buffalo) under Processing Conditions: A Comparison with Shear-Homogenization. Innov. Food Sci. Emerg. Technol. 2020, 59, 102237. [Google Scholar] [CrossRef]
- Nguyen, N.H.A.; Anema, S.G. Ultrasonication of Reconstituted Whole Milk and Its Effect on Acid Gelation. Food Chem. 2017, 217, 593–601. [Google Scholar] [CrossRef]
- Karageorgou, E.; Myridakis, A.; Stephanou, E.G.; Samanidou, V. Multiresidue LC-MS/MS Analysis of Cephalosporins and Quinolones in Milk Following Ultrasound-Assisted Matrix Solid-Phase Dispersive Extraction Combined with the Quick, Easy, Cheap, Effective, Rugged, and Safe Methodology: Sample Preparation. J. Sep. Sci. 2013, 36, 2020–2027. [Google Scholar] [CrossRef]
- Qin, Y.; Jatamunua, F.; Zhang, J.; Li, Y.; Han, Y.; Zou, N.; Shan, J.; Jiang, Y.; Pan, C. Analysis of Sulfonamides, Tilmicosin and Avermectins Residues in Typical Animal Matrices with Multi-Plug Filtration Cleanup by Liquid Chromatography–Tandem Mass Spectrometry Detection. J. Chromatogr. B 2017, 1053, 27–33. [Google Scholar] [CrossRef]
- Sun, H.; Yu, Q.-W.; He, H.-B.; Lu, Q.; Shi, Z.-G.; Feng, Y.-Q. Nickel Oxide Nanoparticle-Deposited Silica Composite Solid-Phase Extraction for Benzimidazole Residue Analysis in Milk and Eggs by Liquid Chromatography–Mass Spectrometry. J. Agric. Food Chem. 2016, 64, 356–363. [Google Scholar] [CrossRef]
- Whelan, M.; Kinsella, B.; Furey, A.; Moloney, M.; Cantwell, H.; Lehotay, S.J.; Danaher, M. Determination of Anthelmintic Drug Residues in Milk Using Ultra High Performance Liquid Chromatography–Tandem Mass Spectrometry with Rapid Polarity Switching. J. Chromatogr. A 2010, 1217, 4612–4622. [Google Scholar] [CrossRef] [PubMed]
- van Pamel, E.; Daeseleire, E. A Multiresidue Liquid Chromatographic/Tandem Mass Spectrometric Method for the Detection and Quantitation of 15 Nonsteroidal Anti-Inflammatory Drugs (NSAIDs) in Bovine Meat and Milk. Anal. Bioanal. Chem. 2015, 407, 4485–4494. [Google Scholar] [CrossRef] [PubMed]
- Li, J.; Ren, X.; Diao, Y.; Chen, Y.; Wang, Q.; Jin, W.; Zhou, P.; Fan, Q.; Zhang, Y.; Liu, H. Multiclass Analysis of 25 Veterinary Drugs in Milk by Ultra-High Performance Liquid Chromatography-Tandem Mass Spectrometry. Food Chem. 2018, 257, 259–264. [Google Scholar] [CrossRef]
- Aydoğan, C. Recent Advances and Applications in LC-HRMS for Food and Plant Natural Products: A Critical Review. Anal. Bioanal. Chem. 2020, 412, 1973–1991. [Google Scholar] [CrossRef] [PubMed]
- Kaufmann, A. The Current Role of High-Resolution Mass Spectrometry in Food Analysis. Anal. Bioanal. Chem. 2012, 403, 1233–1249. [Google Scholar] [CrossRef] [PubMed]
- Kırkan, E.; Tahir, A.O.; Bengü, A.Ş.; Aslan, H.; Çiftçi, M.; Aydoğan, C. Rapid Determination of Sulfonamide Residues in Honey Samples Using Non-targeted Liquid Chromatography-high Resolution Mass Spectrometry. Sep. Sci. PLUS 2020, 3, 451–459. [Google Scholar] [CrossRef]
- Aydoğan, C.; El Rassi, Z. MWCNT Based Monolith for the Analysis of Antibiotics and Pesticides in Milk and Honey by Integrated Nano-Liquid Chromatography-High Resolution Orbitrap Mass Spectrometry. Anal. Methods 2019, 11, 21–28. [Google Scholar] [CrossRef]
- AOAC Official Method 2007. 01. Pesticide Residues in Foods by Acetonitrile Extraction and Partitioning with Magnesium Sulfate; AOAC International: Rockville, MD, USA, 2017. [Google Scholar]
- EN 15662; Foods of Plant Origin—Determination of Pesticide Residues Using GC-MS and/or LC-MS/MS Following Acetonitrile Extraction/Partitioning and Clean-Up by Dispersive SPE—QuEChERS Method. European Committee for Standardization: Brussels, Belgium, 2018.
- Gros, M.; Petrović, M.; Barceló, D. Tracing Pharmaceutical Residues of Different Therapeutic Classes in Environmental Waters by Using Liquid Chromatography/Quadrupole-Linear Ion Trap Mass Spectrometry and Automated Library Searching. Anal. Chem. 2009, 81, 898–912. [Google Scholar] [CrossRef] [PubMed]
- Dasenaki, M.E.; Thomaidis, N.S. Multianalyte Method for the Determination of Pharmaceuticals in Wastewater Samples Using Solid-Phase Extraction and Liquid Chromatography–Tandem Mass Spectrometry. Anal. Bioanal. Chem. 2015, 407, 4229–4245. [Google Scholar] [CrossRef]
- Sikand, V.; Tong, P.S.; Vink, S.; Roy, S. Physicochemical Properties of Skim Milk Powders Prepared with the Addition of Mineral Chelators. J. Dairy Sci. 2016, 99, 4146–4153. [Google Scholar] [CrossRef]
- Chávez-Martínez, A.; Reyes-Villagrana, R.A.; Rentería-Monterrubio, A.L.; Sánchez-Vega, R.; Tirado-Gallegos, J.M.; Bolivar-Jacobo, N.A. Low and High-Intensity Ultrasound in Dairy Products: Applications and Effects on Physicochemical and Microbiological Quality. Foods 2020, 9, 1688. [Google Scholar] [CrossRef] [PubMed]
- Tuzimski, T.; Szubartowski, S. Method Development for Selected Bisphenols Analysis in Sweetened Condensed Milk from a Can and Breast Milk Samples by HPLC–DAD and HPLC-QqQ-MS: Comparison of Sorbents (Z-SEP, Z-SEP Plus, PSA, C18, Chitin and EMR-Lipid) for Clean-Up of QuEChERS Extract. Molecules 2019, 24, 2093. [Google Scholar] [CrossRef] [PubMed]
- Zhang, Y.; Li, X.; Liu, X.; Zhang, J.; Cao, Y.; Shi, Z.; Sun, H. Multi-Class, Multi-Residue Analysis of Trace Veterinary Drugs in Milk by Rapid Screening and Quantification Using Ultra-Performance Liquid Chromatography–Quadrupole Time-of-Flight Mass Spectrometry. J. Dairy Sci. 2015, 98, 8433–8444. [Google Scholar] [CrossRef]
- Guo, X.; Tian, H.; Yang, F.; Fan, S.; Zhang, J.; Ma, J.; Ai, L.; Zhang, Y. Rapid Determination of 103 Common Veterinary Drug Residues in Milk and Dairy Products by Ultra Performance Liquid Chromatography Tandem Mass Spectrometry. Front. Nutr. 2022, 9, 879518. [Google Scholar] [CrossRef]
- Ehling, S.; Reddy, T.M. Liquid Chromatography–Mass Spectrometry Method for the Quantitative Determination of Residues of Selected Veterinary Hormones in Powdered Ingredients Derived from Bovine Milk. J. Agric. Food Chem. 2013, 61, 11782–11791. [Google Scholar] [CrossRef] [PubMed]
- Tuzimski, T.; Rejczak, T. A QuEChERS-Based Sample Preparation Method for the Analysis of 5-Nitroimidazoles in Bovine Milk by HPLC–DAD. J. AOAC Int. 2017, 100, 1671–1680. [Google Scholar] [CrossRef] [PubMed]
- Zhao, L.; Lucas, D. Multiresidue Analysis of Veterinary Drugs in Bovine Liver by LC/MS/MS: Agilent Bond Elut EMR-Lipid. Appl. Note Agil. Technol. 2015, 5, 5991–6098. [Google Scholar]
- European Commission. Analytical Quality Control and Method Validation for Pesticide Residues Analysis in Food and Feed. SANTE 2019, 12682, 21–22. [Google Scholar]
- Igualada, C.; Giraldo, J.; Font, G.; Yusà, V. Validation of a Multi-Residue UHPLC-HRMS Method for Antibiotics Screening in Milk, Fresh Cheese, and Whey. J. Food Compos. Anal. 2022, 106, 104265. [Google Scholar] [CrossRef]
- Tang, Y.; Yu, N.; Liu, C.; Han, M.; Wang, H.; Chen, X.; Kang, J.; Li, X.; Liu, Y. Residue Depletion of Imidocarb in Bovine Tissues by UPLC-MS/MS. Animals 2022, 13, 104. [Google Scholar] [CrossRef]
- Traynor, I.M.; Thompson, C.S.; Armstrong, L.; Fodey, T.; Danaher, M.; Jordan, K.; Kennedy, D.G.; Crooks, S.R.H. Determination of Imidocarb Residues in Bovine and Ovine Liver and Milk by Immunobiosensor. Food Addit. Contam. Part A 2013, 30, 1108–1114. [Google Scholar] [CrossRef] [PubMed]
- European Commission. Decision 96/23/Ec Commission (2002) 96/23/EC COMMISSION DECISION of 12 August 2002 implementing Council Directive 96/23/EC concerning the performance of analytical methods and the interpretation of results (notified under document number C (2022) 3044) (Text withEEA relevance) (2022/657/EC). 96/23/Ec Comm Desis 29. Off. J. Eur. Union 2002, L221, 8. [Google Scholar]
- Nannou, C.I.; Boti, V.I.; Albanis, T.A. Trace Analysis of Pesticide Residues in Sediments Using Liquid Chromatography–High-Resolution Orbitrap Mass Spectrometry. Anal. Bioanal. Chem. 2018, 410, 1977–1989. [Google Scholar] [CrossRef] [PubMed]
- Horwitz, W.; Albert, R. The Horwitz Ratio (HorRat): A Useful Index of Method Performance with Respect to Precision. J. AOAC Int. 2006, 89, 1095–1109. [Google Scholar] [CrossRef]


| Pharmaceutical Drug | Clean-Up: C18 (Approach B) | Clean-Up: EMR-Lipid (Approach C) | ||||||||||||||
|---|---|---|---|---|---|---|---|---|---|---|---|---|---|---|---|---|
| Intra-Day | Inter-Day | Intra-Day | Inter-Day | |||||||||||||
| 8 μg/kg | 50 μg/kg | 8 μg/kg | 50 μg/kg | 8 μg/kg | 50 μg/kg | 8 μg/kg | 50 μg/kg | |||||||||
| Rec% | RSDr% | Rec% | RSDr% | Rec% | RSDWR% | Rec% | RSDWR% | Rec% | RSDr% | Rec% | RSDr% | Rec% | RSDWR% | Rec% | RSDWR% | |
| Sulfacetamide | 81.3 | 12.9 | 66.6 | 16.5 | 89.0 | 11.6 | 93.0 | 9.2 | 80.5 | 6.8 | 81.8 | 3.7 | 87.1 | 4.1 | 94.1 | 5.7 |
| Sulfapyridine | 81.8 | 6.1 | 92.6 | 13.0 | 90.3 | 13.3 | 94.6 | 8.0 | 80.0 | 4.1 | 82.1 | 2.5 | 83.1 | 17.1 | 85.4 | 15.6 |
| Sulfamethoxazole | 102.1 | 9.2 | 105.0 | 12.5 | 100.3 | 15.5 | 101.3 | 11.0 | 78.4 | 6.2 | 80.5 | 3.1 | 89.9 | 3.0 | 100.2 | 13.6 |
| Sulfathiazole | 75.0 | 0.1 | 79.3 | 12.2 | 82.3 | 9.1 | 86.0 | 9.3 | 82.5 | 6.9 | 85.9 | 4.8 | 88.0 | 4.2 | 90.3 | 8.4 |
| Sulfamethizole | 85.8 | 6.1 | 99.0 | 13.5 | 83.3 | 15.4 | 93.0 | 7.8 | 78.3 | 3.6 | 80.0 | 2.2 | 80.4 | 9.3 | 82.4 | 13.0 |
| Sulfamethazine | 85.8 | 6.1 | 103.3 | 11.3 | 80.3 | 17.6 | 92.6 | 10.0 | 74.5 | 4.3 | 80.2 | 5.2 | 97.1 | 10.6 | 98.6 | 11.3 |
| Sulfamethoxypyridazine | 87.8 | 15.3 | 94.6 | 9.3 | 93.1 | 11.0 | 94.0 | 9.6 | 71.5 | 5.3 | 75.0 | 4.1 | 83.7 | 9.8 | 88.6 | 14.3 |
| Sulfaquinoxaline | 94.0 | 6.9 | 88.3 | 12.9 | 82.0 | 18.6 | 90.3 | 8.5 | 70.6 | 4.0 | 80.0 | 2.2 | 88.7 | 4.3 | 92.2 | 9.5 |
| Sulfadiazine | 85.8 | 6.1 | 103 | 13.6 | 81.3 | 12.2 | 85.3 | 9.8 | 76.0 | 3.6 | 80.0 | 2.1 | 98.9 | 4.4 | 100.5 | 7.3 |
| Enrofloxacin | 92.0 | 0.2 | 95.6 | 12.7 | 110.5 | 19.0 | 112.6 | 15.2 | 81.9 | 4.6 | 89.4 | 7.5 | 84.0 | 0.4 | 86.0 | 12.6 |
| Trimethoprim | 83.6 | 8.0 | 96.6 | 7.7 | 83.3 | 15.4 | 89.0 | 8.2 | 81.0 | 3.1 | 83.1 | 3.8 | 97.9 | 13.0 | 99.4 | 9.7 |
| Erythromycin—H2O | 92.0 | 6.6 | 94.3 | 7.5 | 107.3 | 11.9 | 111.0 | 14.8 | 88.7 | 6.5 | 92.0 | 4.8 | 110.4 | 6.0 | 110.6 | 9.2 |
| Prednisone | 85.6 | 10.9 | 95.3 | 11.7 | 95.3 | 14.0 | 97.6 | 15.8 | 83.9 | 4.9 | 89.2 | 7.3 | 88.0 | 5.6 | 91.8 | 8.5 |
| Diclofenac | 83.6 | 8.9 | 87.6 | 18.7 | 83.1 | 19.0 | 87.5 | 4.3 | 65.1 | 3.2 | 68.5 | 5.8 | 75.8 | 2.17 | 76.0 | 8.2 |
| Ketoprofen | 118 | 9.4 | 120.0 | 10.9 | 112 | 14.1 | 112.2 | 9.5 | 101.3 | 7.7 | 103.9 | 5.3 | 101.4 | 17.5 | 108.2 | 15.1 |
| Albendazole | 98.1 | 11.8 | 99.3 | 14.9 | 91.5 | 15.1 | 93.3 | 10.6 | 78.8 | 1.9 | 82.3 | 4.4 | 99.1 | 3.8 | 101.2 | 13.8 |
| Fenbendazole | 75.1 | 10.5 | 77.3 | 19.0 | 110.5 | 11.1 | 113.3 | 10.1 | 84.4 | 7.8 | 91.0 | 5.1 | 113.3 | 9.9 | 120.1 | 9.2 |
| Imidocarb | 117.0 | 5.2 | 118.1 | 7.8 | 99.3 | 9.6 | 100.6 | 16.7 | 81.5 | 4.1 | 85.6 | 9.4 | 85.7 | 5.5 | 93.0 | 14.7 |
| Pharmaceutical Drug | C18 (Approach B) | EMR-Lipid (Approach C) | |||||
|---|---|---|---|---|---|---|---|
| Linearity (R2) | LOD (μg/kg) | LOQ (μg/kg) | Linearity (R2) | LOD (μg/kg) | LOQ (μg/kg) | MRL (μg/kg) | |
| Sulfacetamide | 0.9936 | 2.80 | 9.25 | 0.9980 | 1.67 | 5.08 | 100 |
| Sulfapyridine | 0.9929 | 0.92 | 2.77 | 0.9974 | 0.61 | 1.87 | 100 |
| Sulfamethoxazole | 0.9987 | 0.64 | 1.92 | 0.9945 | 0.73 | 2.24 | 100 |
| Sulfathiazole | 0.9900 | 1.89 | 6.25 | 0.9973 | 2.42 | 7.33 | 100 |
| Sulfamethizole | 0.9983 | 3.33 | 10.0 | 0.9963 | 2.38 | 7.20 | 100 |
| Sulfamethazine | 0.9987 | 0.92 | 2.77 | 0.9939 | 2.87 | 8.68 | 100 |
| Sulfamethoxypyridazine | 0.9944 | 0.98 | 2.94 | 0.9934 | 1.10 | 3.35 | 100 |
| Sulfaquinoxaline | 1.0000 | 0.72 | 2.17 | 0.9999 | 1.54 | 4.67 | 100 |
| Sulfadiazine | 0.9983 | 15.1 | 50.0 | 0.9984 | 2.97 | 9.01 | 100 |
| Enrofloxacin | 0.9953 | 0.69 | 2.08 | 0.9915 | 0.10 | 0.30 | 100 |
| Trimethoprim | 0.9904 | 0.09 | 0.30 | 0.9981 | 1.03 | 3.11 | 100 |
| Erythromycin—H2O | 0.9962 | 0.37 | 1.13 | 0.9952 | 2.38 | 7.22 | 50 |
| Prednisone | 0.9994 | 1.26 | 3.80 | 0.9983 | 0.41 | 1.26 | 150 |
| Diclofenac | 0.9930 | 15.1 | 50.0 | 0.9973 | 2.49 | 7.53 | 100 |
| Ketoprofen | 0.9998 | 0.53 | 1.78 | 0.9949 | 3.10 | 10.0 | 50 |
| Albendazole | 0.9989 | 0.14 | 0.44 | 0.9961 | 1.88 | 5.71 | 100 |
| Fenbendazole | 0.9920 | 0.66 | 2.00 | 0.9955 | 1.04 | 3.16 | 10 |
| Imidocarb | 0.9969 | 0.83 | 2.50 | 0.9903 | 0.09 | 0.28 | 50 |
| Pharmaceutical Drug | C18 (Approach B) | EMR-Lipid (Approach C) | ||
|---|---|---|---|---|
| MU% | HorRat | MU% | HorRat | |
| Sulfacetamide | 33.04 | 0.57 | 25.89 | 0.48 |
| Sulfapyridine | 32.37 | 0.58 | 31.13 | 0.57 |
| Sulfamethoxazole | 20.54 | 0.48 | 21.44 | 0.56 |
| Sulfathiazole | 32.16 | 0.58 | 26.12 | 0.57 |
| Sulfamethizole | 31.23 | 0.58 | 29.01 | 0.58 |
| Sulfamethazine | 32.99 | 0.57 | 24.27 | 0.52 |
| Sulfamethoxypyridazine | 20.85 | 0.53 | 32.49 | 0.57 |
| Sulfaquinoxaline | 19.29 | 0.56 | 24.88 | 0.56 |
| Sulfadiazine | 31.23 | 0.58 | 9.94 | 0.51 |
| Erythromycin—H2O | 32.62 | 0.58 | 23.96 | 0.42 |
| Enrofloxacin | 18.30 | 0.55 | 31.75 | 0.60 |
| Trimethoprim | 32.62 | 0.59 | 32.62 | 0.59 |
| Prednisone | 30.30 | 0.42 | 28.26 | 0.57 |
| Diclofenac | 23.97 | 0.55 | 32.78 | 0.59 |
| Ketoprofen | 32.96 | 0.43 | 23.56 | 0.46 |
| Albendazole | 14.80 | 0.45 | 8.55 | 0.50 |
| Fenbendazole | 33.04 | 0.59 | 32.76 | 0.44 |
| Imidocarb | 31.55 | 0.43 | 31.80 | 0.58 |
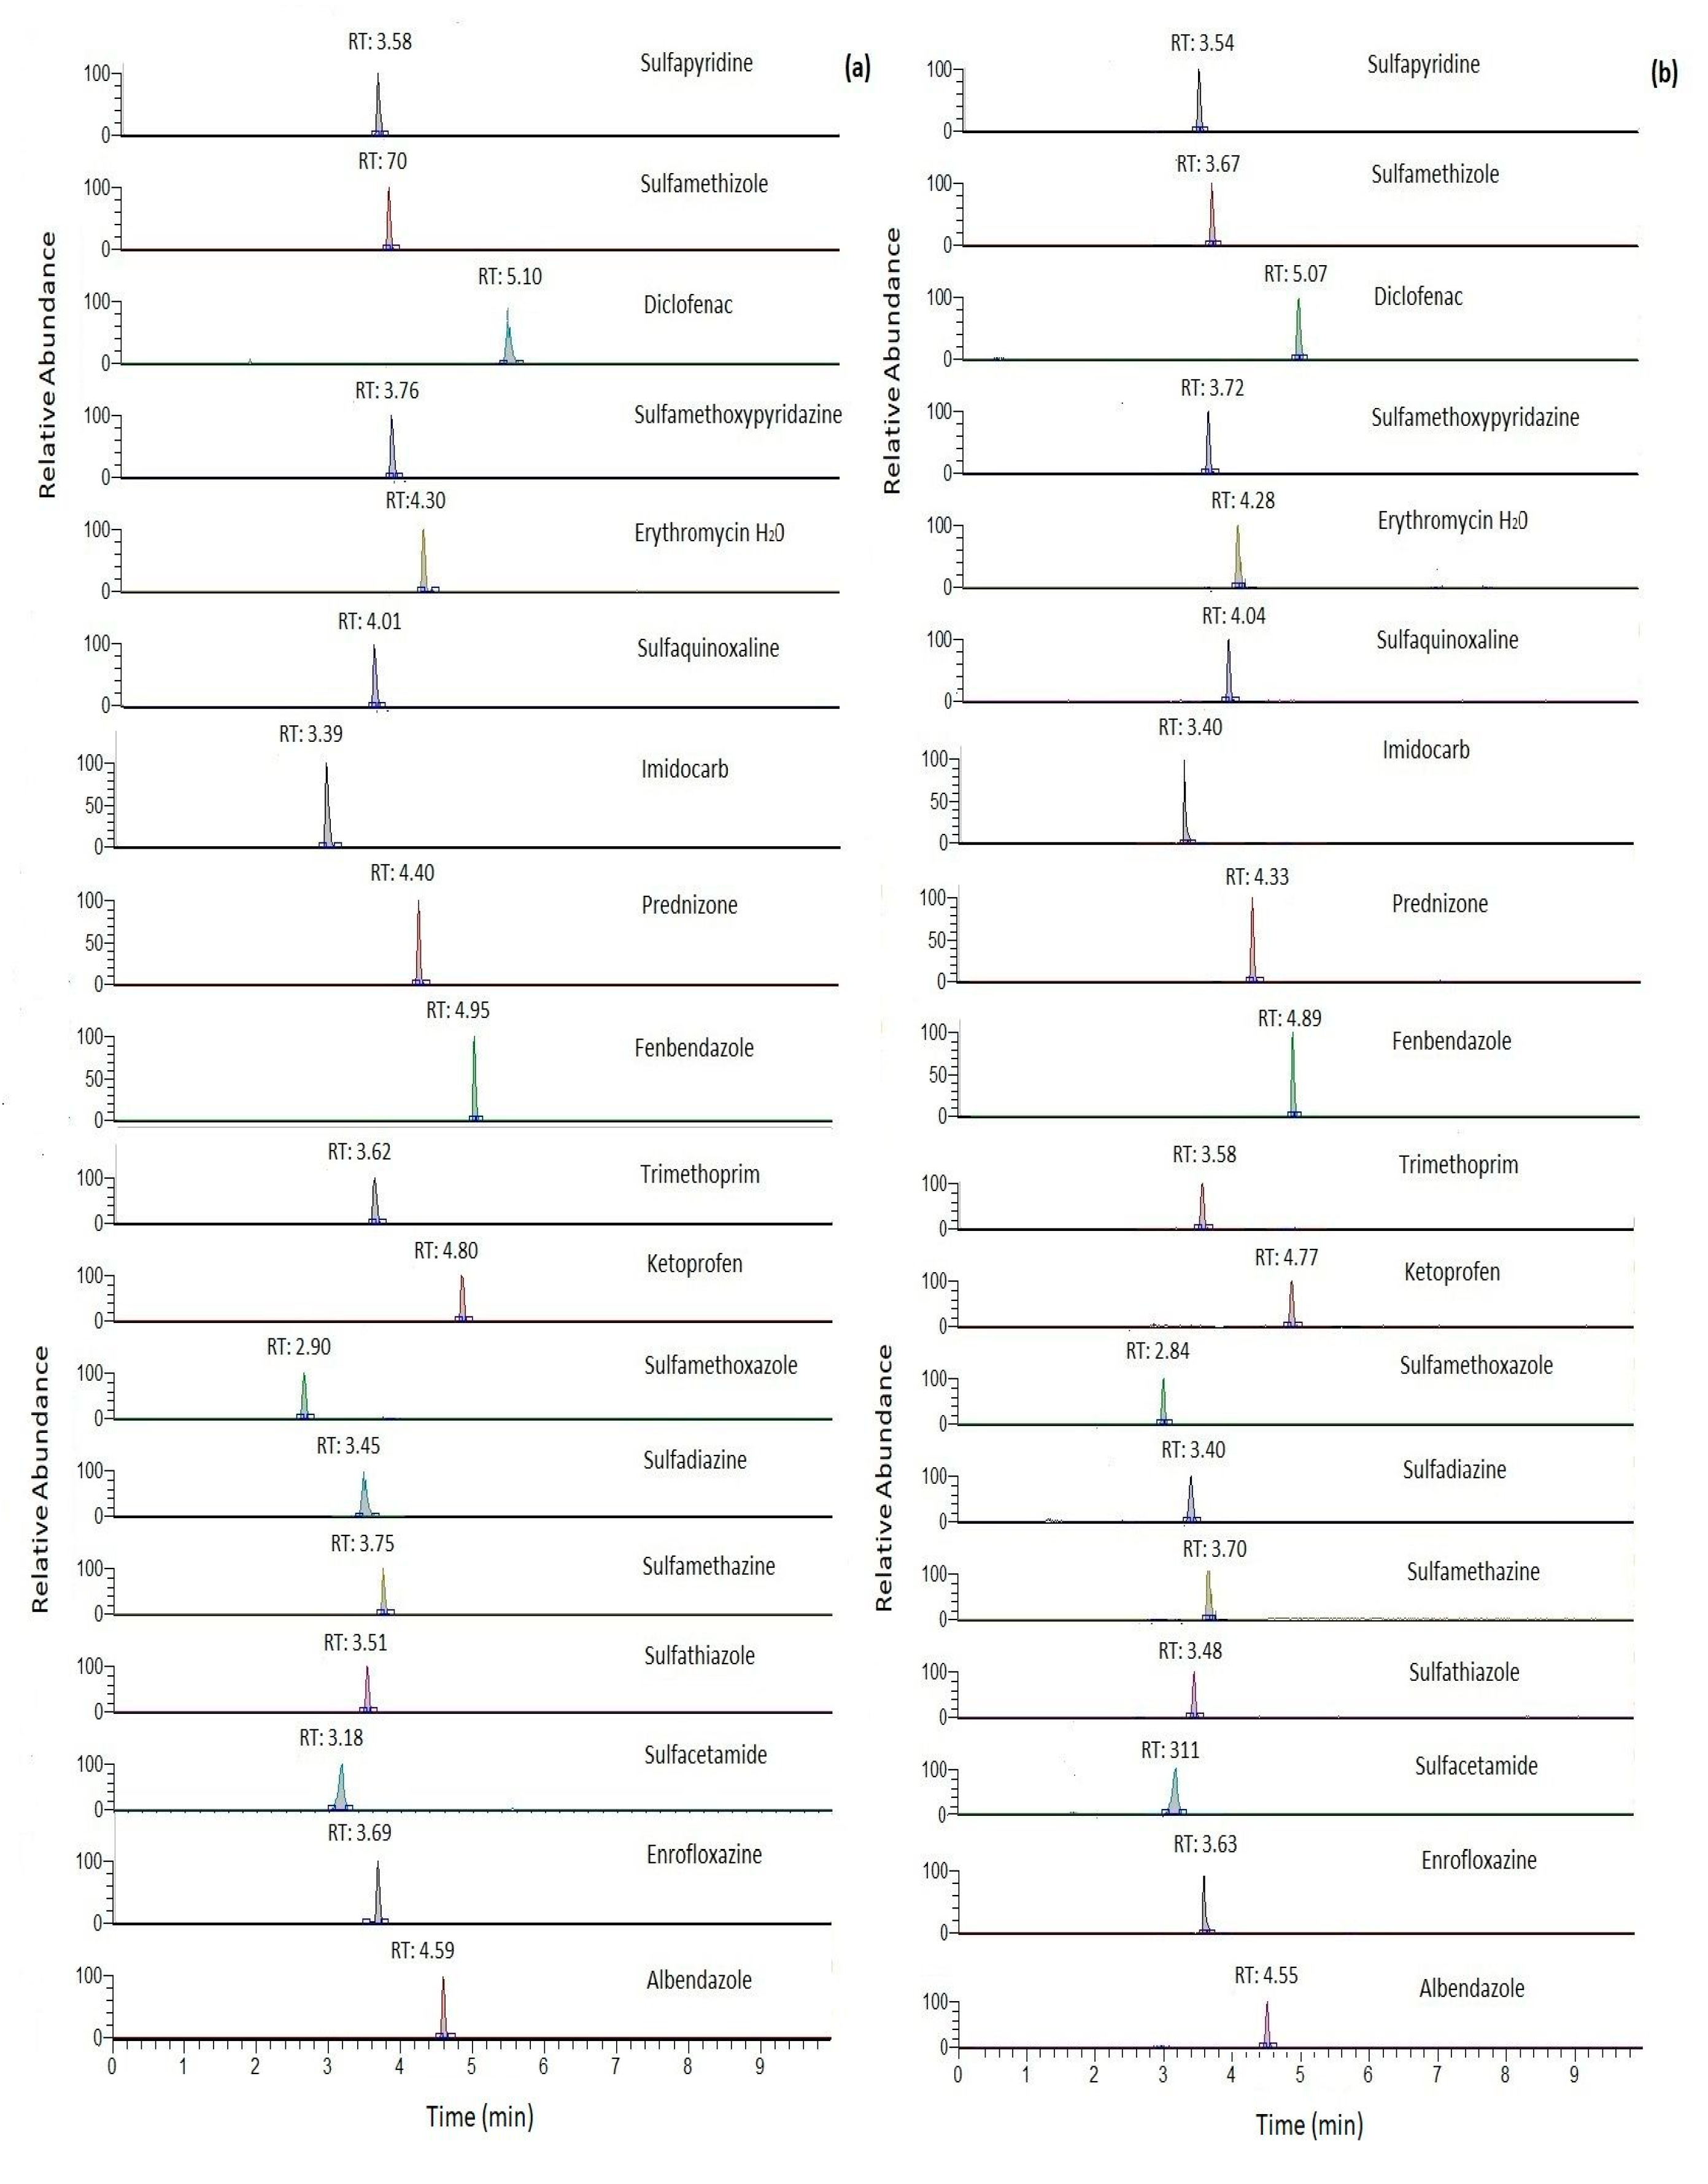
| Pharmaceutical Drug | tR (min) | Pseudo-Molecular Ion [M + H]+ | Theoretical Mass (m/z) | Experimental Mass (m/z) | Ring Double Bond Equivalent (RDBE) | Mass Accuracy | Fragment Ions 35% NCE |
|---|---|---|---|---|---|---|---|
| Sulfacetamide | 3.11 | C8H11N2O3S | 215.0484 | 215.0485 | 4.5 | −0.416 | 108.0488/156.0112 |
| Sulfadiazine | 3.4 | C10H11N4O2S2 | 251.0597 | 251.0614 | 7.5 | −0.091 | 156.0124/158.0027 |
| Sulfamethazine | 3.7 | C12H15N4O2S | 279.091 | 279.0928 | 7.5 | −0.082 | 108.0448/204.0450 |
| Sulfamethizole | 3.67 | C9H11N4O2S2 | 271.0318 | 271.0335 | 6.5 | 0.024 | 156.0123/177.9751 |
| Sulfamethoxazole | 2.84 | C10H12N3O3S | 254.0594 | 254.0609 | 6.5 | 0.045 | 160.0878/195.0923 |
| Sulfamethoxypyridazine | 3.72 | C11H13N4O3S | 281.0703 | 281.0722 | 7.5 | 0.045 | 126.0669/156.0125 |
| Sulfapyridine | 3.54 | C11H12N3O2S | 250.0645 | 250.0661 | 7.5 | 0.105 | 156.0106/184.0861 |
| Sulfaquinoxaline | 4.04 | C14H13N4O2S | 301.0754 | 301.0772 | 10.5 | 0.090 | 146.0721/156.0123 |
| Sulfathiazole | 3.48 | C9H10N3O2S2 | 256.0209 | 256.0227 | 6.5 | 0.021 | 97.7709/156.0112 |
| Enrofloxacin | 3.63 | C19H23FN3O3 | 360.1718 | 360.172 | 9.5 | 0.010 | 316.1840/360.1739 |
| Trimethoprim | 3.58 | C14H19N4O3 | 291.1462 | 291.147 | 7.5 | 3.548 | 123.0657/261.0792 |
| Erythromycin—H2O | 4.28 | C37H66NO13 | 716.458 | 716.4581 | 5.5 | 0.066 | 126.1283/389.2128 |
| Prednisone | 4.33 | C21H27O5 | 359.1853 | 359.1879 | 8.5 | −0.001 | 147.0822/341.1767 |
| Diclofenac | 5.07 | C14H12Cl2NO2 | 296.0239 | 296.024 | 9 | −0.002 | 250.0151/214.0338 |
| Ketoprofen | 4.77 | C16H15O3 | 255.1016 | 255.1018 | 9.5 | 0.114 | 194.004 |
| Albendazole | 4.55 | C12H16N3O2S | 266.0958 | 266.0976 | 6.5 | 0.098 | 191.0138/234.0712 |
| Fenbendazole | 4.89 | C15H14N3O2S | 300.0801 | 300.0823 | 10.5 | −0.08 | 268.0558 |
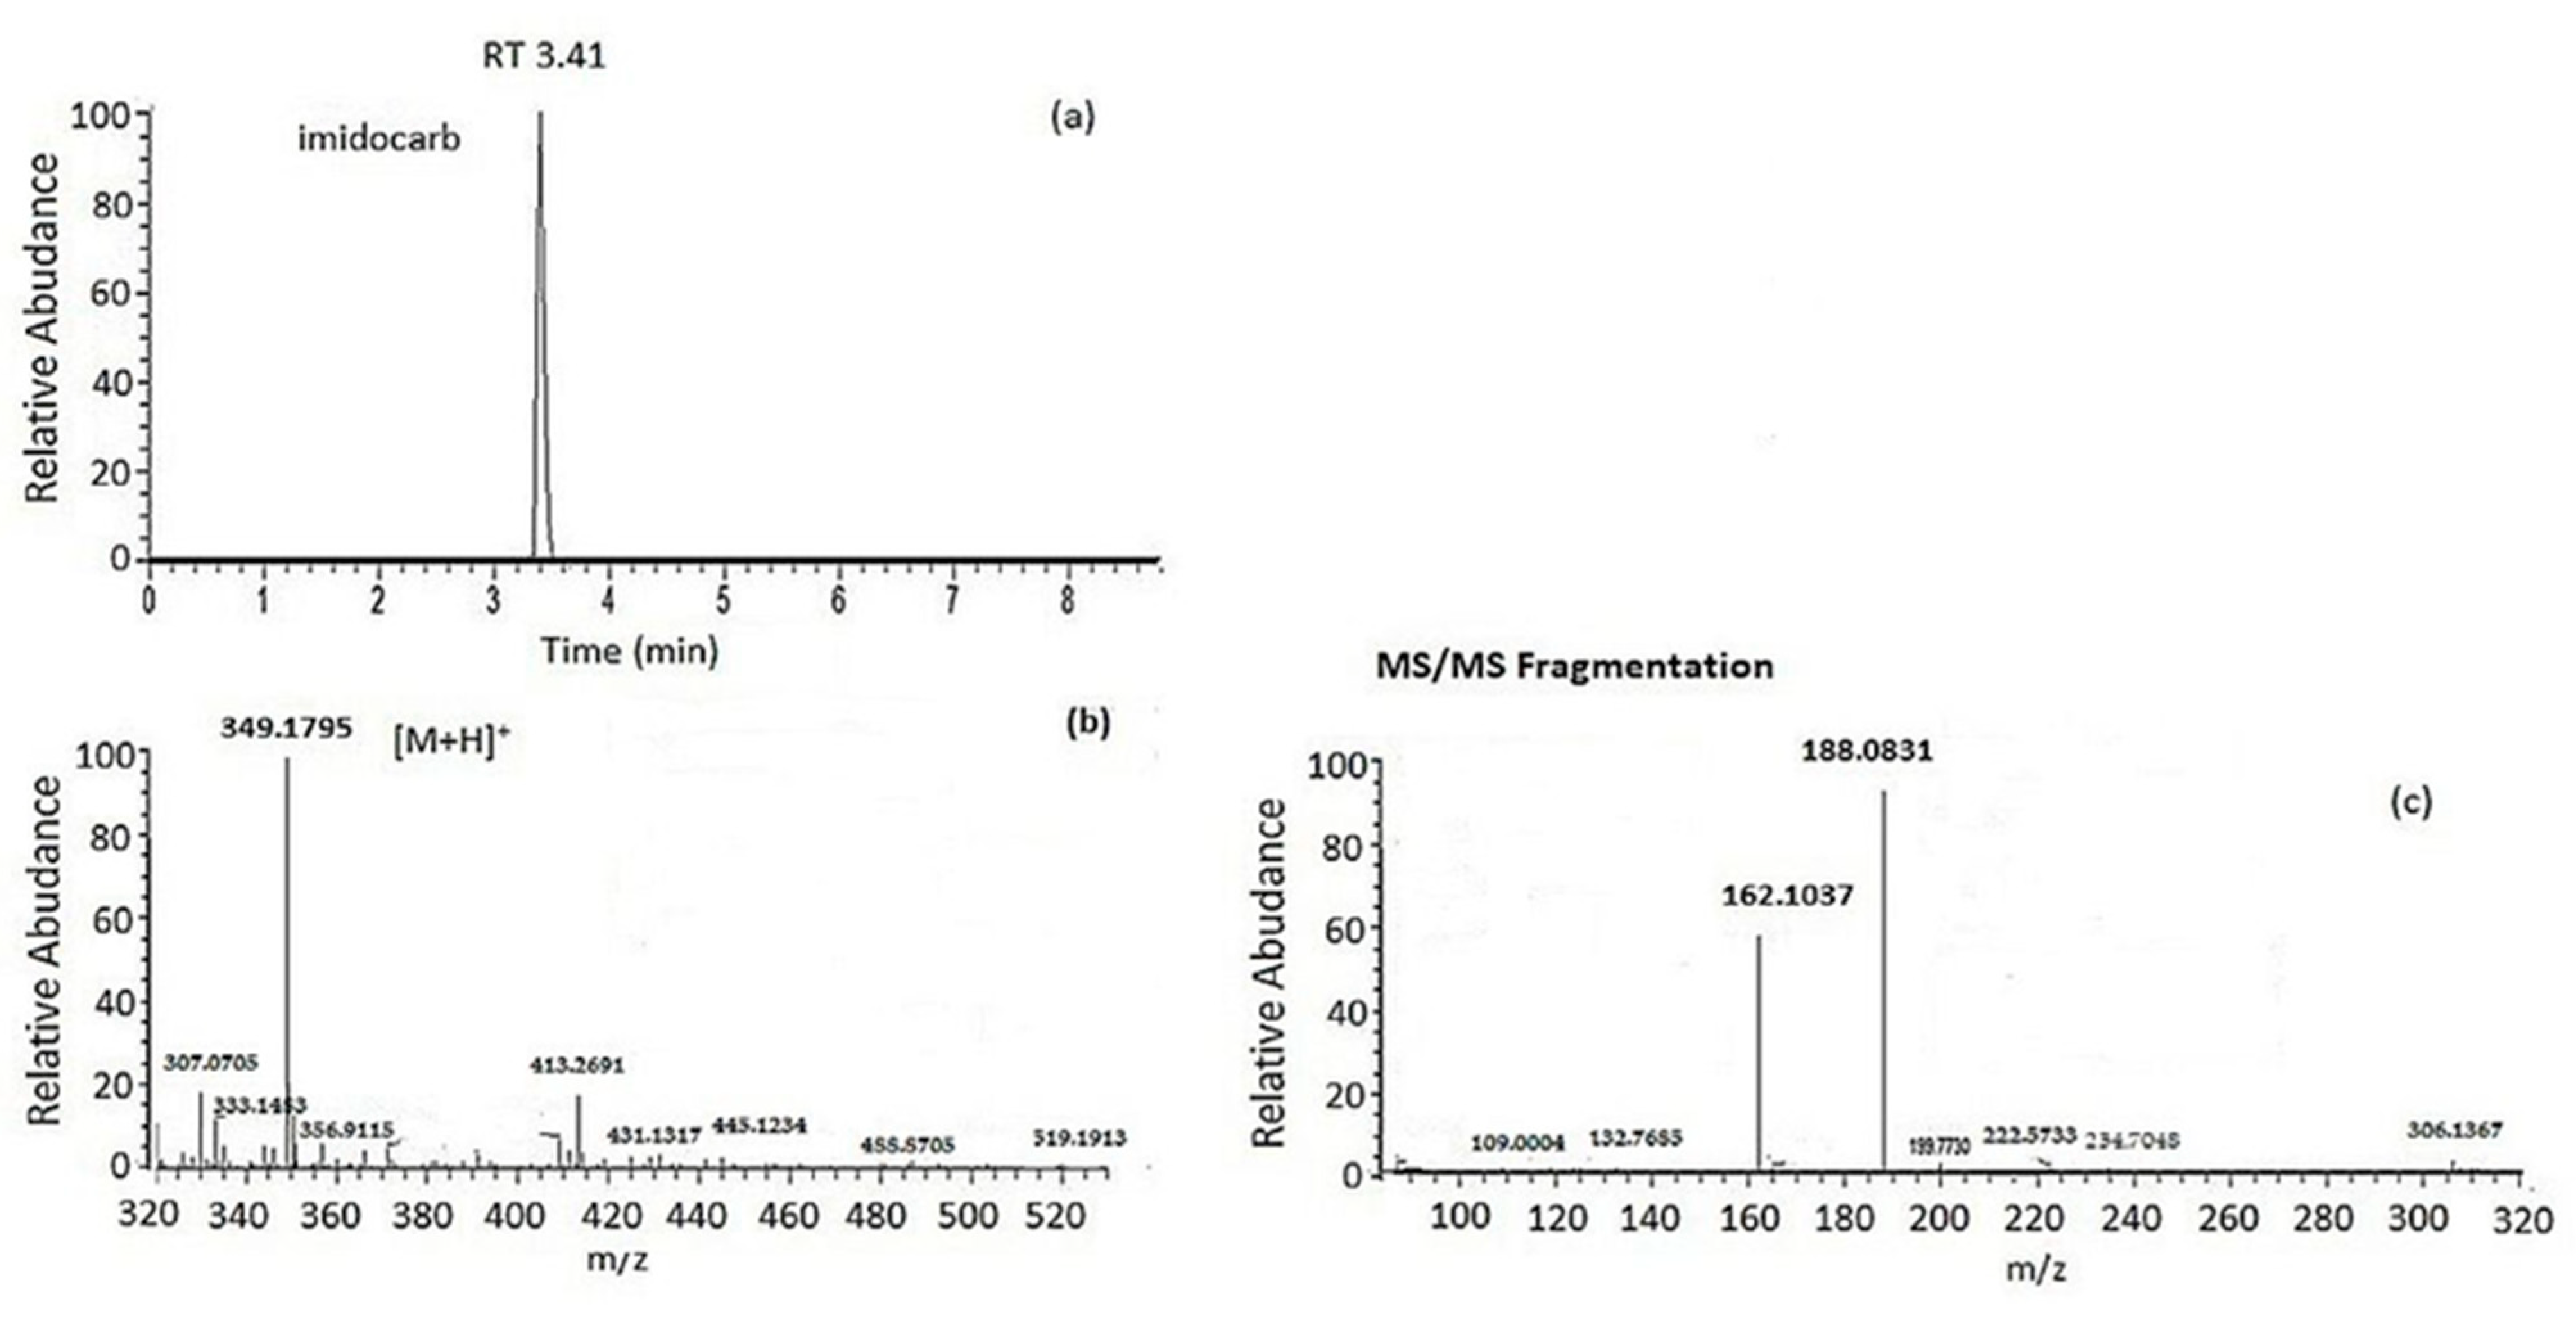
| Imidocarb | 3.40 | C19H21N6O | 349.1771 | 349.1796 | 12.5 | −0.103 | 162.1036/188.0830 |
Disclaimer/Publisher’s Note: The statements, opinions and data contained in all publications are solely those of the individual author(s) and contributor(s) and not of MDPI and/or the editor(s). MDPI and/or the editor(s) disclaim responsibility for any injury to people or property resulting from any ideas, methods, instructions or products referred to in the content. |
© 2023 by the authors. Licensee MDPI, Basel, Switzerland. This article is an open access article distributed under the terms and conditions of the Creative Commons Attribution (CC BY) license (https://creativecommons.org/licenses/by/4.0/).
Share and Cite
Koloka, O.; Koulama, M.; Hela, D.; Albanis, T.; Konstantinou, I. Determination of Multiclass Pharmaceutical Residues in Milk Using Modified QuEChERS and Liquid-Chromatography-Hybrid Linear Ion Trap/Orbitrap Mass Spectrometry: Comparison of Clean-Up Approaches and Validation Studies. Molecules 2023, 28, 6130. https://doi.org/10.3390/molecules28166130
Koloka O, Koulama M, Hela D, Albanis T, Konstantinou I. Determination of Multiclass Pharmaceutical Residues in Milk Using Modified QuEChERS and Liquid-Chromatography-Hybrid Linear Ion Trap/Orbitrap Mass Spectrometry: Comparison of Clean-Up Approaches and Validation Studies. Molecules. 2023; 28(16):6130. https://doi.org/10.3390/molecules28166130
Chicago/Turabian StyleKoloka, Ourania, Marioanna Koulama, Dimitra Hela, Triantafyllos Albanis, and Ioannis Konstantinou. 2023. "Determination of Multiclass Pharmaceutical Residues in Milk Using Modified QuEChERS and Liquid-Chromatography-Hybrid Linear Ion Trap/Orbitrap Mass Spectrometry: Comparison of Clean-Up Approaches and Validation Studies" Molecules 28, no. 16: 6130. https://doi.org/10.3390/molecules28166130