Article

The Role of Cerium Valence in the Conversion Temperature of H2Ti3O7 Nanoribbons to TiO2-B and Anatase Nanoribbons, and Further to Rutile

by
Polona Umek
1,*,
Michael Dürrschnabel
2,
Leopoldo Molina-Luna
3,
Srečo Škapin
1,
Romana Cerc Korošec
4 and
Carla Bittencourt
5,*
1
Jožef Stefan Institute, Jamova Cesta 39, 1000 Ljubljana, Slovenia
2
Karlsruhe Institute of Technology, P.O. Box 6980, 706049 Karlsruhe, Germany
3
Department of Materials and Earth Sciences, Technische Universität Darmstadt, Peter-Grünberg-Strasse 2, 64287 Darmstadt, Germany
4
Faculty of Chemistry and Chemical Technology, University of Ljubljana, Večna Pot 113, 1000 Ljubljana, Slovenia
5
Chimie des Interactions Plasma-Surface (ChIPS), Research Institute for Materials Science and Engineering, University of Mons, 7000 Mons, Belgium
*
Authors to whom correspondence should be addressed.
Molecules 2023, 28(15), 5838; https://doi.org/10.3390/molecules28155838
Submission received: 11 July 2023 / Revised: 31 July 2023 / Accepted: 1 August 2023 / Published: 3 August 2023
(This article belongs to the Special Issue Nanocomposite and Hybrid Nanomaterial Applications)

Abstract

:
CeO2-TiO2 is an important mixed oxide due to its catalytic properties, particularly in heterogeneous photocatalysis. This study presents a straightforward method to obtain 1D TiO2 nanostructures decorated with CeO2 nanoparticles at the surface. As the precursor, we used H2Ti3O7 nanoribbons prepared from sodium titanate nanoribbons by ion exchange. Two cerium sources with an oxidation state of +3 and +4 were used to obtain mixed oxides. HAADF–STEM mapping of the Ce4+-modified nanoribbons revealed a thin continuous layer at the surface of the H2Ti3O7 nanoribbons, while Ce3+ cerium ions intercalated partially between the titanate layers. The phase composition and morphology changes were monitored during calcination between 620 °C and 960 °C. Thermal treatment led to the formation of CeO2 nanoparticles on the surface of the TiO2 nanoribbons, whose size increased with the calcination temperature. The use of Ce4+ raised the temperature required for converting H2Ti3O7 to TiO2-B by approximately 200 °C, and the temperature for the formation of anatase. For the Ce3+ batch, the presence of cerium inhibited the conversion to rutile. Analysis of cerium oxidation states revealed the existence of both +4 and +3 in all calcined samples, regardless of the initial cerium oxidation state.

Graphical Abstract

1. Introduction

Titanium dioxide (TiO2), owing to its unique combination of properties, high chemical stability, and low cost, is one of the most investigated materials used in a wide range of applications [1,2,3]; due to its high refractive index, opacity, and brightness, it has been widely used as a white pigment in paints, coatings, and plastics [4]. It is a wide-gap semiconducting material with Eg~3.2 eV exhibiting photocatalytic activity. This property makes it useful in air and water purification, self-cleaning surfaces, and even hydrogen fuel production [5]. Due to its biocompatibility, it has been used as material for prostheses in dental, orthopedic, and osteosynthesis applications [6,7].
Several approaches were suggested to tune the TiO2 properties, including particle size, particle shape and surface modification, and doping, to mention a few [8,9]. In the case of particle size and shape modification, several synthetic approaches were proposed for the preparation of nanosized TiO2, including sol-gel, hydrothermal and solvothermal synthesis, microemulsion [10], and co-precipitation methods [11,12,13]. One-dimensional (1D) TiO2 nanostructures, such as nanotubes, nanowires, and nanoribbons, can be prepared from 1D hydrogen titanates (H2TinO2n+1) by thermal treatment in air [14,15,16]. Each method has its advantages and disadvantages, and the choice of method will depend on the specific application and desired properties of the nanosized TiO2 material. Doping of TiO2 with various transition metals or lanthanide ions can improve its properties by increasing its visible light absorption, enhancing its photocatalytic activity, and improving its charge separation efficiency [1,17]. Among the rare earth elements, cerium has received attention as cerium doping enhances optical absorption in the visible region and inhibits the recombination rate of photo-generated carriers [18,19,20,21,22]. Additionally, doping with lanthanide ions can modify the band structure of TiO2, improving its electronic and optical properties, and as a result, affecting its catalytic properties [23,24].
1D hydrogen trititanate nanostructures, i.e., H2Ti3O7, have been exploited as an attractive precursor for the preparation of 1D TiO2 nanostructures for three main reasons: (i) these materials are thermally unstable, and upon heating, they readily transform to TiO2 [25,26,27,28], (ii) they can be prepared in several 1D morphologies, such as nanotubes (HTiNTs) [29,30,31,32], nanowires [33,34,35], and nanoribbons (HTiNRs) [15,36], and (iii) low cost and facile synthesis routes. Three TiO2 polymorphs, TiO2-B, anatase, and rutile, can be obtained by the thermal treatment of H2Ti3O7 in air [15,16,37]. At elevated temperatures, anatase irreversibly transforms to rutile [38]. The fragmentation of the nanoribbons accompanies this transformation. On the other hand, the transformations from H2Ti3O7 to TiO2-B and further to anatase are topotactic reactions as the morphology is preserved due to structural similarities between these three structures [25,39,40]. The transformation of H2Ti3O7 to TiO2-B is not a direct one; it occurs in several dehydration steps [25,41]. The transformation temperatures strongly depend on the starting H2Ti3O7 morphology. For instance, for nanoribbons with diameters up to 300 nm and lengths ranging from 500 nm to several microns, the conversion temperature for TiO2-B is approximately 400 °C [15,42]. For nanotubes that are hollow structures with average outer diameters of 12 nm and an inner between 5 and 8 nm, less energy is required. They transform already at 250 °C [32,43]. By doping, in small quantities, the conversion temperatures can be significantly altered, as in the case of HTiNRs doped with 1.5 wt.% of Mn2+, where rutile was reported to appear at 700 °C [36].
There have been only a few reports on doping 1D titanate [44,45,46] and TiO2 nanostructures [47] with cerium. In the report by Viana et al. [44], sodium titanate nanotubes were used as a support for decoration with CeO2 particles; (NH4)2Ce(NO3)6 was used as a cerium source. By an ion-exchange reaction, Ce4+ ions replaced Na+ ions between the titanate layers, and CeO2 nanoparticles grew on the surface of the nanotubes. It was shown that this modification shifted the adsorption band toward the visible range. Marques et al. [45] evaluated the critical concentration of Ce4+ in the aqueous solution at which CeO2 nanoparticles started forming in the titanate nanotubes’ surface. These authors showed the presence of cerium in oxidation states of +4 and +3; the latter was formed via reduction reactions in an aqueous solution of the Ce4+ precursor. The Ce3+ ions also led to the successful ion exchange of sodium ions [46]. CeO2 coating of TiO2 nanotubes obtained by an anodization process increased the bioactivity of titania, as reported in [47].
We prepared two sets of H2Ti3O7 nanoribbons (HTiNRs): (i) in the first one, the surface of HTiNRs was coated with a thin continuous cerium-containing layer, while in the second, (ii) cerium ions intercalated between the titanate layers in a low amount via an ion exchange reaction. For impregnation/intercalation of HTiNRs, two cerium salts, as sources of Ce4+ and Ce3+, respectively, (Ce(SO4)2·4H2O and Ce(NO3)3·6H2O), were chosen to evaluate the effects of the starting cerium valence on surface impregnation and/or intercalation between titanate layers. The impact of cerium valence (+4 and +3) on modifying H2Ti3O7 nanoribbons and in converting H2Ti3O7 to TiO2-B, and further to anatase and rutile, were investigated. H2Ti3O7 nanoribbons were selected as a precursor of TiO2 nanoribbons for transformation conducted by calcination for three reasons: (i) a 1D shape that is preserved until anatase formation, (ii) a transformation pathway going through three TiO2 crystalographic phases, and (iii) a layered structure enabling cation intercalation. The difference in the oxidation state of the initial cerium ions was found to be crucial for the HTiNRs modification; in the case of Ce4+, a thin continuous cerium-containing layer at the surface of the nanoribbons was formed, while for the Ce3+, cerium ions via an ion exchange reaction intercalated between the titanate layers in a small amount. The transformation of cerium-modified H2Ti3O7 nanoribbons to TiO2-B, and then to anatase and rutile upon increasing the calcination temperature, between 400 °C and 960 °C, was monitored. The temperature required for the formation of TiO2-B for both ions was higher than for the non-cerium-modified nanoribbons. The formation of CeO2 nanoparticles on the surface of 1D TiO2 nanostructures in the same temperature range was observed. Cerium in oxidation states of +4 and +3 were observed in all cerium-containing samples, regardless of the starting oxidation state of cerium. Interestingly, the presence of cerium in anatase nanoribbons prepared with the Ce3+ increased the temperature for the conversion to rutile.

2. Results and Discussion

Hydrogen titanate nanoribbons (HTiNRs), with an average width of 30–300 nm and length of 0.5–10 μm, were used as a precursor for surface impregnation/intercalation with cerium and further transformation to CeO2-TiO2 NR composites via calcination in air. A characteristic scanning electron microscopy (SEM) image of obtained HTiNRs revealed a high nanoribbon content with a smooth surface (Figure S1). Their powder X-ray diffraction (XRD) pattern (Figure S2, bottom panel) corresponds to the pattern of H2Ti3O7 as reported in the literature [15,27,37].

2.1. Characterization of H2Ti3O7 Nanoribbons Impregnated/Intercalated with Cerium

Two cerium salts sources Ce(SO4)2·4H2O and Ce(NO3)3·6H2O were used to prepare two sets of HTiNRs impregnated/intercalated with cerium, Ce4+-HTiNRs, and Ce3+-HTiNRs, respectively. The impregnation of HTiNRs with the Ce4+ precursor affected the color of the nanoribbons, which changed from white to pale yellow. While the change in color of Ce3+-HTiNRs was not visible to our eyes. The powder X-ray diffraction patterns (XRDs) (Figure 1a,b, bottom panels) matched those reported for layered trititanate, i.e., H2Ti3O7 (Figure S2, bottom panel) [15,27,37].
The peak at ~10° in the XRDs of the titanate samples (Figure 1 and Figure S2), i.e., HTiNRs, Ce3+-HTiNRs, and Ce4+-HTiNRs, arises from the layered trititanate structure and gives information about the interlayer distance [48]. For Ce3+-HTiNRs, a shift in this peak from 10.54° to 10.68° was observed (Figure S3), indicating the contraction of the interlayer distance. Due to the bigger size of cerium (III) than the hydronium ion, the interlayer distance was expected to increase [49]. Since cerium (III) is a trivalent ion and hydronium ion is monovalent, one Ce3+ changes to three hydronium ions. Therefore, it might be assumed that only a smaller amount of hydronium ions was exchanged with Ce3+ ions; the exchange of hydronium ions with cerium (III) ions resulted in the removal of the interlayer water and the formation of vacancies, which promoted the strengthening of the Ti-O bonds, resulting in contraction of the interlayer distance [45]. Conversely, no shift in the peak ~10° for Ce4+-HTiNRs was observed, which might be associated with the formation of Ce4+ polynuclear species [50,51,52,53], which are too large to intercalate between the titanate layers. This is supported by scanning transmission electron microscopy–electron energy loss spectroscopy (STEM–EELS) analysis (Figure 2). A comparison of the elemental maps (Ti, O, and Ce) reveals that the nanoribbon surface is covered with a continuous ~4 nm thick cerium layer. As expected, the impregnation of HTiNRs with Ce4+ and Ce3+ did not affect either the material’s morphology or the surface of the NRs, which appears smooth, as revealed by SEM investigation (Figure S4).
The amount of cerium salts used for wet impregnation was calculated to give around 5 wt.% of cerium in the final product, that is, TiO2 NRs. The cerium content in Ce4+-HTiNRs, determined with energy dispersive X-ray spectroscopy (EDXS) analysis, is 3.4 wt.% and 0.3 wt.% for Ce4+-HTiNRs and Ce3+-HTiNR, respectively (Table 1).
Results of thermo-gravimetric analysis (TGA) of both Ce-containing HTiNR samples (Figure S5) are similar to the TGA curve of pure HTiNRs [15]. However, a slightly higher weight loss (1.1 wt.%) was observed for the HTiNRs impregnated with Ce4+, which can be explained by a higher cerium content (Table 1) [51,52,53].

2.2. Conversion of H2Ti3O7 Nanoribbons to TiO2 by Thermal Treatment in Air

Based on a preliminary study, the calcination temperatures were set to 620 °C, 750 °C, 860 °C, and 960 °C. In addition, a batch of samples obtained by calcination of pristine HTiNRs for the comparison of phase composition and morphology was prepared. Sample labels, calcination temperatures, phase compositions, cerium contents, cerium oxidation states, and band gap values are listed in Table 1.

2.2.1. Cerium Content

The cerium content of the calcined samples, obtained with EDXS analysis, is given in Table 1. At the final calcination temperature of 960 °C, the cerium content is 3.7 and 0.4 wt.% for Ce4+ and Ce3+ products, respectively. Small amounts of sulfur were detected in the samples obtained by calcinating the Ce4+-HTiNRs. The sulfate group in the cerium precursor fully decomposed only above 800 °C. In comparison, the decomposition of the nitrate group of the source Ce(NO3)3·6H2O occurs before reaching 300 °C (Figures S6 and S7).

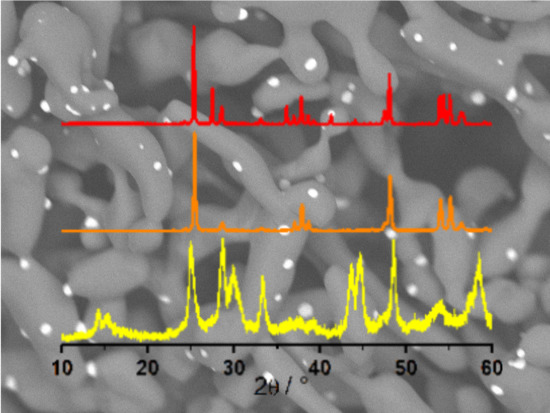
2.2.2. Structural Determination of TiO2 Polymorphs

The XRD pattern of the pristine HTiNRs (H2Ti3O7 NRs) sample calcined at 620 °C shows the presence of the anatase phase (ICCD card no. 86-1157) and traces of TiO2-B (ICCD card no. 35-0088); the transformation to anatase was completed at 860 °C. With an increased calcination temperature to 960 °C, in addition to anatase related peaks, new peaks corresponding to rutile (ICCD card no. 89-0555) appeared (Figure S2). For pristine HTiNRs, the transformation to TiO2-B was reported to occur typically at 400 °C [15,42]. While for the complete conversion of Ce4+-HTiNRs to TiO2-B, a higher temperature (620 °C) was required (Figure 1a). As the temperature was raised to 750 °C, TiO2-B partly converted to anatase, and new peaks corresponding to CeO2 appeared (ICCD card no. 81-0792). Transformation to anatase was completed at 860 °C; all peaks in the Ce4+-860 °C diffractogram corresponded to anatase and CeO2. With a further increase in the calcination temperature to 960 °C, anatase partially converted to rutile. In the case of the Ce3+-HTiNRs precursor (Figure 1b), at 620 °C, the main phase was TiO2-B with traces of anatase. At 750 °C, almost all TiO2-B is converted to anatase. Similar to the Ce4+-HTiNR batch, the transformation to anatase was completed at 860 °C. In Ce3+-HTiNRs, anatase was partially converted to rutile as the temperature was raised to 960 °C (Figure 1b).
Next, from the intensities of the (101) anatase and (110) rutile peaks (Figure 1a,b and Figure S2), positioned at ~25.3° and 27.4°, respectively, for the samples calcined at 960 °C the amount of rutile was calculated using the equation suggested by Spurr and Mayers [54] (Table 2). In p-960 °C, rutile was already the majority phase (60 wt.%), while in Ce4+-960 °C and Ce3+-960 °C, the amount of rutile was 31% and 17%, respectively. This might suggest that the cerium source and location of cerium ions in anatase nanoribbons may play an essential role in inhibiting the transformation to rutile. Therefore, regardless of the cerium source and content, the presence of cerium in HTiNRs, i.e., Ce3+-HTiNRs and Ce4+-HTiNRs (Table 1), significantly raised the temperature for both transformations, TiO2-B to anatase and anatase to rutile, when compared to the pristine HTiNRs (Figure S2) [15,42,55], or as reported to Mn2+-doped HTiNRs [36], where rutile had already appeared below 600 °C.
In addition, the size of CeO2 nanoparticles was calculated from the (111) CeO2 peak positioned at 28.7° (ICDD card no. 81-0792) using the Scherer formula (d = 0.9 λ/B cos θ; λ = 1.54 Å, where B is the full width at half maximum and is the Bragg angle). The calculated values are 22 nm and 33 nm for Ce4+-860 °C and Ce4+-960 °C, respectively.

2.2.3. Changes in the Nanoribbon Morphology and Formation of CeO2 Nanoparticles

Figure S8 summarizes the impact of the calcination temperature on changes in the nanoribbons’ shape for samples prepared by calcination of Ce4+-HTiNRs. As expected, the nanoribbon morphology was intact until 750 °C. At 860 °C, the diameter along individual nanoribbons was no longer uniform. At some places along the nanoribbons, thicker areas appeared, and the nanoribbon edges became rounder due to the sintering effect. At 960 °C, the observed elongated structures were much thicker (Figure S8d) than the starting nanoribbons [42]; it looked as if the elongated thickened parts, originating from the nanoribbons, formed a kind of three-dimensional network. In addition, as expected, the fragmentation of nanoribbons, caused by the anatase to rutile transformation, was more severe for p-960 °C (Figure S9) due to a higher mass fraction of rutile compared to Ce4+-960 °C and Ce3+-960 °C (Table 2). Interestingly, the nanoribbon morphology was less affected in Ce3+-960 °C than in Ce4+-960 °C, which is associated with a lower amount of rutile in the former (Table 2), suggesting that cerium species in Ce3+-960 °C inhibited the conversion to rutile. Similar findings were observed when CeO2 was added to the CuO-TiO2 system [56].
Upon calcination, CeO2 nanoparticles were observed on the surface of the TiO2 nanoribbons (NPs) (Figure 3); for the Ce4+ batch, they were observed (in SEM images) at 750 °C, while for the Ce3+ batch, they were observed at 860 °C. The difference in the temperature at which CeO2 NPs start to be observed can be associated with the cerium content, which was much lower for the Ce3+ batch (Table 1), and the fact that cerium ions in Ce3+-HTiNTs intercalated between the titanate layers needed more to migrate to the surface. Upon a higher calcination temperature, cerium atoms between the layers diffuse toward the surface, where they segregate, forming CeO2 NPs [56]. Therefore, we decided to investigate the sample calcined at the lowest temperature (Ce4+ batch) in more detail. STEM–EDX elemental mapping of Ce4+-620 °C revealed a small number of cerium-containing nanoparticles with diameters below 20 mm on the surface of the nanoribbons (Figure S11).
With the increasing calcination temperature, the CeO2 NP size increased. The density distribution of CeO2 NPs was higher at the final calcination temperature (960 °C) for the Ce4+ sample than for the Ce3+ sample due to a higher cerium content (Table 1). The measured diameter of CeO2 NPs was between 13 and 35 nm for Ce4+-850 °C, while in Ce4+-960 °C, their size was between 20 and 70 nm (Figure S10), which agreed with the calculated values from the XRDs.

2.2.4. Determination of Cerium Oxidation State and the Ratio between Ce4+/Ce3+

CeO2 is known for its unique redox chemistry. Oxidation states +3 and +4 steadily exist and can easily switch between each other [57,58]. Therefore, Ce4+-620 °C was investigated by STEM–EELS measurements to determine the cerium valence, at a nanoparticle and at a region of a nanoribbon without a particle. (Figure S11). The results are shown in Figure 4; the circles in the high-angle annular dark-field (HAADF) image denote the exact locations from which the electron energy loss (EEL) spectra of the Ce-M4,5 were measured (Figure 4a,b). In the EEL spectrum measured over the nanoparticle beside the M4 and M5 edges, the post-edge peaks associated with Ce4+ appeared. The M4 and M5 edges in the spectrum measured at the nanoribbon shifted to a lower energy loss by 1.6 and 1.1 eV, respectively, which is characteristic of Ce3+. Therefore, we can conclude that cerium at the surface of the nanoribbon was a mixture of Ce4+ and Ce3+, and in the nanoparticle, it is more Ce4+.
X-ray photoelectron spectroscopy (XPS) was used to probe a larger sample area to determine the cerium oxidation states and their ratios in the samples derived by the calcination of Ce4+-HTiNRs (Table 1 and Figure 5). In all samples obtained from Ce4+-HTiNRs, the presence of cerium in oxidation states +4 and +3 was observed, which is not surprising given the facile transformation of Ce4+ to Ce3+ [57]. In the Ce 3d core level region of the XPS spectra, several characteristic structures of CeO2 appeared for annealing at higher temperatures; the main peak is centered at 915 eV and the shoulder at 880 eV of binding energy (Figure 5a,b). The intensity of both structures increased with increasing calcination temperatures, indicating that the amount of CeO2 increased, which coincides well with the XRD analysis (Figure 1a and Figure S10). Due to the low cerium content in materials derived from Ce3+-HTiNRs (Table 1), evaluation of the ratio of Ce3+/Ce4+ in these materials was impossible due to the low quality of the spectra; however, the peak structures characteristics for both cerium oxidation states could be observed (Figure 5c).

2.2.5. Optical Band Gap Features

The last column in Table 1 reports the band gap energies of all three sets of samples. The band gap of HTiNRs is 3.45 eV. Surprisingly, the band gap energies of Ce4+-HTiNRs and Ce3+-HTiNRs are slightly higher, 3.56 and 3.53 eV, respectively. This might be connected with (i) the presence of sodium ions in trace amounts [5] left between the layers after ion exchange (the amount of sodium in HTiNRs determined with EDXS analysis was below the detection limit of 0.1 wt.%), and/or (ii) with the presence of a thin Ce-containing layer on the surface of Ce4+-HTiNRs, and (iii) reduced order due to partial exchange of hydronium ions by Ce3+ in the case of Ce3+-HTiNRs [59]. During thermal treatment in air, the Eg was gradually reduced with increasing calcination temperatures for all three sets of samples. This can be attributed to the formation of TiO2-B, anatase, and rutile (for the highest calcination temperature), and to the increasing crystallinity (Figure 1a,b and Figure S1) of the nanoribbons.
Reported band gap energies of crystalline bulk TiO2-B and anatase are equal, namely, 3.2 eV [5], and are smaller than those measured for our TiO2 samples (Table 1). During the particle size reduction from micro to nano-sized particles, the band gap values of semiconductors are usually increased [60].

3. Materials and Methods

3.1. Materials Preparation

Preparation of H2Ti3O7 nanoribbons. The starting material, H2Ti3O7 nanoribbons (NRs), were prepared according to the method already reported elsewhere [15,61], with the exception that for the preparation of H2Ti3O7 NRs from (Na, H)2Ti3O7 NRs by ion exchange, instead of 0.1 M CH3COOH, 0.1 M HCl were used [36].
Preparation of TiO2 NRs decorated with CeO2 NPs via calcination in air. Firstly, a wet impregnation was employed to prepare H2Ti3O7 NRs coated with cerium. As precursors of cerium in oxidation states +4 and +3, Ce(SO4)2·4H2O and Ce(NO3)3·6H2O were used. The amount of cerium precursors was calculated to give approximately 5 wt.% of cerium in TiO2 NRs; in brief, 1 g of HTiNRs was dispersed into 120 mL of deionized water, then 50 mL of a water solution of cerium precursor (120 mg of Ce(SO4)2·4H2O and 135 mg of Ce(NO3)3·6H2O) was added dropwise. Prepared mixtures were stirred overnight, then filtrated, and finally dried in air at 100 °C for 10 h. Prepared precursors were labeled Ce4+-HTiNRs and Ce3+-HTiNRs. In the next step, H2Ti3O7 nanoribbons impregnated with cerium were transformed into TiO2 NRs decorated with CeO2 nanoparticles (NPs) by calcination in static air; 150 mg of the precursor was weighed in an alumina boat, placed into an oven (Carbolite), and heated to the target temperature (400 °C, 620 °C, 750 °C, 860 °C, and 960 °C) at 1 °C/min. Samples were maintained at the selected temperature for 7 h and then cooled to room temperature. Sample labels, exact reaction conditions, and phase compositions are listed in Table 1.

3.2. Materials Characterization

The physical and chemical properties of the prepared materials were analyzed using several experimental techniques. The morphological features were studied using field emission scanning electron microscopes (SEM) (JEOL-7600F, JEOL Tokyo, Japan and Verios G4, ThermoFischer, Waltham, MA, USA) and a transmission electron microscope (HRTEM), JEM 2100 (Jeol Ltd., Akishima City, Japan). Specimens for the SEM analysis were prepared by dispersing a small amount of prepared powder samples in deionized water, and a drop of the dispersion was deposited on a polished surface of an Al sample holder. Before the SEM investigation, a ca. 3 nm thick carbon layer was deposited on the specimens to reduce the charging effect. The crystallinity of the nanoribbons and cerium distribution over the nanoribbons in the samples were investigated with a transmission electron microscope (TEM) Jeol 2100 at 200 keV and a ThermoFisher Talos F200X scanning transmission electron microscope (STEM) equipped with four energy-dispersive X-ray (EDX) detectors and a Gatan Enfinium electron energy-loss (EEL) spectrometer (Gatan, Pleasanton, CA, USA) with DualEELS capability. The microscope was operated at 200 kV, and the energy resolution of the recorded EEL spectra was about 1.2 eV. The convergence and the collection angle for the EELS experiments were 10.5 and 14.1 mrad, respectively. The Ce M5/M4 ratio was determined using the second derivative method described in [62,63]. Specimens for TEM/HAADF–STEM analyses were dispersed ultrasonically in methanol, and a drop of the dispersion was deposited onto a lacy carbon film supported by a copper grid.
Identification of the phase composition of the samples was determined from powder X-ray diffraction (XRD) patterns measured using a D4 Endeavor, Bruker AXS diffractometer, Bruker, Karlsruhe, Germany with Cu Kα radiation (λ = 1.5406 Å) and a Sol-X energy-dispersive detector. Diffractograms were measured in the 2θ angular range with a step size of 0.02° s−1 and a collection time of 3 s.
Elemental composition was determined from energy-dispersive X-ray data (EDX) measured using a field emission scanning electron microscope (JEOL 7600F) equipped with an EDX spectrometer elemental analysis system. Specimens for EDX analyses were prepared by pressing powder samples into pellets and placing them on carbon tape on an Al sample holder. The holder with the samples was coated with a thin carbon layer before the analysis.
X-ray spectroscopy (XPS) measurements have been conducted to determine the oxidation states of cerium and titanium. XPS measurements were performed with a VERSAPROBE PHI 5000 (Physical Electronics, Inc., Chanhassen, MN, USA) equipped with a monochromatic Al Kα X-ray source. The energy resolution was 0.7 eV. Specimens for XPS measurements were prepared by pressing the sample powders into pellets. A conductive double-face tape UHV compatible was used to attach the pellet to a sample holder.
Diffuse reflectance UV–Vis spectroscopy was used to obtain the energy gap value of the synthesized samples. The spectra were recorded using a UV–Vis–NIR spectrometer (Shimadzu UV-3600, Tokyo, Japan) equipped with an integrating sphere (ISR-3100, 60 mm) and BaSO4 as a reference in the wavelength range of 200 to 800 nm with a 0.5 nm step size and a UV/Vis/NIR spectrometer (PerkinElmer Lambda 950, Hong Kong, China) equipped with a 150-nm sphere. The Kubelka–Munk function was applied to convert the diffuse reflectance into the absorbance [64]. The optical band-gap energy (Eg) was determined from the wavelength at which the tangent of the absorbance line intersected the abscissa coordinate.
Thermal decomposition of Ce(SO4)2·4H2O was studied using a Mettler Toledo TGA/DSC 1 instrument from room temperature to 900 °C under dynamic airflow (50 mL min−1). The heating rate was 10 °C min−1. Crystalohydrate with an initial mass of 5.124 mg was placed into a 150 μL alumina crucible. The blank curve was automatically subtracted. Evolved gases were transferred to a mass spectrometer (Pfeiffer Vacuum ThermoStar) via the 75 cm long heated transfer line. For Ce4+-HTiNRs, Ce3+-HTiNRs, and Ce(SO4)2·4H2O, the same experimental parameters were used for TGA/DSC measurements as previously described. In the case of Ce(NO3)3·6H2O, where we were interested in the DSC signal, a higher initial mass (19.129 mg) was used, while for Ce4+-HTiNRs and Ce3+-HTiNRs, the initial mass of the sample was around 5 mg. For these three samples, the upper temperature of measurements was 600 °C. The volume of platinum crucibles used was 150 μL.

4. Conclusions

The surface of HTiNRs dispersed in a Ce4+ aqueous solution was successfully impregnated with a thin 2–4 nm thick continuous cerium-containing layer. When Ce3+ was used as the cerium source, ion exchange was more favorable; however, only a small amount of hydronium ions exchanged with the cerium ions. Upon calcination, CeO2-TiO2 mixed oxide was formed. CeO2 nanoparticles formed on the nanoribbons’ surface. For the Ce4+ batch, an increase in CeO2 nanoparticle size with increasing calcination temperature was observed.
Modification of the composition of HTiNRs with Ce4+ and Ce3+ significantly raised the temperature for the conversion of H2Ti3O7 to TiO2-B, TiO2-B to anatase, and anatase to rutile for at least 200 °C. The nanoribbon morphology remained preserved up to 860 °C. Anatase to rutile transformation at 960 °C caused fragmentation of the nanoribbons. In the case of the Ce3+ source, at 960 °C, a smaller amount of anatase is converted to rutile. However, the cerium content was about 10 times lower than in the Ce4+ sample that calcined at the same temperature, suggesting that cerium atoms occupied positions that prevented the transformation to rutile.
For the Ce4+-batch, the EELS and XPS result showed that Ce3+ was present in the impregnated HTiNRs, and that the relative amount of Ce4+ increased with an increasing calcination temperature. The presence of cerium in calcined products caused a decrease in the band gap energy.

Supplementary Materials

The following supporting information can be downloaded at: https://www.mdpi.com/article/10.3390/molecules28155838/s1, Figure S1: SEM image of H2Ti3O7 nanoribbons (HTiNRs) used as a precursor for wet impregnation/intercalation with Ce4+ and Ce3+; Figure S2: XRD of pristine HTiNRs and products calcined at 620, 750, 860, and 960 °C in air; Figure S3: XRD patterns of HTiNRs (top), Ce4+-HTiNRs (middle), and Ce3+-HTiNRs (bottom) between 7 and 15°. Vertical lines guide the eye to easily observe the (100) peak shift to higher angles for Ce3+-HTiNRs; Figure S4: SEM image of HTiNRs impregnated with Ce4+ (Ce4+-HTiNRs); Figure S5: TGA curves for HTiNRs impregnated with Ce4+ (Ce4+-HTiNRs) and Ce3+ (Ce3+-HTiNRs) measured in air; Figure S6: TGA curve of Ce(SO4)2·4H2O measured in air and MS of H2O, SO, and SO2; Figure S7: TGA and DSC curves of Ce(NO3)3·6H2O measured in air. Figure S8: Breakdown of the nanoribbon morphology with increasing calcination temperature for Ce4+-HTiNRs calcined at a 620 °C, b 750 °C, c 860 °C, and d 960 °C. TEM images were taken at the same magnification; Figure S9: Collapse of the nanoribbon morphology with increasing calcination temperatures for HTiNRs calcined at 620 °C, 750 °C, 860 °C, and 960 °C. SEM images were taken at the same magnification with a secondary electron detector; Figure S10: CeO2 NPs size distribution for Ce4+-860 °C and Ce4+-960 °C; Figure S11: STEM–EDX elemental mapping of Ce4+-620 °C. References [65,66] are cited in the Supplementary Materials.

Author Contributions

Conceptualization, P.U.; methodology, P.U. and C.B.; validation, P.U., C.B. and R.C.K.; formal analysis, P.U., C.B., S.Š., R.C.K., M.D. and L.M.-L.; investigation, P.U., C.B., S.Š., R.C.K., M.D. and L.M.-L.; resources, P.U., C.B. and L.M.-L.; data curation, P.U. and C.B.; writing—original draft preparation, P.U. and C.B.; writing—review and editing, P.U., C.B., S.Š., M.D. and L.M.-L.; visualization, P.U. and C.B.; supervision, P.U. and C.B.; project administration, P.U., C.B. and L.M.-L.; funding acquisition, P.U. and C.B. All authors have read and agreed to the published version of the manuscript.

Funding

This research was funded by Slovenian Research and Innovation Agency, through the Research Program P1-0125. C.B. is a Research Associate of the FRS-FNRS, Belgium.

Institutional Review Board Statement

Not applicable.

Informed Consent Statement

Not applicable.

Data Availability Statement

The data presented in this study are available on request from the corresponding author.

Acknowledgments

P.U. would like to acknowledge the support provided by the Slovenian Research and Innovation Agency (research program P1-0125).

Conflicts of Interest

The authors declare no conflict of interest.

Sample Availability

Not applicable.

References

  1. Diebold, U. The surface science of titanium dioxide. Surf. Sci. Rep. 2003, 48, 53–229. [Google Scholar] [CrossRef]
  2. Parrino, F.; Francesca, R.P.; Giovanni, C.-R.; Vittorio, L.; Leonardo, P. 2—Properties of Titanium Dioxide. In Titanium Dioxide (TiO₂) and Its Applications; Francesco, P., Leonardo, P., Eds.; Elsevier: Amsterdam, The Netherlands, 2021; pp. 13–66. [Google Scholar]
  3. Rahimi, N.; Randolph, A.P.; Evan, M.G. Review of Functional Titanium Oxides. I: TiO2 and Its Modifications. Prog. Solid State Chem. 2016, 44, 86–105. [Google Scholar] [CrossRef]
  4. Wu, X. Applications of Titanium Dioxide Materials. In Titanium Dioxide; Hafiz Muhammad, A., Ed.; IntechOpen: Rijeka, Croatia, 2021; Chapter 9. [Google Scholar]
  5. Zhang, Y.; Jiang, Z.; Huang, J.; Lim, L.Y.; Li, W.; Deng, J.; Gong, D.; Tang, Y.; Lai, Y.; Chen, Z. Titanate and titania nanostructured materials for environmental and energy applications: A review. RSC Adv. 2015, 5, 79479–79510. [Google Scholar] [CrossRef]
  6. Geetha, M.; Singh, A.K.; Asokamani, R.; Gogia, A.K. Ti based biomaterials, the ultimate choice for orthopaedic implants—A review. Prog. Mater. Sci. 2009, 54, 397–425. [Google Scholar] [CrossRef]
  7. Akshaya, S.; Rowlo, P.K.; Dukle, A.; Nathanael, A.J. Antibacterial Coatings for Titanium Implants: Recent Trends and Future Perspectives. Antibiotics 2022, 11, 1719. [Google Scholar] [CrossRef]
  8. Wang, J.; Sun, H.; Huang, J.; Li, Q.; Yang, J. Band Structure Tuning of TiO2 for Enhanced Photoelectrochemical Water Splitting. J. Phys. Chem. C 2014, 118, 7451–7457. [Google Scholar] [CrossRef]
  9. Manchwari, S.; Khatter, J.; Chauhan, R.P. Modifications in structural, morphological and optical properties of TiO2 nanoparticles: Effect of pH. Chem. Pap. 2022, 76, 7545–7551. [Google Scholar] [CrossRef]
  10. Jian, Z.; Pu, Y.; Fang, J.; Ye, Z. Microemulsion Synthesis of Nanosized TiO2 Particles Doping with Rare-Earth and their Photocatalytic Activity. Photochem. Photobiol. 2010, 86, 1016–1021. [Google Scholar] [CrossRef]
  11. Wang, J.; Wang, Z.; Wang, W.; Wang, Y.; Hu, X.; Liu, J.; Gong, X.; Miao, W.; Ding, L.; Li, X.; et al. Synthesis, modification and application of titanium dioxide nanoparticles: A review. Nanoscale 2022, 14, 6709–6734. [Google Scholar] [CrossRef]
  12. Chen, X.; Mao, S.S. Titanium Dioxide Nanomaterials:  Synthesis, Properties, Modifications, and Applications. Chem. Rev. 2007, 107, 2891–2959. [Google Scholar] [CrossRef]
  13. Irshad, M.A.; Nawaz, R.; Rehman, M.Z.u.; Adrees, M.; Rizwan, M.; Ali, S.; Ahmad, S.; Tasleem, S. Synthesis, characterization and advanced sustainable applications of titanium dioxide nanoparticles: A review. Ecotoxicol. Environ. Saf. 2021, 212, 111978. [Google Scholar] [CrossRef]
  14. Zhao, Z.; Tian, J.; Sang, Y.; Cabot, A.; Liu, H. Structure, Synthesis, and Applications of TiO2 Nanobelts. Adv. Mater. 2015, 27, 2557–2582. [Google Scholar] [CrossRef] [PubMed]
  15. Rutar, M.; Rozman, N.; Pregelj, M.; Bittencourt, C.; Cerc Korošec, R.; Sever Škapin, A.; Mrzel, A.; Škapin, S.D.; Umek, P. Transformation of hydrogen titanate nanoribbons to TiO2 nanoribbons and the influence of the transformation strategies on the photocatalytic performance. Beilstein J. Nanotechnol. 2015, 6, 831–844. [Google Scholar] [CrossRef] [PubMed] [Green Version]
  16. Bavykin, D.V.; Friedrich, J.M.; Walsh, F.C. Protonated Titanates and TiO2 Nanostructured Materials: Synthesis, Properties, and Applications. Adv. Mater. 2006, 18, 2807–2824. [Google Scholar] [CrossRef]
  17. Khlyustova, A.; Sirotkin, N.; Kusova, T.; Kraev, A.; Titov, V.; Agafonov, A. Doped TiO2: The effect of doping elements on photocatalytic activity. Mater. Adv. 2020, 1, 1193–1201. [Google Scholar] [CrossRef]
  18. Fang, J.; Bao, H.; He, B.; Wang, F.; Si, D.; Jiang, Z.; Pan, Z.; Wei, S.; Huang, W. Interfacial and Surface Structures of CeO2–TiO2 Mixed Oxides. J. Phys. Chem. C 2007, 111, 19078–19085. [Google Scholar] [CrossRef]
  19. Artiglia, L.; Agnoli, S. Cerium Oxide Nanostructures on Titania: Effect of the Structure and Stoichiometry on the Reactivity Toward Ethanol Oxidation. J. Phys. Chem. C 2018, 122, 20809–20816. [Google Scholar] [CrossRef]
  20. Gionco, C.; Paganini, M.C.; Agnoli, S.; Reeder, A.E.; Giamello, E. Structural and spectroscopic characterization of CeO2–TiO2 mixed oxides. J. Mater. Chem. A 2013, 1, 10918–10926. [Google Scholar] [CrossRef]
  21. Kočí, K.; Matějová, L.; Ambrožová, N.; Šihor, M.; Troppová, I.; Čapek, L.; Kotarba, A.; Kustrowski, P.; Hospodková, A.; Obalová, L. Optimization of cerium doping of TiO2 for photocatalytic reduction of CO2 and photocatalytic decomposition of N2O. J. Sol-Gel Sci. Technol. 2016, 78, 550–558. [Google Scholar] [CrossRef]
  22. Veziroglu, S.; Röder, K.; Gronenberg, O.; Vahl, A.; Polonskyi, O.; Strunskus, T.; Rubahn, H.-G.; Kienle, L.; Adam, J.; Fiutowski, J.; et al. Cauliflower-like CeO2–TiO2 hybrid nanostructures with extreme photocatalytic and self-cleaning properties. Nanoscale 2019, 11, 9840–9844. [Google Scholar] [CrossRef] [Green Version]
  23. Luo, S.; Nguyen-Phan, T.-D.; Johnston-Peck, A.C.; Barrio, L.; Sallis, S.; Arena, D.A.; Kundu, S.; Xu, W.; Piper, L.F.J.; Stach, E.A.; et al. Hierarchical Heterogeneity at the CeOx–TiO2 Interface: Electronic and Geometric Structural Influence on the Photocatalytic Activity of Oxide on Oxide Nanostructures. J. Phys. Chem. C 2015, 119, 2669–2679. [Google Scholar] [CrossRef]
  24. Johnston-Peck, A.C.; Senanayake, S.D.; Plata, J.J.; Kundu, S.; Xu, W.; Barrio, L.; Graciani, J.; Sanz, J.F.; Navarro, R.M.; Fierro, J.L.G.; et al. Nature of the Mixed-Oxide Interface in Ceria–Titania Catalysts: Clusters, Chains, and Nanoparticles. J. Phys. Chem. C 2013, 117, 14463–14471. [Google Scholar] [CrossRef]
  25. Feist, T.P.; Davies, P.K. The soft chemical synthesis of TiO2 (B) from layered titanates. J. Solid State Chem. 1992, 101, 275–295. [Google Scholar] [CrossRef]
  26. Zhu, H.Y.; Lan, Y.; Gao, X.P.; Ringer, S.P.; Zheng, Z.F.; Song, D.Y.; Zhao, J.C. Phase Transition between Nanostructures of Titanate and Titanium Dioxides via Simple Wet-Chemical Reactions. J. Am. Chem. Soc. 2005, 127, 6730–6736. [Google Scholar] [CrossRef]
  27. Kiatkittipong, K.; Scott, J.; Amal, R. Hydrothermally Synthesized Titanate Nanostructures: Impact of Heat Treatment on Particle Characteristics and Photocatalytic Properties. ACS Appl. Mater. Interfaces 2011, 3, 3988–3996. [Google Scholar] [CrossRef]
  28. Qamar, M.; Yoon, C.R.; Oh, H.J.; Kim, D.H.; Jho, J.H.; Lee, K.S.; Lee, W.J.; Lee, H.G.; Kim, S.J. Effect of post treatments on the structure and thermal stability of titanate nanotubes. Nanotechnology 2006, 17, 5922. [Google Scholar] [CrossRef]
  29. Opra, D.P.; Gnedenkov, S.V.; Sokolov, A.A.; Podgorbunsky, A.B.; Ustinov, A.Y.; Mayorov, V.Y.; Kuryavyi, V.G.; Sinebryukhov, S.L. Vanadium-doped TiO2-B/anatase mesoporous nanotubes with improved rate and cycle performance for rechargeable lithium and sodium batteries. J. Mater. Sci. Technol. 2020, 54, 181–189. [Google Scholar] [CrossRef]
  30. Uesugi, Y.; Nagakawa, H.; Nagata, M. Highly Efficient Photocatalytic Degradation of Hydrogen Sulfide in the Gas Phase Using Anatase/TiO(2)(B) Nanotubes. ACS Omega 2022, 7, 11946–11955. [Google Scholar] [CrossRef]
  31. Liu, X.; Sun, Q.; Ng, A.M.C.; Djurišić, A.B.; Xie, M.; Liao, C.; Shih, K.; Vranješ, M.; Nedeljković, J.M.; Deng, Z. In situ synthesis of TiO2(B) nanotube/nanoparticle composite anode materials for lithium ion batteries. Nanotechnology 2015, 26, 425403. [Google Scholar] [CrossRef]
  32. Huang, J.P.; Yuan, D.D.; Zhang, H.Z.; Cao, Y.L.; Li, G.R.; Yang, H.X.; Gao, X.P. Electrochemical sodium storage of TiO2(B) nanotubes for sodium ion batteries. RSC Adv. 2013, 3, 12593–12597. [Google Scholar] [CrossRef]
  33. Liu, Z.; Andreev, Y.G.; Robert Armstrong, A.; Brutti, S.; Ren, Y.; Bruce, P.G. Nanostructured TiO2(B): The effect of size and shape on anode properties for Li-ion batteries. Prog. Nat. Sci. Mater. Int. 2013, 23, 235–244. [Google Scholar] [CrossRef] [Green Version]
  34. Zhang, W.; Zhang, Y.; Yu, L.; Wu, N.-L.; Huang, H.; Wei, M. TiO2-B nanowires via topological conversion with enhanced lithium-ion intercalation properties. J. Mater. Chem. A 2019, 7, 3842–3847. [Google Scholar] [CrossRef]
  35. Armstrong, A.R.; Armstrong, G.; Canales, J.; Bruce, P.G. TiO2-B Nanowires. Angew. Chem. Int. Ed. 2004, 43, 2286–2288. [Google Scholar] [CrossRef]
  36. Umek, P.; Bittencourt, C.; Guttmann, P.; Gloter, A.; Škapin, S.D.; Arčon, D. Mn2+ Substitutional Doping of TiO2 Nanoribbons: A Three-Step Approach. J. Phys. Chem. C 2014, 118, 21250–21257. [Google Scholar] [CrossRef]
  37. Kolen’ko, Y.V.; Kovnir, K.; Gavrilov, A.I.; Garshev, A.V.; Frantti, J.; Lebedev, O.I.; Churagulov, B.R.; van Tendeloo, G.; Yoshimura, M.J.T.j.o.p.c.B. Hydrothermal synthesis and characterization of nanorods of various titanates and titanium dioxide. J. Phys. Chem. B 2006, 110, 4030–4038. [Google Scholar] [CrossRef]
  38. Hanaor, D.A.H.; Sorrell, C.C. Review of the anatase to rutile phase transformation. J. Mater. Sci. 2011, 46, 855–874. [Google Scholar] [CrossRef] [Green Version]
  39. Xu, D.; Li, J.; Yu, Y.; Li, J. From titanates to TiO2 nanostructures: Controllable synthesis, growth mechanism, and applications. Sci. China Chem. 2012, 55, 2334–2345. [Google Scholar] [CrossRef]
  40. Wen, P.; Ishikawa, Y.; Itoh, H.; Feng, Q. Topotactic Transformation Reaction from Layered Titanate Nanosheets into Anatase Nanocrystals. J. Phys. Chem. C 2009, 113, 20275–20280. [Google Scholar] [CrossRef]
  41. Akimoto, J.; Chiba, K.; Kijima, N.; Hayakawa, H.; Hayashi, S.; Gotoh, Y.; Idemoto, Y. Soft-Chemical Synthesis and Electrochemical Property of H2Ti12O25 as a Negative Electrode Material for Rechargeable Lithium-Ion Batteries. J. Electrochem. Soc. 2011, 158, A546. [Google Scholar] [CrossRef]
  42. Sluban, M.; Umek, P. Role of Water in the Transformation of Protonated Titanate Nanoribbons to Anatase Nanoribbons. J. Phys. Chem. C 2019, 123, 23747–23757. [Google Scholar] [CrossRef]
  43. Gao, Y.; Li, Z.; Su, K.; Cheng, B. Excellent performance of TiO2(B) nanotubes in selective transesterification of DMC with phenol derivatives. Chem. Eng. J. 2016, 301, 12–18. [Google Scholar] [CrossRef]
  44. Viana, B.C.; Ferreira, O.P.; Souza Filho, A.G.; Rodrigues, C.M.; Moraes, S.G.; Mendes Filho, J.; Alves, O.L. Decorating Titanate Nanotubes with CeO2 Nanoparticles. J. Phys. Chem. C 2009, 113, 20234–20239. [Google Scholar] [CrossRef]
  45. Marques, T.M.F.; Ferreira, O.P.; da Costa, J.A.P.; Fujisawa, K.; Terrones, M.; Viana, B.C. Study of the growth of CeO2 nanoparticles onto titanate nanotubes. J. Phys. Chem. Solids 2015, 87, 213–220. [Google Scholar] [CrossRef]
  46. Gu, X.; Chen, F.; Zhao, B.; Zhang, J. Photocatalytic reactivity of Ce-intercalated layered titanate prepared with a hybrid method based on ion-exchange and thermal treatment. Superlattices Microstruct. 2011, 50, 107–118. [Google Scholar] [CrossRef]
  47. De Santis, S.; Sotgiu, G.; Porcelli, F.; Marsotto, M.; Iucci, G.; Orsini, M. A Simple Cerium Coating Strategy for Titanium Oxide Nanotubes’ Bioactivity Enhancement. Nanomaterials 2021, 11, 445. [Google Scholar] [CrossRef] [PubMed]
  48. Li, N.; Zhang, L.; Chen, Y.; Fang, M.; Zhang, J.; Wang, H. Highly Efficient, Irreversible and Selective Ion Exchange Property of Layered Titanate Nanostructures. Adv. Funct. Mater. 2012, 22, 835–841. [Google Scholar] [CrossRef]
  49. Shannon, R.D. Revised effective ionic radii and systematic studies of interatomic distances in halides and chalcogenides. Acta Crystallogr. Sect. A 1976, 32, 751–767. [Google Scholar] [CrossRef]
  50. Hsu, W.P.; Ronnquist, L.; Matijevic, E. Preparation and properties of monodispersed colloidal particles of lanthanide compounds. 2. Cerium(IV). Langmuir 1988, 4, 31–37. [Google Scholar] [CrossRef]
  51. Aubriet, F.; Gaumet, J.-J.; de Jong, W.A.; Groenewold, G.S.; Gianotto, A.K.; McIlwain, M.E.; Van Stipdonk, M.J.; Leavitt, C.M. Cerium Oxyhydroxide Clusters: Formation, Structure, and Reactivity. J. Phys. Chem. A 2009, 113, 6239–6252. [Google Scholar] [CrossRef]
  52. Ikeda-Ohno, A.; Hennig, C.; Weiss, S.; Yaita, T.; Bernhard, G. Hydrolysis of Tetravalent Cerium for a Simple Route to Nanocrystalline Cerium Dioxide: An In Situ Spectroscopic Study of Nanocrystal Evolution. Chem. A Eur. J. 2013, 19, 7348–7360. [Google Scholar] [CrossRef]
  53. Briois, V.; Williams, C.E.; Dexpert, H.; Villain, F.; Cabane, B.; Deneuve, F.; Magnier, C. Formation of solid particles by hydrolysis of cerium (IV) sulphate. J. Mater. Sci. 1993, 28, 5019–5031. [Google Scholar] [CrossRef]
  54. Spurr, R.A.; Myers, H. Quantitative Analysis of Anatase-Rutile Mixtures with an X-ray Diffractometer. Anal. Chem. 1957, 29, 760–762. [Google Scholar] [CrossRef]
  55. Krüger, P.; Sluban, M.; Umek, P.; Guttmann, P.; Bittencourt, C. Chemical Bond Modification upon Phase Transformation of TiO2 Nanoribbons Revealed by Nanoscale X-ray Linear Dichroism. J. Phys. Chem. C 2017, 121, 17038–17042. [Google Scholar] [CrossRef]
  56. López, T.; Rojas, F.; Alexander-Katz, R.; Galindo, F.; Balankin, A.; Buljan, A. Porosity, structural and fractal study of sol–gel TiO2–CeO2 mixed oxides. J. Solid State Chem. 2004, 177, 1873–1885. [Google Scholar] [CrossRef]
  57. Xu, C.; Qu, X. Cerium oxide nanoparticle: A remarkably versatile rare earth nanomaterial for biological applications. NPG Asia Mater. 2014, 6, e90. [Google Scholar] [CrossRef] [Green Version]
  58. Wang, X.; Wang, J.; Sun, Y.; Li, K.; Shang, T.; Wan, Y. Recent advances and perspectives of CeO2-based catalysts: Electronic properties and applications for energy storage and conversion. Front. Chem. 2022, 10, 1089708. [Google Scholar] [CrossRef] [PubMed]
  59. Fujishima, A.; Hashimoto, K.; Watanabe, T. TiO2 Photocatalysis: Fundamentals and Applications; BKC: Mumbai, India, 1999. [Google Scholar]
  60. Singh, M.; Taele, B.M.; Goyal, M. Modeling of size and shape dependent band gap, dielectric constant and phonon frequency of semiconductor nanosolids. Chin. J. Phys. 2021, 70, 26–36. [Google Scholar] [CrossRef]
  61. Umek, P.; Korošec, R.C.; Jančar, B.; Dominko, R.; Arčon, D. The Influence of the Reaction Temperature on the Morphology of Sodium Titanate 1D Nanostructures and Their Thermal Stability. J. Nanosci. Nanotechnol. 2007, 7, 3502–3508. [Google Scholar] [CrossRef]
  62. Fortner, J.A.; Buck, E.C. The chemistry of the light rare-earth elements as determined by electron energy loss spectroscopy. Appl. Phys. Lett. 1996, 68, 3817–3819. [Google Scholar] [CrossRef]
  63. Song, K.; Schmid, H.; Srot, V.; Gilardi, E.; Gregori, G.; Du, K.; Maier, J.; van Aken, P.A. Cerium reduction at the interface between ceria and yttria-stabilised zirconia and implications for interfacial oxygen non-stoichiometry. APL Mater. 2014, 2, 032104. [Google Scholar] [CrossRef]
  64. Kirsch, H. Physics of Minerals and Inorganic Materials. Von, A.S. Marfunin. Springer-Verlag Berlin–Heidelberg–New York 1979, 340 S. mit 138 Abb. u. 50 Tab., XII, Ln. 98,– DM. Mater. Corros. 1980, 31, 155–156. [Google Scholar] [CrossRef]
  65. Casari, B.M.; Langer, V. Two Ce(SO4)2⋅4H2O polymorphs: Crystal structure and thermal behavior. J. Solid State Chem. 2007, 180, 1616–1622. [Google Scholar] [CrossRef]
  66. Strydom, C.A.; Van Vuuren, C.P.J. The thermal decomposition of cerium (III) nitrate. J. Therm. Anal. 1987, 32, 157–160. [Google Scholar] [CrossRef]
Figure 1. Impact of cerium oxidation state in the starting cerium source on the transformation temperature of H2Ti3O7 nanoribbons. XRD patterns of the precursor materials Ce4+-HTiNRs (a) and Ce3+-HTiNRs (b), and products obtained by calcination in air at 620, 750, 860, and 960 °C.
Molecules 28 05838 g001
Figure 2. HAADF–STEM image of an individual Ce4+-HTiNRs with corresponding elemental maps of Ti, O, Ce (EELS), and an RGB image.
Molecules 28 05838 g002
Figure 3. Evolution of CeO2 nanoparticles on the surface of TiO2 nanoribbons and fragmentation of nanoribbon morphology with increasing calcination temperatures for Ce4+-HTiNRs (top) and Ce3+-HTiNRs (bottom), which were calcined at 620 °C, 750 °C, 860 °C, and 960 °C. SEM images using a back-scattered electron detector were taken at the same magnification. Areas with CeO2 nanoparticles in the images appear brighter.
Molecules 28 05838 g003
Figure 4. STEM–EELS analysis of sample Ce4+-620 °C. (a) HAADF image with corresponding elemental maps of O, Ti, and Ce. (b) EEL spectra recorded at the nanoribbon surface (red spot in the HAADF image) and a particle attached to the surface of the nanoribbon (black spot in the HAADF image).
Molecules 28 05838 g004
Figure 5. (a) Comparison of X-ray photoelectron spectra recorded in the Ce 3d core level region for Ce4+-HTiNRs and products obtained after calcination at 620 °C, 750 °C, 860 °C, and 960 °C. (b) Result of the peak fitting in the Ce 3d core level X-ray photoelectron spectrum of the sample calcined at 960 °C; green peaks refer to Ce3+ and blue ones to Ce4+. (c) Spectrum of Ce3+-960 °C in the Ce 3d core level region.
Molecules 28 05838 g005
Table 1. Sample labels, transformation conditions, phase composition, cerium content, oxidation state, and band gap values.
Sample
Labels
PrecursorTransformation EnvironmentT
(°C)
Phase CompositionCe CONTENT a
(wt.%)
Ce
Oxidation State b
Band Gap
(eV)
Ce4+-HTiNRsH2Ti3O7 NRsDI water c100H2Ti3O73.4+3, +4 (80%)3.56
Ce4+-620 °CCe4+-HTiNRsstatic air620TiO2-B3.9+3, +4 (75%)3.30
Ce4+-750 °CCe4+-HTiNRsstatic air750TiO2-B, anatase3.9+3, +4 (70%)3.17
Ce4+-860 °CCe4+-HTiNRsstatic air860anatase3.8+3, +4 (50%)3.27
Ce4+-960 °CCe4+-HTiNRsstatic air960anatase, rutile3.7+3, +4 (50%)3.19
Ce3+-HTiNRsH2Ti3O7 NRsDI water b100H2Ti3O70.2+3, +43.53
Ce3+-620 °CCe3+-HTiNRsstatic air620TiO2-B, anatase0.3+3, +43.40
Ce3+-750 °CCe3+-HTiNRsstatic air750anatase, traces of TiO2-B0.3+3, +43.36
Ce3+-860 °CCe3+-HTiNRsstatic air860anatase0.3+3, +43.34
Ce3+-960 °CCe3+-HTiNRsstatic air960anatase, rutile0.4+3, +43.31
HTiNRs///H2Ti3O7//3.46
d p-620 °CH2Ti3O7 NRsstatic air620anatase, traces of TiO2-B//3.31
p-750 °CH2Ti3O7 NRsstatic air750anatase//3.28
p-860 °CH2Ti3O7 NRsstatic air860anatase//3.29
p-960 °CH2Ti3O7 NRsstatic air960anatase, rutile//3.01
a cerium content was determined by EDXS–SEM; b cerium oxidation state was determined using XPS (for Ce3+-modified nanoribbons; due to the small relative amount of cerium, it was impossible to evaluate the ratio between Ce3+/Ce4+ oxidation states) and c deionized water. d p, pristine is used to label samples not doped with cerium.
Table 2. The wt.% of rutile in the samples calcined at 960 °C.
Samplewt.% Rutile
Ce4+-960 °C31
Ce3+-960 °C17
p-960 °C60
Disclaimer/Publisher’s Note: The statements, opinions and data contained in all publications are solely those of the individual author(s) and contributor(s) and not of MDPI and/or the editor(s). MDPI and/or the editor(s) disclaim responsibility for any injury to people or property resulting from any ideas, methods, instructions or products referred to in the content.

