
Anti-Obesity Effect and Mechanism of Chitooligosaccharides Were Revealed Based on Lipidomics in Diet-Induced Obese Mice


Abstract
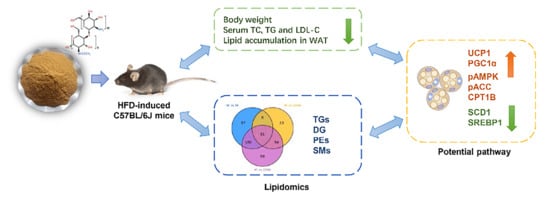
:
1. Introduction
2. Results
2.1. COSM Reduced Diet-Induced Weight Gain and Fat Pad Weight
2.2. COSM Regulated Glycolipid Metabolism Homeostasis
2.2.1. Effect of COSM Supplementation on Glycometabolism in Obese Mice
2.2.2. Effect of COSM Supplementation on Lipid Metabolism in Obese Mice
2.3. COSM Suppressed Adipocyte Hypertrophy and Inflammation in Adipose Tissue
2.4. Screening for Biomarkers of Subcutaneous Fat Metabolism
2.5. Exploration of the Mechanism by which COSM Treatment Improves Lipid Metabolism in sWAT
3. Discussion
4. Materials and Methods
4.1. Materials
4.2. Animal Experimental Design and Sample Collection
4.3. Oral Glucose Tolerance Test (OGTT)
4.4. Biochemical Analysis
4.5. Adipose Pathological Analysis
4.6. Lipid Profiling
4.7. Western Blot Assay
4.8. Statistical Analysis
5. Conclusions
Supplementary Materials
Author Contributions
Funding
Institutional Review Board Statement
Informed Consent Statement
Data Availability Statement
Conflicts of Interest
Sample Availability
Appendix A

| Item | Standard | Result |
|---|---|---|
| Deacetylation (%) | 285 | 90.2 |
| Viscosity (cps, 20 °C) | <15 | 6.6 |
| M.W (Da) | <5000 | 2600 |
| Moisture (%) | ≤10 | 5.3 |
| Ash | ≤1.0 | 0.8 |
| Insoluble (%) | ≤1.0 | 0.1 |
| Pb (mg/kg) | ≤2.0 | 0.10 |
| As (mg/kg) | ≤0.5 | <0.025 |
| Total plate count | <1000 cuf/g | <100 |
| Colibacillus (cuf/100 g) | Negative | <30 |
| Mould and yeast (cuf/g) | <25 | <10 |
| Particle size (mesh) | >100 mesh | 100 mesh |
| Class Description | Ingredients | Grams |
|---|---|---|
| Protein | Casein, Lactic, 30 Mesh | 200.00 g |
| Protein | Cystine, L | 3.00 g |
| Carbohydrate | Lodex 10 | 125.00 g |
| Carbohydrate | Sucrose, Fine Granulated | 72.80 g |
| Fiber | Solka Floc, FCC200 | 50.00 g |
| Fat | Lard | 245.00 g |
| Fat | Soybean Oil, USP | 25.00 g |
| Mineral | S10026B | 50.00 g |
| Vitamin | Choline Bitartrate | 2.00 g |
| Vitamin | V10001C | 1.00 g |
| Dye | Dye, Blue FD&C #1, Alum. Lake 35–42% | 0.05 g |
References
- Ogden, C.L.; Fryar, C.D.; Martin, C.B.; Freedman, D.S.; Carroll, M.D.; Gu, Q.; Hales, C.M. Trends in Obesity Prevalence by Race and Hispanic Origin-1999–2000 to 2017–2018. JAMA 2020, 324, 1208–1210. [Google Scholar] [CrossRef] [PubMed]
- Ye, Z.; Liu, G.; Guo, J.; Su, Z. Hypothalamic endoplasmic reticulum stress as a key mediator of obesity-induced leptin resistance. Obes. Rev. 2018, 19, 770–785. [Google Scholar] [CrossRef] [PubMed]
- Ruze, R.; Chen, Y.; Xu, R.; Song, J.; Yin, X.; Wang, C.; Xu, Q. Obesity, diabetes mellitus, and pancreatic carcinogenesis: Correlations, prevention, and diagnostic implications. Biochim. Biophys. Acta Rev. Cancer 2023, 1878, 188844. [Google Scholar] [CrossRef] [PubMed]
- Long, H.; Cao, R.; Yin, H.; Yu, F.; Guo, A. Associations between obesity, diabetes mellitus, and cardiovascular disease with progression states of knee osteoarthritis (KOA). Aging Clin. Exp. Res. 2023, 35, 333–340. [Google Scholar] [CrossRef]
- Cypess, A.M. Reassessing Human Adipose Tissue. N. Engl. J. Med. 2022, 386, 768–779. [Google Scholar] [CrossRef]
- Walther, T.C.; Kim, S.; Arlt, H.; Voth, G.A.; Farese, R.V., Jr. Structure and function of lipid droplet assembly complexes. Curr. Opin. Struct. Biol. 2023, 80, 102606. [Google Scholar] [CrossRef]
- Li, L.; Tong, M.; Fu, Y.; Chen, F.; Zhang, S.; Chen, H.; Ma, X.; Li, D.; Liu, X.; Zhong, Q. Lipids and membrane-associated proteins in autophagy. Protein Cell 2021, 12, 520–544. [Google Scholar] [CrossRef]
- Grzybek, M.; Palladini, A.; Alexaki, V.I.; Surma, M.A.; Simons, K.; Chavakis, T.; Klose, C.; Coskun, U. Comprehensive and quantitative analysis of white and brown adipose tissue by shotgun lipidomics. Mol. Metab. 2019, 22, 12–20. [Google Scholar] [CrossRef]
- Leiria, L.O.; Tseng, Y.H. Lipidomics of brown and white adipose tissue: Implications for energy metabolism. Biochim. Biophys. Acta Mol. Cell Biol. Lipids 2020, 1865, 158788. [Google Scholar] [CrossRef]
- Wen, J.J.; Gao, H.; Hu, J.L.; Nie, Q.X.; Chen, H.H.; Xiong, T.; Nie, S.P.; Xie, M.Y. Polysaccharides from fermented Momordica charantia ameliorate obesity in high-fat induced obese rats. Food Funct. 2019, 10, 448–457. [Google Scholar] [CrossRef]
- Yu, D.; Feng, J.; You, H.; Zhou, S.; Bai, Y.; He, J.; Cao, H.; Che, Q.; Guo, J.; Su, Z. The Microstructure, Antibacterial and Antitumor Activities of Chitosan Oligosaccharides and Derivatives. Mar. Drugs 2022, 20, 69. [Google Scholar] [CrossRef]
- Kunanusornchai, W.; Witoonpanich, B.; Tawonsawatruk, T.; Pichyangkura, R.; Chatsudthipong, V.; Muanprasat, C. Chitosan oligosaccharide suppresses synovial inflammation via AMPK activation: An in vitro and in vivo study. Pharmacol. Res. 2016, 113, 458–467. [Google Scholar] [CrossRef]
- Zhou, J.; Wen, B.; Xie, H.; Zhang, C.; Bai, Y.; Cao, H.; Che, Q.; Guo, J.; Su, Z. Advances in the preparation and assessment of the biological activities of chitosan oligosaccharides with different structural characteristics. Food Funct. 2021, 12, 926–951. [Google Scholar] [CrossRef]
- He, N.; Wang, S.; Lv, Z.; Zhao, W.; Li, S. Low molecular weight chitosan oligosaccharides (LMW-COSs) prevent obesity-related metabolic abnormalities in association with the modification of gut microbiota in high-fat diet (HFD)-fed mice. Food Funct. 2020, 11, 9947–9959. [Google Scholar] [CrossRef]
- Zhao, Q.; Yin, L.; Zhang, L.; Jiang, D.; Liu, L.; Ji, H. Chitoheptaose Promotes Heart Rehabilitation in a Rat Myocarditis Model by Improving Antioxidant, Anti-Inflammatory, and Antiapoptotic Properties. Oxid. Med. Cell. Longev. 2020, 2020, 2394704. [Google Scholar] [CrossRef] [Green Version]
- Mateos-Aparicio, I.; Mengibar, M.; Heras, A. Effect of chito-oligosaccharides over human faecal microbiota during fermentation in batch cultures. Carbohydr. Polym. 2016, 137, 617–624. [Google Scholar] [CrossRef]
- Mattaveewong, T.; Wongkrasant, P.; Chanchai, S.; Pichyangkura, R.; Chatsudthipong, V.; Muanprasat, C. Chitosan oligosaccharide suppresses tumor progression in a mouse model of colitis-associated colorectal cancer through AMPK activation and suppression of NF-kappaB and mTOR signaling. Carbohydr. Polym. 2016, 145, 30–36. [Google Scholar] [CrossRef]
- Deng, X.; Ye, Z.; Cao, H.; Bai, Y.; Che, Q.; Guo, J.; Su, Z. Chitosan oligosaccharide ameliorated obesity by reducing endoplasmic reticulum stress in diet-induced obese rats. Food Funct. 2020, 11, 6285–6296. [Google Scholar] [CrossRef]
- Naveed, M.; Phil, L.; Sohail, M.; Hasnat, M.; Baig, M.; Ihsan, A.U.; Shumzaid, M.; Kakar, M.U.; Mehmood Khan, T.; Akabar, M.D.; et al. Chitosan oligosaccharide (COS): An overview. Int. J. Biol. Macromol. 2019, 129, 827–843. [Google Scholar] [CrossRef]
- Xiang, J.; Wang, J.; Xie, H.; Liu, Y.; Bai, Y.; Che, Q.; Cao, H.; Huang, G.; Guo, J.; Su, Z. Protective effect and mechanism of chitooligosaccharides on acetaminophen-induced liver injury. Food Funct. 2021, 12, 9979–9993. [Google Scholar] [CrossRef]
- Jin, Q.; Yu, H.; Wang, X.; Li, K.; Li, P. Effect of the molecular weight of water-soluble chitosan on its fat-/cholesterol-binding capacities and inhibitory activities to pancreatic lipase. PeerJ 2017, 5, e3279. [Google Scholar] [CrossRef] [PubMed] [Green Version]
- Malone, J.I.; Hansen, B.C. Does obesity cause type 2 diabetes mellitus (T2DM)? Or is it the opposite? Pediatr. Diabetes 2019, 20, 5–9. [Google Scholar] [CrossRef] [PubMed] [Green Version]
- Klueh, U.; Liu, Z.; Cho, B. Continuous glucose monitoring in normal mice and mice with prediabetes and diabetes. Diabetes Technol. Ther. 2006, 8, 402–412. [Google Scholar] [CrossRef] [PubMed]
- Ibrahim, M.M. Subcutaneous and visceral adipose tissue: Structural and functional differences. Obes. Rev. 2010, 11, 11–18. [Google Scholar] [CrossRef] [PubMed]
- Althaher, A.R. An Overview of Hormone-Sensitive Lipase (HSL). Sci. World J. 2022, 2022, 1964684. [Google Scholar] [CrossRef] [PubMed]
- Lan, Y.L.; Lou, J.C.; Lyu, W.; Zhang, B. Update on the synergistic effect of HSL and insulin in the treatment of metabolic disorders. Ther. Adv. Endocrinol. Metab. 2019, 10, 2042018819877300. [Google Scholar] [CrossRef]
- Schwartz, M.W.; Seeley, R.J.; Zeltser, L.M.; Drewnowski, A.; Ravussin, E.; Redman, L.M.; Leibel, R.L. Obesity Pathogenesis: An Endocrine Society Scientific Statement. Endocr. Rev. 2017, 38, 267–296. [Google Scholar] [CrossRef] [Green Version]
- Xu, M.; Xue, H.; Kong, L.; Lin, L.; Zheng, G. Smilax china L. Polyphenols Improves Insulin Resistance and Obesity in High-fat Diet-induced Mice Through IRS/AKT-AMPK and NF-kappaB Signaling Pathways. Plant Foods Hum. Nutr. 2023. [Google Scholar] [CrossRef]
- Chen, S.; Liu, X.; Peng, C.; Tan, C.; Sun, H.; Liu, H.; Zhang, Y.; Wu, P.; Cui, C.; Liu, C.; et al. The phytochemical hyperforin triggers thermogenesis in adipose tissue via a Dlat-AMPK signaling axis to curb obesity. Cell Metab. 2021, 33, 565–580. [Google Scholar] [CrossRef]
- Nielsen, T.S.; Jessen, N.; Jorgensen, J.O.; Moller, N.; Lund, S. Dissecting adipose tissue lipolysis: Molecular regulation and implications for metabolic disease. J. Mol. Endocrinol. 2014, 52, R199–R222. [Google Scholar] [CrossRef] [Green Version]
- Lynes, M.D.; Tseng, Y.H. Deciphering adipose tissue heterogeneity. Ann. N. Y. Acad. Sci. 2018, 1411, 5–20. [Google Scholar] [CrossRef]
- Jové, M.; Moreno-Navarrete, J.M.; Pamplona, R.; Ricart, W.; Portero-Otín, M.; Fernández-Real, J.M. Human omental and subcutaneous adipose tissue exhibit specific lipidomic signatures. FASEB J. 2014, 28, 1071–1081. [Google Scholar] [CrossRef] [Green Version]
- Zhou, H.; Zhang, J.; Yan, Z.; Qu, M.; Zhang, G.; Han, J.; Wang, F.; Sun, K.; Wang, L.; Yang, X. DECR1 directly activates HSL to promote lipolysis in cervical cancer cells. Biochim. Biophys. Acta Mol. Cell Biol. Lipids 2022, 1867, 159090. [Google Scholar] [CrossRef]
- Presa, N.; Dominguez-Herrera, A.; van der Veen, J.N.; Vance, D.E.; Gomez-Munoz, A. Implication of phosphatidylethanolamine N-methyltransferase in adipocyte differentiation. Biochim. Biophys. Acta Mol. Basis Dis. 2020, 1866, 165853. [Google Scholar] [CrossRef]
- Li, J.; Wu, K.; Zhong, Y.; Kuang, J.; Huang, N.; Guo, X.; Du, H.; Guo, C.; Li, R.; Zhu, X.; et al. Si-Ni-SAN ameliorates obesity through AKT/AMPK/HSL pathway-mediated lipolysis: Network pharmacology and experimental validation. J. Ethnopharmacol. 2023, 302, 115892. [Google Scholar] [CrossRef]
- Ma, C.; Li, G.; He, Y.; Xu, B.; Mi, X.; Wang, H.; Wang, Z. Pronuciferine and nuciferine inhibit lipogenesis in 3T3-L1 adipocytes by activating the AMPK signaling pathway. Life Sci. 2015, 136, 120–125. [Google Scholar] [CrossRef]
- Yao, X.; Liu, L.; Shao, W.; Bai, M.; Ding, X.; Wang, G.; Wang, S.; Zheng, L.; Sun, Y.; Wang, G.; et al. Tectorigenin targets PKACalpha to promote GLUT4 expression in skeletal muscle and improve insulin resistance in vitro and in vivo. Int. J. Biol. Sci. 2023, 19, 1579–1596. [Google Scholar] [CrossRef]
- Chang, Y.C.; Chan, M.H.; Yang, Y.F.; Li, C.H.; Hsiao, M. Glucose transporter 4: Insulin response mastermind, glycolysis catalyst and treatment direction for cancer progression. Cancer Lett. 2023, 563, 216179. [Google Scholar] [CrossRef]
- Xu, Z.; You, W.; Zhou, Y.; Chen, W.; Wang, Y.; Shan, T. Cold-induced lipid dynamics and transcriptional programs in white adipose tissue. BMC Biol. 2019, 17, 74. [Google Scholar] [CrossRef] [Green Version]
- Zhang, Z.; Zhang, H.; Li, B.; Meng, X.; Wang, J.; Zhang, Y.; Yao, S.; Ma, Q.; Jin, L.; Yang, J.; et al. Berberine activates thermogenesis in white and brown adipose tissue. Nat. Commun. 2014, 5, 5493. [Google Scholar] [CrossRef] [Green Version]
- Herzig, S.; Shaw, R.J. AMPK: Guardian of metabolism and mitochondrial homeostasis. Nat. Rev. Mol. Cell Biol. 2018, 19, 121–135. [Google Scholar] [CrossRef] [PubMed] [Green Version]
- Zingg, J.M.; Hasan, S.T.; Meydani, M. Molecular mechanisms of hypolipidemic effects of curcumin. Biofactors 2013, 39, 101–121. [Google Scholar] [CrossRef] [PubMed]
- Ntambi, J.M. Regulation of stearoyl-CoA desaturase by polyunsaturated fatty acids and cholesterol. J. Lipid Res. 1999, 40, 1549–1558. [Google Scholar] [CrossRef] [PubMed]
- Swinnen, J.V.; Ulrix, W.; Heyns, W.; Verhoeven, G. Coordinate regulation of lipogenic gene expression by androgens: Evidence for a cascade mechanism involving sterol regulatory element binding proteins. Proc. Natl. Acad. Sci. USA 1997, 94, 12975–12980. [Google Scholar] [CrossRef]
- Herms, A.; Bosch, M.; Reddy, B.J.; Schieber, N.L.; Fajardo, A.; Ruperez, C.; Fernandez-Vidal, A.; Ferguson, C.; Rentero, C.; Tebar, F.; et al. AMPK activation promotes lipid droplet dispersion on detyrosinated microtubules to increase mitochondrial fatty acid oxidation. Nat. Commun. 2015, 6, 7176. [Google Scholar] [CrossRef] [Green Version]
- Xu, H.; Lyu, X.; Guo, X.; Yang, H.; Duan, L.; Zhu, H.; Pan, H.; Gong, F.; Wang, L. Distinct AMPK-Mediated FAS/HSL Pathway Is Implicated in the Alleviating Effect of Nuciferine on Obesity and Hepatic Steatosis in HFD-Fed Mice. Nutrients 2022, 14, 1898. [Google Scholar] [CrossRef]
- Galbraith, L.; Leung, H.Y.; Ahmad, I. Lipid pathway deregulation in advanced prostate cancer. Pharmacol. Res. 2018, 131, 177–184. [Google Scholar] [CrossRef] [Green Version]
- You, H.; Tan, Y.; Yu, D.; Qiu, S.; Bai, Y.; He, J.; Cao, H.; Che, Q.; Guo, J.; Su, Z. The Therapeutic Effect of SCFA-Mediated Regulation of the Intestinal Environment on Obesity. Front. Nutr. 2022, 9, 886902. [Google Scholar] [CrossRef]
- Hu, L.; Zhang, Q.; Bai, Y.; Hu, G.; Li, J. Triglyceride-Glucose Index Correlate With Telomere Length in Healthy Adults From the National Health and Nutrition Examination Survey. Front. Endocrinol. 2022, 13, 844073. [Google Scholar] [CrossRef]
- Rivera-Paredez, B.; Torres-Ibarra, L.; Gonzalez-Morales, R.; Barrientos-Gutierrez, T.; Hernandez-Lopez, R.; Ramirez, P.; Leon-Maldonado, L.; Velazquez-Cruz, R.; Denova-Gutierrez, E.; Salmeron, J. Cumulative soft drink consumption is associated with insulin resistance in Mexican adults. Am. J. Clin. Nutr. 2020, 112, 661–668. [Google Scholar] [CrossRef]
- Gaggini, M.; Carli, F.; Rosso, C.; Younes, R.; D’Aurizio, R.; Bugianesi, E.; Gastaldelli, A. Altered Metabolic Profile and Adipocyte Insulin Resistance Mark Severe Liver Fibrosis in Patients with Chronic Liver Disease. Int. J. Mol. Sci. 2019, 20, 6333. [Google Scholar] [CrossRef] [Green Version]
- Meek, S.E.; Nair, K.S.; Jensen, M.D. Insulin regulation of regional free fatty acid metabolism. Diabetes 1999, 48, 10–14. [Google Scholar] [CrossRef]
- Hou, B.; Zhao, Y.; He, P.; Xu, C.; Ma, P.; Lam, S.M.; Li, B.; Gil, V.; Shui, G.; Qiang, G.; et al. Targeted lipidomics and transcriptomics profiling reveal the heterogeneity of visceral and subcutaneous white adipose tissue. Life Sci. 2020, 245, 117352. [Google Scholar] [CrossRef]
- Fic, A.; Mlakar, S.J.; Juvan, P.; Mlakar, V.; Marc, J.; Dolenc, M.S.; Broberg, K.; Masic, L.P. Genome-wide gene expression profiling of low-dose, long-term exposure of human osteosarcoma cells to bisphenol A and its analogs bisphenols AF and S. Toxicol. In Vitro 2015, 29, 1060–1069. [Google Scholar] [CrossRef]
- Feng, J.; Liu, Y.; Chen, J.; Bai, Y.; He, J.; Cao, H.; Che, Q.; Guo, J.; Su, Z. Marine Chitooligosaccharide Alters Intestinal Flora Structure and Regulates Hepatic Inflammatory Response to Influence Nonalcoholic Fatty Liver Disease. Mar. Drugs 2022, 20, 383. [Google Scholar] [CrossRef]
- Fraga, C.G.; Clowers, B.H.; Moore, R.J.; Zink, E.M. Signature-Discovery Approach for Sample Matching of a Nerve-Agent Precursor Using Liquid Chromatography−Mass Spectrometry, XCMS, and Chemometrics. Anal. Chem. 2010, 82, 4165–4173. [Google Scholar] [CrossRef]
- Want, E.J.; Masson, P.; Michopoulos, F.; Wilson, I.D.; Theodoridis, G.; Plumb, R.S.; Shockcor, J.; Loftus, N.; Holmes, E.; Nicholson, J.K. Global metabolic profiling of animal and human tissues via UPLC-MS. Nat. Protoc. 2013, 8, 17–32. [Google Scholar] [CrossRef]


| Group | Weight before Modelling (g) | Weight after Modelling (g) | Weight after Administration (g) | Obesity Index |
|---|---|---|---|---|
| NF | 13.2 ± 1.3 | 25.2 ± 4.9 | 27.3 ± 4.0 *** | - |
| HF | 13.1 ± 1.2 | 34.0 ± 8.6 ## | 45.9 ± 5.7 | 34.9% |
| Orlistat | 14.1 ± 1.4 | 33.1 ± 3.3 ## | 39.0 ± 6.3 ** | 31.3% |
| COSM | 13.7 ± 2.1 | 32.6 ± 3.8 ## | 38.9 ± 7.6 ** | 29.4% |
| No. | Marker | Class | Index | Metabolic Pathway |
|---|---|---|---|---|
| 1 | DG (16:1/20:4/0:0) | Diglycerides | LIPID-P-0203 | Glycerolipid metabolism |
| 2 | PE (18:3/16:0) | Phosphatidylethanolamines | LIPID-P-0600 | Glycerophospholipid metabolism |
| 3 | PE (16:1/20:4) | Phosphatidylethanolamines | LIPID-P-0620 | Glycerophospholipid metabolism |
| 4 | SM (d18:1/26:1) | Sphingomyelins | LIPID-P-0740 | Sphingolipid metabolism |
| 5 | TG (12:0/12:0/18:2) | Triglycerides | LIPID-P-0833 | Sphingolipid signalling pathway |
| 6 | TG (14:0/16:1/18:3) | Triglycerides | LIPID-P-0973 | cAMP signalling pathway |
| 7 | TG (14:1/14:1/20:2) | Triglycerides | LIPID-P-0974 | cAMP signalling pathway |
| 8 | TG (14:1/14:1/22:3) | Triglycerides | LIPID-P-1033 | cAMP signalling pathway |
| 9 | TG (14:0/18:2/18:3) | Triglycerides | LIPID-P-1034 | cAMP signalling pathway |
| 10 | TG (14:0/18:3/18:3) | Triglycerides | LIPID-P-1081 | Fat digestion and absorption |
| 11 | TG (14:0/18:2/18:4) | Triglycerides | LIPID-P-1082 | Insulin resistance |
| 12 | TG (14:0/18:3/20:4) | Triglycerides | LIPID-P-1119 | Cholesterol metabolism |
| 13 | TG (16:1/16:1/20:5) | Triglycerides | LIPID-P-1120 | Vitamin digestion and absorption |
| 14 | TG (14:0/18:2/20:5) | Triglycerides | LIPID-P-1121 | Thermogenic |
| 15 | TG (14:0/18:4/20:3) | Triglycerides | LIPID-P-1122 | Cholesterol metabolism |
| 16 | TG (18:1/18:3/18:3) | Triglycerides | LIPID-P-1126 | Cholesterol metabolism |
| 17 | TG (18:2/18:3/18:3) | Triglycerides | LIPID-P-1152 | cAMP signalling pathway |
| 18 | TG (14:0/20:3/20:5) | Triglycerides | LIPID-P-1155 | cAMP signalling pathway |
| 19 | TG (16:1/16:1/22:6) | Triglycerides | LIPID-P-1156 | cAMP signalling pathway |
| 20 | TG (14:0/18:2/22:6) | Triglycerides | LIPID-P-1158 | Thermogenic |
| 21 | TG (14:0/20:4/22:4) | Triglycerides | LIPID-P-1160 | Cholesterol metabolism |
| 22 | TG (18:2/18:3/20:3) | Triglycerides | LIPID-P-1164 | Cholesterol metabolism |
| 23 | TG (18:3/18:3/18:3) | Triglycerides | LIPID-P-1175 | Glycerolipid metabolism |
| 24 | TG (14:0/20:5/22:4) | Triglycerides | LIPID-P-1178 | Glycerolipid metabolism |
| 25 | TG (18:2/18:3/20:4) | Triglycerides | LIPID-P-1179 | Glycerolipid metabolism |
| 26 | TG (16:1/20:4/20:4) | Triglycerides | LIPID-P-1180 | Sphingolipid signalling pathway |
| 27 | TG (14:0/20:3/22:6) | Triglycerides | LIPID-P-1182 | Glycerolipid metabolism |
| 28 | TG (18:2/18:3/20:5) | Triglycerides | LIPID-P-1191 | Insulin resistance |
| 29 | TG (14:0/20:4/22:6) | Triglycerides | LIPID-P-1193 | Insulin resistance |
| 30 | TG (18:2/18:3/22:5) | Triglycerides | LIPID-P-1195 | Cholesterol metabolism |
| 31 | TG (16:0/20:4/22:6) | Triglycerides | LIPID-P-1196 | Cholesterol metabolism |
Disclaimer/Publisher’s Note: The statements, opinions and data contained in all publications are solely those of the individual author(s) and contributor(s) and not of MDPI and/or the editor(s). MDPI and/or the editor(s) disclaim responsibility for any injury to people or property resulting from any ideas, methods, instructions or products referred to in the content. |
© 2023 by the authors. Licensee MDPI, Basel, Switzerland. This article is an open access article distributed under the terms and conditions of the Creative Commons Attribution (CC BY) license (https://creativecommons.org/licenses/by/4.0/).
Share and Cite
Zhou, M.; Huang, J.; Zhou, J.; Zhi, C.; Bai, Y.; Che, Q.; Cao, H.; Guo, J.; Su, Z. Anti-Obesity Effect and Mechanism of Chitooligosaccharides Were Revealed Based on Lipidomics in Diet-Induced Obese Mice. Molecules 2023, 28, 5595. https://doi.org/10.3390/molecules28145595
Zhou M, Huang J, Zhou J, Zhi C, Bai Y, Che Q, Cao H, Guo J, Su Z. Anti-Obesity Effect and Mechanism of Chitooligosaccharides Were Revealed Based on Lipidomics in Diet-Induced Obese Mice. Molecules. 2023; 28(14):5595. https://doi.org/10.3390/molecules28145595
Chicago/Turabian StyleZhou, Minchuan, Jingqing Huang, Jingwen Zhou, Cuiting Zhi, Yan Bai, Qishi Che, Hua Cao, Jiao Guo, and Zhengquan Su. 2023. "Anti-Obesity Effect and Mechanism of Chitooligosaccharides Were Revealed Based on Lipidomics in Diet-Induced Obese Mice" Molecules 28, no. 14: 5595. https://doi.org/10.3390/molecules28145595