

Ultra-High-Performance Liquid Chromatography Quadrupole Time-of-Flight Mass Spectrometry for Simultaneous Pesticide Analysis and Method Validation in Sweet Pepper

 , , ,
, , ,
Abstract
:
1. Introduction
2. Results and Discussion
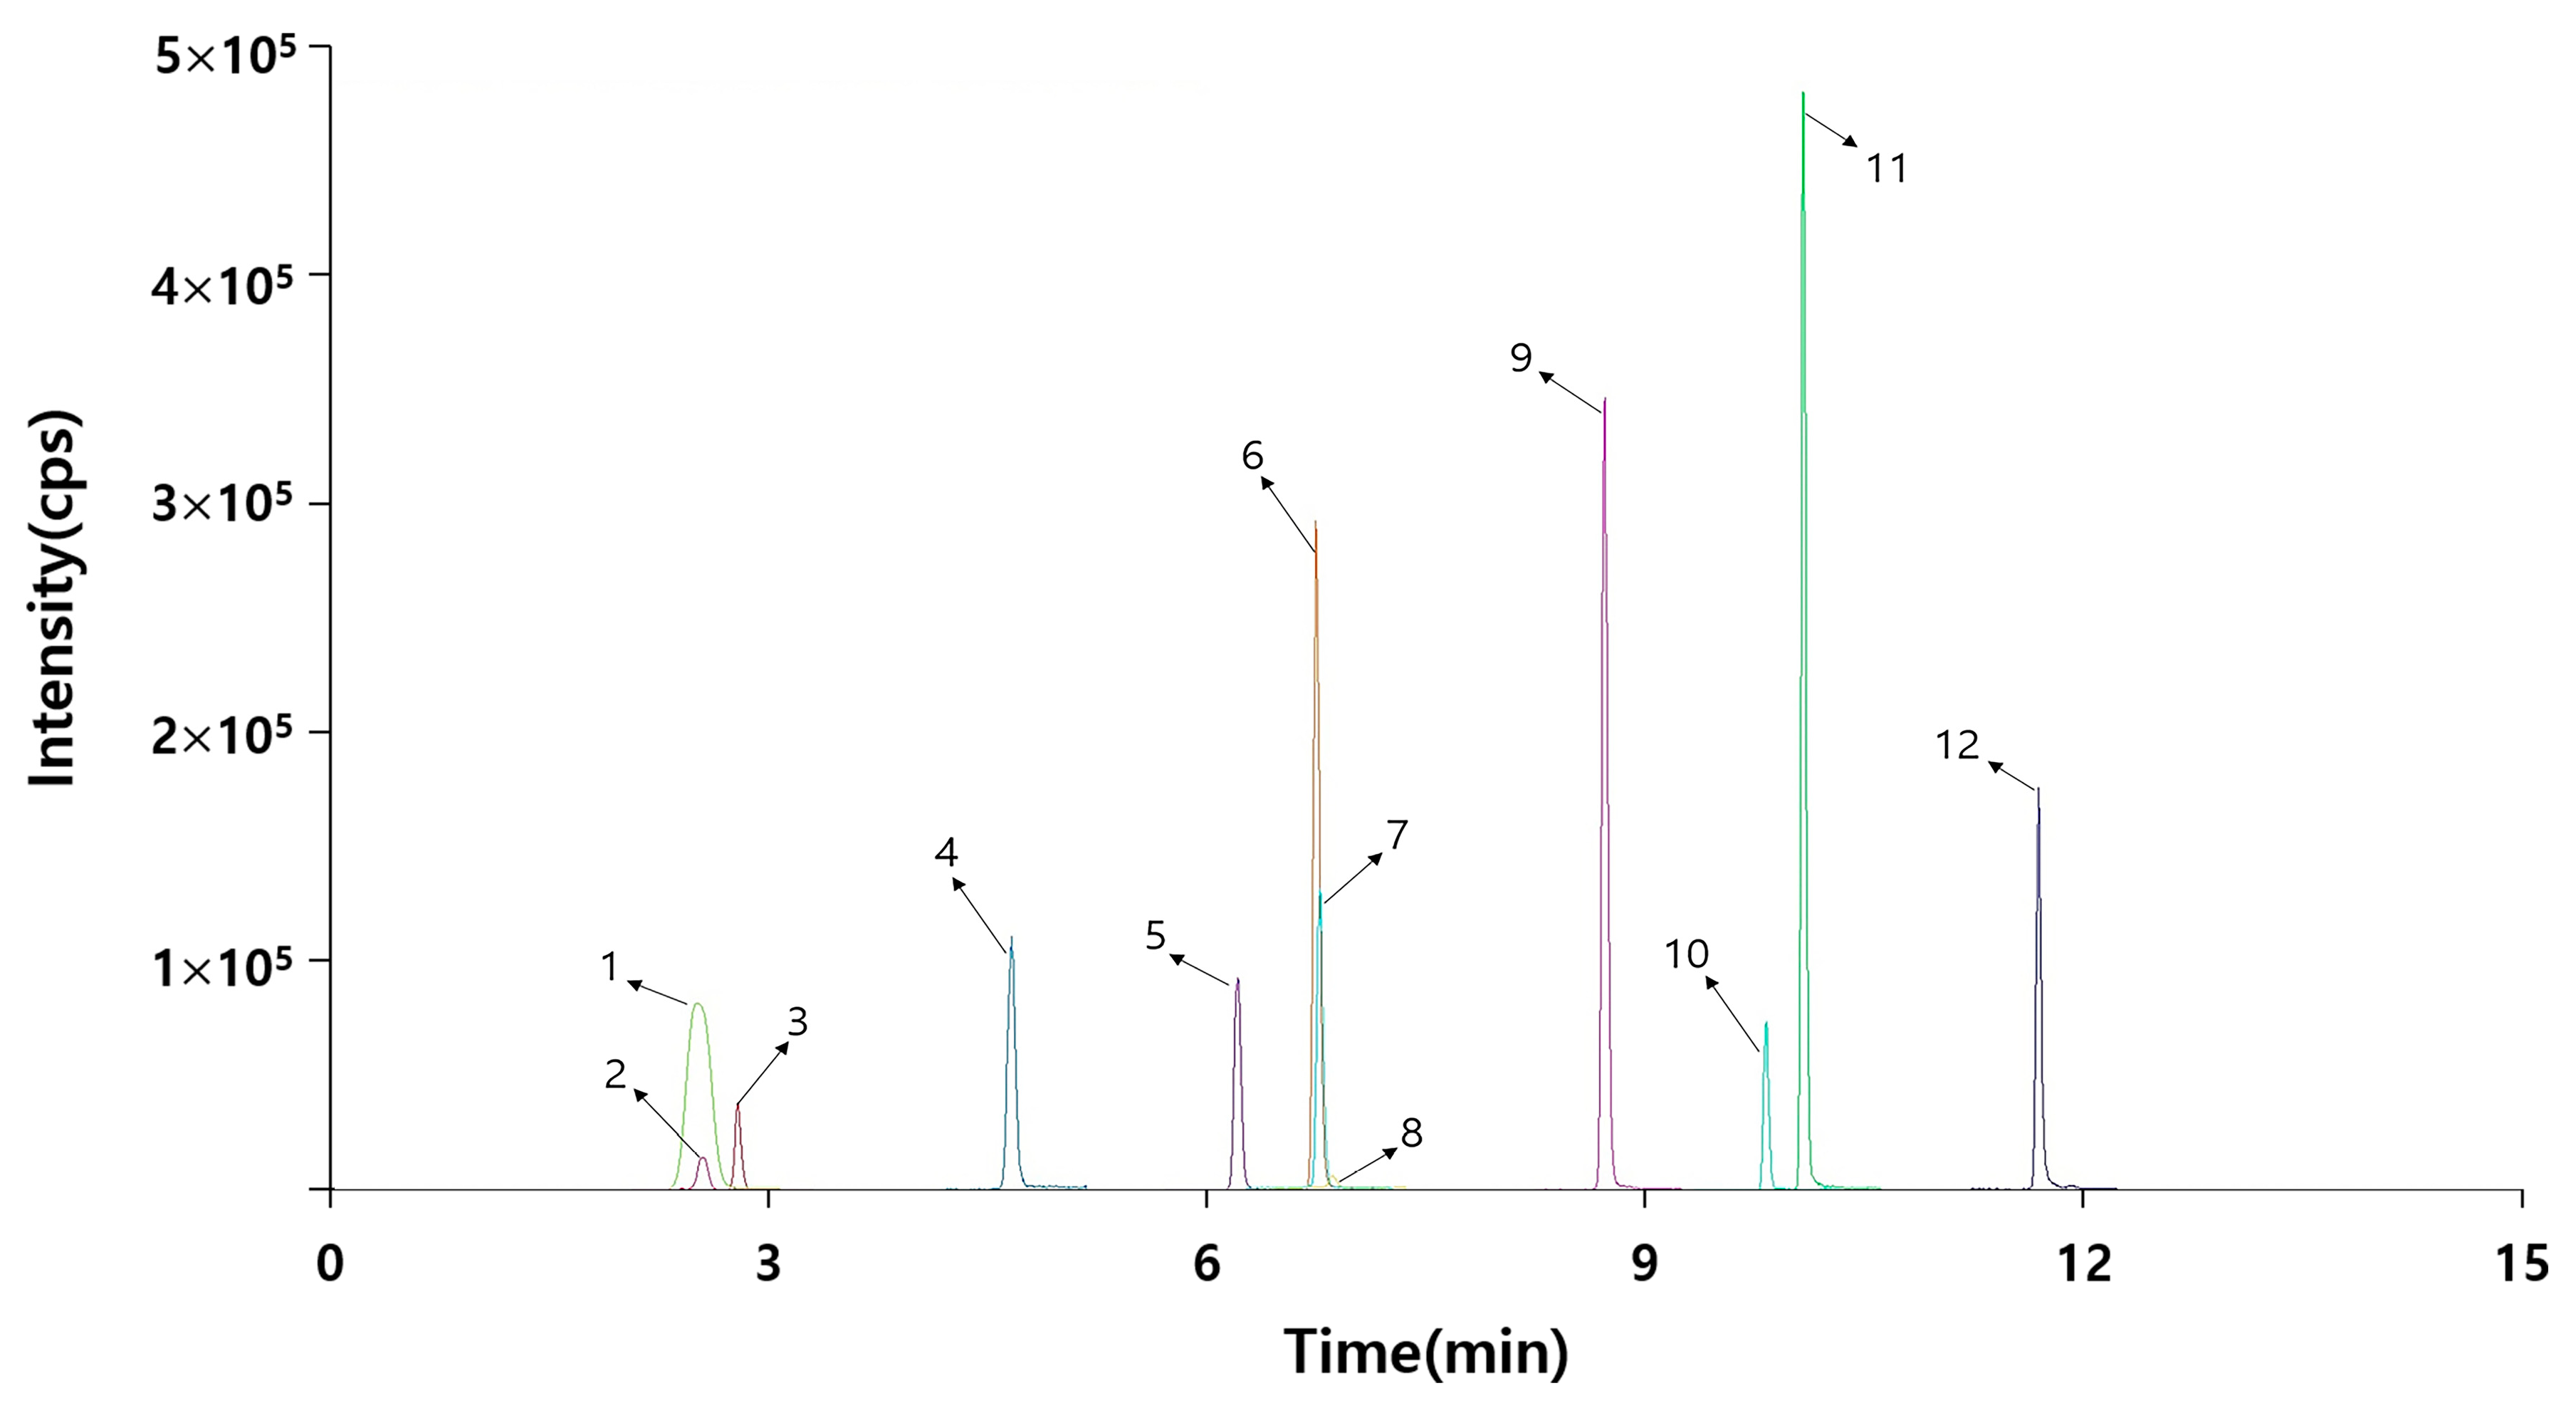
2.1. Simultaneous Multicomponent Analyses
2.2. Method Validation
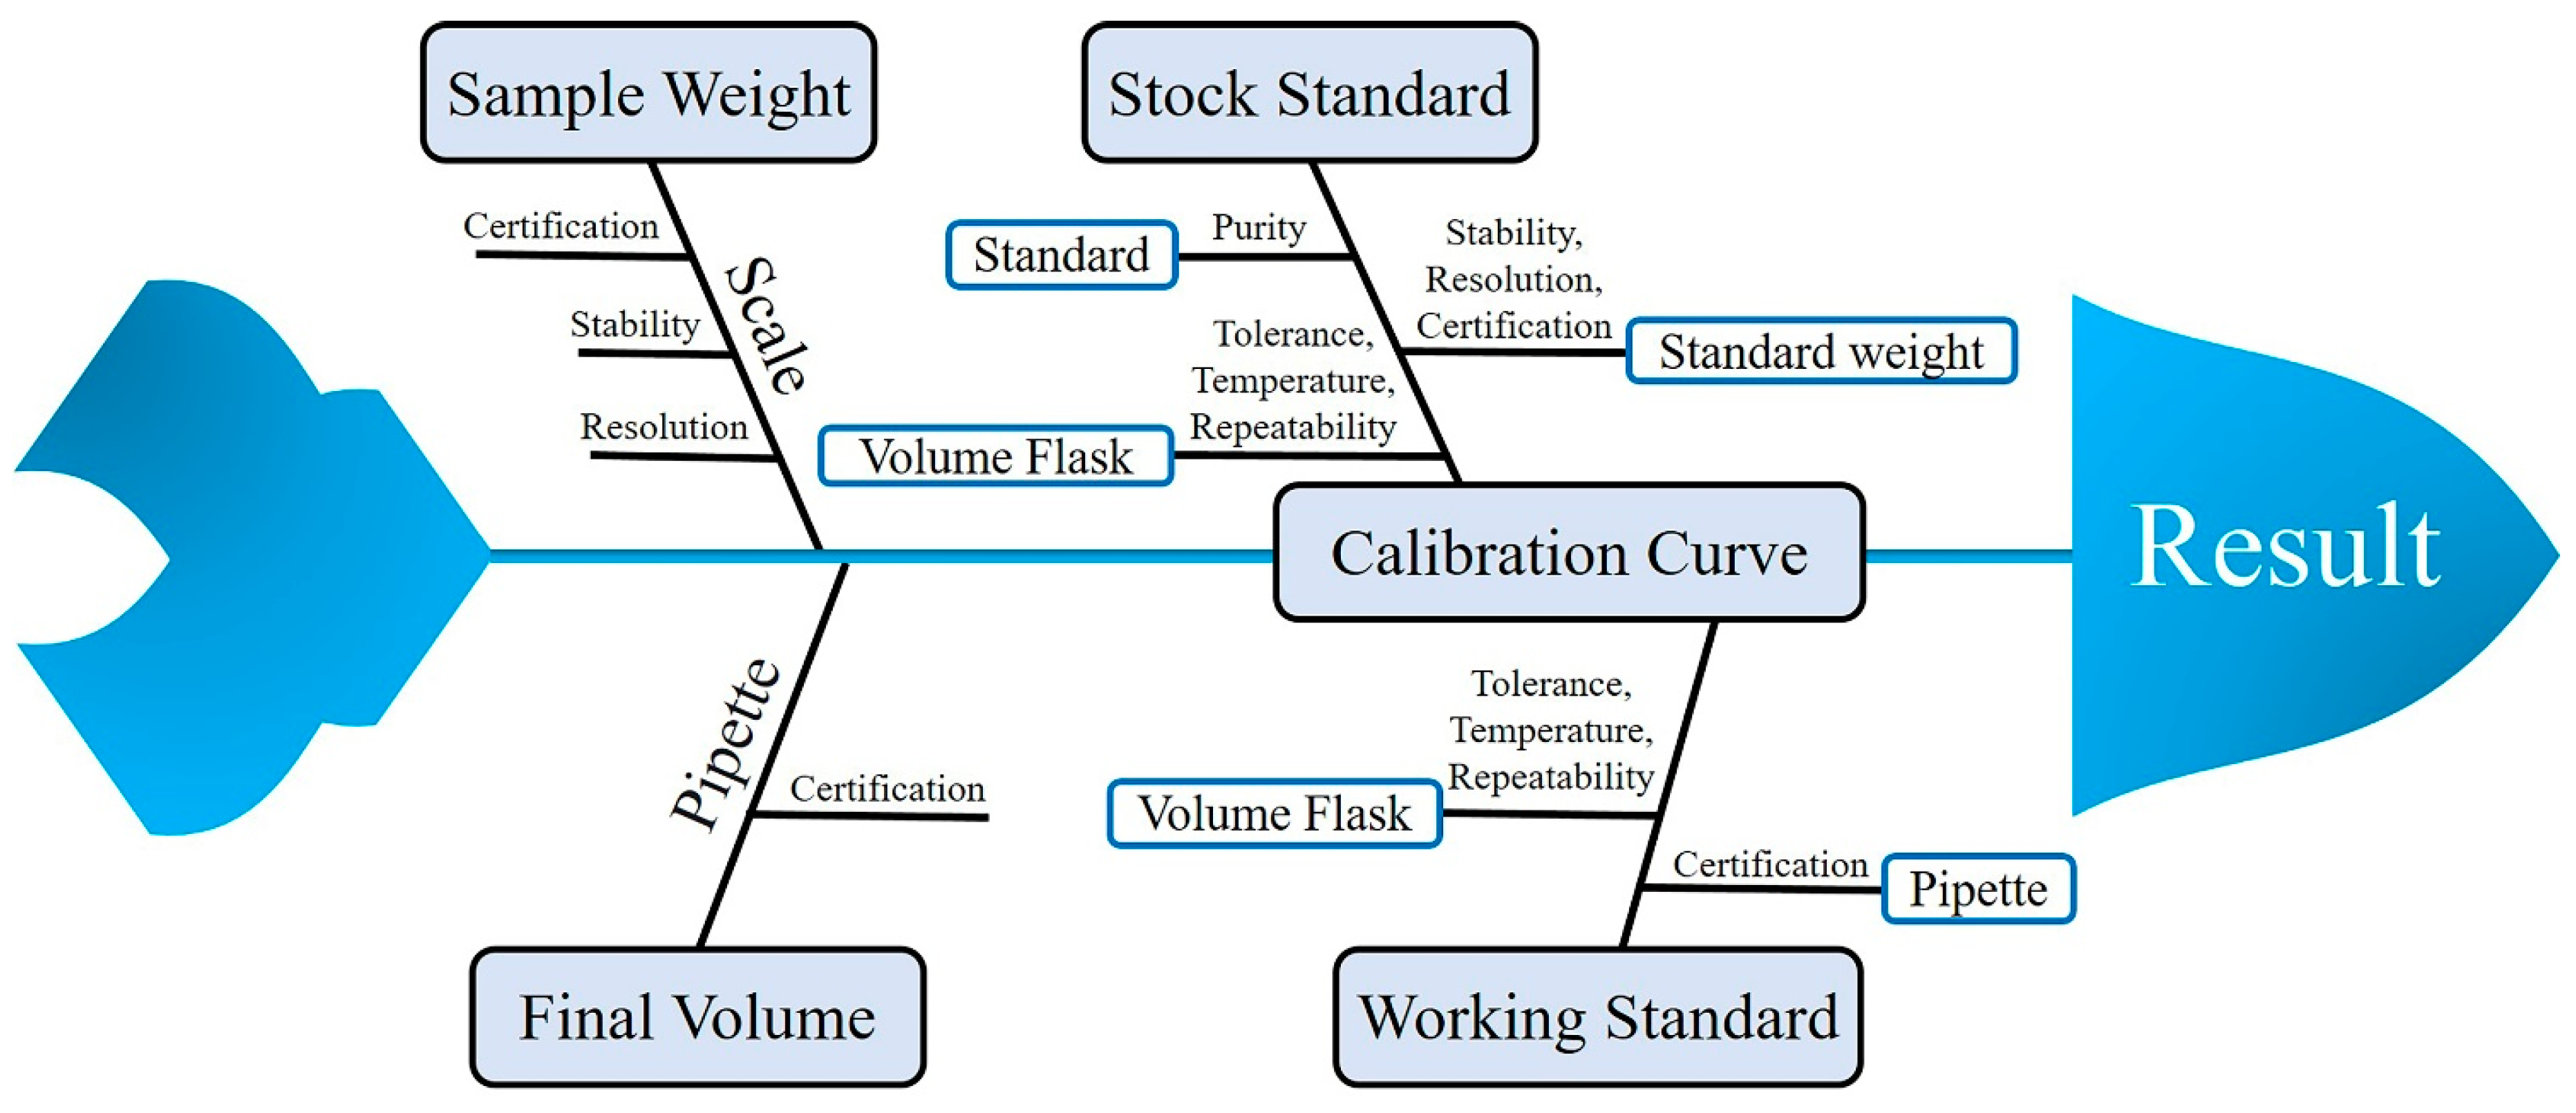
2.3. Measurement Uncertainty
2.4. Application of the Developed Method to Sweet Peppers
3. Materials and Methods
3.1. Chemicals and Reagents
3.2. Instrumentation and Conditions
3.3. Sample Preparation
3.4. Standard Sample Preparation and Method Validation
4. Conclusions
Supplementary Materials
Author Contributions
Funding
Institutional Review Board Statement
Informed Consent Statement
Data Availability Statement
Conflicts of Interest
Sample Availability
References
- Bhandari, G.; Zomer, P.; Atreya, K.; Mol, H.G.J.; Yang, X.; Geissen, V. Pesticide residues in Nepalese vegetables and potential health risks. Environ. Res. 2019, 172, 511–521. [Google Scholar] [CrossRef]
- El-Nahhal, I.; El-Nahhal, Y. Pesticide residues in drinking water, their potential risk to human health and removal options. J. Environ. Manag. 2021, 299, 113611. [Google Scholar] [CrossRef]
- Silva, V.; Mol, H.G.J.; Zomer, P.; Tienstra, M.; Ritsema, C.J.; Geissen, V. Pesticide Residues in European Agricultural Soils—A Hidden Reality Unfolded. Sci. Total Environ. 2019, 653, 1532–1545. [Google Scholar] [CrossRef]
- Narenderan, S.T.; Meyyanathan, S.N.; Babu, B. Review of pesticide residue analysis in fruits and vegetables. Pre-treatment, extraction and detection techniques. Food Res. Int. 2020, 133, 109141. [Google Scholar] [CrossRef] [PubMed]
- Kumari, D.; John, S. Health risk assessment of pesticide residues in fruits and vegetables from farms and markets of Western Indian Himalayan region. Chemosphere 2019, 224, 162–167. [Google Scholar] [CrossRef] [PubMed]
- Al-juhaimi, F.; Ghafoor, K.; Özcan, M.M.; Jahurul, M.H.A.; Babiker, E.E.; Jinap, S.; Sahena, F.; Sharifudin, M.S.; Zaidul, I.S.M. Effect of various food processing and handling methods on preservation of natural antioxidants in fruits and vegetables. J. Food Sci. Technol. 2018, 55, 3872–3880. [Google Scholar] [CrossRef] [PubMed]
- Rodrigues, C.A.; Nicácio, A.E.; Jardim, I.C.S.F.; Visentainer, J.V.; Maldaner, L. Determination of Phenolic Compounds in Red Sweet Pepper (Capsicum annuum L.) Using using aa Modified Modified QuEChERS QuEChERS Method Method and and UHPLC-MS/MS UHPLC-MS/MS Analysis Analysis and and Its Relation to Antioxidant Activity. J. Braz. Chem. Soc. 2019, 30, 1229–1240. [Google Scholar] [CrossRef]
- Kaur, R.; Kaur, K. Effect of Processing on Color, Rheology and Bioactive Compounds of Different Sweet Pepper Purees. Plant Foods Hum. Nutr. 2020, 75, 369–375. [Google Scholar] [CrossRef]
- Kaur, R.; Kaur, K.; Ahluwalia, P. Effect of drying temperatures and storage on chemical and bioactive attributes of dried tomato and sweet pepper. LWT 2020, 117, 108604. [Google Scholar] [CrossRef]
- da Costa Morais, E.H.; Collins, C.H.; Jardim, I.C.S.F. Pesticide determination in sweet peppers using QuEChERS and LC–MS/MS. Food Chem. 2018, 249, 77–83. [Google Scholar] [CrossRef]
- Al-Nasir, F.M.; Jiries, A.G.; Al-Rabadi, G.J.; Alu’datt, M.H.; Tranchant, C.C.; Al-Dalain, S.A.; Alrabadi, N.; Madanat, O.Y.; Al-Dmour, R.S. Determination of pesticide residues in selected citrus fruits and vegetables cultivated in the Jordan Valley. LWT 2020, 123, 109005. [Google Scholar] [CrossRef]
- Yigit, N.; Velioglu, Y.S. Effects of processing and storage on pesticide residues in foods. Crit. Rev. Food Sci. Nutr. 2020, 60, 3622–3641. [Google Scholar] [CrossRef] [PubMed]
- Medina-Pastor, P.; Triacchini, G. The 2018 european union report on pesticide residues in food. EFSA J. 2020, 18, e06057. [Google Scholar] [CrossRef] [PubMed] [Green Version]
- Sun, R.; Yang, W.; Li, Y.; Sun, C. Multi-residue analytical methods for pesticides in teas: A review. Eur. Food Res. Technol. 2021, 247, 1839–1858. [Google Scholar] [CrossRef]
- Azam, S.M.R.; Ma, H.; Xu, B.; Devi, S.; Siddique, M.A.B.; Stanley, S.L.; Bhandari, B.; Zhu, J. Efficacy of ultrasound treatment in the and removal of pesticide residues from fresh vegetables: A review. Trends Food Sci. Technol. 2020, 97, 417–432. [Google Scholar] [CrossRef]
- Kemmerich, M.; Rizzetti, T.M.; Martins, M.L.; Prestes, O.D.; Adaime, M.B.; Zanella, R. Optimization by Central Composite Design of a Modified QuEChERS Method for Extraction of Pesticide Multiresidue in Sweet Pepper and Analysis by Ultra-High-Performance Liquid Chromatography–Tandem Mass Spectrometry. Food Anal. Methods 2015, 8, 728–739. [Google Scholar] [CrossRef]
- AlSaikhan, W.H.; Almatroodi, S.A.; Almatroudi, A.; Alsahli, M.A.; Rahmani, A.H. Pesticide residue measurement in commonly used vegetables using the QuEChERS method. Pharmacogn. J. 2021, 13, 142–149. [Google Scholar] [CrossRef]
- Ferracane, A.; Zoccali, M.; Cacciola, F.; Salerno, T.M.G.; Tranchida, P.Q.; Mondello, L. Determination of multi-pesticide residues in vegetable products using a “reduced-scale” Quechers method and flow-modulated comprehensive two-dimensional gas chromatography-triple quadrupole mass spectrometry. J. Chromatogr. A 2021, 1645, 462126. [Google Scholar] [CrossRef]
- Nguyen, V.-T.; Tran, L.-H.; Van, T.-K.; Le, D.-V. Determination of Chlorpyrifos Pesticide Residue in Bell Peppers Grown in Dalat (Vietnam) by GC-MS/MS Using QuEChERS Extraction. J. Anal. Chem. 2022, 77, 604–610. [Google Scholar] [CrossRef]
- Saito-Shida, S.; Hamasaka, T.; Nemoto, S.; Akiyama, H. Multiresidue determination of pesticides in tea by liquid chromatography-high-resolution mass spectrometry: Comparison between Orbitrap and time-of-flight mass analyzers. Food Chem. 2018, 256, 140–148. [Google Scholar] [CrossRef]
- Diallo, T.; Makni, Y.; Lerebours, A.; Thomas, H.; Guérin, T.; Parinet, J. Development and validation according to the SANTE guidelines of a QuEChERS-UHPLC-QTOF-MS method for the screening of 204 pesticides in bivalves. Food Chem. 2022, 386, 132871. [Google Scholar] [CrossRef] [PubMed]
- Kottadiyil, D.; Mehta, T.; Thasale, R.; Sivaperumal, P. Determination and dietary risk assessment of 52 pesticide residues in vegetable and fruit samples by GC-MS/MS and UHPLC-QTOF/MS from Gujarat, India. J. Food Compos. Anal. 2023, 115, 104957. [Google Scholar] [CrossRef]
- Pedersen, M.; Hakme, E.; Ninga, E.; Frandsen, H.L. Analysis of veterinary drug- and pesticide residues in pig muscle by LC-QTOF-MS. Food Control 2023, 148, 109656. [Google Scholar] [CrossRef]
- Li, J.; Liu, H.; Mazhar, M.S.; Quddus, S.; Suleria, H.A.R. LC-ESI-QTOF-MS/MS profiling of phenolic compounds in Australian native plums and their potential antioxidant activities. Food Biosci. 2023, 52, 102331. [Google Scholar] [CrossRef]
- European Commission. Guidance Document on Analytical Quality Control and Method Validation Procedures for Pesticide Residues and Analysis in Food and Feed. Available online: https://www.eurl-pesticides.eu/userfiles/file/EurlALL/SANTE_11312_2021.pdf (accessed on 1 January 2022).
- EURACHEM. Quantifying Uncertainty in Analytical Measurement, 3rd ed.; EURACHEM: London, UK, 2012. [Google Scholar]
- ISO. Uncertainty of Measurement—Part 3: Guide to the Expression of Uncertainty in Measurement; GUM: 1995; ISO: Geneva, Switzerland, 2008. [Google Scholar]
- CODEX. Guidelines on Measurement Uncertainty; CAC/GL 54–2004; CODEX: Irvine, CA, USA, 2004. [Google Scholar]
- Kim, H.; Joo Baek, E.; Kim, Y.-K.; Park, H.; Hye Hur, S.; Kim, J.-E.; Jin Kim, H. Development of a method for analysis and risk assessment of residual pesticides in ginseng using liquid and gas chromatography-tandem mass spectrometry. Food Chem. 2023, 427, 136675. [Google Scholar] [CrossRef] [PubMed]


| Compound | Formula | Calculated m/z | Experimental m/z | Ionization Mode | Fragment Ion (m/z) | Mass Error (ppm) |
|---|---|---|---|---|---|---|
| Acequinocyl | C24H32O4 | 384.2295 | 407.2638 | [M + NH4]+ | 343.2288 | 0.3 |
| Boscalid | C18H12Cl2N2O | 342.0321 | 343.0399 | [M + H]+ | 307.0651 | 2.9 |
| Cyflumetofen | C24H24F3NO4 | 447.1615 | 465.1995 | [M + NH4]+ | 173.0222 | 0.9 |
| Dinotefuran | C7H14N4O3 | 202.1060 | 203.1138 | [M + H]+ | 129.0911 | −0.1 |
| Flonicamid | C9H6F3N3O | 229.0457 | 230.0535 | [M + H]+ | 203.0442 | 0.5 |
| Fluopyram | C16H11ClF6N2O | 396.0458 | 397.0536 | [M + H]+ | 173.0222 | −1.8 |
| Procymidone | C13H11Cl2NO2 | 283.0161 | 301.0505 | [M + NH4]+ | 284.0272 | 3.7 |
| Propamocarb | C9H20N2O2 | 188.1519 | 189.1597 | [M + H]+ | 102.0559 | −1.3 |
| Pyridaben | C19H25ClN2OS | 364.1370 | 365.1448 | [M + H]+ | 309.0840 | 0.7 |
| Spirodiclofen | C21H24Cl2O4 | 410.1046 | 411.1124 | [M + H]+ | 313.0398 | 0.2 |
| Spirotetramat | C21H27NO5 | 373.1883 | 374.1962 | [M + H]+ | 330.2078 | 0.1 |
| Spirotetramat-enol | C18H23NO3 | 301.1672 | 302.1750 | [M + H]+ | 216.1031 | −0.4 |
| Compound | r2 | Coefficient of Variation (%) | Recovery (%) | LOD a (µg/kg) | LOQ b (µg/kg) | ME (%) c | MU (%) d | ||||
|---|---|---|---|---|---|---|---|---|---|---|---|
| 10 µg/kg | 50 µg/kg | 100 µg/kg | 10 µg/kg | 50 µg/kg | 100 µg/kg | ||||||
| Acequinocyl | 0.99985 | 7.1 | 2.1 | 3.3 | 97.7 ± 0.7 | 97.8 ± 1.0 | 99.5 ± 3.3 | 3.2 | 9.7 | −13 | 9.1 |
| Boscalid | 0.99992 | 19.1 | 4.5 | 2.7 | 89.2 ± 1.7 | 98.2 ± 2.2 | 92.8 ± 2.5 | 2.1 | 6.3 | −7 | 12.1 |
| Cyflumetofen | 0.99962 | 5.4 | 1.8 | 1.4 | 97.0 ± 0.5 | 99.7 ± 0.9 | 90.1 ± 1.2 | 2.3 | 7.0 | 3 | 16.2 |
| Dinotefuran | 0.99951 | 16.3 | 7.7 | 5.9 | 92.3 ± 1.5 | 95.7 ± 3.7 | 87.7 ± 5.2 | 2.8 | 8.4 | 10 | 16.3 |
| Flonicamid | 0.99960 | 10.1 | 1.8 | 4.3 | 95.3 ± 1.0 | 98.9 ± 0.9 | 94.3 ± 4.0 | 2.2 | 6.6 | −1 | 15.2 |
| Fluopyram | 0.99958 | 19.0 | 3.7 | 1.8 | 94.7 ± 1.8 | 97.2 ± 1.8 | 89.5 ± 1.6 | 2.4 | 7.3 | 1 | 14.5 |
| Propamocarb | 0.99983 | 17.7 | 4.4 | 3.5 | 95.2 ± 1.7 | 98.4 ± 2.2 | 88.7 ± 3.1 | 2.1 | 6.2 | 1 | 11.2 |
| Procymidone | 0.99970 | 15.7 | 5.5 | 6.4 | 93.7 ± 1.5 | 98.0 ± 2.7 | 97.1 ± 6.2 | 2.9 | 8.7 | 7 | 12.8 |
| Pyridaben | 0.99996 | 15.1 | 4.2 | 3.2 | 92.6 ± 1.4 | 98.1 ± 2.1 | 92.4 ± 3.0 | 2.3 | 7.0 | −5 | 13.9 |
| Spirodiclofen | 0.99977 | 12.7 | 3.6 | 0.8 | 86.9 ± 1.1 | 96.1 ± 1.7 | 93.0 ± 0.8 | 2.5 | 7.6 | −5 | 18.6 |
| Spirotetramat | 0.99992 | 19.0 | 4.6 | 2.5 | 88.9 ± 1.7 | 97.6 ± 2.3 | 93.5 ± 2.3 | 3.0 | 9.0 | −9 | 13.5 |
| Spirotetramat-enol | 0.99993 | 19.1 | 6.2 | 2.0 | 87.5 ± 1.7 | 90.4 ± 2.8 | 81.7 ± 1.6 | 1.4 | 4.1 | −12 | 11.6 |
| Parameter | Value (xi) | Source | Type | Standard Uncertainty (u) | Combined Standard Uncertainty (uc) | Relative Standard Uncertainty (ur) | |
|---|---|---|---|---|---|---|---|
| Sample weight | 10.0335 | Balance | Certification | B | 0.000050 | 0.000078 | 0.000008 |
| Readability | A | 0.000029 | |||||
| Stability | A | 0.000052 | |||||
| Final volume | 10 | Pipette | Certification | B | 0.006500 | 0.006500 | 0.000650 |
| Source | Value (xi) | Standard Uncertainty (u) | 1st Combined Standard Uncertainty (uc) | 2nd Combined Standard Uncertainty (uc) | |
|---|---|---|---|---|---|
| Stock standard solution (100 mg/L) | Purity | 0.999 | 0.000577 | 0.696323 | |
| Balance | 0.01 | 0.000061 | |||
| Volumetric flask | 100 | 0.328927 | |||
| Working standard solution (1 mg/L) | Stock standard solution | 100 | 0.696323 | 0.007717 | |
| Pipette | 1 | 0.000500 | |||
| Volumetric flask | 100 | 0.328927 | |||
| Calibration curve concentration | Acequinocyl | 9.77 | 0.433570 | 0.433570 | 0.445305 |
| Boscalid | 8.92 | 0.530122 | 0.530122 | 0.538169 | |
| Cyflumetofen | 9.70 | 0.776454 | 0.776454 | 0.782973 | |
| Dinotefuran | 9.23 | 0.746118 | 0.746118 | 0.752261 | |
| Flonicamid | 9.53 | 0.710811 | 0.710811 | 0.717680 | |
| Fluopyram | 9.47 | 0.680736 | 0.680736 | 0.687816 | |
| Propamocarb | 9.52 | 0.519986 | 0.519986 | 0.529318 | |
| Procymidone | 9.37 | 0.591857 | 0.591857 | 0.599817 | |
| Pyridaben | 9.26 | 0.631509 | 0.631509 | 0.638802 | |
| Spirodiclofen | 8.69 | 0.799879 | 0.799879 | 0.804963 | |
| Spirotetramat | 8.89 | 0.590417 | 0.590417 | 0.597605 | |
| Spirotetramat-enol | 8.75 | 0.495735 | 0.495735 | 0.504009 | |
| Compounds | Uncertainty Factor | Standard Uncertainty (u) | Relative Standard Uncertainty (ur) | Relative Combined Standard Uncertainty (urc) | Combined Standard Uncertainty (uc) | Extended Uncertainty (U) | Measurement Uncertainty (Confidence Level about 95%, k = 2) |
|---|---|---|---|---|---|---|---|
| Acequinocyl | Sample weight | 0.000078 g | 0.000008 | 0.045583 | 0.444 μg/L | 0.888 μg/L | 9.74 ± 0.89 μg/L (9.1%) |
| Final volume | 0.006500 mL | 0.000650 | |||||
| Calibration curve | 0.445305 μg/L | 0.045579 | |||||
| Boscalid | Sample weight | 0.000078 g | 0.000008 | 0.060336 | 0.536 μg/L | 1.073 μg/L | 8.89 ± 1.08 μg/L (12.1%) |
| Final volume | 0.006500 mL | 0.000650 | |||||
| Calibration curve | 0.538169 μg/L | 0.060333 | |||||
| Cyflumetofen | Sample weight | 0.000078 g | 0.000008 | 0.080721 | 0.780 μg/L | 1.561 μg/L | 9.67 ± 1.57 μg/L (16.2%) |
| Final volume | 0.006500 mL | 0.000650 | |||||
| Calibration curve | 0.782973 μg/L | 0.080719 | |||||
| Dinotefuran | Sample weight | 0.000078 g | 0.000008 | 0.081504 | 0.750 μg/L | 1.500 μg/L | 9.20 ± 1.50 μg/L (16.3%) |
| Final volume | 0.006500 mL | 0.000650 | |||||
| Calibration curve | 0.752261 μg/L | 0.081502 | |||||
| Flonicamid | Sample weight | 0.000078 g | 0.000008 | 0.075310 | 0.715 μg/L | 1.431 μg/L | 9.50 ± 1.44 μg/L (15.2%) |
| Final volume | 0.006500 mL | 0.000650 | |||||
| Calibration curve | 0.717680 μg/L | 0.075307 | |||||
| Fluopyram | Sample weight | 0.000078 g | 0.000008 | 0.072634 | 0.686 μg/L | 1.371 μg/L | 9.54 ± 1.38 μg/L (14.5%) |
| Final volume | 0.006500 mL | 0.000650 | |||||
| Calibration curve | 0.687816 μg/L | 0.072631 | |||||
| Propamocarb | Sample weight | 0.000078 g | 0.000008 | 0.055604 | 0.528 μg/L | 1.055 μg/L | 9.49 ± 1.06 μg/L (11.2%) |
| Final volume | 0.006500 mL | 0.000650 | |||||
| Calibration curve | 0.529318 μg/L | 0.055601 | |||||
| Procymidnoe | Sample weight | 0.000078 g | 0.000008 | 0.064018 | 0.598 μg/L | 1.196 μg/L | 9.34 ± 1.20 μg/L (12.8%) |
| Final volume | 0.006500 mL | 0.000650 | |||||
| Calibration curve | 0.599817 μg/L | 0.064015 | |||||
| Pyridaben | Sample weight | 0.000078 g | 0.000008 | 0.068988 | 0.637 μg/L | 1.273 μg/L | 9.23 ± 1.28 μg/L (13.9%) |
| Final volume | 0.006500 mL | 0.000650 | |||||
| Calibration curve | 0.638802 μg/L | 0.068985 | |||||
| Spirodiclofen | Sample weight | 0.000078 g | 0.000008 | 0.092633 | 0.802 μg/L | 1.605 μg/L | 8.66 ± 1.61 μg/L (18.6%) |
| Final volume | 0.006500 mL | 0.000650 | |||||
| Calibration curve | 0.804963 μg/L | 0.092631 | |||||
| Spirotetramat | Sample weight | 0.000078 g | 0.000008 | 0.067225 | 0.596 μg/L | 1.191 μg/L | 8.86 ± 1.20 μg/L (13.5%) |
| Final volume | 0.006500 mL | 0.000650 | |||||
| Calibration curve | 0.597605 μg/L | 0.067222 | |||||
| Spirotetramat-enol | Sample weight | 0.000078 g | 0.000008 | 0.057605 | 0.502 μg/L | 1.005 μg/L | 8.72 ± 1.01 μg/L (11.6%) |
| Final volume | 0.006500 mL | 0.000650 | |||||
| Calibration curve | 0.504009 μg/L | 0.057601 |
| Pesticide Detection Concentration Range (mg/kg) | ||||||||||||
|---|---|---|---|---|---|---|---|---|---|---|---|---|
| Acequinocyl | Boscalid | Cyflumetofen | Dinotefuran | Flonicamid | Fluopyram | Procymidone | Propamocarb | Pyridaben | Spirodiclofen | Spirotetramat | Spirotetramat-Enol | |
| Gangseo | - | - | - | 0.012 | - | - | - | - | - | - | - | - |
| Geoje | - | 0.018–0.623 | - | - | - | - | - | - | 0.01 | - | - | - |
| Geochang | 0.047 | - | - | - | 0.056 | - | - | - | - | - | - | - |
| Goseong | - | 0.013–1.316 | 0.036–0.091 | 0.032–0.622 | 0.02–0.109 | 0.018–0.162 | - | 0.017–0.04 | 0.013–0.37 | - | 0.125–0.585 | - |
| Gimhae | 0.115–0.796 | 0.131–0.728 | - | 0.027–0.224 | 0.016–0.119 | - | - | - | 0.035–0.102 | - | 0.041–0.231 | - |
| Miryang | - | 0.016–0.3 | 0.501 | 0.019 | 0.036–0.119 | - | - | - | 0.048–0.166 | - | 0.016 | - |
| Sancheong | - | 0.154 | - | 0.093–0.278 | - | - | - | - | 0.052 | - | 0.848–1.626 | - |
| Uiryeong | - | 0.404 | 0.033 | 0.036–0.12 | 0.015–0.02 | - | - | - | 0.217–0.362 | - | 0.493 | - |
| Jinju | 0.015–0.035 | 0.011–0.885 | 0.27 | 0.012–1.335 | 0.017–0.485 | 0.024–0.306 | 0.02–0.041 | 0.012–0.028 | 0.029–0.118 | - | 0.032–1.041 | - |
| Changnyeong | 0.02–0.113 | 0.121–0.47 | - | 0.071–0.723 | 0.129 | - | - | 0.059 | 0.024–0.568 | - | 0.026–0.349 | - |
| Changwon | 0.018–0.393 | 0.048–0.755 | 0.16–0.309 | 0.013–1.24 | 0.012–0.056 | 0.087–0.227 | - | 0.01–0.02 | 0.013–0.964 | - | 0.017–1.236 | - |
| Tongyeong | - | - | - | 0.07–0.376 | 0.017 | - | - | 0.019–0.041 | 0.15–0.515 | - | - | - |
| Hadong | 0.163 | - | - | 0.01–0.187 | 0.012 | - | - | 0.078 | 0.32 | - | - | - |
| Haman | 0.021–0.072 | 0.03–0.733 | 0.208 | 0.035–0.513 | 0.01–0.167 | 0.153 | - | 0.019–0.04 | 0.01–0.198 | - | 0.021–0.471 | - |
| Hapcheon | - | 0.018 | - | - | - | - | - | - | - | - | 0.121–0.272 | - |
| 0.015–0.796 | 0.011–1.316 | 0.033–0.501 | 0.02–0.041 | 0.01–0.485 | 0.018–0.306 | 0.02–0.041 | 0.01–0.078 | 0.01–0.964 | - | 0.016–1.626 | - | |
| Mobile Phase A | 5 mM ammonium acetate & 0.1% formic acid in water | |||
| Mobile Phase B | 5 mM ammonium acetate & 0.1% formic acid in methanol | |||
| Gradient | Time (min) | A (%) | B (%) | Flow (mL/min) |
| Initial | 100 | 0 | 0.1 | |
| 0.2 | 100 | 0 | 0.1 | |
| 0.3 | 100 | 0 | 0.3 | |
| 0.5 | 50 | 50 | 0.3 | |
| 2.5 | 45 | 55 | 0.3 | |
| 5.5 | 25 | 75 | 0.3 | |
| 7.5 | 15 | 85 | 0.3 | |
| 8.3 | 0 | 100 | 0.3 | |
| 12.0 | 0 | 100 | 0.3 | |
| 12.1 | 100 | 0 | 0.3 | |
| 14.8 | 100 | 0 | 0.3 | |
| 14.9 | 100 | 0 | 0.1 | |
| 15.0 | 100 | 0 | 0.1 | |
| Injection volume | 10 μL | |||
| Column temperature | 40 °C | |||
| Ionization mode | Electrospray ionization mode (positive mode) | |||
| Source and gas parameters | Ion source gas 1–60 psi, curtain gas—30 psi, temperature—450 °C, ion source 2–40 psi, CAD gas—7 | |||
| QTOF, MS/MS | TOF start mass—100 Da, declustering potential—80 V, collision energy—10 V, TOF stop mass—1000 Da, DP spread—0 V, CE spread—0 V, accumulation time—0.25 s | |||
Disclaimer/Publisher’s Note: The statements, opinions and data contained in all publications are solely those of the individual author(s) and contributor(s) and not of MDPI and/or the editor(s). MDPI and/or the editor(s) disclaim responsibility for any injury to people or property resulting from any ideas, methods, instructions or products referred to in the content. |
© 2023 by the authors. Licensee MDPI, Basel, Switzerland. This article is an open access article distributed under the terms and conditions of the Creative Commons Attribution (CC BY) license (https://creativecommons.org/licenses/by/4.0/).
Share and Cite
Bang, H.Y.; Kim, Y.-K.; Kim, H.; Baek, E.J.; Na, T.; Sim, K.S.; Kim, H.J. Ultra-High-Performance Liquid Chromatography Quadrupole Time-of-Flight Mass Spectrometry for Simultaneous Pesticide Analysis and Method Validation in Sweet Pepper. Molecules 2023, 28, 5589. https://doi.org/10.3390/molecules28145589
Bang HY, Kim Y-K, Kim H, Baek EJ, Na T, Sim KS, Kim HJ. Ultra-High-Performance Liquid Chromatography Quadrupole Time-of-Flight Mass Spectrometry for Simultaneous Pesticide Analysis and Method Validation in Sweet Pepper. Molecules. 2023; 28(14):5589. https://doi.org/10.3390/molecules28145589
Chicago/Turabian StyleBang, Han Yeol, Yong-Kyoung Kim, Hyoyoung Kim, Eun Joo Baek, Taewoong Na, Kyu Sang Sim, and Ho Jin Kim. 2023. "Ultra-High-Performance Liquid Chromatography Quadrupole Time-of-Flight Mass Spectrometry for Simultaneous Pesticide Analysis and Method Validation in Sweet Pepper" Molecules 28, no. 14: 5589. https://doi.org/10.3390/molecules28145589